bluegrass area development district in association with ... · final draft report for the water...
TRANSCRIPT

FFiinnaall DDrraafftt RReeppoorrttfor the
WATER SYSTEM REGIONALIZATIONFEASIBILITY STUDY
PPrreeppaarreedd ffoorr::
BBLLUUEEGGRRAASSSS AARREEAADDEEVVEELLOOPPMMEENNTT DDIISSTTRRIICCTT
iinn aassssoocciiaattiioonn wwiitthh tthhee
BBlluueeggrraassss WWaatteerr SSuuppppllyy CCoonnssoorrttiiuumm
JJaannuuaarryy 77,, 22000044
PPrreeppaarreedd bbyy::
Water System Regionalization Feasibility Study
Final Draft ReportJanuary 7, 2004 TOC-1
CONTENTS
EXECUTIVE SUMMARY .......................................................................................................................................1
INTRODUCTION ........................................................................................................................................................1WHAT ARE BWSC�S STUDY OBJECTIVES? ...............................................................................................................1HOW MUCH WATER IS NEEDED? ...............................................................................................................................2HOW WERE WATER SUPPLY ALTERNATIVES EVALUATED AND WHICH IS PREFERRED? ..............................................2HOW WILL THE SUPPLIES BE DELIVERED TO THE WATER UTILITIES?.........................................................................4WHAT WILL IT COST AND HOW WILL IT BE FINANCED?.............................................................................................4WHO WILL OWN AND MANAGE THE PROPOSED WATER FACILITIES? .........................................................................5HOW HAS THE PUBLIC PARTICIPATED IN THE STUDY PROCESS? ................................................................................5HAVE THE OBJECTIVES OF THE STUDY BEEN MET? ...................................................................................................6WHAT ARE THE NEXT STEPS? ...................................................................................................................................6
1. INTRODUCTION ................................................................................................................................................7
1.1. BACKGROUND .................................................................................................................................................71.2. BWSC�S STUDY OBJECTIVES ...........................................................................................................................8
2. NEED FOR ADDITIONAL WATER SUPPLIES ...........................................................................................10
2.1. WATER DEMANDS..........................................................................................................................................102.1.1. Average and maximum day demands ....................................................................................................102.1.2. Aggregate maximum day.......................................................................................................................11
2.2. EXISTING WATER SUPPLY SOURCES................................................................................................................122.3. PROJECTED SHORTFALL IN SUPPLY ................................................................................................................142.4. USE OF BASELINE ALTERNATIVES TO REDUCE PROJECTED SHORTFALL ...........................................................14
2.4.1 Water Credits ..........................................................................................................................................152.4.2. Dam 10...................................................................................................................................................16
3. WATER SUPPLY ALTERNATIVES ..............................................................................................................17
3.1. EVALUATION CRITERIA AND WEIGHTING .......................................................................................................173.2. FATAL FLAWS................................................................................................................................................183.4. PREFERRED ALTERNATIVES ...........................................................................................................................193.5. KENTUCKY RIVER POOL NO. 3 ALTERNATIVE ...............................................................................................203.6. COST ANALYSIS .............................................................................................................................................21
4. WATER SYSTEM GRID NETWORK ............................................................................................................25
4.1. NETWORK CONFIGURATION AND SIZING ........................................................................................................254.2. GRID WATER QUALITY ...................................................................................................................................264.3. SUMMARY OF GRID BENEFITS.........................................................................................................................28
5. FINANCIAL........................................................................................................................................................29
5.1. FINANCIAL BENEFITS OF A REGIONAL WATER SUPPLY....................................................................................295.2. FUNDING NEW WATER SUPPLY FACILITIES .....................................................................................................305.3. REVENUE REQUIREMENTS NEEDED TO PAY CAPITAL AND OPERATING COSTS .................................................315.4. FINANCIAL IMPACTS ON WATER RATES AND CUSTOMER BILLS.......................................................................32
6. OWNERSHIP AND MANAGEMENT OF WATER FACILITIES...............................................................35
6.1. EVALUATION OF ORGANIZATION ALTERNATIVES ...........................................................................................356.2. REGIONAL WATER COMMISSIONS .................................................................................................................37
6.2.1. Characteristics of a Regional Water Commission.................................................................................37

Water System Regionalization Feasibility Study
Final Draft ReportJanuary 7, 2004 TOC-2
6.2.2. Selection of the Commissioners and voting privileges ..........................................................................376.2.3. Financing and revenue..........................................................................................................................38
7. PUBLIC PARTICIPATION..............................................................................................................................39
7.1. PUBLIC WORKSHOPS AND MEETINGS..............................................................................................................397.2. NEWSLETTERS/MAILERS/E-MAIL....................................................................................................................407.3. AGENCY BRIEFINGS AND TECHNICAL MEETINGS ............................................................................................407.4. EXTENSIVE PRESS COVERAGE ........................................................................................................................407.5. ELECTED OFFICIAL, COUNCIL, COMMISSION AND BOARD UPDATES. ............................................................40
8. CONCLUSIONS.................................................................................................................................................42
9. NEXT STEPS......................................................................................................................................................43
10. BIBLIOGRAPHY.............................................................................................................................................44
Appendices
Appendix A � Water DemandsAppendix B � Water Demand Peaking AnalysisAppendix C � Kentucky River Withdrawal PermitsAppendix D � Kentucky River Dam No. 10 InformationAppendix E � Weighting Factors for Alternative Scoring and Pairwise ComparisonAppendix F � Fatally-flawed Alternatives and Near-term/long-term ClassificationAppendix G � Historic Water Supply Plans of the Kentucky River BasinAppendix H � Alternative Screening ResultsAppendix I � Request for Proposal from Water SuppliersAppendix J � Kentucky Division of Water�s Letter on Kentucky River Pool No. 3Appendix K � Water Supply Alternative Cost SpreadsheetsAppendix L � Water Supply Alternative Pairwise ResultsAppendix M � Roll Call Vote on Endorsement of Kentucky River Pool No. 3Appendix N � Grid Hydraulic NetworkAppendix O � Grid Network Water Quality Memorandum Appendix P � BWSC�s Letter of Intent to BuyAppendix Q � Benchmarking Study for Regional Water Supply OrganizationsAppendix R � Evaluation of Regional Water Commission versus Chapter 58Appendix S � Information on Regional Water CommissionsAppendix T � Workshops 1-6Appendix U � Meeting Minutes for June 9, 2003 (Conference with State and Federal Policy andProgram Staff, Frankfort, KY)Appendix V � Meeting Minutes for August 21, 2003 (Briefing for Elected Officials inLexington, KY and State Agencies Briefing in Frankfort, KY)Appendix W � News ArticlesAppendix X � Public MeetingsAppendix Y � Public Comments on Final Report
Tables

Water System Regionalization Feasibility Study
Final Draft ReportJanuary 7, 2004 TOC-3
Table 1. Water demands ............................................................................................................... 11Table 2. Water supplies and treatment plant capacities ................................................................ 13Table 3. Estimated project costs and present worth costs for water supply alternatives .............. 22Table 4. Public workshops............................................................................................................ 39
Figures
Figure 1. Water supply alternatives selection process ...................................... following page 17Figure 2. Grid components ............................................................................... following page 25Figure 3. Disinfection technique for BWSC participants ................................. following page 27

Water System Regionalization Feasibility Study
Final Draft ReportJanuary 7, 2004 TOC-4
Glossary of Terms
BGADD Bluegrass Area Development DistrictBWSC Bluegrass Water Supply ConsortiumCIP Capital Improvements ProgramCWA Clean Water ActD/DBP Disinfectants/Disinfection ByproductsEA Environmental AssessmentEIS Environmental Impact StatementEPA US Environmental Protection Agencyfps Feet per secondFY Fiscal Yeargpm Gallons per MinuteHAAs Haloacetic AcidsICR Information Collection RuleIESWTR Interim Enhanced Surface Water Treatment RuleKDEP Kentucky Department of Environmental ProtectionKDOW Kentucky Division of WaterKIA Kentucky Infrastructure AuthorityKNREPC Kentucky Natural Resources Environmental Protection CabinetKRA Kentucky River AuthorityKAW Kentucky American Water L LiterMCL Maximum Contaminant LevelMG Million Gallonsmg/l Milligrams per Litermgd Million Gallons per DayMPN/100 ml Most Probable Number per 100 millilitersNEPA National Environmental Policy ActPSC Kentucky Public Service Commissionpsi Pounds per Square InchRD Rural DevelopmentSDWA Safe Drinking Water ActSRF State Revolving FundSWTR Surface Water Treatment RuleTCR Total Coliform RuleTHMs Trihalomethanesug/L Micrograms per LiterUK University of KentuckyUSACE US Army Corps of EngineersUSDA US Department of AgricultureUSEDA US Economic Development AdministrationUSEPA US Environmental Protection AgencyUSFWS US Fish & Wildlife ServiceUSGS US Geological SurveyWTP Water Treatment Plant
Water System Regionalization Feasibility Study
Final Draft ReportJanuary 7, 2004 TOC-5
WWTP Wastewater Treatment Plant7Q10 Seven-day ten-year flow

Water System Regionalization Feasibility Study
Final Draft ReportJanuary 7, 2004 TOC-6
Acknowledgements
The BWSC acknowledges the following individuals and organizations for their significantcontributions to this effort:
Congressman Ernie Fletcher
Shawn Dyer, Congressman Ernie Fletcher�s Staff
Bill Lambdin, Senator Jim Bunning�s Staff
Kevin Atkins, Senator Mitch McConnell�s Staff
Henry C. List, Secretary KNREPC
Bob Logan, KNREPC
Jeff Pratt, KDOW
Stephen Reeder, KRA
Dr. Don Haney, KRA
Vernon Brown, USDA�s RD
Bob Hunter, USEDA
Ventra Mapp, KY Department for Local Government
Jeff Hanna, KY Department for Local Government
Roger Recktenwald, KIA
Vicki Pettus, KIA
Bill Caldwell, KDOW
Vicki Ray, KDOW
Leon Smothers, KDOW
Julie Roney, KDOW
Dr. Lindell Ormsbee, UK WWRI
Malissa McAlister, UK WWRI
Jim Kipp, KY Geological Survey
Mike Unthank, USGS
Mark Ayers, Chief USGS Kentucky District
William Barron, USACE
Neill Tyler, USACE
Cincinnati Water Works

Water System Regionalization Feasibility Study
Final Draft ReportJanuary 7, 2004 TOC-7
Louisville Water Company
Northern Kentucky Water District
Carrollton Utilities/Carroll County Water District No. 1
Greater Fleming County Regional Water Commission
BWSC Participating Utilities
Berea College Utilities
City of Cynthiana
City of Danville
Frankfort Electric and Water Plant Board
Georgetown Municipal Water and Sewer Service
City of Harrodsburg
Kentucky American Water
City of Lancaster
City of Lawrenceburg
Lexington-Fayette Urban County Government
Mt. Sterling Water and Sewer Commission
Nicholasville Combined Utilities
City of Paris
Richmond Water, Gas, & Sewerage
Shelbyville Municipal Water and Sewer Commission
City of Versailles
City of Wilmore
Winchester Municipal Utilities Commission
BWSC Technical Group
J.H. Bunk Sullivan, Frankfort Electric and Water Plant Board
Bob Riddle, Georgetown Municipal Water and Sewer Service
Linda Bridwell, Kentucky American Water
Wayne Waddell and Paul Schoninger, Lexington-Fayette Urban County Government

Water System Regionalization Feasibility Study
Final Draft ReportJanuary 7, 2004 TOC-8
Tom Calkins, Nicholasville Combined Utilities
Vernon Azevedo, Winchester Municipal Utilities Commission
Don Hassall, Bluegrass Area Development District
Mary Jane Warner, Facilitator
Consultant Team
George Rest, O�Brien & Gere
Thomas Dumm, O�Brien & Gere
Tim Kraus, O�Brien & Gere
John Steinmetz, CDP Engineers
Edward Donahue, Municipal & Financial Services Group
Damon Talley, P.S.C.

Water System Regionalization Feasibility Study
Final Draft ReportJanuary 7, 2004 1
Executive Summary
Introduction
A severe drought affected much of thesoutheastern United States in 1999, and water usewas curtailed in numerous parts of centralKentucky. For the past four years, the BluegrassWater Supply Consortium (BWSC), an alliance ofgovernment agencies and water utilities � bothpublic and private - have been working together toaddress the potable (treated) water needs ofcentral Kentucky. The entities involved include(listed alphabetically):
• Berea College Utilities • City of Cynthiana • City of Danville• Frankfort Electric and Water Plant
Board • Georgetown Municipal Water and
Sewer Service • City of Harrodsburg • Kentucky American Water • City of Lancaster • City of Lawrenceburg • Lexington-Fayette Urban County
Government • Mt. Sterling Water and Sewer
Commission• Nicholasville Combined Utilities • City of Paris• Richmond Water, Gas, & Sewerage • Shelbyville Municipal Water and Sewer
Commission • City of Versailles • City of Wilmore • Winchester Municipal Utilities
Commission
BWSC has been working with numerous local,state and federal agencies, including the KentuckyRiver Authority (KRA), Kentucky Division ofWater (KDOW), Kentucky InfrastructureAuthority (KIA), Kentucky Public Service
Commission (PSC), and the Bluegrass AreaDevelopment District (BGADD) to study andaddress the region�s need for additional potablewater.
The study was financed by Congressional fundingtogether with matching funds from KIA andBWSC�s contributions. A consulting team withexpertise in engineering, finance, managementand law was retained by BWSC to complete anindependent and comprehensive regional study. The study builds upon previous and on-goingefforts to meet the region�s potable water supplyneeds.
BWSC's mission statement is:
"The Bluegrass Water Supply Consortiumwill ensure the delivery of an adequatesupply of potable water under anyconditions to the customers of memberentities. We will maximize the utilization ofthe Kentucky River as a raw water source,maintain reasonable rates, and provideadequate water quality."
What are BWSC�s study objectives?
The key objectives for BWSC�s study include:
• Optimizing regional water supplies usinga grid network of water pipelines to movepotable water to where it is needed.
• Bringing �on line� highly reliable sourcesof additional water supply within 3 to 5years.
• Developing a financial plan that isaffordable and fairly apportions costs.
• Implementing a management/ownershipapproach that is fair and flexible.
• Utilizing a comprehensive program ofpublic participation and outreach toeffectively communicate the studyprocess and findings.

Water System Regionalization Feasibility Study
Final Draft ReportJanuary 7, 2004 2
How much water is needed?
BWSC�s approach in the current study is toidentify new potable water supplies that augmentthe existing potable water supplies of BWSC. Water demands for each participating utility wereprojected through 2020 and reflected waterconservation and drought management efforts. Supplies available from existing sources werebased on permitted water supply withdrawals fromthe Kentucky River and other sources duringnormal and severe drought conditions. Based onprojected water demands and existing potablewater supplies, a total of 67 million gallons perday (mgd) of additional potable water is neededduring a critical drought to meet the needs ofBWSC through 2020. Roughly two-thirds of thisdeficit exists today and the remaining one-thirdwill result from projected future growth in theregion. The potable water supply target for thisstudy in 2020 is 67 mgd with an additionalprojected supply deficit of approximately 2 mgdeach year beyond 2020.
How were water supply alternativesevaluated and which is preferred?
The potable water supply needed to meet BWSCwater demands in 2020 was reduced from 67 mgdto 45 mgd by taking into account the anticipatedincrease in near-term water supplies from theKentucky River (baseline alternatives). Baselinealternatives included estimated water credits forreturn flows to the Kentucky River (12 mgd) andadditional storage provided by constructing ahigher Kentucky River Lock and Dam No. 10 (10mgd). The higher Lock and Dam No. 10 iscurrently under design by KRA and has receivedcongressional authorization for funding throughthe US Army Corps of Engineers.
The selection process for identifying the preferredwater supply alternative included the followingsteps:
• Establishing evaluation criteria
• Determining fatal flaws and weightingfactors
• Identifying alternatives• Eliminating fatally-flawed alternatives• Screening alternatives• Selecting alternatives
The water supply alternatives were evaluatedusing the following criteria, which weredeveloped and adopted by BWSC early in thestudy process:
• Water supply capacity - Reliable quantityof raw water and finished water to meetprojected demands through the planningperiod. This criteria addressesinterruptibility of sources of supply.
• Water quality - Raw and finished waterquality that meets existing water qualityrequirements, and can readily achievefuture anticipated regulations. Thiscriteria also addresses water qualitypreferences such as taste.
• Cost - The present worth cost forproposed raw and finished waterimprovements, including capital,operating and maintenance costs.
• Implementability/risk of delay - Therelative ease of implementing theproposed improvements in time to meetprojected demands, which BWSCestablished as 3 to 5 years. This criterionconsiders the potential that regulatorypermitting, public acceptance, propertyacquisition, or constructability issuescould delay implementation.
• Flexibility - The ability to phaseimplementation and spread the cost overtime, while still meeting projected waterdemands. This criterion addresses abilityto expand beyond the planning period andthe entrance/exit of BWSC members.
Because of the magnitude of the projected watersupply deficit, water supply alternatives that couldnot provide at least 10 mgd were consideredfatally flawed and were eliminated from further

Water System Regionalization Feasibility Study
Final Draft ReportJanuary 7, 2004 3
consideration.
Over 40 unique water supply alternatives wereidentified based on a review of previous studiesand work performed in this study:
• Ohio River � seven options• Kentucky River � eight options• Existing reservoirs � seven options• New reservoirs � twelve options• Groundwater � six options
The list of 40 water supply alternatives wasseparated into near-term and long-term groupsbased on the alternative's potential to beimplemented within 3 to 5 years. A total of 16near-term alternatives were carried forward forfurther evaluation and eight alternatives weredeemed "preferred", and were selected for furtherevaluation:
• Purchase treated water from CincinnatiWater Works via Boone FlorenceRegional Water Commission.
• Purchase treated water from CincinnatiWater Works via Bracken County.
• Purchase treated water from LouisvilleWater Company.
• Purchase treated water from CarrolltonUtilities/Carroll County Water DistrictNo. 1.
• Purchase treated water from GreaterFleming County Regional WaterCommission.
• Ohio River water withdrawal and newwater treatment plant at Maysville/Dover.
• Ohio River withdrawal and new watertreatment plant at Warsaw.
• Kentucky River withdrawal and newwater treatment plant at Kentucky RiverPool No. 3, with supplemental raw waterfrom the Ohio River.
BWSC conducted a pairwise comparison process,which ranks each alternative against the otheralternatives for each evaluation criteria. Theranking showed that three alternatives were
superior to the others:
• Treated water purchase from LouisvilleWater Company,
• Ohio River water withdrawal and newwater treatment plant at Maysville/Doveror Warsaw,
• Kentucky River withdrawal and newwater treatment plant at Kentucky RiverPool No. 3 with supplemental raw waterfrom the Ohio River.
Cost estimates were then updated to reflect a newproposal from Louisville Water Company, andother refinements. While purchasing water fromthe Louisville Water Company was found to bethe lowest cost alternative, the Consultant Teamrecommended the Kentucky River Pool No. 3alternative based on its highest overall score. Thescoring for Pool No. 3 was driven by first placerankings in implementability, flexibility, andwater quality, and second-place ranking in cost. The waterworks facilities included in theKentucky River Pool No. 3 alternative are:
• Raw water intake and pumping station atKentucky River Pool No. 3.
• Raw water pipeline from the KentuckyRiver Pool No. 3 intake and pumpingstation to the new water treatment plant.
• Water treatment plant near KentuckyRiver Pool No. 3.
• Raw water intake and pumping station atOhio River.
• Raw water pipeline from Ohio Riverintake and pumping station to the newwater treatment plant at Kentucky RiverPool No. 3.
• Treated water transmission mains fromthe new water treatment plant nearKentucky River Pool No. 3 to the gridnetwork.
• Treated water transmission mainscomprising the grid network.

Water System Regionalization Feasibility Study
Final Draft ReportJanuary 7, 2004 4
How will the supplies be delivered to thewater utilities?
BWSC is proposing to construct a grid network ofwaterlines across Central Kentucky to connect thewater systems of the participating water utilities.BWSC plans to move treated water through thegrid from points of availability to points of need --wheeling. A conceptual layout and cost of thepiping system was developed for each of the eightwater supply alternatives. Pipeline sizing for thegrid network was based on a hydraulic model thatwas developed by obtaining the major piping forthe existing BWSC water systems, along withwater demands representing each community�streatment or supply deficit. Based on theadequacy of the existing major piping, additionalconnecting pipelines and pumping stations wereadded to convey the water to where it is needed.
The grid network provides immediate and long-term benefits:
• Peak day attenuation. Water systemfacilities are typically sized to provide thepeak day demand. Because BWSCutilities are not likely to have their peakwater demands all occur on the same day,the size and cost of treatment plants,pumping stations and pipelines can bereduced.
• Optimize use of existing sources. Thegrid provides the network of pipingneeded to deliver water from existingsources to where it is needed.
• Grant funding. The possibility for grantfunding is enhanced by the regionalapproach afforded by the grid system.
• Economy of scale. A single largeadditional source of supply will provideeconomy of scale in comparison toconstruction and operation of new, smallsupply projects by each of BWSC�sparticipants.
• Reliability of multiple sources. The gridnetwork allows water from multiple
sources to be fed into the grid therebyminimizing the potential for a watersupply interruption due to a chemical spillor facility outage.
• Ease of phasing regional growth. Thegrid network provides flexibility inaccommodating changes in growth areasas well as connections to utilities beyondBWSC.
What will it cost and how will it befinanced?
The cost for building and operating the facilitiesneeded to produce and deliver additional water tothe region will be finalized when more specificcommitments are made by the participatingutilities as to the quantities of water they willpurchase.
Each utility purchasing water from the grid willcommit to a portion of the capacity of the newfacilities. The annual cost for this commitmentwill also provide participating utilities with aminimum supply of water every day. Thisguarantee will provide security for issuance ofbonds to build the facilities.
The cost for the raw and finished water systemfacilities (intakes, treatment plants, pumpingstations, pipelines, etc.) includes the componentsneeded to deliver the water up to the wholesalemeter connection off of the grid network. Theannual fees for purchasing water from the gridnetwork are estimated at $400,000 to $500,000per mgd of committed capacity. This annual feeincludes delivery of 200,000 gallons per day foreach 1 million gallons per day of committedcapacity. These annual fees are equivalent toabout $1.83/1,000 gallons of water purchased ifthe customer purchases their full committedcapacity every day, or equal to about $6.16/1,000gallons purchased if the customer only purchasesthe minimum capacity (20% of the committedcapacity). As of January 4, 2004, the followingBWSC participants had signed non-bindingcommitments for a total of 31.755 mgd (City of

Water System Regionalization Feasibility Study
Final Draft ReportJanuary 7, 2004 5
Cynthiana � 0.5 mgd, City of Danville � 1 mgd,Frankfort Electric and Water Plant Board � 2 mgd,Georgetown Municipal Water and Sewer Service� 0.255 mgd, Kentucky American Water � 22mgd, City of Lancaster � 0.5 mgd, Mt. SterlingWater and Sewer Commission � 1 mgd,Nicholasville Combined Utilities � 1 mgd, City ofParis � 0.5 mgd, Winchester Municipal UtilitiesCommission � 3 mgd). After the remainingBWSC participants finalize their decisionsregarding the non-binding commitments, the sizeand cost of the new facilities can be refined.
The objective of the financing plan was to developa plan that is affordable and fairly apportionscosts. In order to keep the financing for theproject simple, the financing recommendations forwater sold from the grid include:
• Sales only to wholesale customers (i.e.,no retail sales).
• Charge a common unit cost to allmembers.
• Establish �take or pay� contracts forcommitted capacity, with a minimumdaily delivery of water to maintain waterquality in the grid.
• Form a regional agency that can issue tax-exempt debt by financing only municipalobligations.
Who will own and manage the proposedwater facilities?
A new organization will be formed to overseemanagement and operation of the proposedwaterworks facilities. A benchmarking surveywas performed early in this current study toidentify and evaluate management and ownershipalternatives for the participating utilities.Organizational and management issues that wereaddressed included organizational structure,services to be provided, financing, managementphilosophy, and membership. BWSC�sparticipants considered several organizationalalternatives before selecting a Regional WaterCommission as the preferred alternative. A
Regional Water Commission, as formed underChapter 74 of the Kentucky Revised Statutes, is adistinct legal entity and is both a publiccorporation and a governmental agency. Theproposed name of the Regional WaterCommission is the �Bluegrass Water SupplyCommission�. The Commission will be governedby a Board of Commissioners with eachCommissioner having one equal vote. TheCommissioners will be appointed by theirrespective Mayor and approved by the governingbody (City Council or City Commission) of theCity which owns the utility. Since the BluegrassWater Supply Commission (Commission) will bea governmental agency, it will be eligible for tax-exempt financing, and state and federal grants andlow interest loans. The Commission will be aseparate legal entity and, as such, will beresponsible for its own debts and legalobligations. Revenues derived from water saleswill be used to pay for operating expenses and torepay debts incurred by the Commission. TheBoard of Commissioners of the Commission willdetermine the wholesale rates that will be chargedto utilities purchasing water from theCommission.
How has the public participated in thestudy process?
BWSC conducted a uniquely open study, withextensive opportunities for input from the public,elected officials, and governmental agencies:
• Public workshops and meetings. A seriesof public workshops and "open house"style public meetings facilitated extensivepublic participation. Since November2002, six all-day public workshops wereheld (in Lexington, Georgetown,Frankfort, Nicholasville, Winchester, andLexington). Two public meetings wereheld in Lexington during the evening inAugust 2002 and September 2003. Thesepublic work sessions and eveningmeetings provided a forum for citizeninput and other interested party input as
Water System Regionalization Feasibility Study
Final Draft ReportJanuary 7, 2004 6
well as an opportunity to ask questions ofBWSC�s participating utilities and theconsultant.
• Newsletters/mailers/e-mail. BGADDprovided an update on the status of thestudy in its bi-monthly newsletters,distributed mailers with theannouncements for upcoming meetings,and corresponded by e-mail with thepublic that attended the meetings.
• Agency briefings and technical meetings. BWSC held several technical meetingsand provided updates on the status of thestudy to the Kentucky River Authority(KRA), Kentucky Division of Water(KDOW), and Kentucky InfrastructureAuthority (KIA).
• Extensive press coverage. Numerousarticles were written in the Lexingtonarea newspapers documenting the workcompleted and the upcoming meetings. On the whole, press coverage waspositive.
• Elected official, Council, and BoardUpdates. Consortium members haveprovided updates to their elected officialsand their Councils/Commissions/Boardsthroughout the study.
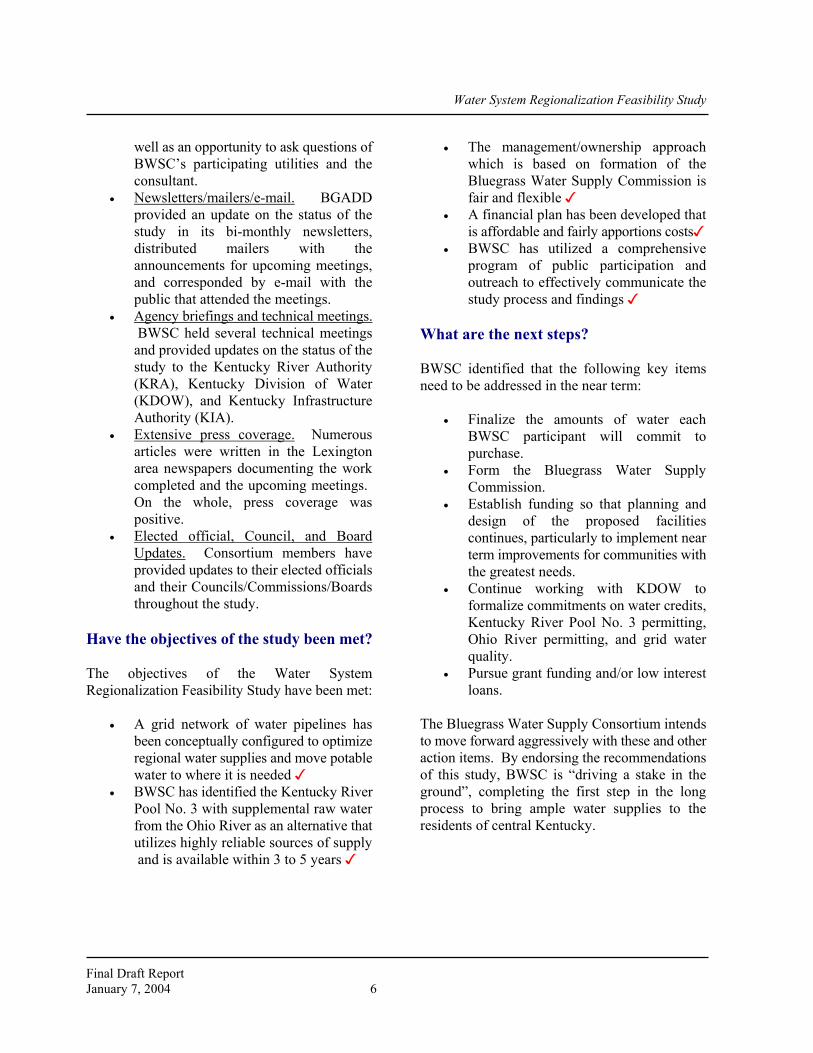
Have the objectives of the study been met?
The objectives of the Water SystemRegionalization Feasibility Study have been met:
• A grid network of water pipelines hasbeen conceptually configured to optimizeregional water supplies and move potablewater to where it is needed !
• BWSC has identified the Kentucky RiverPool No. 3 with supplemental raw waterfrom the Ohio River as an alternative thatutilizes highly reliable sources of supply and is available within 3 to 5 years !
• The management/ownership approachwhich is based on formation of theBluegrass Water Supply Commission isfair and flexible !
• A financial plan has been developed thatis affordable and fairly apportions costs!
• BWSC has utilized a comprehensiveprogram of public participation andoutreach to effectively communicate thestudy process and findings !
What are the next steps?
BWSC identified that the following key itemsneed to be addressed in the near term:
• Finalize the amounts of water eachBWSC participant will commit topurchase.
• Form the Bluegrass Water SupplyCommission.
• Establish funding so that planning anddesign of the proposed facilitiescontinues, particularly to implement nearterm improvements for communities withthe greatest needs.
• Continue working with KDOW toformalize commitments on water credits,Kentucky River Pool No. 3 permitting,Ohio River permitting, and grid waterquality.
• Pursue grant funding and/or low interestloans.
The Bluegrass Water Supply Consortium intendsto move forward aggressively with these and otheraction items. By endorsing the recommendationsof this study, BWSC is �driving a stake in theground�, completing the first step in the longprocess to bring ample water supplies to theresidents of central Kentucky.

Water System Regionalization Feasibility Study
Final Draft ReportJanuary 7, 2004 7
1. Introduction
1.1. Background
Most communities in the central Kentucky region use the Kentucky Riveras their primary source of supply. The severe drought that affected muchof the southeastern United States in 1999 illustrated that the KentuckyRiver, in its present state, cannot reliably meet the growing water supplyneed of the region. The usage of water in 1999 was curtailed in numerousparts of central Kentucky. Since this drought, the Bluegrass Water SupplyConsortium (BWSC), an alliance of government agencies and waterutilities, has been working together to address the potable (treated) waterneeds of central Kentucky. The entities involved include (listedalphabetically):
• Berea College Utilities • City of Cynthiana • City of Danville• Frankfort Electric and Water Plant Board • Georgetown Municipal Water and Sewer Service • City of Harrodsburg • Kentucky American Water • City of Lancaster • City of Lawrenceburg • Lexington-Fayette Urban County Government • Mt. Sterling Water and Sewer Commission• Nicholasville Combined Utilities • City of Paris• Richmond Water, Gas, & Sewerage • Shelbyville Municipal Water and Sewer Commission • City of Versailles • City of Wilmore • Winchester Municipal Utilities Commission
BWSC has been working with numerous regional, state and federalagencies, including the Kentucky River Authority (KRA), KentuckyNatural Resources Environmental Protection Cabinet and the KentuckyDivision of Water (KDOW), Kentucky Infrastructure Authority (KIA),Kentucky Public Service Commission (PSC), the Bluegrass AreaDevelopment District (BGADD), the United States Geological Survey(USGS), and the United States Army Corps of Engineers (USACE) tostudy and address the region�s need for additional potable water.

Water System Regionalization Feasibility Study
Final Draft ReportJanuary 7, 2004 8
This study was financed by Congressional funding together with matchingfunds from KIA and BWSC�s contributions. BGADD served as managerfor the study. KDOW handled the disbursement of federal funds. KIAhandled the disbursement of its own funds. A consulting team withexpertise in engineering, finance, management and law, led by O'Brien &Gere Engineers, Inc. of Landover, Maryland was retained by BGADD, inassociation with BWSC, to complete this study. This study represents anindependent and comprehensive assessment that builds upon previous andongoing efforts to meet the region�s potable water supply needs.
BWSC's mission statement is:
"The Bluegrass Water Supply Consortium will ensure the deliveryof an adequate supply of potable water under any conditions tothe customers of member entities. We will maximize theutilization of the Kentucky River as a raw water source, maintainreasonable rates, and provide adequate water quality."
BWSC solicited frequent input from KRA in developing the study due tothe unique role of KRA relative to the participating utilities. The KRA hasa critical role in the management of the Kentucky River. The KRA wasformed in 1986 and was originally set up to take over the dams and lockson the Kentucky River that the US Army Corps of Engineers planned toabandon. While the locks and dams were originally constructed tofacilitate navigation, the pools created by the dams also serve as watersupply sources. The KRA�s primary mission is now recognized asproviding raw water supply from the Kentucky River. The KRA�s primarysource of revenue is from water utilities that withdraw their raw water fromthe Kentucky River and its tributaries. The success of BWSC�sregionalization approach depends upon KRA�s continued success inmaintaining and improving the dams on the Kentucky River.
1.2. BWSC�s study objectives
The source of future potable (treated) water supplies for the region has beenthe focus of numerous studies. However, meaningful progress in dealingwith this problem has been illusive. The BWSC identified that the time hadcome to seek a regional solution and, through cooperative action, toimplement that solution. The key objectives for the BWSC�s study include:
• Identifying highly reliable sources of additional supply within 3 to5 years.
• Optimizing regional water supplies using a grid network of waterpipelines to move water to where it is needed.
• Developing a financial plan that is affordable and fairly apportionscosts.
Water System Regionalization Feasibility Study
Final Draft ReportJanuary 7, 2004 9
• Identifying a management/ownership approach that is fair andflexible.
• Utilizing a comprehensive program of public participation andoutreach to effectively communicate the study process andfindings.
The Consultant Team used a combination of independent reviews of priorstudies, preparation of technical information, and extensive use ofinteractive workshops to facilitate decision-making to achieve each of theabove objectives.

Water System Regionalization Feasibility Study
Final Draft ReportJanuary 7, 2004 10
2. Need for additional water supplies
2.1. Water demands
2.1.1. Average and maximum day demandsAverage day demands represent the amount of potable water required in ayear, divided by 365 days. Maximum day demands represent the amountof potable water required in a single 24-hour period for a historical day ofmaximum usage. Maximum hour demands represent the water demandrequired during the peak usage period of the maximum day. Each of theseparameters is used to size or evaluate certain parts of a potable watersystem. Maximum day demands are typically used to size raw water intakeson river supplies, water treatment plants, and some of the major watertransmission mains. As a result, maximum day demands are usedextensively in this study.
Water demands for each participating utility were obtained for the year2000 and projected through 2020 by the BWSC participants using the USArmy Corps of Engineer�s IWR-MAIN model. The IWR-MAIN modelprovides water demand forecasts using a number of factors that affect waterdemands, such as household income, persons per household, weather, waterand wastewater rates, housing and employment projections, andconservation programs. The results are summarized in Table1, and a copyof the projected water demands for each utility is included in Appendix A.
To reflect water conservation and drought management efforts, projected�hybrid� maximum day water demands in 2020 were developed based ona reduction of BWSC water demands by 15%, except for the waterdemands for Kentucky American Water (KAW). The 15% reduction is theexpected level of reduction associated with odd/even day water userestrictions for residential/institutional use. KAW�s water demandprojections are the same as those previously proposed and evaluated as partof their Public Service Commission Case Number 93-434 and appropriatelyupdated, and represents approximately a 26% reduction from the IWR-Main model.

Water System Regionalization Feasibility Study
Final Draft ReportJanuary 7, 2004 11
Table 1. Water demands
2000 2020 2020
BWSC Participant
AverageDay
Demand(mgd)
MaximumDay
Demand(mgd)
AverageDay
Demand(mgd)
MaximumDay
Demand(mgd)
HybridMaximum
DayDemand
(mgd)Berea College Utilities 2.410 3.167 3.250 4.385 3.7
Cynthiana (City) 2.159 3.262 2.596 3.875 3.3
Danville (City)1 See footnote.
Frankfort Electric and Water Plant Board 7.950 14.207 8.711 14.565 12.4Georgetown Municipal Water and SewerService 2.435 3.805 3.951 6.176 5.2
Harrodsburg (City) 2.724 3.650 3.133 4.448 3.8
Kentucky American Water 41.020 66.370 51.860 87.670 64.8
Lancaster (City) 1.197 1.643 1.899 2.679 2.3
Lawrenceburg (City) 1.708 2.442 3.210 4.815 4.1
Mt. Sterling Water/Sewer Commission 2.273 3.261 2.540 3.645 3.1
Nicholasville (City) 2.939 4.700 5.010 8.015 6.8
Paris (City) 1.343 2.079 1.825 2.414 2.1
Richmond1 See footnote.
Shelbyville Water/Sewer Commission 3.160 4.640 5.150 6.160 5.2
Versailles (City) 2.967 3.802 4.305 7.534 6.4
Wilmore (City) 0.580 0.909 0.787 1.286 1.1
Winchester Municipal Utilities 3.998 5.311 7.150 11.650 9.9
Total 79 123 105 169 1341 Danville and Richmond joined the Bluegrass Water Supply Consortium following development of the projected demandsfor the study. Danville is proposing to sell water to BWSC and Richmond may have an interest in 1 to 2 mgd. Takentogether, the inclusion of their demands (projected needs) is not expected to significantly change the additional regionalwater requirements.
2.1.2. Aggregate maximum day A potential benefit of a grid network is the ability to move water fromwhere it is available to where it is needed. Because not all of the BWSCparticipating utilities would experience their peak demand on the same day,the study evaluated how the grid could attenuate the aggregate peakingfactor and �buffer� the impacts experienced by individual systems.

Water System Regionalization Feasibility Study
Final Draft ReportJanuary 7, 2004 12
To investigate maximum (peak) day demands for the individual systemsversus the future grid network, water production data from July 25 throughAugust 14, 2002 was obtained from BWSC. The largest supplier is KAW,which had a peak day demand on August 5, 2002. Consequently, theaggregated peak day water production for BWSC on August 5, 2002resulted in a peak day demand of about 157 mgd in 2020. From Table 1,it is anticipated that a 12 mgd reduction in the 2020 maximum (peak) dayaggregate capacity need (169 mgd � 157 mgd) can be achieved byconnecting the individual utilities through the grid network. A summaryof the peaking analysis is included in Appendix B.
2.2. Existing water supply sources
There have been significant studies that looked at only raw water needs ona regional basis and other studies that focused on the needs of individualcommunities, rather than addressing potable water needs in centralKentucky on a regional basis. BWSC�s plan is a regional approach, but yetone in which participating utilities will maintain their autonomy. BWSCdoes not plan to replace existing water supply sources, treatment facilitiesand distribution systems, but rather augment those supplies with water fromthe grid network. The future regional organization would supply potablewater on a wholesale basis with the individual utilities remaining as theretail providers.
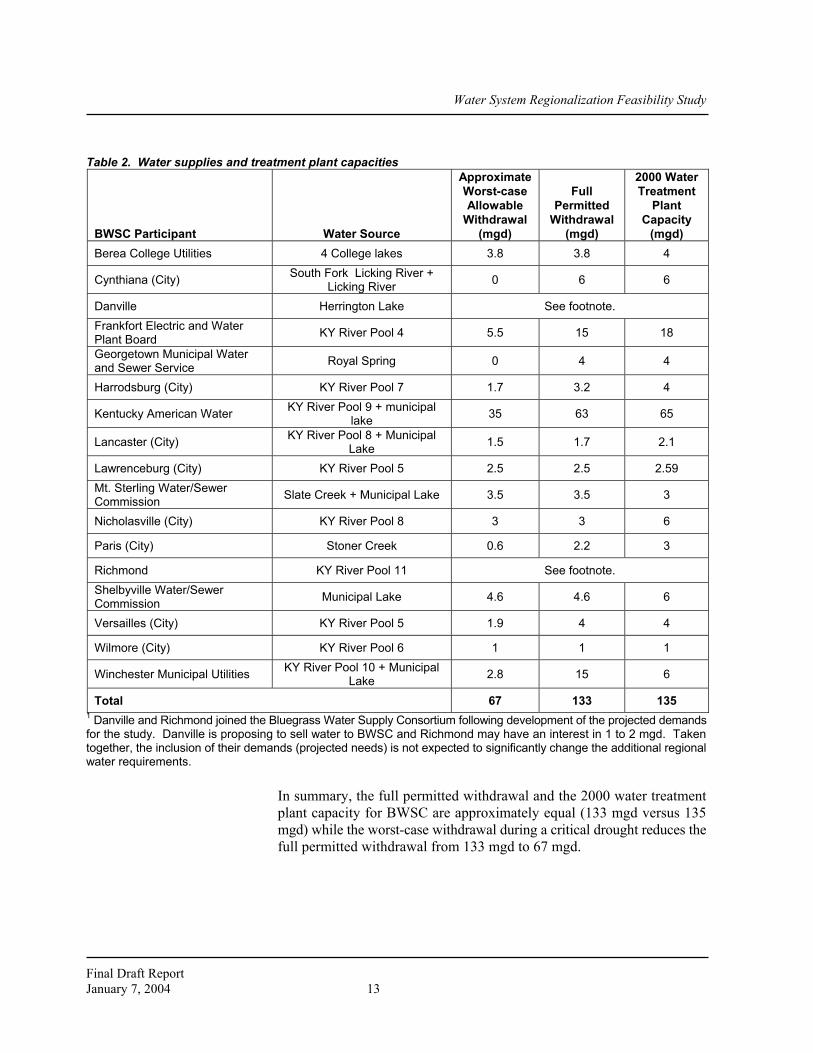
Table 2 lists the water sources, and reported capacities of each source andwater treatment plant currently serving BWSC participants. The capacityof each source of raw water is provided for both worst-case drought andnormal (non-drought) conditions. The worst-case drought condition islabeled "Approximate Worst-case Allowable Withdrawal", while thenormal condition is labeled " Full Permitted Withdrawal". The withdrawalpermits used as the basis for Table 2 are included in Appendix C.
Kentucky River water withdrawal permits typically have multiple stepsfrom the full permitted withdrawal down to the approximate worst-caseallowable withdrawal. The amount of water available from the KentuckyRiver is limited by the lowest seven-day flow in the river with a ten-yearrecurrence frequency (7Q10 flow condition). The 7Q10 flow is thethreshold for passby flows and is established to protect aquatic life. Waterutilities must reduce withdrawals below their "full permitted withdrawal"when flows approach the 7Q10 level. If river flow drops down below7Q10 level, withdrawals must be further reduced, possibly to the leveldefined by minimal essential uses. Minimal essential uses (i.e., sanitarypurposes) are approximated by KDOW as a 20% reduction from the winterwater use. In most cases, the "approximate worst-case allowablewithdrawal' shown in Table 2 represents KDOW's determination ofminimal essential uses.
Water System Regionalization Feasibility Study
Final Draft ReportJanuary 7, 2004 13
Table 2. Water supplies and treatment plant capacities
BWSC Participant Water Source
ApproximateWorst-caseAllowable
Withdrawal(mgd)
FullPermitted
Withdrawal(mgd)
2000 WaterTreatment
PlantCapacity
(mgd)Berea College Utilities 4 College lakes 3.8 3.8 4
Cynthiana (City) South Fork Licking River +Licking River 0 6 6
Danville Herrington Lake See footnote.Frankfort Electric and WaterPlant Board KY River Pool 4 5.5 15 18
Georgetown Municipal Waterand Sewer Service Royal Spring 0 4 4
Harrodsburg (City) KY River Pool 7 1.7 3.2 4
Kentucky American Water KY River Pool 9 + municipallake 35 63 65
Lancaster (City) KY River Pool 8 + MunicipalLake 1.5 1.7 2.1
Lawrenceburg (City) KY River Pool 5 2.5 2.5 2.59Mt. Sterling Water/SewerCommission Slate Creek + Municipal Lake 3.5 3.5 3
Nicholasville (City) KY River Pool 8 3 3 6
Paris (City) Stoner Creek 0.6 2.2 3
Richmond KY River Pool 11 See footnote.Shelbyville Water/SewerCommission Municipal Lake 4.6 4.6 6
Versailles (City) KY River Pool 5 1.9 4 4
Wilmore (City) KY River Pool 6 1 1 1
Winchester Municipal Utilities KY River Pool 10 + MunicipalLake 2.8 15 6
Total 67 133 1351 Danville and Richmond joined the Bluegrass Water Supply Consortium following development of the projected demandsfor the study. Danville is proposing to sell water to BWSC and Richmond may have an interest in 1 to 2 mgd. Takentogether, the inclusion of their demands (projected needs) is not expected to significantly change the additional regionalwater requirements.
In summary, the full permitted withdrawal and the 2000 water treatmentplant capacity for BWSC are approximately equal (133 mgd versus 135mgd) while the worst-case withdrawal during a critical drought reduces thefull permitted withdrawal from 133 mgd to 67 mgd.

Water System Regionalization Feasibility Study
Final Draft ReportJanuary 7, 2004 14
2.3. Projected shortfall in supply
Three deficit conditions were developed based on 2020 water demands andexisting water supplies:
• Maximum day permit deficit: 169 mgd of maximum day waterdemand � 133 mgd permitted water supply withdrawal = 36 mgdof additional water is needed to meet the maximum day needs(non-drought) of the BWSC through 2020. The above maximumday permit deficit is nearly identical to the treatment plant deficitwhich equals 169 mgd water demand � 135 mgd of water treatmentplant capacity = 34 mgd of additional treatment plant capacityneeded through 2020.
• Worst case drought deficit: 169 mgd of maximum day waterdemand � 67 mgd permitted water supply withdrawal = 102 mgdof additional water is needed to meet the unrestricted waterdemands of the BWSC during critical drought conditions through2020.
• Hybrid drought deficit: 134 mgd �hybrid� (restricted) waterdemand � 67 mgd permitted water supply withdrawal = 67 mgd ofadditional water is needed to meet the restricted needs of theBWSC during critical drought conditions through 2020.
For 2020, the 36 mgd deficit between unrestricted maximum day demandsand the current permit �ceiling� is the �low bookend� in terms of waterneeds. The 102 mgd drought deficit between the unrestricted maximumday demands and the permit �floor� is the �high bookend�. The 67 mgd�hybrid� drought deficit represents the difference between restricted 2020maximum day water demands and the permit �floor�. This 67 mgd�hybrid� drought deficit is selected as the year 2020 supply target forthis study. Roughly two-thirds of this deficit exists today and theremaining one-third will result from projected growth in the region through2020. While there are no available projections of water demand beyond2020, an extrapolation of the near term pattern predicts the supply deficitwill grow by approximately 2 million gallons per day each year beyond2020.
2.4. Use of baseline alternatives to reduce projected shortfall
The supply target for 2020 can be reduced by taking into consideration theanticipated increase in near-term water supplies from the Kentucky River. These increases in near-term water supply have been referred to as"baseline alternatives" in the workshops. Baseline alternatives areconsidered to be part of the future water supply regardless of the watersupply alternative selected. There are two baseline alternatives: estimated

Water System Regionalization Feasibility Study
Final Draft ReportJanuary 7, 2004 15
"water credits" for return wastewater flows to the Kentucky River (12million gallons per day), and additional raw water storage provided byraising Kentucky River Lock and Dam No. 10 (10 million gallons per day).
2.4.1 Water CreditsKDOW is developing a new aspect of their raw water withdrawalpermitting process, which is called "water credits". While the water creditprogram is not yet available for review, the Consultant Team met withKDOW several times during the course of the study to understand how thisnew program would assist the regional water supply initiative. Watercredits essentially would allow a party holding a water withdrawal permit,who treats the resulting wastewater and discharges the effluent back to thestream, to withdraw the water again at a downstream location. Essentially,these return flows are considered as if they are still controlled by theoriginal "withdrawer" and that party can withdraw them again, subject tothe conditions of the new program. It is envisioned that the water creditprogram will provide flexibility so that a regional organization couldessentially apply the water credit for return flow from one of its participantsto the downstream intake of another participant.
Specific to the situation in Central Kentucky, there are several BWSCparticipants who withdraw water from the Kentucky River, treat theresulting wastewater, and discharge it back to the Kentucky River or oneof its tributaries. By far the most significant example is the Lexington area,in which Kentucky American Water withdraws raw water at Pool No. 9,and the wastewater is treated and discharges from West Hickman WWTPinto Hickman Creek (which flows to Pool No. 7) and from Town BranchWWTP, which discharges into a tributary of Elkhorn Creek (which flowsto Pool No. 3). By using an existing lower pool intake such as FrankfortElectric and Water Plant Board�s intake at Pool No. 4, it is anticipated thatwater credits could make about 12 mgd of additional supply available,thereby reducing the 2020 supply target to 55 mgd (67 mgd target - 12 mgdwater credits = 55 mgd). The following considerations apply to the quantityand use of the water credits:
• The portion of the return flow reaching the main stem of theKentucky River must be verified.
• KDOW�s proposed policy would provide credits for about 90% ofthe verifiable return flows.
• Water credits are not linked to environmental studies. • KDOW anticipates that about 25 mgd of water credits will be
available at or above Kentucky River Pool No. 3.• KDOW has indicated that the draft policy on water credits is
currently being developed and should be implemented in summer2004.

Water System Regionalization Feasibility Study
Final Draft ReportJanuary 7, 2004 16
2.4.2. Dam 10In July 2000, KRA resolved to rehabilitate Lock and Dam No. 10. InOctober 2000, legislation was passed for funding rehabilitation of Lock andDam No. 10. The intent of this project is to stabilize and raise the dam anda secondary goal is to restore the lock if funds are available. The currentapproach to raising the dam is actually to construct a new higher damnearby the exiting dam. The purpose in the higher dam is to increase thepool storage by 1.0 to 1.6 billion gallons (for a 4 to 6 foot higher dam) inorder to assist with meeting the projected shortfalls in raw water storage inthe central Kentucky region. The schedule proposed by the US ArmyCorps of Engineers presupposes that no significant environmental problemswill be encountered. The schedule estimates that the project would becompleted in 2008. The higher Dam No. 10 is currently under design bythe KRA and has received congressional authorization for funding throughthe US Army Corps of Engineers (Appendix D). It is assumed in this studythat the higher Dam No. 10 will make about 10 mgd of additional supplyavailable thereby further reducing the 2020 supply target to 45 mgd. KDOW has not indicated whether or not the additional storage could leadto a change in the withdrawal permit. The decision on whether theadditional storage will lead to a change in the permitted withdrawal iscomplicated, involving the operation of the valves that release water fromthe pool , and the river environment, among other factors. The 10 mgdestimate is simply a reflection of the approximate amount that theadditional storage would increase the safe yield in a traditional hydrologicanalysis. The additional storage from the higher Dam 10 will undoubtedlyimprove the water supply situation for Kentucky River users.
In summary, the water supply needed to meet BWSC water demands in2020 was reduced from 67 mgd to 45 mgd by taking into account theanticipated increase in near-term supplies from the Kentucky River(baseline alternatives). Baseline alternatives include estimated watercredits for return wastewater flows to the Kentucky River which can bewithdrawn by existing intakes (12 mgd) and additional storage provided bythe higher Kentucky River Dam No. 10 (10 mgd).

Water System Regionalization Feasibility Study
Final Draft ReportJanuary 7, 2004 17
3. Water supply alternatives
The selection process for identifying the preferred water supply alternativeincluded the following steps:
• Establishing evaluation criteria• Determining fatal flaws and weighting factors• Identifying alternatives• Eliminating fatally flawed alternatives• Screening alternatives• Selecting alternatives
This selection process is illustrated in Figure 1.
3.1. Evaluation criteria and weighting
The evaluation criteria were developed and refined in Workshop No. 1and No. 2 as follows:
• Water supply capacity - Reliable quantity of raw water or finishedwater to meet projected demands through the planning period. This criteria addresses interruptibility of sources of supply.
• Water quality - Raw and finished water quality that meets existingwater quality requirements, and can readily achieve futureanticipated regulations. This criteria also addresses water qualitypreferences such as superior raw water quality, finished watertaste, and potential grid issues such as impact from mixing multiplesupplies.
• Cost - The present worth cost for proposed raw and finished waterimprovements, including capital, operating and maintenance costs.
• Implementability/risk of delay - The relative ease of implementingthe proposed improvements in time to meet projected demands,which BWSC established as 3 to 5 years. This criterion considersthe potential that regulatory permitting, public acceptance,property acquisition, or constructability issues could delayimplementation.
• Flexibility - The ability to phase implementation and spread thecost over time, while still meeting projected demands. Thiscriterion addresses the ability to expand beyond the planningperiod and the entrance/exit of BWSC members.

Figu
re 1
Blu
egra
ss A
rea
Dev
elop
men
t Dis
tric
tW
ater
Sys
tem
Reg
iona
lizat
ion
Feas
ibili
ty S
tudy
Wat
er S
uppl
y A
ltern
ativ
es S
elec
tion
Proc
ess
File
No.
112
03.3
0507
Dat
e: J
anua
ry 7
, 200
4
Sele
ctin
g A
dditi
onal
Sou
rces
of S
uppl
y
Det
erm
ine
the
Nee
d
Fata
lFl
awA
naly
sis
Nea
r Ter
m/
Long
Ter
mAn
alys
is
Pre
limin
ary
Scr
eeni
ng(N
ear
Term
)
Est
ablis
hE
valu
atio
nC
riter
ia
Iden
tify
Alte
rnat
ive
Sou
rces
All
Oth
er
Bas
elin
e
Pref
erre
d
All
Oth
er
Nea
rTe
rm
Long
Ter
mE
limin
ate
Long
Term
Alte
rnat
ives
Fata
llyFl
awed
Alte
rnat
ives
Bas
elin
e
Pre
ferre
d

Water System Regionalization Feasibility Study
Final Draft ReportJanuary 7, 2004 18
In order to assign the relative importance of these criteria, a pairwisecomparison technique was used at Workshop No. 3 to assign"weighting factors" to each of the evaluation criteria. The pairwisetechnique compares each criterion against every other criterion todetermine their relative importance. The resulting spreadsheet isincluded in Appendix E. The results are represented as a percentage,with all the criteria totaling up to 100%, as follows:
Evaluation Criteria WeightingWater supply capacity 18% Water quality 8%Cost 27%Implementability/risk of delay 27%Flexibility 20%
It was agreed that water quality issues that could be addressed by cost (i.e.,additional treatment measures) would not additionally be considered as partof water quality criteria. This resulted in the low weighting of waterquality as a criterion, as most of the existing issues became part of the costanalysis.
3.2. Fatal Flaws
Because of the magnitude of the deficit, water supply alternatives thatcould not provide at least 10 mgd were considered fatally flawed and wereeliminated from further consideration. Only 3 alternatives were eliminatedas fatally flawed, and they are listed in table in Appendix F.
3.3. Water supply alternatives evaluated in this study
Over 40 unique water supply alternatives were identified based on a reviewof previous studies and work performed in this study as summarized belowby source:
• Ohio River � seven options• Kentucky River � eight options• Existing reservoirs � seven options• New reservoirs � twelve options• Groundwater � six options
A complete listing and brief summary of information on numerous watersupply alternatives in the central Kentucky region are presented inAppendix G. The list of 40 water supply alternatives was separated intonear-term and long-term groups based on the alternative's potential to beimplemented within 3 to 5 years (Appendix F). The 3 to 5 year timeframewas based on �meaningful progress� which represented the ability to secure

Water System Regionalization Feasibility Study
Final Draft ReportJanuary 7, 2004 19
approvals/required permits within two years and the ability to design,construct, and put the project in service within an additional 3 to 4 years.A total of 16 alternatives were considered to be "near-term", with theremainder viewed as "long-term". The near-term and long-termdesignations are shown on the table in Appendix F. In most cases, thelong-term alternatives were those involving a new dam/reservoir, orsignificant modification of an existing dam/reservoir. Based on theextended time required for permitting such projects, the Consultant Teamplaced them in the long-term category during Workshop No. 3.
Six of the sixteen near-term options involved purchasing finished waterfrom any of five different organizations. Interviews with each these"potential seller" organizations were held at BGADD's office on May 12-13, 2003:
• Greater Fleming County Regional Water Commission• Louisville Water Company• Northern Kentucky Water District• Carrollton Utilities/Carroll County WD No. 1• Cincinnati Water Works (two options)
3.4. Preferred alternatives
At Workshop No. 4, the 16 near term alternatives were reviewed to developa listing of preferred alternatives. The result of that screening process isdocumented in Appendix H. Eight alternatives were deemed "preferred",and selected for further evaluation:
• Purchase treated water from Cincinnati Water Works via BooneFlorence Regional Water Commission.
• Purchase treated water from Cincinnati Water Works via BrackenCounty.
• Purchase treated water from Louisville Water Company.• Purchase treated water from Carrollton Utilities/Carroll County
Water District No. 1.• Purchase treated water from Greater Fleming County Regional
Water Commission.• Ohio River water withdrawal and new water treatment plant at
Maysville or Dover.• Ohio River water withdrawal and new water treatment plant at
Warsaw.• Kentucky River water withdrawal and new water treatment plant
at Kentucky River Pool No. 3, with supplemental raw water fromthe Ohio River.

Water System Regionalization Feasibility Study
Final Draft ReportJanuary 7, 2004 20
Five of the eight preferred alternatives involved purchased water, withCincinnati Water Works involved in two options, and Greater FlemingCounty Regional Water Commission, Louisville Water Company,Carrollton Utilities/ Carroll County WD No. 1 involved with one each.Requests for proposals from these potential sellers of finished water wereissued on June 13, 2003 (Appendix I) and all four organizations submittedresponses on July 9-10, 2003. The findings from these proposals were:
• All four entities were interested in selling finished water and haveavailability in the near term.
• Available supply ranges from about 10 to 15 mgd to the full 67mgd.
• All entities use either Ohio River or river bankaquifers/groundwater from along the Ohio River
• Finished water quality meets or exceeds SDWA requirements.
The other three preferred alternatives would involve new water treatmentfacilities owned by the future regional organization. Two of these involvenew withdrawals and water treatment plants off the Ohio River, inMaysville/Dover, or Warsaw respectively. The eighth option involves anew intake and water treatment plant utilizing Pool No. 3 off of theKentucky River with an auxiliary intake on the Ohio River. This is theonly option that relies on the Kentucky River.
3.5. Kentucky River Pool No. 3 alternative
The Consultant Team developed the Pool No. 3 alternative, which had notbeen the subject of prior investigations. The safe yield or reliable capacityof the Kentucky River at Pool No. 3 had been assumed to be adequatebased on conversations with KDOW, but needed to be confirmed. Inmeetings and a subsequent letter from KDOW in July 2003, KDOWidentified that the water credit plus the baseline withdrawal available atPool No. 3 suggests a �floor� for a permit of between 35 and 45 mgd anda �ceiling� up to 113 mgd (Appendix J). Using the lower "floor" of 35 mgdfor the purpose of discussion, the 35 mgd is comprised of two components:"minimal essential uses", and "water credits" for wastewater return flowsat or above Pool No. 3. The first component, "minimal essential uses", wasestimated at 10 mgd, as shown in KDOW's letter. KDOW identified that thewater credit component would likely amount to between 25 mgd and 35mgd, including the 12 mgd which the Consultant Team previously assumedwould be available at Frankfort, as part of the baseline alternative. Consequently, using 12 mgd of return flow at Frankfort Electric and WaterPlant Board�s intake at Pool No. 4 reduces the �floor� for the permit at PoolNo. 3 by 12 mgd, to between 23 mgd and 33 mgd during a critical drought.It was apparent that Pool No. 3 could not be relied upon to satisfy the targetsupply of 45 mgd in 2020, even considering the proposed water credits.However, KDOW estimated that the drought events occurred so

Water System Regionalization Feasibility Study
Final Draft ReportJanuary 7, 2004 21
infrequently that the target supply would be available for a large majorityof the time. The Pool No. 3 alternative was therefore modified to includesupplemental flow from the Ohio River to offset any shortfalls associatedwith permitted withdrawals from the Kentucky River. The Ohio Riverpipeline would likely be designed to carry about 25 to 30 mgd of rawwater. The ability to withdraw water from both the Kentucky River and theOhio River provides significant flexibility and reliability to the region. The water treatment plant would be designed to treat water from eithersource.
3.6. Cost analysis
An assessment of the probable cost associated with planning, design,construction and operation of the eight preferred water supply alternativeswas developed. Planning-level construction costs were estimated usingavailable information from previous reports, construction cost curves fromsimilar projects, and manufacturers� cost data. The estimates are based onAugust 2003 prices and an Engineering News Record (ENR) ConstructionCost Index of 6733. Operating costs were also included because some ofthe alternatives involved lower capital costs, but significant annual costs topurchase finished water, while other alternatives involved higher capitalcosts, no purchased water, but do include costs to staff and operate a newwater treatment plant. A present worth analysis was used to comparecapital intensive and operational intensive alternatives on an equal basis.
The cost estimates represent the cost for planning, design and constructionof river and reservoir intakes, pumping stations, water treatment plants, andtransmission mains needed to deliver water through the grid. �Project�costs for each alternative were developed based on planning level estimatesof the cost for constructing the individual water supply components (watertreatment plants, pumping stations, etc.) associated with each alternative.The project costs include an allowance for construction contingencies(20%); regulatory permitting (5%); and engineering, legal, administrative(20%). Project costs (including the grid network costs) for the eightpreferred alternatives are shown in Table 3. Present worth costs are basedon a 40-year period and 3 % real interest rate. Spreadsheets outlining thecosts for the individual water supply components are included in AppendixK.

Water System Regionalization Feasibility Study
Final Draft ReportJanuary 7, 2004 22
Results of Tech Group Pairwise Comparison(Highest Scores are Most Preferred)
2,156
1,8752,126 2,054
1,510
2,627
2,217 2,237
0
1,000
2,000
3,000
Louis
ville
Wate
r Com
pany
Cincinn
ati vi
a Boo
ne Flor
ence
Cincinn
ati vi
a Brac
ken C
ounty
Carroll
ton U
tilitie
s/ Carr
oll C
ounty
WD N
o. 1
Greater
Fleming
Reg
ional
Wate
r Com
mission
KY Rive
r Poo
l 3 W
TP Sup
plemen
ted w
ith O
hio R
iver
Ohio R
iver -
New
WTP at
May
sville
/Dov
er
Ohio R
iver -
New
WTP at
Wars
aw
Water Supply Alternative
Scor
e
Table 3. Estimated project costs and present worth costs for water supply alternatives
Water Supply Alternative
AvailableSupply(mgd)
TotalProject
Cost($ millions)
PresentWorth ofAnnual
Operationand
Maintenance($ millions)
TotalPresentWorth of
Alternative($ millions)
UnitPresentWorth of
Alternative($/gallon)
Cincinnati Water Works via BooneFlorence 45 320.4 65.6 386.1 8.58
Cincinnati Water Works viaBracken County 45 290.4 65.6 356.0 7.91
Louisville Water Company 1 45 175.7 117.9 293.7 6.53Withdrawals and WTP atMaysville/Dover 45 267.8 65.6 333.4 7.41
Withdrawals and WTP at Warsaw 45 278.0 65.6 343.7 7.64New WTP at Pool No. 3 with OhioRiver Pipeline 45 265.0 65.6 330.6 7.35
Purchase water from CarrolltonUtilities/CCWD 45 162.3 250.7 413.0 9.18
Purchase water from GreaterFleming 15 45.4 137.0 182.4 12.16
1 Costs shown reflect Louisville Water Company's revised lower purchase price.
At Workshop No. 5,the Consultant Teamand BWSC TechnicalGroup ranked each ofthe eight preferredwater supplyalternatives using theevaluation criteria anda pairwise comparisontechnique. Thepairwise techniqueranks each alternativeagainst every otheralternative, and does itseparately for eachevaluation criteria. The result is a rankingof alternatives for each
evaluation criteria. The weighting factors developed in Workshop No. 3were then used to consolidate the rankings under each criterion into acomposite ranking. The pairwise comparison spreadsheets are included inAppendix L. The pairwise comparison showed that three alternatives weresuperior to the others:

Water System Regionalization Feasibility Study
Final Draft ReportJanuary 7, 2004 23
Results of Tech Group Pairwise Comparison(Highest Scores are Most Preferred)
2,264
1,8482,099 2,027
1,537
2,573
2,217 2,237
0
1,000
2,000
3,000
Louisville
Wate
r Compan
y
Cincinnati
via B
oone Floren
ce
Cincinnati
via B
racke
n County
Carrollto
n Utili
ties/
Carroll C
ounty WD N
o. 1
Greater
Fleming R
egional
Water C
ommi...
KY Rive
r Pool 3
WTP Supplem
ented
with
...
Ohio Rive
r - N
ew W
TP at M
aysv
ille/D
over
Ohio Rive
r - N
ew W
TP at W
arsaw
Water Supply Alternative
Scor
e
• Purchase treated water from Louisville Water Company, • Ohio River water withdrawal and new water treatment plant at
Maysville/Dover or Warsaw, • Kentucky River withdrawal and new water treatment plant at
Kentucky River Pool No. 3 with supplemental raw water from theOhio River.
When these results were presented at Workshop No. 5, several of theorganizations that had proposed selling finished water to BWSC asked forthe opportunity to review their proposal and possibly submit a newproposal. BWSC allowed all four of the potential "sellers" to resubmitproposals, provided they did so promptly (in about two weeks). Oneorganization, the Louisville Water Company, submitted a new proposal.
Cost estimates werethen updated prior toWorkshop No. 6, toreflect the newproposal fromLouisville WaterCompany, and otherrefinements. A seriesof "sensitivityanalyses" wereconducted todetermine whether theresults of the costanalysis or thepairwise comparisonwere sensitive to anyof these assumptions:the duration of thepresent worth
analysis, the interest rates used in the present worth analysis, and theamount of additional water that will be purchased by the BWSCparticipants. As shown in Appendix L, changes to these factors did notchange the ranking of the pairwise comparison. While purchasing waterfrom the Louisville Water Company was found to be the lowest costalternative (about 11-14% lower, depending on present worth duration andinterest rates), the Consultant Team recommended the Kentucky River PoolNo. 3 alternative based on its highest overall score, which was driven byfirst place rankings in implementability, flexibility, and water quality, andsecond place rankings in cost and capacity.

Water System Regionalization Feasibility Study
Final Draft ReportJanuary 7, 2004 24
The waterworks facilities included in the Kentucky River Pool No. 3alternative are:
• Raw water intake and pumping station at Kentucky River Pool No.3.
• Raw water pipeline from the Kentucky River Pool No. 3 intake andpumping station to the new water treatment plant.
• Water treatment plant near Kentucky River Pool No. 3.• Raw water intake and pumping station at Ohio River. • Raw water pipeline from Ohio River intake and pumping station
to the new water treatment plant at Kentucky River Pool No. 3.• Treated water transmission mains from the new water treatment
plant near Kentucky River Pool No. 3 to the grid network.• Treated water transmission mains comprising the grid network.
The recommended water supply alternative, Kentucky River Pool No. 3with supplemental raw water from the Ohio River, has the followingadvantages:
• Reliability due to access to two different water supplies. Thisreliability would be beneficial in the event of a spill or othercontamination event in either river.
• Optimal use of the Kentucky River. This option maximizes use ofthe Kentucky River, consistent with BWSC's mission statement.
• Affordable cost. This option results in a unit cost for finishedwater that is reasonable and more economical than all but one otheralternative.
• Implementability and low risk of delay. By supplementing thePool No. 3 withdrawal, there should be no significant obstacles tosecuring a withdrawal permit from KDOW. The Consultant Teamis not aware of any other significant obstacles, and finds itreasonable that this alternative could be implemented within 3 to5 years following project initiation.
A roll call vote was conducted at Workshop No. 6, on whether to endorsethe Consultant Team's recommendation to pursue the Pool No. 3Alternative, with supplemental raw water from the Ohio River. FifteenBWSC participants voted in support, one participant abstained, and twoparticipants were absent from the workshop. The details of the presentationand the vote are in Appendix M.

Water System Regionalization Feasibility Study
Final Draft ReportJanuary 7, 2004 25
4. Water system grid network
4.1. Network configuration and sizing
BWSC is proposing to construct a grid network of waterlines across centralKentucky to connect the water systems of the participating water utilities.BWSC plans to move treated water through the grid network from pointsof availability to points of need -- wheeling. The grid would consist ofpipelines interconnecting the BWSC. Many of the consortium members arealready interconnected � KAW to Georgetown and Versailles, Frankfort toGeorgetown � and in other areas existing pipelines extend relatively closeto other communities. For this feasibility study, a concept level hydrauliccomputer model was prepared to evaluate the existing grid elements anddetermine required pipe sizes and pumping station locations for newinfrastructure. The model was prepared using the KYPIPE modelingsoftware developed at the University of Kentucky.
A conceptual layout and cost of the piping system was developed for eachof the eight water supply alternatives. Pipeline sizing for the grid networkwas based on a hydraulic model that was developed by obtaining the majorpiping for the existing BWSC water systems, along with water demandsrepresenting each community�s treatment or supply deficit. Based on theadequacy of the existing major piping, additional connecting pipelines andpumping stations were added to convey the water to where it is needed. Hydraulic analyses were performed for the various water supplyalternatives using two criteria: velocities and pressures. The goal was tomaintain velocities between 2.5 feet per second (fps) and 8 fps while at thesame time maintaining pressures between 30 pounds per square inch (psi)and 150 psi. USGS topographic maps were used to identify the locationand estimate high and low elevations for each water line route. Theseelevations assisted in identifying potential booster pumping stationlocations along proposed routes where pressures dropped below 30 psi. Itwas assumed that pumping stations would boost the pressure up to amaximum of 150 psi. Master meters are proposed at each interconnectionbetween the BWSC grid and individual community systems. Figuresshowing the grid network for the water supply alternatives are included inAppendix N.
Figure 2 illustrates the components of one alternate version of the grid, andthe details of each grid component are as follows:
• Lexington from Proposed WTP (additional connection inFrankfort) � approximately 175,300 feet of 48-inch water main,3 pumping stations and 2 master meters.
• Shelbyville and Lawrenceburg from Frankfort � approximately

Figu
re 2
Blu
egra
ss A
rea
Dev
elop
men
t Dis
tric
tW
ater
Sys
tem
Reg
iona
lizat
ion
Feas
ibili
ty S
tudy
Grid
Com
pone
nts
File
No.
112
03.3
0507
Dat
e: J
anua
ry 7
, 200
4

Water System Regionalization Feasibility Study
Final Draft ReportJanuary 7, 2004 26
11,400 feet of 16-inch and 107,100 of 12-inch water main, 3pumping stations, and 2 master meters.
• Paris from Lexington � approximately 55,400 feet of 12-inchwater main and 1 master meter.
• Cynthiana from Georgetown � approximately 76,600 feet of 12-inch water main and 1 master meter.
• Winchester from Lexington � approximately 59,100 feet of 24-inch water main and 1 master meter.
• Mt. Sterling from Winchester � approximately 79,800 feet of 8-inch water main, 2 pumping stations and 1 master meter.
• Nicholasville from Lexington � approximately 39,900 feet of 24-inch water main, 1 pumping station and 1 master meter.
• Wilmore from Nicholasville � approximately 15,700 feet of 12-inch water main, 1 river crossing and 1 master meter.
• Harrodsburg from Wilmore � approximately 44,300 feet of 10-inch water main, 1 pumping station and 1 master meter.
• Danville from Harrodsburg � approximately 36,800 feet of 10-inchwater main, 1 pumping station and 1 master meter.
• Lancaster from Danville � approximately 57,400 feet of 10-inchwater main, 1 pumping station, 1 river crossing and 1 master mater.
• Richmond from Lexington � approximately 77,500 feet of 18-inchwater main, 2 pumping stations, 1 river crossing and 1 mastermeter.
• Berea from Richmond � approximately 51,700 feet of 8-inch watermain, 1 pumping station and 1 master meter.
At this time, it appears that opportunities may exist for phasingconstruction of portions of the grid network. However, details of proposedphasing cannot be fully developed until the list of BWSC participants isconfirmed.
4.2. Grid water quality
During the course of the study, KDOW identified several issues related totreated water quality in the grid network, including mixing ofchlorine/chloramine disinfectants, corrosion control, and responsibility forand monitoring of water quality. A brief summary of the issues ispresented here and a more detailed discussion is presented in Appendix O.
• Disinfection by-products (DBPs) and chloramine/chlorine mixing- The naturally occurring organics in surface water supplies suchas the Kentucky River or Ohio River combine with free chlorineto form DBP�s, which are regulated by the Safe Drinking WaterAct. Water systems using surface water will be challenged to meetthe Stage 2 levels in the proposed DBP rule, when they come intoeffect (likely 2007-2009 timeframe). Some utilities have switched
Water System Regionalization Feasibility Study
Final Draft ReportJanuary 7, 2004 27
the form of their distribution system chlorine residual from freechlorine to chloramine, in an attempt to reduce their DBP level.Based on a survey conducted by BGADD, thirteen out ofseventeen BWSC utility participants currently use free chlorine,but more than half of the water consumed in the region useschloramines, because Kentucky American Water, the largestsupplier, uses chloramine for its residual disinfectant. It isunderstood at this time that KAW will not likely switch back tofree chlorine, because of difficulty meeting the near-term DBPregulation.
Mixing of free chlorine and chloramine residuals can cause tasteand odor problems. Figure 3 shows the form of chlorine residualused by each BWSC participant, and whether those using freechlorine are willing to switch to chloramine, so that all systemswould use the same form of chlorine residual. Several "outer ring"utilities indicated they use free chlorine and are unwilling toswitch. The Consultant Team therefore proposed an alternative inwhich chloraminated water would be converted back to a freeresidual for those utilities. It appears that this could be workable,since the flow could be controlled so that water with free chlorinewould not be allowed to move back past the master meters, andmix with chloraminated water. While there are numerous detailsyet to be resolved, KDOW concurred that the DBP/chlorineresidual issue could be worked out, and therefore did not presentan insurmountable obstacle to the grid system.
• Corrosion control � There are several different approaches tocorrosion control currently employed by BWSC participants. Theremay be a need to adjust some corrosion techniques in "mixingzones", where the water from adjacent systems mixes. It ispossible that the grid may adopt some more consistent approachesto corrosion control to avoid the mixing issue. However, it isunlikely that occasional changes in mixing would create asignificant problem. Further water quality studies arerecommended, but can be performed after the RegionalizationFeasibility study is completed.
• KDOW regulation regarding �consecutive systems� �The gridconcept is a challenge from a regulatory perspective, because therecould be several suppliers each with the potential to supply waterto the same utility. The hydraulics could be dynamic, at least onoccasion, making it difficult to always know whose water isreaching that utility. It appears that evolving SDWA regulationswill continue to make the retail water provider responsible for thequality of the water they sell. KDOW has the responsibility toissue specific guidance on responsibility for water qualitycompliance in a grid system, and to clarify the rules governing

Figu
re 3
Blu
egra
ss A
rea
Dev
elop
men
t Dis
tric
tW
ater
Sys
tem
Reg
iona
lizat
ion
Feas
ibili
ty S
tudy
Dis
infe
ctio
n Te
chni
que
for B
WSC
Par
ticip
ants
File
No.
112
03.3
0507
Dat
e: J
anua
ry 7
, 200
4
PR
OP
OS
ED
EX
ISTI
NG
WA
TER
LIN
ES
LEG
EN
D
WA
TER
LIN
ES
RIV
ER
S
SH
ELB
YV
ILLE
MT.
STE
RLI
NG
VE
RS
AIL
LES
LAW
RE
NC
EB
UR
G
WIL
MO
RE
BE
RE
ALA
NC
AS
TER
CY
NTH
IAN
A
GE
OR
GE
TOW
NP
AR
IS
WIN
CH
ES
TER
LEX
ING
TON
HA
RR
OD
SB
UR
G
NIC
HO
LAS
VIL
LE
FRA
NK
FOR
T
PR
OP
OS
ED
WTP
RIC
HM
ON
D
DA
NV
ILLE
DIS
INFE
CTI
ON
ME
THO
DS
BA
CK
UP
RA
W W
ATE
RS
UP
PLY
OH
IO R
IVE
R
CH
LOR
AM
INE
FRE
E C
HLO
RIN
EW
ILLI
NG
TO
SW
ITC
HTO
CH
LOR
AM
INE
UN
WIL
LIN
G T
O S
WIT
CH
TO C
HLO
RA
MIN
E

Water System Regionalization Feasibility Study
Final Draft ReportJanuary 7, 2004 28
consecutive systems with multiple sources. Responsibility to ownand maintain the monitoring network could likely remain with theretailers, except on BWSC mains. However, given the complexityof the grid water quality issue, the Consultant Team suggestsBWSC consider offering on-line water quality monitoring to assistin assuring compliance for all participants for selected parameters. Further, we suggest BWSC offer voluntary responsibility forgeneral oversight of grid water quality for participants. In this way,BWSC could proactively manage distribution water quality, andhelp identify and address water quality problems on a regionalbasis.
Several meetings and conference calls were held with KDOW to addressthese concerns. Based on these discussions, it was concluded that the gridnetwork concept is not fatally flawed and that these issues could beaddressed in future phases of work.
4.3. Summary of grid benefits
In summary, the grid network provides immediate and long-term benefits:
• Peak day attenuation. Water system facilities are typically sizedto provide the peak day demand. Because the BWSC utilities arenot likely to have their peak water demands all occur on the sameday, the size and cost of treatment plants, pumping stations andpipelines can be reduced.
• Optimize use of existing sources. The grid provides the networkof piping needed to deliver water from existing sources to whereit is needed.
• Grant funding. The possibility for grant funding and low interestloans is enhanced by the regional approach afforded by the gridsystem.
• Economy of scale. A single large additional source of supply willprovide economy of scale in comparison to construction andoperation of new, small supply projects by each of the BWSCparticipants.
• Reliability of multiple sources. The grid network allows waterfrom multiple sources to be fed into the grid thereby minimizingthe potential for a water supply interruption due to a chemical spillor facility outage.
• Ease of phasing regional growth. The grid network providesflexibility in accommodating changes in growth areas as well asconnections to utilities beyond the BWSC.

Water System Regionalization Feasibility Study
Final Draft ReportJanuary 7, 2004 29
5. Financial
The objective of the financing evaluation was to develop a plan that isaffordable and fairly apportions costs. The primary financial issuesaddressed in this study can be stated quite simply:
• From a financial perspective, why should we build a regional watersupply?
• How will BWSC obtain the capital funds to build the new regionalwater supply and pipeline grid?
• How will BWSC raise revenues to repay borrowed capital fundsand pay ongoing operating costs?
• What financial impact will the new water supply have on the ratesand customer bills of participating communities?
While the questions and answers may sound simple, there is considerablecomplexity in how the funding and revenue approaches are addressed.
5.1. Financial benefits of a regional water supply
In the traditional approach to developing new water supplies, mostcommunities would develop their own individual supplies with sufficientcapacity to meet their present needs as well as some amount of their futureneeds. In some cases, two or more communities might cooperate todevelop a supply. The most widely used source of water supply for centralKentucky is the Kentucky River. However, the Kentucky River hasinsufficient supply to meet the region�s growing water needs during adrought. Further, there exists a water treatment plant capacity deficit. Theregion�s most abundant source is the Ohio River, but it is not in proximityto the communities that need water, and building facilities for individualcommunities to treat and transport quantities of water from this remotesource is expensive and inefficient. Instead, a broad coalition ofcommunities and interested groups have moved toward development of aregional water supply to address the water needs in the region. There areseveral advantages to this approach:
• Economies of scale � It is generally less expensive to build andoperate one large water treatment plant and distribution systemthan to build numerous small systems that collectively provide thesame quantity of water.

Water System Regionalization Feasibility Study
Final Draft ReportJanuary 7, 2004 30
• Better financing terms � Lenders generally view a larger waterutility as a better credit risk than numerous small utilities, and willtherefore generally offer better lending terms to a larger utility.
• Lower unit operating costs � Many of the costs related to treatingand distributing water are fixed; that is, they don�t change with thequantities of water produced or treated. Generally, the larger thenumber of customers among whom costs can be shared, the lowerthe unit cost (i.e., the cost per gallon). Larger water systemsgenerally spend less per gallon in response to new regulatory andenvironmental standards.
• Reliability � A grid system that connects multiple water suppliesis inherently more reliable than a community which relies on asingle source of water supply. It can be prohibitively expensive foran individual community to develop standby water sources.
• Efficiency � A single-purpose organization such as a regionalwater supply agency can focus its energy and attention on doingjust one thing, and does not have to spend time and money dealingwith the many issues that face a �full-service� local government.
In summary, there appear to be number of financial benefits associated withdeveloping additional water supply on a regional basis, compared with eachcommunity developing their own additional supplies.
5.2. Funding new water supply facilities
The cost to design and construct a new water supply and pipeline grid toserve central Kentucky will be significant, costing as much as $200 millionto $300 million. This is a major expenditure for any utility or group ofutilities, and BWSC will aggressively seek ways to reduce the costs of thisproject, which may include the following:
• Maximum use of grants and other external funding � BWSC willaggressively seek capital funding from federal and state agencies. The participation of relatively small and distant communities inBWSC will help increase the probability of grant funding fromboth federal and state agencies. The nature of the proposed watersystem grid is consistent with State Regionalization InitiativeLegislation and should enhance the ability of BWSC to receivefunding through the KIA.
• Direct appropriation � In addition to the pursuit of grants, localofficials representing BWSC communities will aggressively seekthe inclusion of directly appropriated (�earmarked�) funds in

Water System Regionalization Feasibility Study
Final Draft ReportJanuary 7, 2004 31
Congressional spending bills. This approach can expediteconstruction, because it eliminates the need to submit competitivegrant applications. It must be pointed out, however, that thecurrent federal deficit makes it increasingly difficult to obtain thistype of funding.
• Low interest loans � After exhausting available grant funding anddirect appropriations, low interest loans from USDA�s RuralUtilities Service (successor to the Farmers Home Administration),state revolving loan funds (SRFs), KIA, and other federal loanprograms will be aggressively pursued.
• Issuance of long-term debt � Based on firm commitments from itsmembers, BWSC will issue long-term, tax-exempt debt in the formof revenue bonds. These bonds will be guaranteed by the revenuesderived from the sale of water. The bonds will not be guaranteedby property taxes or other tax revenues.
The interest rate attached to long-term debt is determined by the lendersview of the risks related to the loan. Generally, water bonds are consideredto be relatively low-risk, because water is a necessary commodity, there isno commodity to substitute for the role of water, and water systems aregenerally monopolies. In order to provide assurance to lenders that theirloan (the bonds) is likely to be repaid, BWSC will require long-termfinancial commitments from its members. Each utility member of BWSCwill agree to purchase each year a specific minimum quantity of water ona �take or pay� basis. This guarantee will provide security (�collateral�) forthe issuance of bonds to build BWSC�s facilities. Payments for waterpurchase commitments will not begin until the water is available to themember or customer. However, there will be some start-up costs incurredbefore water can be delivered; these costs will likely be paid for by grantsand loans or by a combination of grants, loans, and local cashcontributions.
5.3. Revenue requirements needed to pay capital and operating costs
BWSC will generate the revenues needed to pay for its capital andoperating costs from three principal sources:
• �Take or Pay� contracts - As discussed above, each utility that isa member of BWSC or which otherwise enters into a long-termwholesale purchase contract will commit to paying for a certainamount of capacity that will be reserved for that member, and willcommit to taking a minimum daily quantity of water. Theminimum daily purchase will keep the water in the grid �fresh� tohelp maintain acceptable water quality. These commitments willbe the principal determinant for the timing of the new BWSC water

Water System Regionalization Feasibility Study
Final Draft ReportJanuary 7, 2004 32
supply facilities, as well as the service area of the BWSC pipelinegrid that will be built.
• Sale of surplus water � To the extent that BWSC has more capacitythan its members and long-term wholesale customers require, itwill sell surplus water on both a short- and long-term. The revenuefrom such sales will be used to retire debt or pay for improvementsto BWSC�s facilities.
• Sale of backup water supply � Some existing utilities may notchoose to buy water on a �take or pay� basis, and may want onlyto have a backup source of water available in cases of shortages oremergencies. BWSC should consider such arrangements as ameans of achieving regionalization; however, back-up suppliescannot be "guaranteed" unless the utility financially commits to thedesired capacity. The utilities wanting this type of arrangementmay have to pay a price that is substantial, because BWSC mustbuild and have available the guaranteed capacity even when�backup� customers do not need or use water.
BWSC will not have any taxing authority. Rather, it will rely on long-termcontracts with its members and other wholesale customers. Beyond theterms of the wholesale contracts, BWSC members will not be individuallyresponsible for long-term debt issued by BWSC to construct water supplyor pipeline grid facilities.
5.4. Financial impacts on water rates and customer bills
There are several factors that will affect the water costs for participatingcommunities of BWSC:
• No competition � BWSC will sell water on a �wholesale� basisonly, so there is no threat of BWSC competing with participatingcommunities or �stealing� retail customers from participatingcommunities. As a regional water commission organized under thelaws of Kentucky, BWSC cannot sell water on a retail basis, andBWSC will be effectively �owned� by its members.
• Non-profit organization � The new regional water system willoperate on a non-profit basis. That is, the wholesale water rateswill be set to recover its capital and operating costs, including anyreserves that might be required by bond covenants, loanagreements or good management practice, but it will not togenerate a �profit.� If a surplus is generated in any given year, itwill be used for only four purposes: (1) to pay off outstandingdebt; (2) to pay for new capital projects; (3) to minimize future rateincreases; or (4) as a reserve for infrastructure replacements.

Water System Regionalization Feasibility Study
Final Draft ReportJanuary 7, 2004 33
Therefore, BWSC will not artificially inflate the price of its waterto produce profits or dividends for its owners.
• Uniform rate � BWSC�s plan is to charge a uniform capacity feebased on the amount of capacity that a customer wants BWSC toprovide or reserve for that customer, plus an operating fee that istied to costs of operating the BWSC�s water facilities (intakes,pumping stations, treatment plant, and pipelines). BWSC�s policywill be to charge the same prices to customers with similar demandand usage characteristics. BWSC will use consistent unit capitaland operating costs to calculate bills for all members and long-termwholesale customers with �take or pay� contracts. BWSC willlikely use higher unit capital and operating costs to calculate billsfor customers who do not enter into long-term �take or pay�contracts.
The cost for the raw and finished water system facilities (intakes, treatmentplants, pumping stations, pipelines, etc.) includes the components neededto deliver the water up to the wholesale meter connection off of the gridnetwork. If the entire 45 mgd supply and grid system were to beconstructed and operated, the total annual cost is estimated atapproximately $16 million (Appendix K). The annual fees for purchasingwater from the grid network are currently estimated at $400,000 to$500,000 per one million gallons per day of committed capacity. Thisannual fee includes delivery of 200,000 gallons per day for each onemillion gallons per day of committed capacity. These annual fees areequivalent to about $1.83/1,000 gallons of water purchased if the customerpurchases their full committed capacity every day, or equal to about$6.16/1,000 gallons purchased if the customer only purchases the minimumcapacity (20% of the committed capacity). The �final� cost of water will beestablished by BWSC based on the actual costs to construct and operate theregional supply system, and based on the amount of �take or pay�commitments, which are formalized by binding contracts. BWSCrequested non-binding �letters of intent� from the BWSC Technical Groupin August 2003, and subsequently to the other utility participants, todetermine how much water each utility is interested in buying (AppendixP). As of January 2, 2004, the following utility members of the BWSChave signed non-binding commitments for a total of 31.755 mgd.
• City of Cynthiana � 0.5 mgd • City of Danville � 1 mgd• Frankfort Electric and Water Plant Board � 2 mgd • Georgetown Municipal Water and Sewer Service � 0.255 mgd • Kentucky American Water � 22 mgd • City of Lancaster � 0.5 mgd • Mt. Sterling Water and Sewer Commission � 1 mgd• Nicholasville Combined Utilities � 1 mgd

Water System Regionalization Feasibility Study
Final Draft ReportJanuary 7, 2004 34
• City of Paris � 0.5 mgd• Winchester Municipal Utilities Commission � 3 mgd
The specific financial impact (in terms of rates and customer bills) willtherefore vary from one utility to another. For example:
• Some utilities need more/less additional water, as a percent of thecurrent capacity, thereby requiring more/less additional revenue.
• Increased retail sale of water will produce increased revenuethereby reducing the need for increased retail rates.
• In some cases, the water purchased from BWSC might besubstituted for building or expanding a treatment plant forindividual utilities.
Further, some utilities may decide to use the new water for peak usageperiods only; other utilities may decide to use the new water for theirnormal �base� usage and operate their own treatment plants during peakdemand periods. Individual decisions related to use of the BWSC waterwill be made by each participating utility or community. This study canprovide approximate financial impacts on individual utilities, but eachutility will likely choose to perform its own detailed financial analysisbefore making its final decision.

Water System Regionalization Feasibility Study
Final Draft ReportJanuary 7, 2004 35
6. Ownership and management of water facilities
6.1. Evaluation of organization alternatives
A new organization will be formed to oversee management and operationof the proposed waterworks facilities. The organizational prioritiesincluded:
• Providing maximum local control.• Being eligible to issue tax-exempt debt.• Maximizing eligibility for State/Federal grants and low-interest
loans.• Minimizing regulation by external parties (PSC, federal agencies,
other Kentucky agencies).
A benchmarking survey was performed early in this study to identify andevaluate management and ownership alternatives for the participatingutilities (Appendix Q). Organizational and management issues that wereaddressed included:
• Organizational structure - Legal form of organization- Purpose of entity- Geographic service area- Authority- Independence
• Services to be provided- Potable versus non-potable water- Wholesale versus retail - Availability of supply- Reliability of supply- Water quality
• Financing- Issuance of debt- Operating revenues- Revenue sources- Guarantees- �Take or pay� contracts - Long-term versus short-term contracts- Rate approval process

Water System Regionalization Feasibility Study
Final Draft ReportJanuary 7, 2004 36
• Management philosophy- Lowest life cycle cost- Lowest rates over time- Use of reserves- Compensation policy- Key personnel- Procurement philosophy
• Governance- Board of Directors- Policy advisory board- Conflicts of interest
• Membership- Definition of members versus customers- Identity of initial members- Addition of members- Removal/Withdrawal of members
The BWSC participants considered several organizational alternatives:
• New traditional public agency under existing Kentucky RevisedStatutes:- Regional Water Commission (KRS 74.420-KRS74.520)- Interlocal Cooperation Agreement KRS (65.210)- Instrumentality of Governmental Agencies (KRS Chapter
58)The Regional Water Commission and the Instrumentality ofGovernmental Agencies were considered viable options, and wereretained for further evaluation.
• New public agency requiring special legislation - This option wasconsidered as a means for including both public and privateutilities as members. It carries some risk of delays, and KAW (themajor BWSC participant that is an investor owned utility) decidedthat they would participate without being a member of the regionalorganization. Therefore, this option was not carried forward forfurther consideration.
• Existing public agency such as KRA, KIA - None of the existingpublic agencies was carried forward because a sole purpose agencyfocused on water system ownership and operation was preferred.
• Non-public agency- Non-profit Corporation (KRS Chapter 273)- Contractual Agreement (Contract Law)- Partnership (KRS Chapter 362)- Unincorporated Association (Miscellaneous Laws and
Cases)None of the non-public agencies was carried forward for further

Water System Regionalization Feasibility Study
Final Draft ReportJanuary 7, 2004 37
consideration because they either involve limitations on tax exemptfinancing, or grant eligibility, or were viewed as unnecessarilycumbersome structures in comparison with a traditional publicorganization.
Based on a review of the advantages and disadvantages of each of theorganizational structures, two organizational alternatives were carriedforward for more detailed evaluation: (1) Regional Water Commission, and(2) Instrumentality of Governmental Agencies (Appendix R). A matrixwas developed based on 30 evaluation criteria and used to compare the twoorganizational alternatives (Appendix R). Based on the outcome of thisevaluation, the Consultant Team recommended selecting a Regional WaterCommission as the preferred alternative. Some of the primary reasons forfavoring this alternative include: (1) its use optimizes local control withoutthe participating cities or other entities incurring any legal liability; (2) itsuse enables each member to have an equal vote; (3) its use ensurescontinued public support and accountability; and (4) its use ensuresimmediate acceptance and support of regulatory agencies. A RegionalWater Commission can not include investor owned utility members. However, KAW, the largest investor owned utility in the BWSC, hasagreed to participate as a long-term wholesale customer and contractualpartner, in lieu of membership. BWSC participants voted at Workshop No.5 to accept the recommendation to form a Regional Water Commission.
6.2. Regional Water Commissions
6.2.1. Characteristics of a Regional Water CommissionA Regional Water Commission, as formed under Chapter 74 of theKentucky Revised Statutes, is a distinct legal entity and is both a publiccorporation and a public agency. Its function is to enable two or moreutilities to jointly develop and operate sources of drinking water supply. The proposed name of the Regional Water Commission is the �BluegrassWater Supply Commission�.
6.2.2. Selection of the Commissioners and voting privilegesA Regional Water Commission must have at least five Commissioners whothen act as the Board of Commissioners to govern the Regional WaterCommission. Each member organization will be responsible for selectingits own representative (�Commissioner�) to the Board of Commissioners. Each member/utility�s representative must be appointed by the Mayor andapproved by the governing body � City Council or City Commission � ofthe City that owns the utility. Each commissioner will serve a four-yearterm, and commissioners may succeed themselves. Each memberorganization will have one voting representative on the Commission andeach member will have an equal vote on matters coming before theCommission.

Water System Regionalization Feasibility Study
Final Draft ReportJanuary 7, 2004 38
6.2.3. Financing and revenueSince the Bluegrass Water Supply Commission will be a governmentalagency, it will be eligible for tax-exempt financing, state and federal grants,and low interest loans. The Bluegrass Water Supply Commission will bea separate legal entity and, as such, will be responsible for its own debtsand legal obligations. Revenues derived from water sales will be used topay for operating expenses and to repay debts incurred by the Commission. The Board of Commissioners of the Commission will determine thewholesale rates that will be charged to utilities purchasing water from theCommission. The Commission is expressly prohibited from selling waterto individual, private customers. It can only supply water on a wholesalebasis to other utilities, which is one reason why the Commission will beexempt from regulation by the Public Service Commission.
A more detailed discussion of Regional Water Commissions is included inAppendix S.

Water System Regionalization Feasibility Study
Final Draft ReportJanuary 7, 2004 39
7. Public participation
The BWSC conducted a uniquely open study, with extensive opportunitiesfor input from the public, elected officials, and governmental agencies. Thepublic participation program consisted of the following:
• Public workshops and meetings• Newsletters/mailers/e-mail• Agency briefings and technical meetings• Extensive press coverage• Elected official, Council, Commission, and Board updates
A brief description of each of these elements follows.
7.1. Public workshops and meetings
A series of public workshops and "open house" style public meetingsfacilitated extensive public participation. Since November 2002, six all-day public workshops were held as shown in Table 4.
Table 4. Public workshopsWorkshop
No. Workshop Title Location Date1 Kickoff Lexington November 11, 2002
2 Benchmarking/Data Collection Georgetown January 8, 2003
3 Identifying Options/Preliminary Screening Frankfort March 14, 2003
4 Screening Technical Alternatives Nicholasville May 28, 2003
5 Decisions Winchester July 23, 2003
6 Conclusions Lexington October 13, 2003
Two public meetings were held at Henry Clay High School in Lexingtonduring the evening on August 6, 2002 and September 22, 2003.
These public work sessions and evening meetings provided a forum forcitizen input and other interested party input as well as an opportunity toask questions of BWSC�s participating utilities and the consultant. Copiesof the MS PowerPoint presentations and meeting summaries from the sixworkshops are included in Appendix T.
Water System Regionalization Feasibility Study
Final Draft ReportJanuary 7, 2004 40
7.2. Newsletters/mailers/e-mail
The Bluegrass Area Development District provided an update on the statusof the study in its bi-monthly newsletters, over 2,000 distributed mailerswith the announcements for upcoming meetings, and corresponded by e-mail with the public that attended the meetings.
7.3. Agency briefings and technical meetings
The BWSC held several technical meetings and provided updates on thestatus of the study to the Kentucky River Authority (KRA), KentuckyDivision of Water (KDOW), and Kentucky Infrastructure Authority (KIA).
• To communicate the status of the work on the study and requestcooperation and support, BWSC held a multi-agency meeting onJune 9, 2003 with Kentucky Department of EnvironmentalProtection (KYDEP), KRA, KIA, Economic DevelopmentAdministration (EDA), and Rural Development (RD). Meetingsummaries are included in Appendix U.
• A meeting with KRA was held on December 16, 2002 to discussthe status of the Kentucky River model, water supply, and watersupply alternatives (e.g., Lock and Dam No. 10).
• Several technical meetings were held with KDOW to address watersupply withdrawal permits for the Kentucky River, water supplyalternatives, and water quality of the grid network.
• As a follow up to the meeting on June 9, 2003, a second briefingwas held on August 21, 2003 with Kentucky Department ofEnvironmental Protection (KYDEP), KRA, KDOW, and KIA, todiscuss the findings through Workshop No. 5, and solicit furtherinput. Meeting summaries are included in Appendix V.
7.4. Extensive press coverage
Numerous articles were written in the area newspapers documenting thework completed and the upcoming meetings. A number of newspaperarticles are included in Appendix W. On the whole, press coverage waspositive.
7.5. Elected Official, Council, Commission and Board Updates.
Consortium members provided updates to their elected officials and theirCouncils/Boards throughout the study. On August 21, 2003, a meeting washeld exclusively for the purpose of briefing elected officials and their staffson the findings of the study through Workshop No. 5. There wasconsiderable discussion and input on how to approach grant-funding
Water System Regionalization Feasibility Study
Final Draft ReportJanuary 7, 2004 41
opportunities. BWSC members are continuing to communicate with theirCity Councils/Commissions/Boards, regarding the opportunity to makenon-binding commitments to purchase water from the future BluegrassWater Supply Commission.

Water System Regionalization Feasibility Study
Final Draft ReportJanuary 7, 2004 42
8. Conclusions
The objectives of the Water System Regionalization Feasibility Study havebeen met:
• BWSC has identified the Kentucky River Pool No. 3 withsupplemental raw water from the Ohio River as an alternative thatutilizes highly reliable sources of supply and is available within 3to 5 years !
• A grid network of water pipelines has been conceptuallyconfigured to optimize regional water supplies and move water towhere it is needed !
• The management/ownership approach based on the formation ofthe Bluegrass Water Supply Commission is fair and flexible !
• A financial plan has been developed that is affordable and fairlyapportions costs !
• BWSC has utilized a comprehensive program of publicparticipation and outreach to effectively communicate the studyprocess and findings !

Water System Regionalization Feasibility Study
Final Draft ReportJanuary 7, 2004 43
9. Next steps
The BWSC identified that the following key items need to be addressed inthe near term:
• Finalize the amounts of water each BWSC participant willcommit to purchase.
• Form the Bluegrass Water Supply Commission.• Establish funding so that planning and design of the proposed
facilities continues, particularly to implement near-termimprovements for communities with the greatest needs.
• Continue working with KDOW to formalize commitments onwater credits, Kentucky River Pool No. 3 permitting, Ohio Riverpermitting, and grid water quality.
• Pursue grant funding.
The Bluegrass Water Supply Consortium intends to move forwardaggressively with these and other action items. By endorsing therecommendations of this study, BWSC is �driving a stake in the ground�,completing the first step in the long process to bring ample potable watersupplies to the residents of central Kentucky.

Water System Regionalization Feasibility Study
Final Draft ReportJanuary 7, 2004 44
10. Bibliography
2000 Census Information.
Alvord, Burdick, & Howsen. June 1989. Lexington/LouisvilleTransmission Main Overview Study.
Alvord, Burdick, & Howsen. March 1990. Evaluation of Source of SupplyAlternatives.
Bluegrass Area Development District. 1997. Central Kentucky (Boyle,Garrard, Jessamine, Lincoln, and Mercer Counties) Phase I Water SupplyPlan, Final Plan Document.
Bluegrass Area Development District. February 1999. SoutheastBluegrass (Clark, Estill, Madison, and Powell) Phase I Water Supply Plan.
Bluegrass Area Development District. February 1999. West Bluegrass(Anderson, Franklin, Scott, and Woodford Counties) Phase I Water SupplyPlan.
Bluegrass Area Development District. June 1999. Anderson County PhaseII Water Supply Plan.
Bluegrass Area Development District. June 1999. Bourbon County PhaseII Water Supply Plan.
Bluegrass Area Development District. June 1999. Franklin County PhaseII Water Supply Plan.
Bluegrass Area Development District. June 1999. Jessamine CountyPhase II Water Supply Plan.
Bluegrass Area Development District. June 1999. Mercer County PhaseII Water Supply Plan.
Bluegrass Area Development District. June 1999. Scott County Phase IIWater Supply Plan.
Bluegrass Area Development District. June 1999. Woodford CountyPhase II Water Supply Plan.
Bluegrass Area Development District. 1996. Harrison � Bourbon �Nicholas Counties, Phase I Water Supply Plan, Final Plan Document.

Water System Regionalization Feasibility Study
Final Draft ReportJanuary 7, 2004 45
Bluegrass Area Development District. June 1999. Clark County Phase IIWater Supply Plan.
BWSC/PSC 2001 Correspondence.
C. J. Fuller Consulting Engineers. October 1989. Kentucky River Survey1989 Update of Locks & Dams 5 through 14.
C.J. Fuller Consulting Engineers, A.M. Kinney, Inc. and Legeay Inc. October 1989. Kentucky River Survey: 1989 Update of Locks & Dams 5through 14.
Daugherty & Trautwein, Inc. 1985. Kentucky River Survey,Rehabilitation Study for Locks and Dams 5 through 14.
Environmental Science & Engineering. 1991. Kentucky River AquaticStudy.
Environmental Science & Engineering. August 1991. Kentucky RiverAquatic Study.
Fayette County Water Supply Planning Council. 1999. Fayette County 20-Year Comprehensive Water Supply Plan.
Fuller, Mossbarger, Scott, & May. January 2000. Report of SiteExploration and Analysis/Design Criteria of Kentucky River Lock & DamNo. 10.
GRW Engineers. 1993. Kentucky River Pool 9 Capacity Study.
GRW Engineers. 1993. Pool 9 Capacity Survey.
HARZA Engineering Company, 1992, Source of Supply/Safe Yield Study.
HARZA Engineering Company, GRW Engineers, Inc. and ConstructionDynamics Group. 1990. Phase I Report: Water Demands and WaterSupply Yield and Deficit.
HARZA Engineering Company. 1991. Phase II Report: Development ofa Long-Range Water Supply Plan.
HARZA Engineering Company. November 1996. Feasibility andEnvironmental Assessment for Providing Additional Storage at
HARZA. May 1991. Phase II (Draft) Report � Development of LongRange Water Supply Plan.
Water System Regionalization Feasibility Study
Final Draft ReportJanuary 7, 2004 46
HARZA. November 1992. Source of Supply/Safe Yield Study.
HARZA. September 1990. Preliminary Long Range Water SupplyPlanning Study Kentucky River Basin Phase 1 Draft Interim Report WaterDemands and Water Supply Yield and Deficit, prepared for Kentucky RiverBasin Steering Committee.
KAWC Correspondence on Eagle Creek Lake.
KAWC. 1986. Least Cost/Comprehensive Planning Study.
KAWC. 1992. Least Cost/Comprehensive Planning Study.
Kentucky Division of Water. November 1997. Kentucky River BasinStatus Report.
Kentucky Geological Survey Carey, D. 1992. Water Quality in theKentucky River Basin.
Kentucky Geological Survey, Carey, D. 1990. Water AvailabilityModeling and Analysis of the Kentucky River.
Kentucky Geological Survey, Carey, D.I., Currens, J.C., Dinger, J.S., Kipp,J.A., Wunsch D.R. and Conrad, P.G. 1994. Groundwater in the KentuckyRiver Basin.
Kentucky Infrastructure Authority, et. al. 1999. Water ResourceDevelopment: A Strategic Plan.
Kentucky River Authority. 1995. Station Camp Creek Preliminary JacksonCounty Reservoir Site Analysis.
Kentucky River Locks and Dams 8-14.
Kentucky Water Resources Research Institute, University of KentuckyDept. of Civil Engineering and Kentucky Division of Water. 2000. 1998-1999 Monitoring Strategy: Kentucky River Basin Management Unit.
Kentucky Water Resources Research Institute. 1998. Kentucky RiverModeling and Monitoring Needs Assessment.
Kentucky Water Resources Research Institute. 1998. Kentucky RiverBasin Water Quality Assessment Study.
Water System Regionalization Feasibility Study
Final Draft ReportJanuary 7, 2004 47
Kentucky Water Resources Research Institute. 1999. Summary Report:1999 Kentucky River Watershed Watch Data Collection Effort.
Kentucky Water Resources Research Institute. 2000. Summary Report:2000 Kentucky River Watershed Watch Data Collection Effort.
Kentucky Water Resources Research Institute. April 2002. KentuckyRiver Basin Management Plan.
Kentucky Water Resources Research Institute. November 2002. Summary Report: 2002 Kentucky River Watershed Watch DataCollection Effort.
Kentucky Water Resources Research Institute. October 2001. SummaryReport: 2001 Kentucky River Watershed Watch Data Collection Effort.
Kentucky Water Resources Research Institute. 1996. Kentucky River BasinWater Supply Assessment Study.• Task I Report � Summary and Evaluation of Water Supply Studies for
the Kentucky River Basin• Task II Report, Part 1 � Evaluation of Water Supplies in the North,
South and Middle Fork Kentucky River Watersheds• Task II Report, Part 2 � Evaluation of Water Supplies in the Red River,
Dix River and Mainstem Watersheds of the Kentucky River• Task III Report � Deficit Analysis• Task III Report � KYBASIN User�s Manual: A Water Supply
Assessment Model for the Kentucky River Basin• Task III Report � Water Use Estimation and Forecasting for the
Kentucky River Basin• Task IV Report � KYROM User�s Manual: A Drought Management
Model for the Kentucky River Basin• Task V Report � Development and Evaluation of Water Supply
Alternatives• Task V Report � Estimation of the Responsiveness of Water Use to
Changes in Rates: A Methodology and Final Estimates Using KAWCData
Kenvirons. December 2000. Feasibility Study for the Jackson CountyLake Project and Alternatives.
KWRRI at University of KY. August 1996. Kentucky River Basin WaterSupply Assessment Study: Task III Report � Deficit Analysis.
Water System Regionalization Feasibility Study
Final Draft ReportJanuary 7, 2004 48
KWRRI at University of KY. December 1996. Kentucky River BasinWater Supply Assessment Study: Technical Appendix to Task III Report: Deficit Algorithm Methodology.
KWRRI at University of KY. December 1996. Kentucky River BasinWater Supply Assessment Study: Task V Report: Development andEvaluation of Water Supply Alternatives.
KWRRI at University of KY. June 1996. Kentucky River Basin WaterSupply Assessment Study: Draft Report � Executive Summary.
KWRRI at University of KY. June 1996. Kentucky River Basin WaterSupply Assessment Study: Evaluation of Water Supplies in the Upper Forksof the Kentucky River Basin.
KWRRI at University of KY. June 1996. Kentucky River Basin WaterSupply Assessment Study: Abstract: Water Use Estimation and Forecastingfor the Kentucky River Basin: A Preliminary Draft Report.
KWRRI at University of KY. September 1996. Kentucky River BasinWater Supply Assessment Study: Task III Report � Water Use Estimationand Forecasting for the Kentucky River Basin.
KWRRI at University of KY. August 1996. Kentucky River Basin WaterSupply Assessment Study: Task I: Summary & Evaluation of PreviousWater Supply Studies for Kentucky River Basin.
KWRRI at University of KY. December 1996. Kentucky River BasinWater Supply Assessment Study: Task II � Part 2: Evaluation of WaterSupplies in Red River, Dix River, and Mainstem Watersheds of theKentucky River.Navigation Modernization Feasibility Study Water Supply IncrementKentucky River. 1986.
Proceedings of the Kentucky River Basin Technical AdvisoryCommittee: Alternative Evaluation Workshop. July 1989.
Proceedings of the Kentucky River Conference, 1986.
PSC Case No. 93-434 � Brief of KAWC. July 1997.
PSC Case No. 93-434 � Brief of KAWC. October 1994.
PSC Case No. 93-434 � Direct Testimony of Attorney General�s Witness. March 1997.
PSC Case No. 93-434 � Direct Testimony of KAWC. February 1994.

Water System Regionalization Feasibility Study
Final Draft ReportJanuary 7, 2004 49
PSC Case No. 93-434 � Direct Testimony of KAWC. March 1997.
PSC Case No. 93-434 � Rebuttal Direct Testimony of Attorney General�sWitness. April 1997.
PSC Case No. 93-434 � Rebuttal Testimony of KAWC. August 1994.
PSC Case No. 93-434 � Transcript of Hearing. May 1997.
Rebmann, J. and Hassell, D. 1988. The Kentucky River: An Outline ofIssues for Water Supply Planning.
Rebmann, J.R. and Suzanne M. Kilner. 1987. A Multi-Purpose SurfaceImpoundment Proposal for the Kentucky River.
Shepherd Jack. June 1992. Report to Department of Natural Resources:Eagle Lake, Kentucky.
Tellus Institute. 1994. An Evaluation of Kentucky-American WaterCompany�s Long-Range Planning.
U.S. Army Corps of Engineers - Louisville District. 1990. Kentucky River.
U.S. Army Corps of Engineers, Louisville District. December 1997. Kentucky River Survey: Rehabilitation Study for Locks and Dams 5 through9.
U.S. Army Corps of Engineers. 1958. Review Report on Kentucky Riverand Tributaries for Flood Control and Allied Purposes.
U.S. Army Corps of Engineers. 1978. Metropolitan Lexington UrbanStudy: Water Resources Analysis.
U.S. Army Corps of Engineers. 1978. Special Report: Water SupplyAlternatives to Red River Lake.
U.S. Army Corps of Engineers. 1988. Interim Report Kentucky River andTributaries: Station Camp Creek, Kentucky Reconnaissance Report,Volumes 1-3.
U.S. Army Corps of Engineers. 1997. Upper Kentucky River Basin,Kentucky: Reconnaissance Phase Water Resources Study.
U.S. Department of Agriculture. 1981. Kentucky River Basin Report onWater and Related Land Resources.

Water System Regionalization Feasibility Study
Final Draft ReportJanuary 7, 2004 50
U.S. Geological Survey and Kentucky Natural Resources andEnvironmental Protection Cabinet. 1991. Evaluation of the DroughtSusceptibility of Water Supplies Used in the Kentucky River Basin in1988.
University of Kentucky College of Agriculture. March 1988. Prospectsand Impacts for Reservoir Location: Jackson County, Kentucky.
University of Kentucky College of Agriculture. May 1992. TheKentucky River Basin: A Land Use and Recreation Study for theKentucky River Authority.
University of Kentucky Department of Civil Engineering. November 2001. Impact of Raising Crest-Level of the Dam on North Fork Kentucky Riverin the Vicinity of Hazard Raw-Water Intake Tower.
U.S. Army Corps of Engineers � Louisville District. November 1990. Kentucky River Reconnaissance Level Cost Estimate Data.
U.S. Army Corps of Engineers � Louisville. January 1978. Special Report� Water Supply Alternatives to Red River Lake � Volume I � Main Report.
U.S. Army Corps of Engineers � Louisville. January 1978. Special Report� Water Supply Alternatives to Red River Lake � Volume II � TechnicalAppendices.
.U.S. Army Corps of Engineers � Louisville. March 1988. Station CampCreek, Kentucky, Interim Reconnaissance Report, Volume 4 � EngineeringDesign and Cost Estimates.
Waltman R.M. and R. Jan Stevenson. 1998. A Review of Research onthe Kentucky River Ecosystem