bluebookacademy.com - risk, return & diversification techniques
TRANSCRIPT

Risk, Return & Diversification Techniques

Learning Outcomes
•Measuring Risk and Return for Investors
•Portfolio Diversification
•Quantitative Techniques: Correlation & Regression
•Alternative Risk Measures

Fundamental Investor Preferences
1. Investment decisions are made on the basis of the return and risk of an investment.
2. Investors like to maximise their utility.
3. Investors prefer less risk to more risk - risk averse.
4. Return is viewed as a set of probabilities that certain outcomes will occur.
5. Risk is measured as the standard deviation of expected returns.
What we know about investors (Markowitz Model):
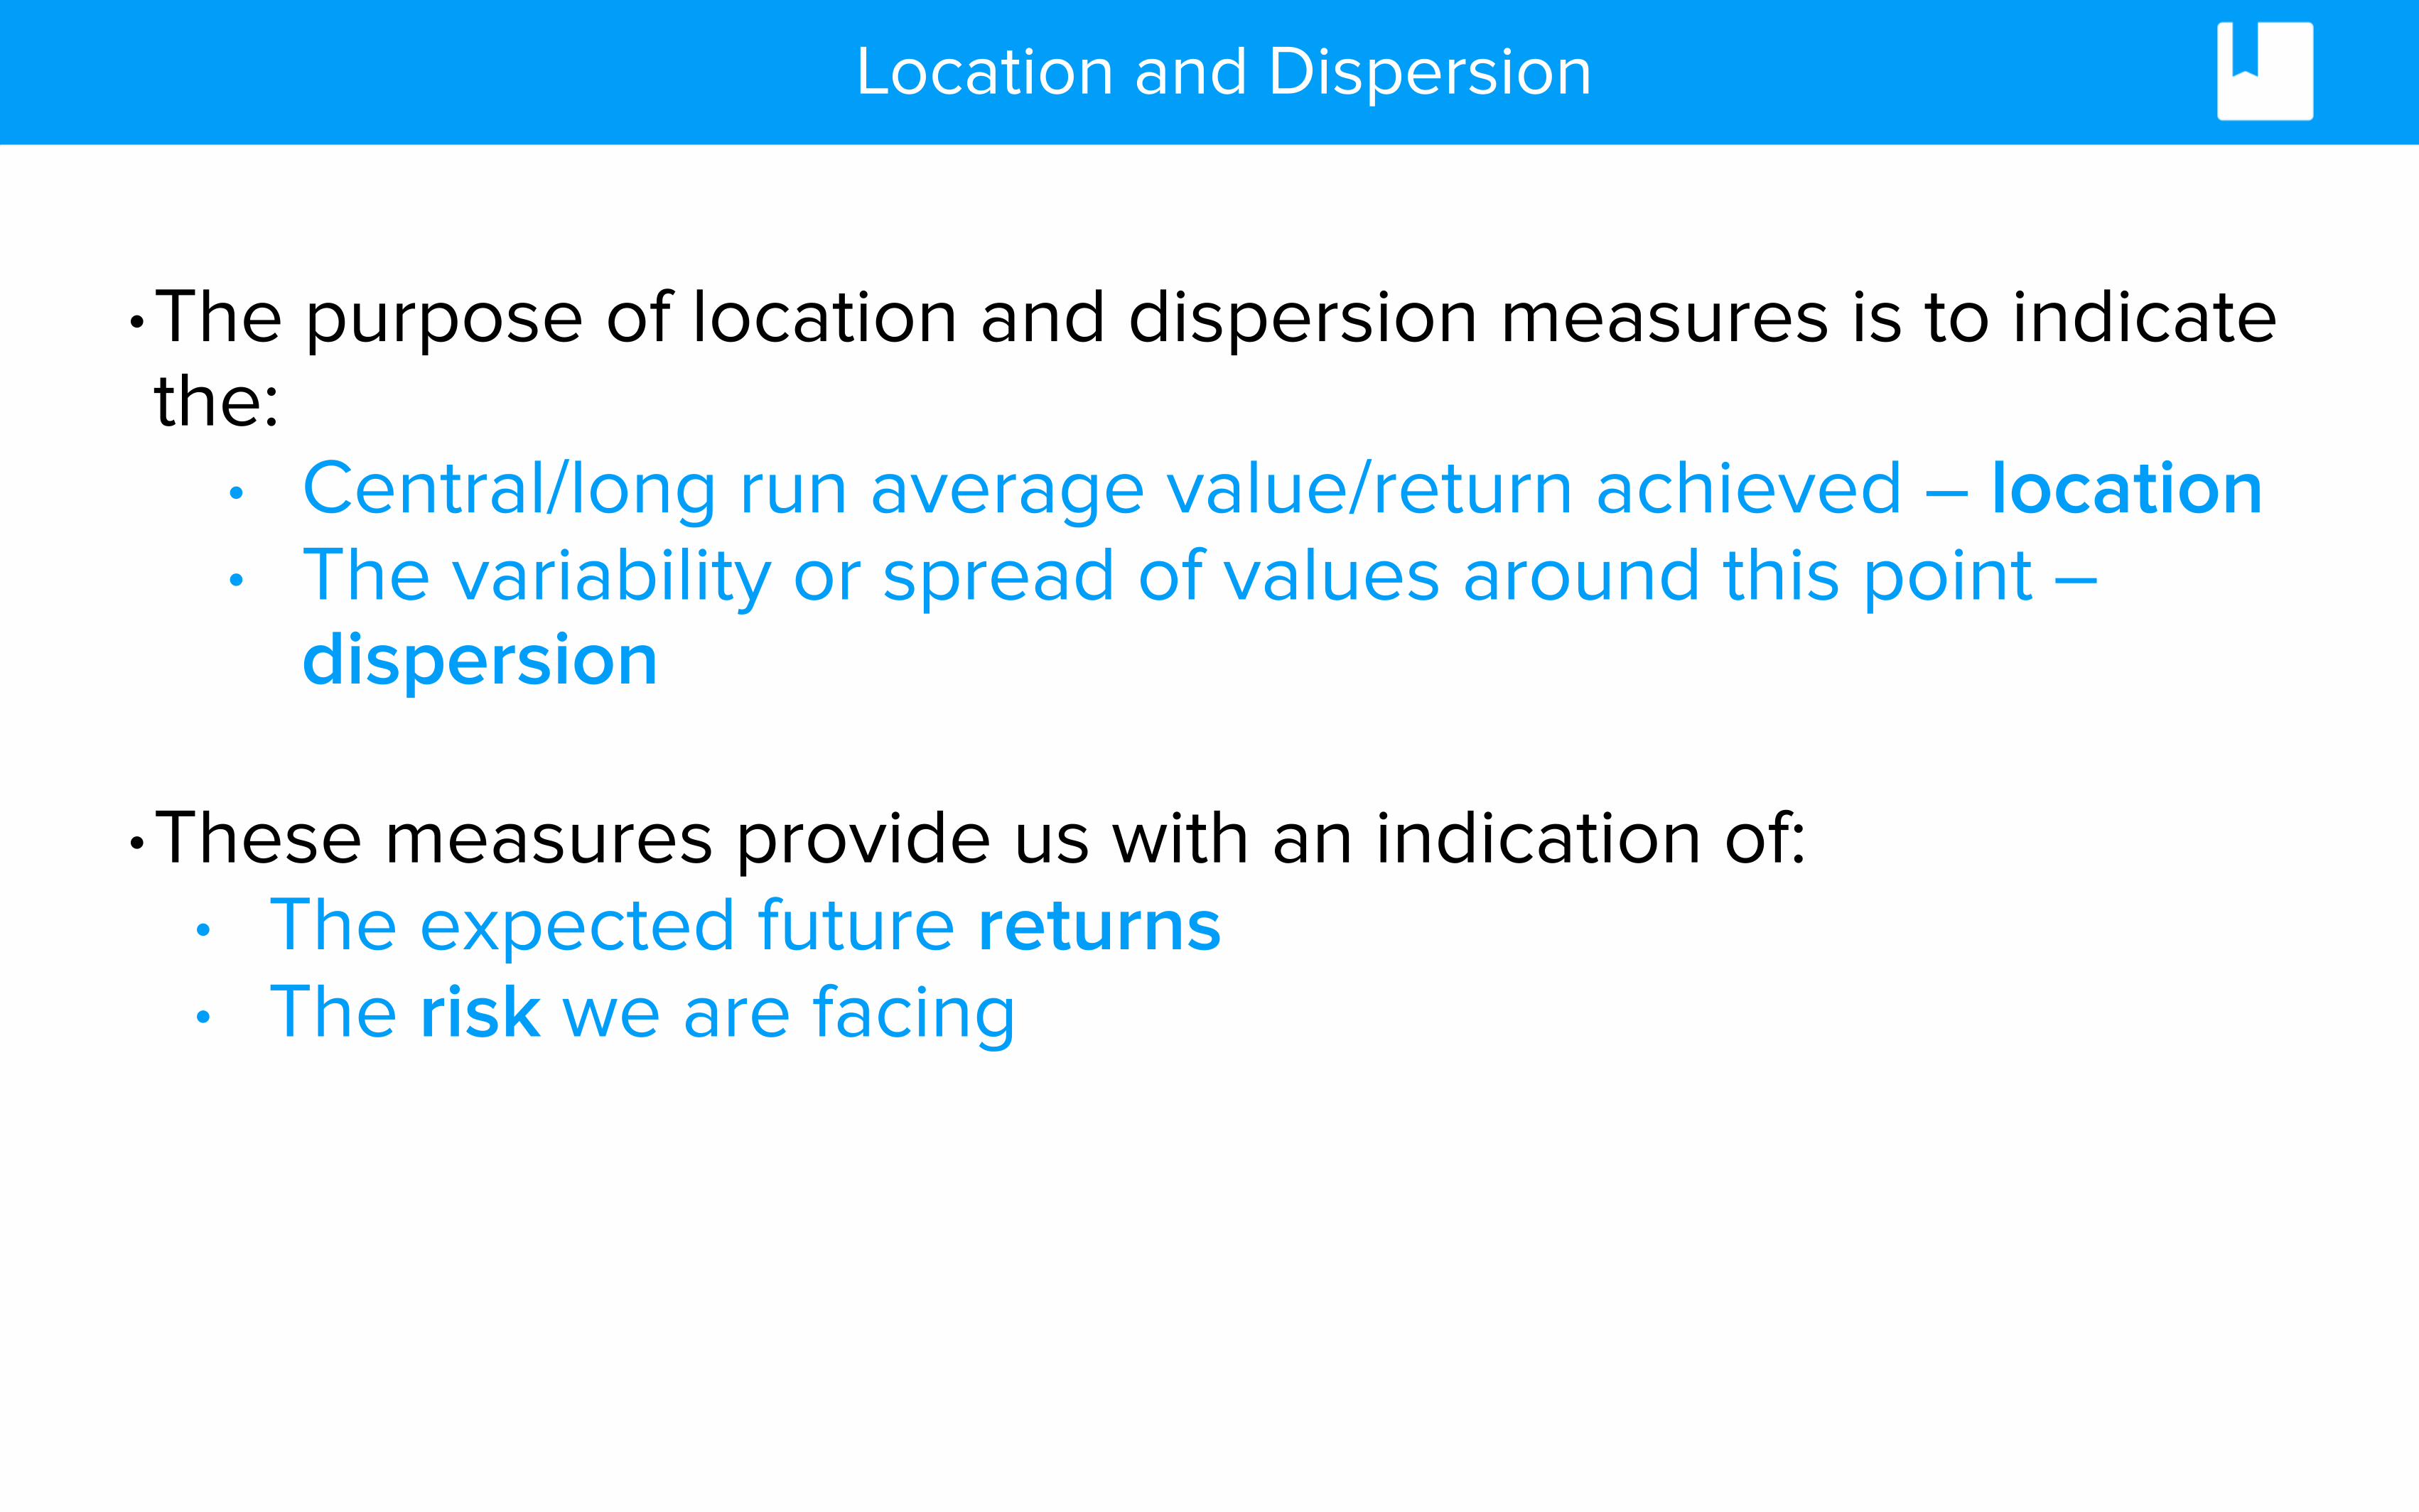
•The purpose of location and dispersion measures is to indicate the:
• Central/long run average value/return achieved – location • The variability or spread of values around this point –
dispersion
•These measures provide us with an indication of: • The expected future returns • The risk we are facing
Location and Dispersion

Measurement of Risk & Return
The most commonly used measure of risk in investment analysis and fund management:
Expected Return – Mean (A location measure)
Measure of Risk – Standard Deviation (A dispersion measure)

Expected Return
The expected return for an asset can be determined using the below formula:
E(R) =P1R1 + P2R2 + ...PnRn
Pi = Probably of an outcome occurring Ri = Return from the outcome

Sources of Risk
Uncertainty of income
Interest rates
Inflation
Exchange Rates
Tax rates
Economic state
Default Risk
Liquidity Risk
Factors contributing to risk in investment returns:

Example: Expected Return
A company’s stock is expected to generate the following returns with attached likelihood (probability):
Expected Return Probability
-20% 30%
0% 10%
10% 40%
20% 20%
What is the stock’s expected return?
(0.30x −0.20)+ (0.10x0)+(0.40x0.10)+ (0.20x0.20)
=2.0%

•Standard deviation is a dispersion measure that is related to the arithmetic mean.
•The idea is to establish how far each observed value falls from the mean – standard deviation measures this divergence.
•The greater the divergence of the observed value from the mean, the greater the standard deviation.
Dispersion Measures

Standard Deviation
Standard deviation and variance are key measures of an asset’s risk.
It is a measure that is used to quantify the amount of variation or dispersion of a set of values from its expected (mean) return.
σ2 = Pi(Ri −E(R)#$
%&2
∑

Steps to Calculate Standard Deviation
1. Calculate the mean (expected return) of a set of data.
2. Calculate the difference between observed values and the average.
3. Square the differences to remove negative signs and multiply them by their probabilities.
4. Sum the figures and take the square root.
σ2 = Pi(Ri −E(R)#$
%&2
∑

Example: Standard Deviation
Expected Return Probability
-20% 30%
0% 10%
10% 40%
20% 20%
What is the stock’s variance and
standard deviation?
Using our previous example and its results:

Example: Standard Deviation
Expected Return Probability
-20% 30%
0% 10%
10% 40%
20% 20%
Variance = 2.36% Standard Deviation = 15.36%
(0.30)(−0.20−0.02)2 + (0.10)(0−0.02)2 + (0.40)(0.10−0.02)2 + (0.20)(0.20−0.02)2

Portfolio Returns
If we are analysing a portfolio which holds two assets, the expected return of the portfolio is calculated as follows:
E(Rp ) = w1E(R1 )+w2E(R2)
Asset value / Total portfolio value
Expected Return on an Asset

Example: Portfolio Returns
E(Rp ) = w1E(R1 )+w2E(R2)
An investor holds 40% of his portfolio in a stock with an expected return of 10% and the balance in a stock with 20% expected return.
What is the portfolio’s expected return?

Reducing Risk - Diversification
•By spreading a total investment over several securities which offer the target level of return, we can achieve the same return at lower risk.
•Therefore: Diversification reduces risk without necessarily reducing returns.
Reducing Risk - Diversification
What is diversification?
The process of combining a variety of assets to a portfolio to reduce risk.

Reducing Risk - Correlation & Regression
•To track how a stock moves with the broader market (eg. S&P500, FTSE100):
•Correlation measures the strength of the relationship between two variables.
•In the context of regression analysis, the correlation coefficient gives an indication of how accurately the regression line matches the observed values.

Regression and correlation analysis provides the means to establish whether a relationship exists between two factors:
•Regression – the equation of the line of best fit mathematically
•Correlation – an indication of the accuracy or strength of a relationship between two factors.
Measuring Relationships
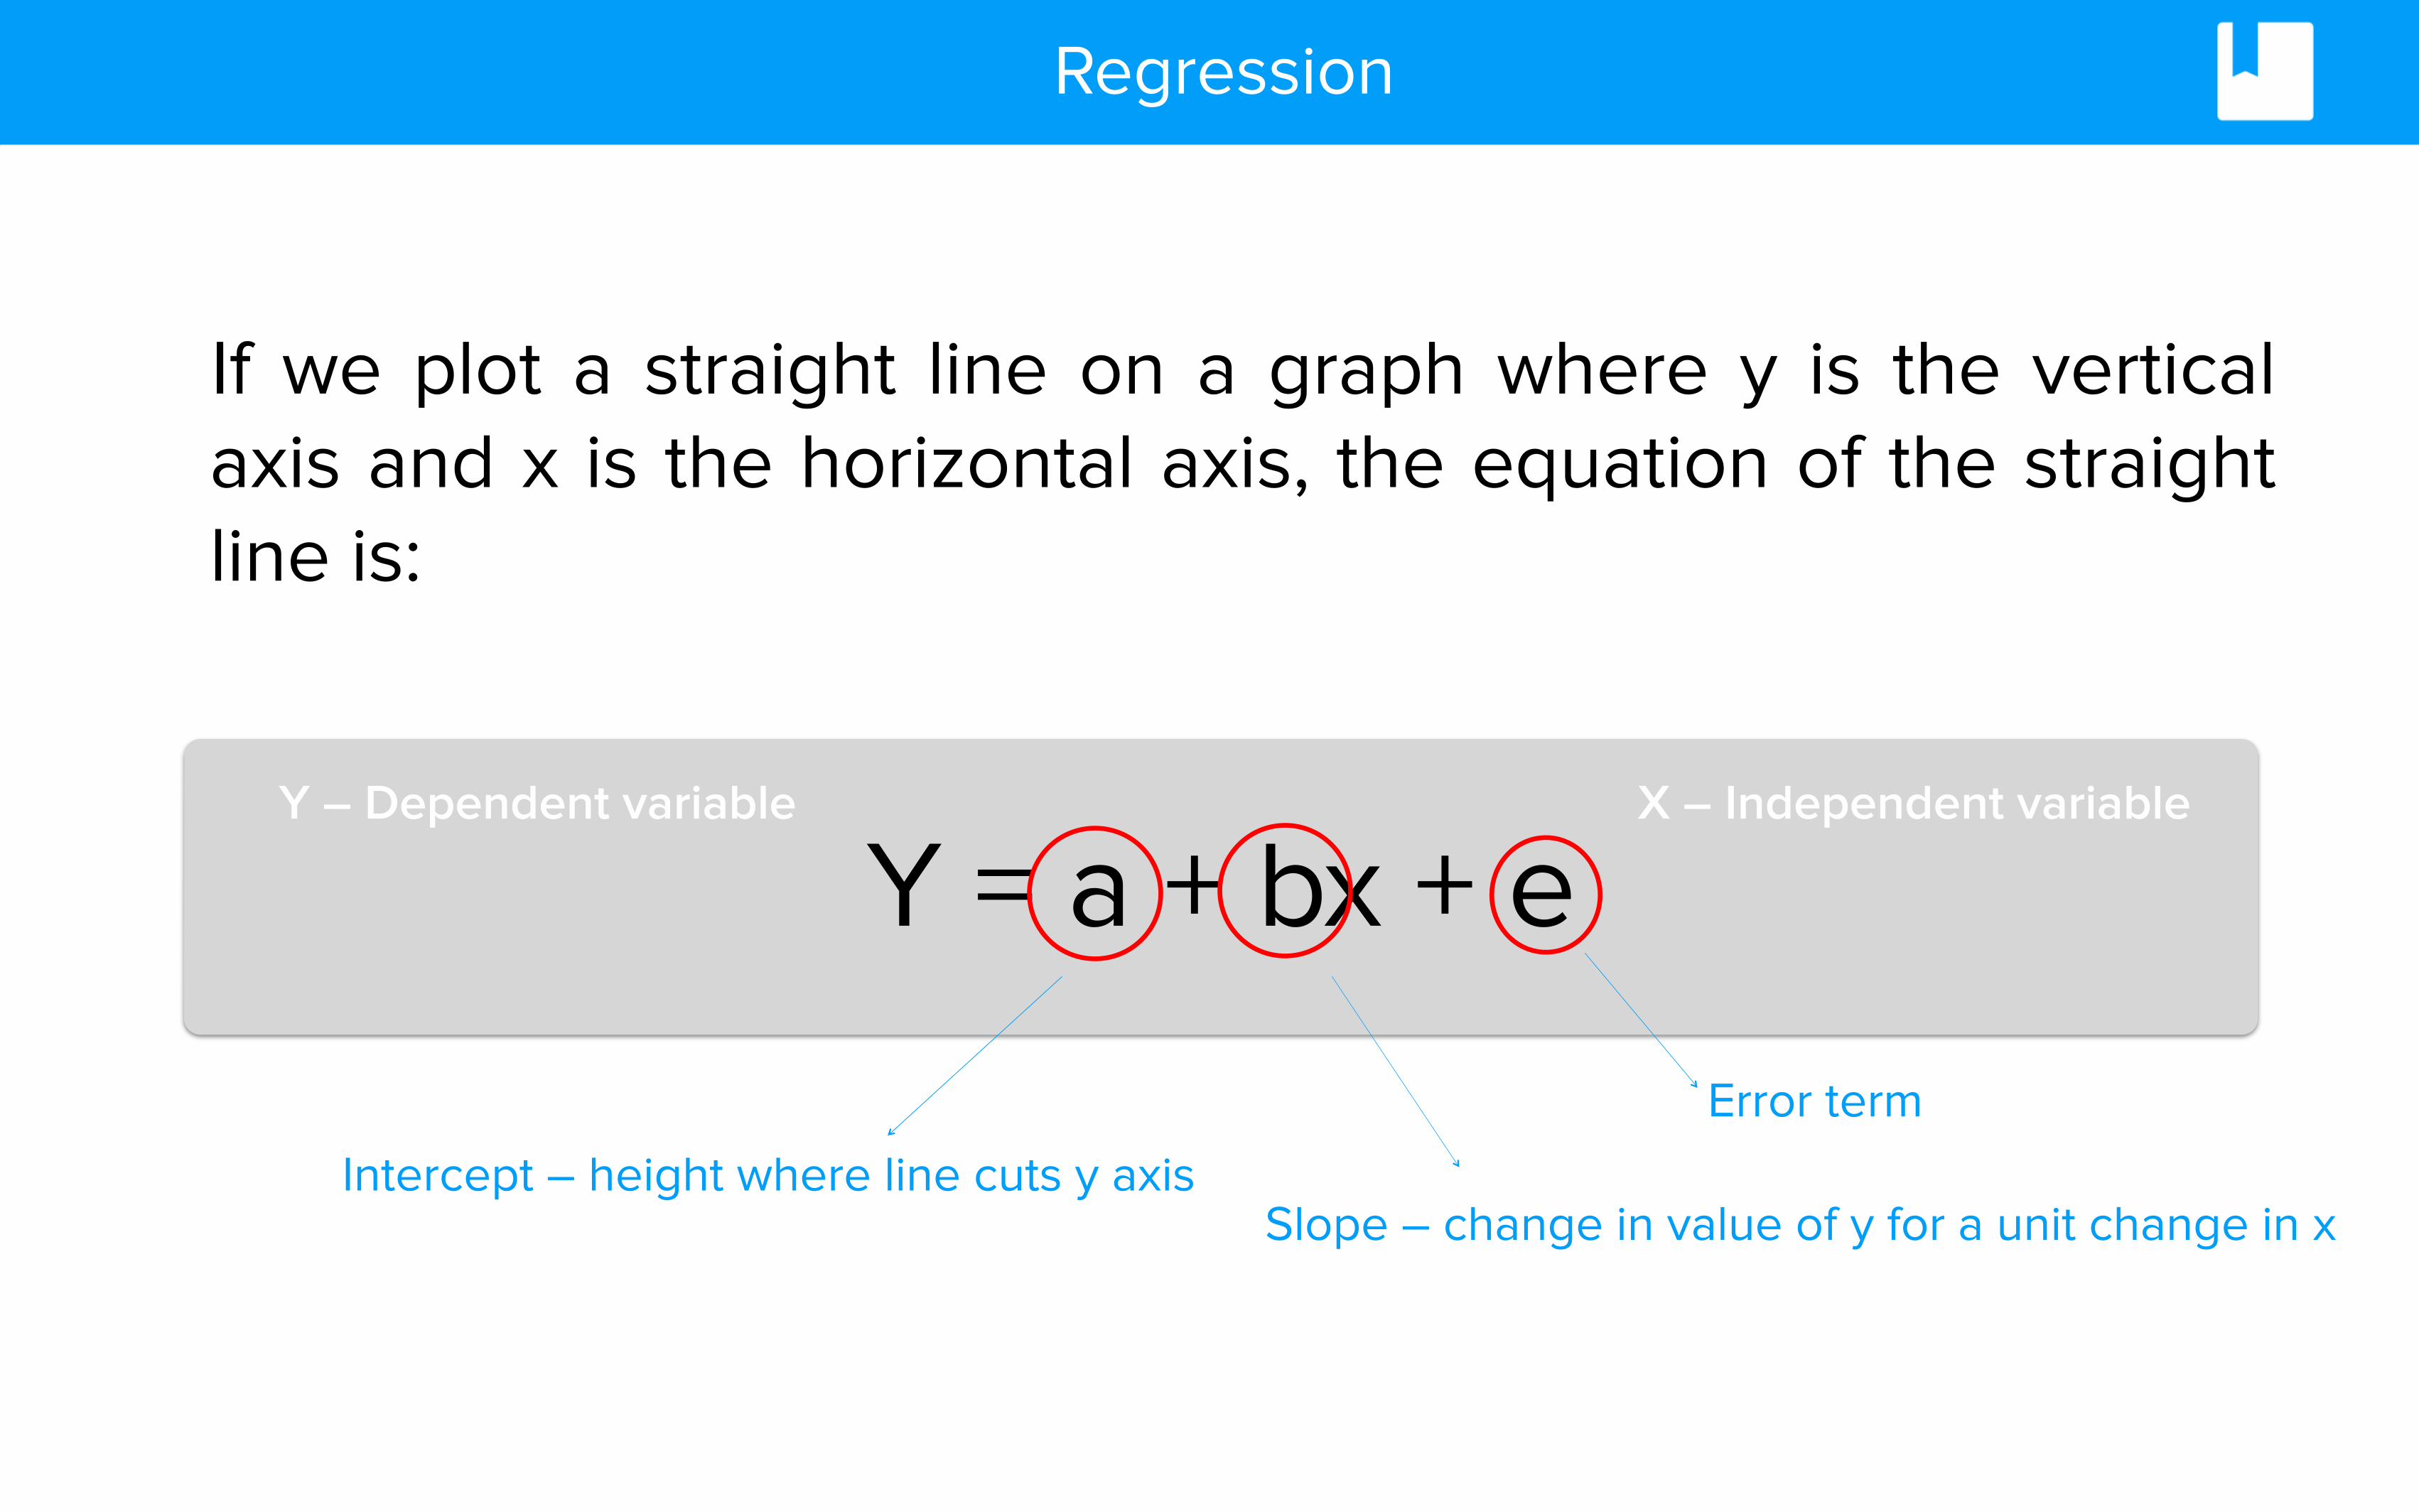
If we plot a straight line on a graph where y is the vertical axis and x is the horizontal axis, the equation of the straight line is:
Y = a + bx + eX – Independent variableY – Dependent variable
Intercept – height where line cuts y axis Slope – change in value of y for a unit change in x
Error term
Regression

•The method of estimating the parameters a and b is the least squares method ie. the line of best fit.
•Minimising the sum of the vertical distances of each value from the straight line drawn. Minimising the sum of the squared errors.
Least Squares Regression
The objective is to minimise the errors from the regression line

Reducing Risk - Correlation
•Values used to measure the relationship between two variables are called correlation coefficients.
•Positive correlation implies returns move up or down together.
•Negative correlation implies returns move in opposite directions.
•The closer to value of 1, the stronger the relationship.

Correlation
• Graphically, correlation can be viewed as:
Positive Correlation No CorrelationNegative Correlation

Interpreting Correlation
• What is the link between correlation and diversification?
• Returns move up or down together in equal and opposite direction.
• Perfectly offsets gains/losses in one position.
Perfect Negative Correlation
(-1)
Uncorrelated (0)
Perfect Positive Correlation
(+1)
• Returns move independently of each other.
• Some diversification of gains/losses by adding another security.
• Returns move up or down together in proportion.
• No diversification gains by adding another security.
Calculating Correlation Coefficients
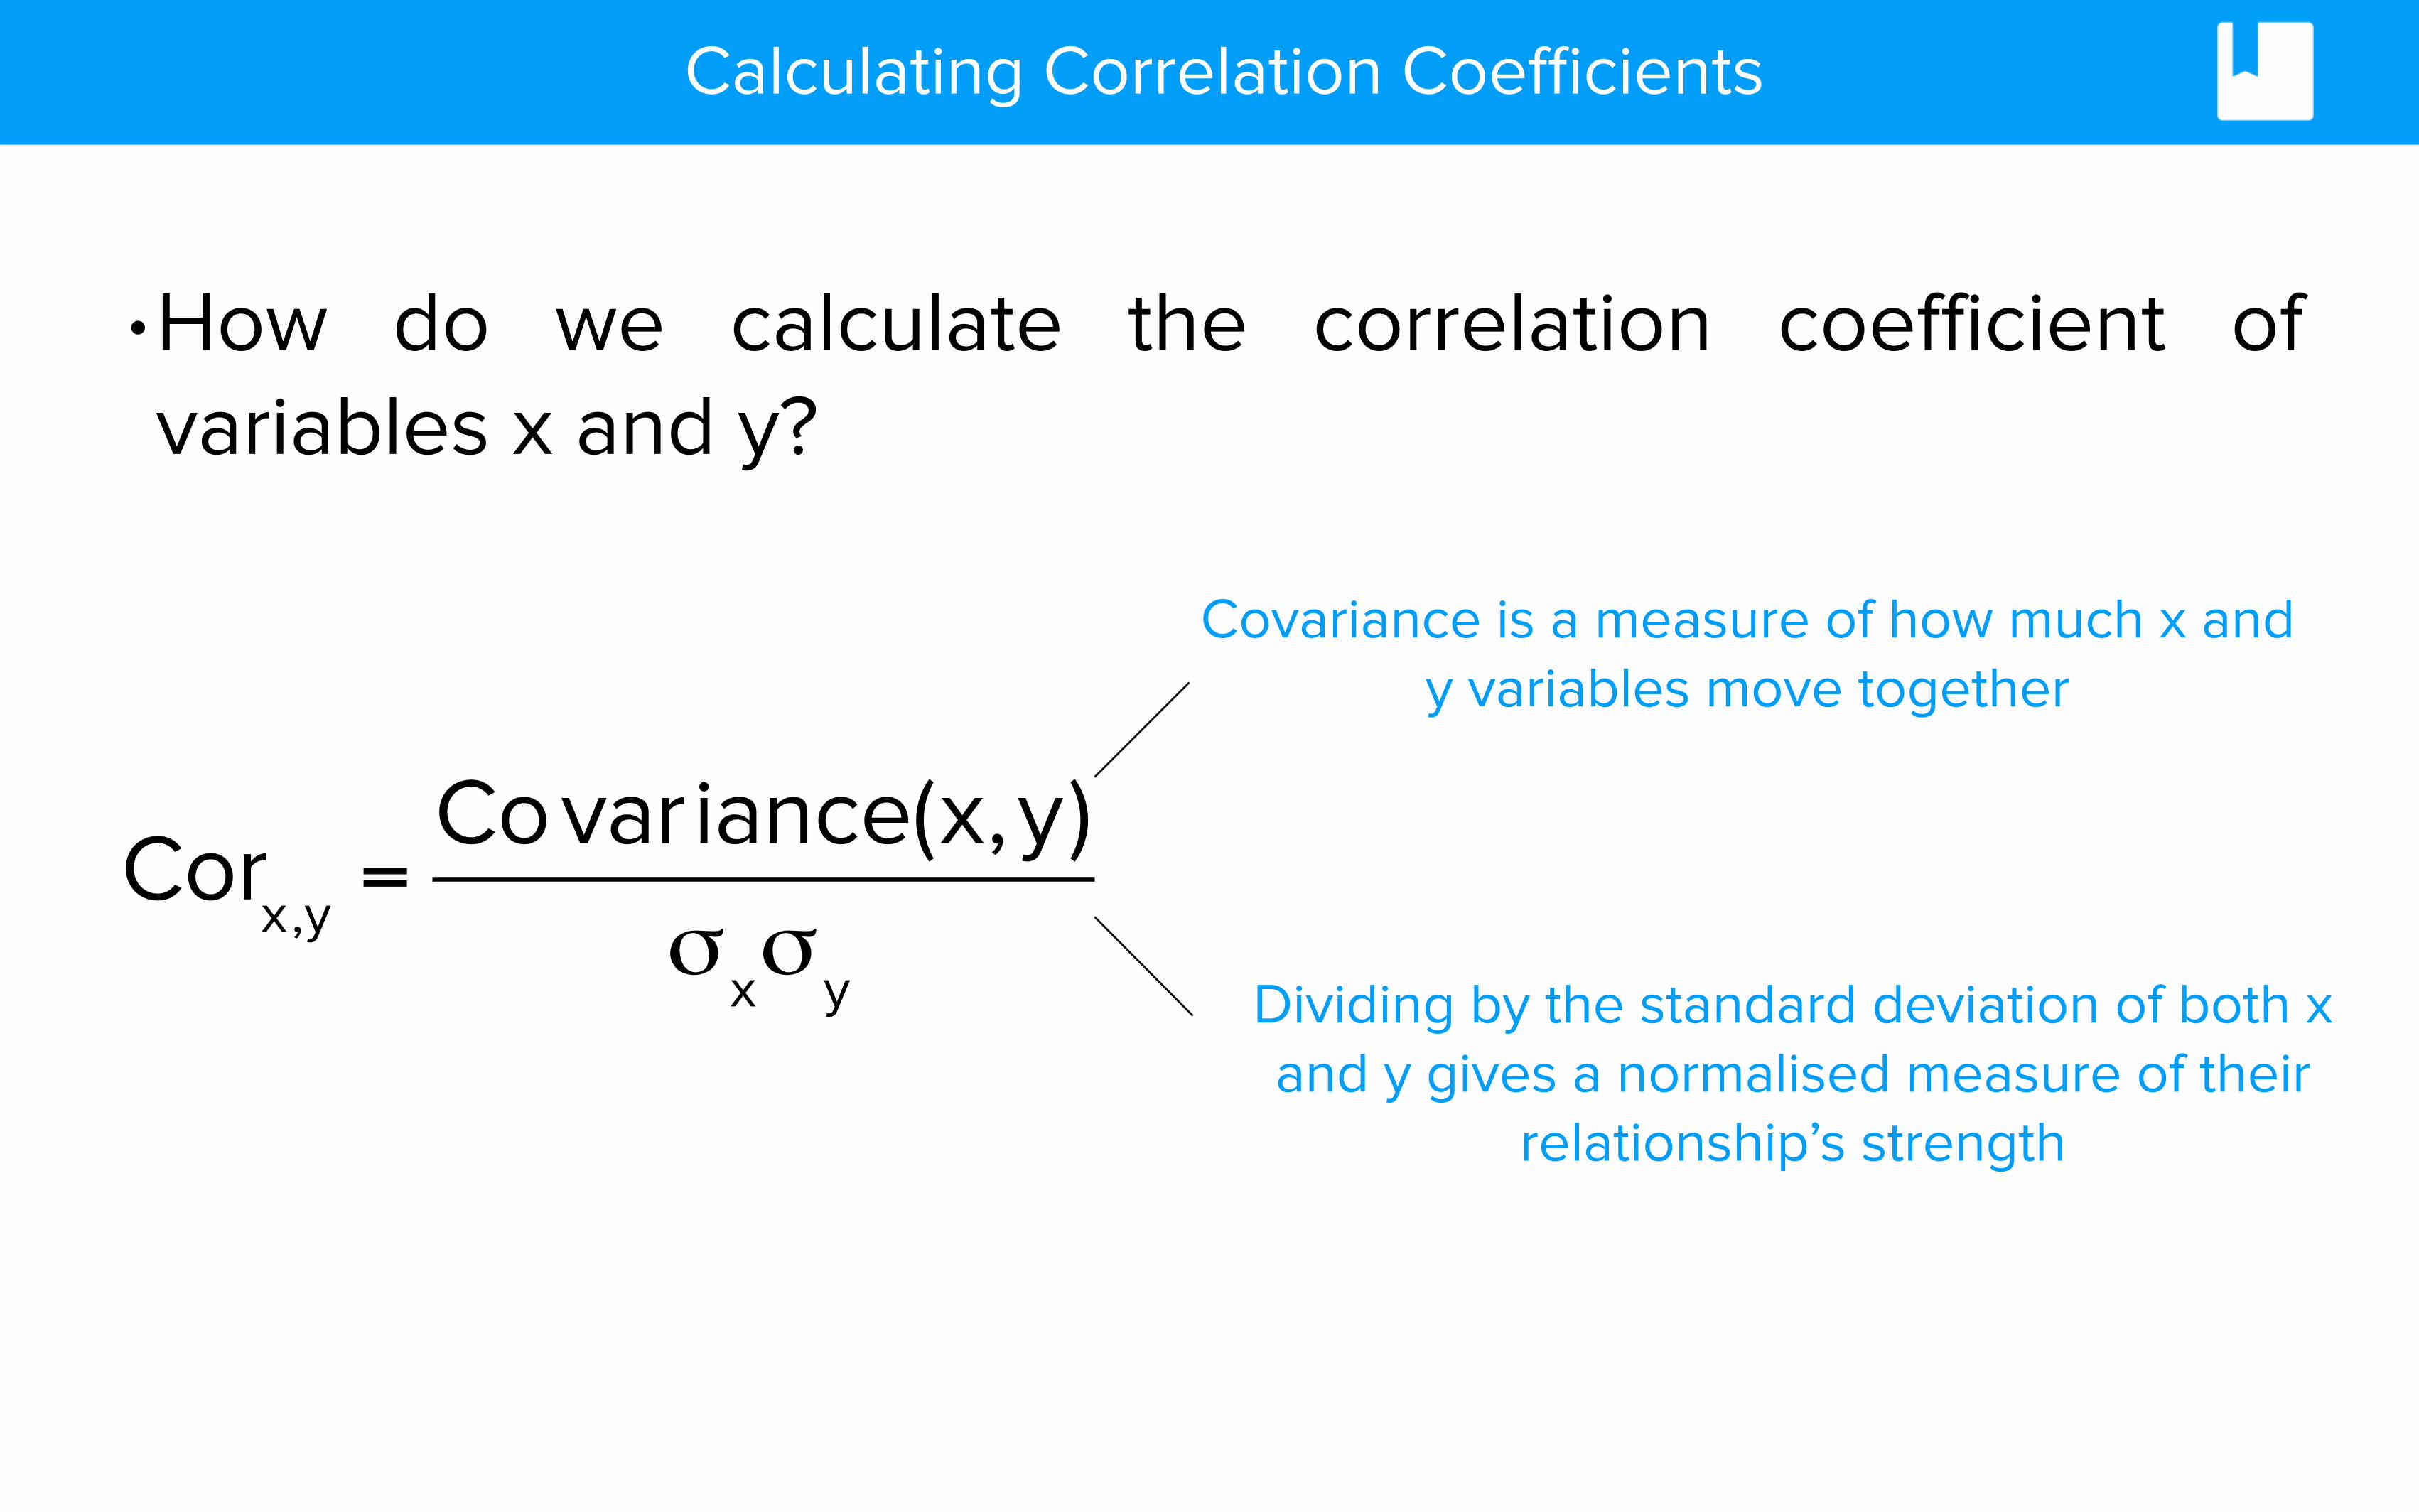
•How do we calculate the correlation coefficient of variables x and y?
Corx,y =Covariance(x,y)
σxσy
Covariance is a measure of how much x and y variables move together
Dividing by the standard deviation of both x and y gives a normalised measure of their
relationship’s strength

Reducing Risk - Correlation
By increasing our level of diversification, we reduce risk.
Can we completely eradicate all investment risk?

Nature of Risk
Total Risk of Investment σi
Systematic / Market Risk σs
Idiosyncratic / Specific Risk σu
Cannot be reduced through diversification
Can be reduced through diversification

Systematic Risk
What is Systematic Risk?
Market volatility caused by macroeconomic (broader market) factors which affect all assets
Idiosyncratic Risk
What is Idiosyncratic (Specific) Risk?
Risk that is specific to an asset and is uncorrelated to systematic risk.

Nature of Risk - Consequences
• An undiversified investor faces full risk, σi
• A diversified investor has only systematic risk - σs
σi2 = σs2 + σu2
Total risk:

Measuring Portfolio Risk
•To measure portfolio risk requires: • (i) weights of the assets in the portfolio • (ii) the variance of each asset, and • (iii) the correlation between the two assets
Portfolio Variance = w12σ2
1 +w22σ2
2 +2w1w2Cov(R1,R2)
Portfolio Variance = w12σ 1
2 +w22σ2
2 +2w1w2σ 1σ2Corr(1,2)

Measuring Portfolio Risk
•The formula indicates: • By combining assets which are not perfectly correlated
(correlation =1), we can reduce portfolio risk • Smaller the correlation coefficient, greater the risk
reduction
Portfolio Variance = w12σ 1
2 +w22σ2
2 +2w1w2σ 1σ2Corr(1,2)

Question: Measuring Portfolio Risk
Stock 1 Stock 2
Amount 100,000 150,000
Expected Return 10% 15%
Standard Deviation 20% 25%
Correlation 0.3
What is the expected variance for a 2-asset portfolio?

Question: Measuring Portfolio Risk
Stock 1 Stock 2
Amount 100,000 150,000
Expected Return 10% 15%
Standard Deviation 20% 25%
Correlation 0.3
=19.0%
Portfolio Variance = w12σ 1
2 +w22σ2
2 +2w1w2σ 1σ2Corr(1,2)
Application
• If a portfolio is fully diversified, an investor only faces systematic risk.
• How do we compare investments to determine the return an investor should expect based on a level of systematic risk?
• The Capital Asset Pricing Model (CAPM) provides this analytical tool. (See next course).

Alternative Risk Measures
Alternative measures of risk used in industry include:

Value at Risk (VAR)
• Value at Risk (VAR) is the amount by which the value of an investment or portfolio may fall over a given period of time at a given probability level.
Example: • VAR = £1m at 5% probability over 1 week
This indicates: • 95% chance that losses will not be greater than £1m in a week
• 5% chance of losses greater than £1m in a week

Value at Risk (VAR) - Pros & Cons
Benefits Limitations
Easy to understand Assumes normal distribution
Widely used by regulators Only focuses on downside
Used to allocate risk among divisions Can be difficult to calculate for large portfolios

Alternative Measures of Risk
Standard Deviation & Variance• Dispersion measure • Limitation – Assumes normal distribution
Tracking Error• Used for tracking a specified index • The greater the accuracy that a fund tracks the index, lower the tracking error
Shortfall risk • Probability of generating a return below a target level
Recap
•The mean and standard deviation are standard measures of return and risk in investment analysis.
•In portfolio management, diversification reduces risk without necessarily reducing returns.
•Correlation and regression are quantitative methods to measure the strength of a relationship between two variables.
•There are alternative measures of risk (VAR, Shortfall risk, tracking error.