blackline master 1-1mrbockstael.weebly.com/.../pkg_e-2_extra_practice__all_.docx · web viewit may...
TRANSCRIPT

Name: ________________________________ Date: ________________________
.…BLM 6–7.…Target E-2 Extra Practice1. a) What is the approximate value
of d when t = 3? ______Explain the method you used.________________________________________________________________________
b) What is the approximate value of t when d = 300? ______
2. a) What is the approximate value of y when x = –1.5? ____
b)What is the approximate value of x when y = 10? ____
3. a) What is the approximate value of y when x = 3.5? ____
b) What is the approximate value of x when y = 0.5? ____
Copyright © McGraw-Hill Ryerson, 2009

Name: ________________________________ Date: ________________________
.…BLM 6–7.…(continued)
4. a) In the deli section of a grocery store, Greek salad costs $1.50 per 100 g. Plot the data on a graph.Mass of Greek Salad, m (g) 100 200 300 400 500Cost, C ($) 1.50 3.00 4.50 6.00 7.50
b) From the graph, determine the cost of 800 g of Greek salad. ______c) From the graph, determine how much salad you get for $10.50. ______
5. A car rental company charges a flat rate of $35.00 plus $0.45 per kilometre for renting a car. The graph shows the cost of renting a car based on the number of kilometres driven.a) Is it reasonable to interpolate
or extrapolate values on this graph? YES NO Explain.___________________________________________________________________________
b) What is the rental cost afterdriving 300 km? ______
c) Approximately how many kilometres can be driven for a rental cost of$115? ______
Copyright © McGraw-Hill Ryerson, 2009

Name: _________________________________ Date: ________________________
.…BLM 1–1.…(continued)
Extra Practice Answers1. a) 275 km. Example: Locate 3 on the x-axis, and then find the corresponding coordinate on the y-axis. b) 3.33 h 2. a) 3.5 b) 1.75 3. a) –0.8 b) –44. a)
b) $12.00 c) 700 g5. a) Example: It may be reasonable only to interpolate or extrapolate based on whole kilometres because the rental company may not charge for partial kilometres.b) $170 c) 177 km
Target E-2 Extra Practice
Copyright © McGraw-Hill Ryerson, 2006

Name: ________________________________ Date: ________________________
.…BLM 6–7.…(continued)
1. Suri drives at an average speed of 90 km/h. The equation relating distance, d, and time, t, is d = 90t.a) Complete a table of values to represent the relation.b) Show the relationship on a graph.c) How long does it take Suri to drive 630 km?
2. For each linear equation, create a table of values and a graph.
a) b = –2a – 15 b) t = –3 c) g = – 23. Create a graph and a linear equation to represent each table of values.
a) x y–3 4–2 4–1 4 0 4 1 4 2 4 3 4
b) a g10 811 8.512 913 9.514 1015 10.5
c) t d0 –2.01 –1.752 –1.53 –1.254 –15 –0.75
Copyright © McGraw-Hill Ryerson, 2009

Name: _________________________________ Date: ________________________
.…BLM 1–1.…(continued)
4. The graph shows the relationship between the fuel consumption, f, in litres (L), and the distance driven,d, in kilometres (km).
a) What is the linear equation?b) How far could you drive with 34 L of gas?c) Is it appropriate to interpolate or extrapolate values on this graph? What
assumption is being made? Explain.
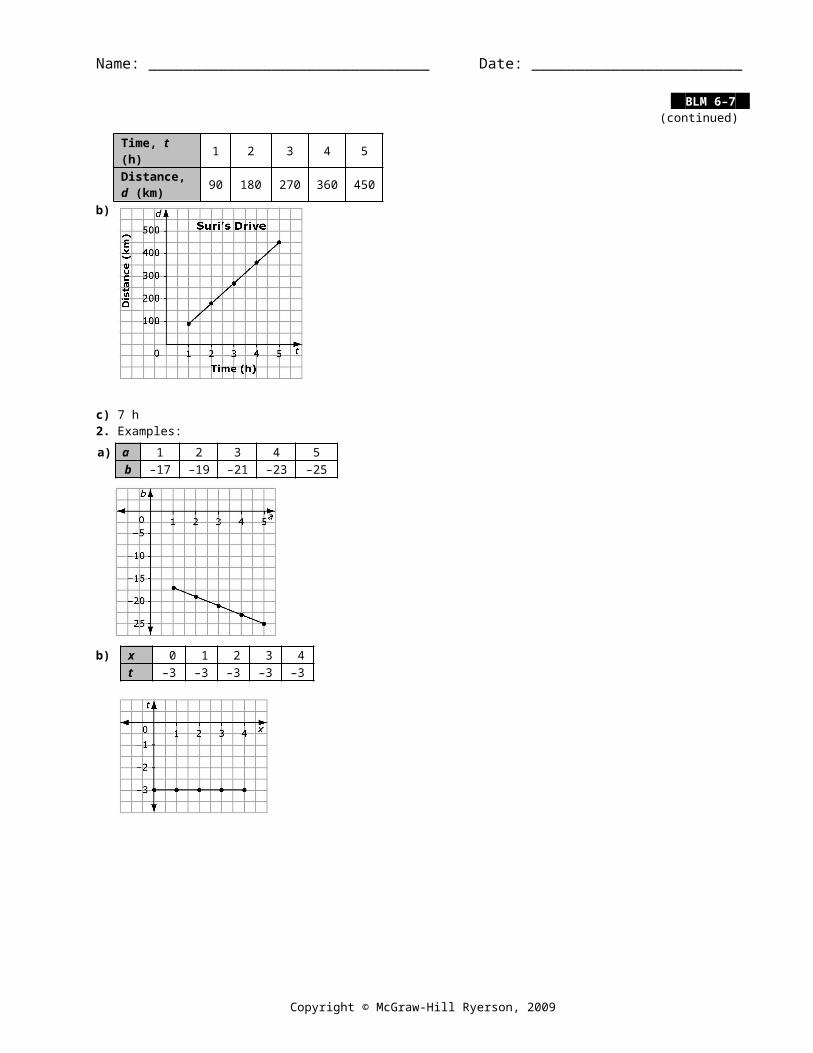
Extra Practice Answers1. a) Example:
Time, t (h) 1 2 3 4 5Distance, d (km) 90 180 270 36
0 450b)
c) 7 h2. Examples: a) a 1 2 3 4 5
b –17 –19 –21 –23 –25
b) x 0 1 2 3 4t –3 –3 –3 –3 –3
Copyright © McGraw-Hill Ryerson, 2006
Name: ________________________________ Date: ________________________
.…BLM 6–7.…(continued)
c) f 1 2 3 4 5g –1.75 –1.5 –1.25 –1 0.75
3. a) y = 4
b) g = 0.5a + 3
Copyright © McGraw-Hill Ryerson, 2009

Name: _________________________________ Date: ________________________
.…BLM 1–1.…(continued)
c) d = – 2
4. a) f = 0.083d b) 408 kmc) Example: Yes, assuming it is possible to drive parts of a kilometre and use parts of a litre of gas
Extra Practice 2
Lesson 4.2: Linear Relations
1. For each table of values below:i) Does it represent a linear relation?ii) If the relation is not linear, explain how you know.iii) If the relation is linear, describe it.
a)
x y b)
x y c) x y d) x y
1 5 1 1 4 11 –2
–12
2 12 3 3 2 14 –1
–5
3 19 5 7 0 17 0 0
4 26 7 13 –2
20 1 3
5 33 9 21 –4
23 2 4
2. Each table of values represents a linear relation. Complete each table. Explain your reasoning.
Copyright © McGraw-Hill Ryerson, 2006
Target E-2

Name: ________________________________ Date: ________________________
.…BLM 6–7.…(continued)
a)
x y b) x y c)
x y
1 1 4
2 3 3 2 14
3 14 5 –1 0 19
4 18 7 –2
5 9 –4
3. Create a table of values for each linear relation and then graph the relation. Use values of x from –2 to 2.a) y = x + 4 b) y = 2x + 1 c) y = 5 – 2x
4. A computer repair company charges $80 for a service call, plus $50 an hour for labour.a) Create a table to show the relation between the time in hours for the service call
and the total cost.b) Is this relation linear? Justify your answer.c) Let n represent the time in hours for the service call and C represent the total cost in
dollars. Write an equation that relates C and n.d) How much will a 7-h service call cost?
Extra Practice 2 Answers
Lesson 4.2
1. a) i) Yes iii) As x increases by 1, y increases by 7.
b) i) Noii) As x increases by 2, y does not increase by a constant number.
c) i) Yes iii) As x decreases by 2, y increases by 3.
d) i) Noii) As x increases by 1, y does not increase by a constant number.
2.a)
x y b) x y c) x y
1 6 1 7 4 9
2 10 3 3 2 14
3 14 5 –1
0 19
Copyright © McGraw-Hill Ryerson, 2009

Name: _________________________________ Date: ________________________
.…BLM 1–1.…(continued)
4 18 7 –5
–2 24
5 22 9 –9
–4 29
a) As x increases by 1, y increases by 4.b) As x increases by 2, y decreases by 4.c) As x decreases by 2, y increases by 5.
3. a)
x y b) x y c) x y
–2 2 –2
–3 –2 9
–1 3 –1
–1 –1 7
0 4 0 1 0 5
1 5 1 3 1 3
2 6 2 5 2 1
4. a)Time, n hours
Total Cost, C ($)
1 130
2 180
3 230
4 280b) Yes, as the time in hours increases by 1, the total
cost increases by $50.c) C = 50n + 80d) $430
Extra Practice 3
Lesson 4.3: Another Form of the Equation for a Linear Relation
1. Does each equation describe a vertical, a horizontal, or an oblique line? Describe each vertical or horizontal line.a) y = 4 b) 2x + 5 = 7c) 2x – y = 6 d) 3y + 9 = 0
2. Which equation below describes each graph?a) b)
Copyright © McGraw-Hill Ryerson, 2006
Target E-2
a) b)
c)

Name: ________________________________ Date: ________________________
.…BLM 6–7.…(continued)
i) x = 2 ii)x = –2iii) y = 2 iv) y = –2
3. The sum of two numbers is 8. Let x and y represent the two numbers.a) Create a table for 5 different values of x.b) Graph the data. Should you join the points?c) Write an equation that relates x and y.
4. Graph each line. Explain your work.a) x = 4 b) 2y = 6c) y – 2 = –6 d) 2x + 3 = 8
5. For each equation below: Make a table for the given values of x. Graph the equation.
a) 3x + y = 3; for x = –2, 0, 2b) x – 2y = 8; for x = –2, 0, 2
6. a) Graph these equations on the same grid.x + y = 6 y = 1 x – y = –6
b) Which shape is formed by these lines?
Copyright © McGraw-Hill Ryerson, 2009

Name: _________________________________ Date: ________________________
.…BLM 1–1.…(continued)
Extra Practice 3
Lesson 4.3
1. a) The graph is a horizontal line that intersects the y-axis at 4.b) The graph is a vertical line that intersects the x-axis at 1.c) The graph is an oblique line.d) The graph is a horizontal line that intersects the y-axis at –3.
2. a) y = 2 b) x = –2
3. a) Tables may vary.x y
0 8
2 6
4 4
6 2
8 0b) Yes, the points should be joined because x and y can have any value between the plotted points.c) x + y = 8
4. a) A vertical line that intersects the x-axis at 4
b) A horizontal line that intersects the y-axis at 3c) A horizontal line that intersects the y-axis at –4d) A vertical line that intersects the x-axis
at 2.5
5.
a)
3x + y = 3
b) x – 2y = 8
x y x y
–2 9 –2 –5
0 3 0 –4
2 –3 2 –3
b) An isosceles triangle
Copyright © McGraw-Hill Ryerson, 2006
6. a) x + y = 6 x – y = –6
x y x y
0 6 –4 2
2 4 –2 4
4 2 0 6

Name: ________________________________ Date: ________________________
.…BLM 6–7.…(continued)
Extra Practice 4
Lesson 4.4: Matching Equations and Graphs
1. Match each equation with a graph on this grid.a) y = 2x – 1b) y = –x + 4c) y = 3x – 3
2. Match each equation with a graph on this grid.a) y = – 1b) 0 = –x + 1c) 2 = 2x – 3
3. Match each equation with a graph on this grid. Justify your answers.a) x + y = 5b) x – y = 5c) x + y = –5
4. Which equation describes this graph? Justify your answers.a) y = x + 2b) y = –x + 2c) y = x – 2
5. Which equation describes this graph? Justify your answers.a) x – y = 4b) x – 4y = 4c) 4x – y = 1
Copyright © McGraw-Hill Ryerson, 2009
Target E-2

Name: _________________________________ Date: ________________________
.…BLM 1–1.…(continued)
Extra Practice 4 Answers
Lesson 4.4
1. a) Graph C b) Graph A c) Graph B
2. a) Graph C b) Graph A c) Graph B
3. Students should make tables of values, or choose points on each line, then substitute coordinates in each equation.a) Graph C b) Graph Bc) Graph A
4. Students should make tables of values, or choose points on each line, then substitute coordinates in each equation.y = x + 2
5. x – 4y = 4
Copyright © McGraw-Hill Ryerson, 2006

Name: ________________________________ Date: ________________________
.…BLM 6–7.…(continued)
Extra Practice 5
Lesson 4.5: Using Graphs to Estimate Values
1. This graph represents a linear relation.a) Determine the value of x for each value of y.
i) y = 1 ii) y = 3iii) y = 0
b) Determine the value of y for each value of x.i) x = 2 ii) x = 8iii) x = –6
2. This graph represents a linear relation.a) Determine the value of x for each value of y.
i) y = 3 ii) y = –2iii) y = 7
b) Determine the value of y for each value of x.i) x = 0 ii) x = –2iii) x = –4
3. This graph represents a linear relation.a) Determine the value of x for each value of y.
i) y = 2 ii) y = 0iii) y = 5
b) Determine the value of y for each value of x.i) x = 0 ii) x = 3iii) x = –5
4. The graph shows how the cost of a long distance call changes with the time for the call.a) Estimate the cost of a 7-min call.
Is this interpolation or extrapolation? Explain.b) The cost of a call was $1.00.
Estimate the time for the call.c) The cost of a call was $1.50.
Estimate the time for the call.
Copyright © McGraw-Hill Ryerson, 2009
Target E-2

Name: _________________________________ Date: ________________________
.…BLM 1–1.…(continued)
Extra Practice 5
Lesson 4.5
1. a) i) x = 0 ii) x = 4iii) x = –2
b) i) y = 2 ii) y = 5iii) y = –2
2. a) i) x = 1 ii) x = –1.5iii) x = 3
b) i) y = 1 ii) y = –3iii) y = –7
3. a) i) x = 1 ii) x = –1iii) x = 4
b) i) y = 1 ii) y = 4iii) y = –4
4. a) Approximately $0.56. This is interpolation because I am reading a data point that lies between the plotted points.
b) Approximately 13 min c) Approximately 22 min
Copyright © McGraw-Hill Ryerson, 2006