bistatic/monostatic synthetic aperture radar for ice sheet
TRANSCRIPT

University of Kansas
John PadenMS Thesis Defense
April 18, 2003
Committee Chairperson: Dr. Chris AllenCommittee Members:Dr. Prasad GogineniDr. Glenn Prescott
Bistatic/Monostatic Synthetic Aperture Radar for Ice Sheet Measurements

University of Kansas
Topics
• Overview
• EM Model
• Sensor Geometry
• Antenna Array
• Position Errors
• Sandbox Tests

University of Kansas
Overview – Motivation
• Global sea level rise threatens coastal regions
• Contributions from an ice sheet are measured by finding the mass balance of the ice sheet.
• Create ice flow model to predict mass balance
• Basal conditions needed for ice flow model
• We can drill boreholes in a few places, but not all over the Arctic and Antarctic regions à RADAR.

University of Kansas
Overview – Basal Scattering• The bedrock is thought to
be smooth with respect to wavelength.
• Therefore it looks like a mirror at our frequencies of operation.
Origin
S1
αβ
α
D
0
T
S2
T
RXRM
β
Tx
BedrockIce
Swath
yz
x
University of Kansas
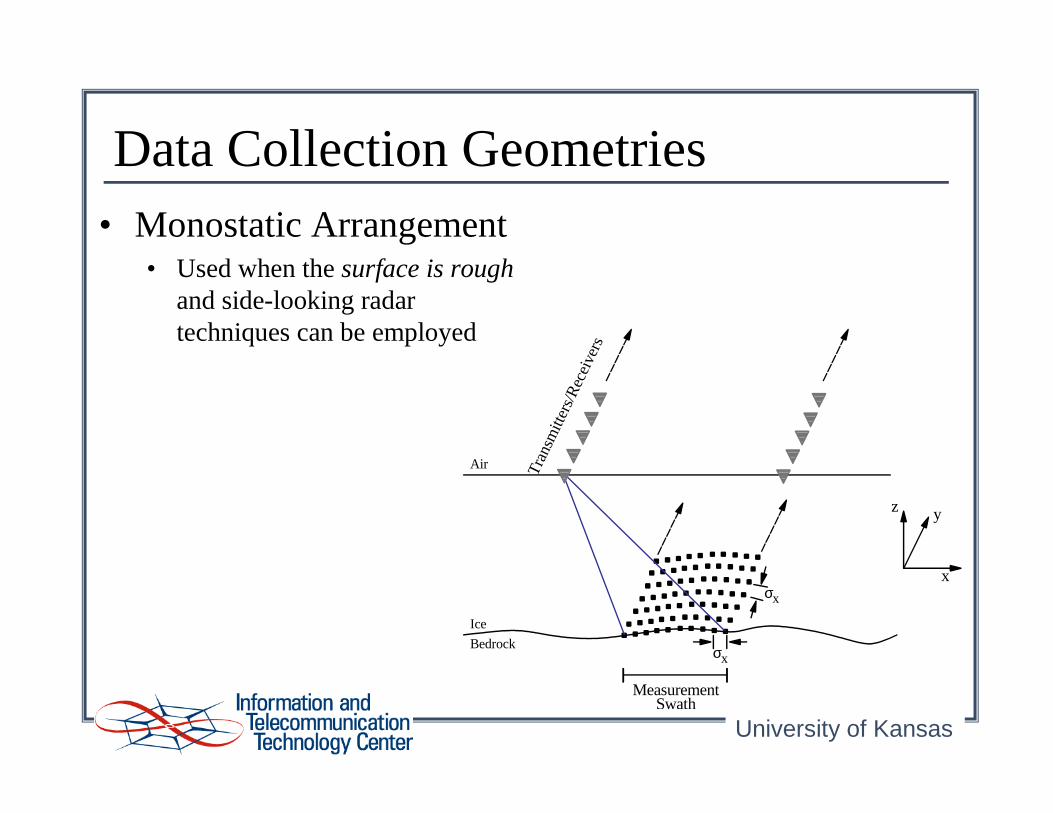
Data Collection Geometries• Monostatic Arrangement
• Used when the surface is rough and side-looking radar techniques can be employed
Tran
smitt
ers/
Rec
eive
rs
σx
σx
Ice
Bedrock
Air
MeasurementSwath
yz
x

University of Kansas
Data Collection Geometries• Bistatic Arrangement
• Used when the surface is smooth and exhibits specular (mirror-like) characteristics
• New variable: separation distance between transmitter and receiver
Tran
smitt
ers
Rec
eive
rs
σx
σx
Ice
Bedrock
Air
MeasurementSwath
yz
x

University of Kansas
Overview – System Model
• Modes of operation: monostatic and bistatic
• Broadband operation: nearly three octaves
Rough Surface
Liquid Water
Sloped Surface
Smooth Surface
Geophysical Model
SAR Processing
EM Model
Physical Characteristics
Sensor Geometry
Measurement Swath
RxTxAirIce
Data

University of Kansas
EM Model
• Magnitude of Transfer Function• TEM Horn Antenna Measurements
• Radar System Transfer Function
• Spherical Spreading
• Phase of Transfer Function• TEM Horn Antenna Measurements
• Radar System Transfer Function
• Path length, phase velocity, and refraction
RffR
R
T
bsTTeffTTR H
R
A
RDHPP Re22 44
ηππ
ση=
University of Kansas
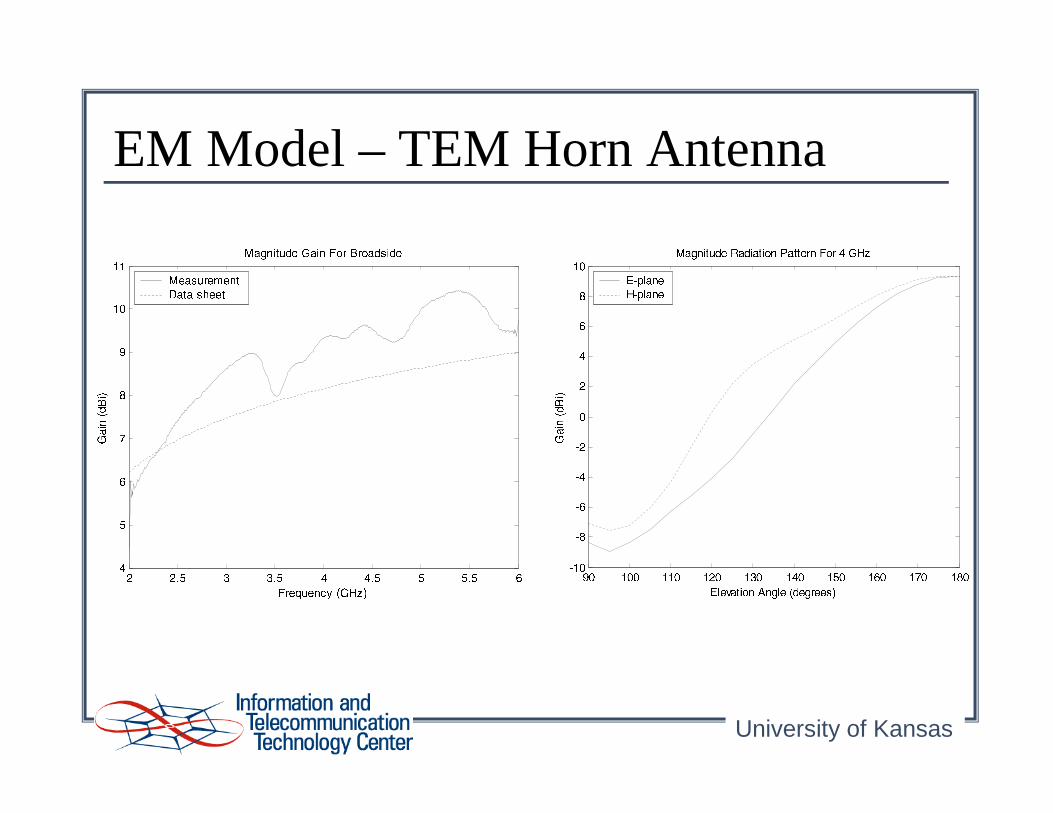
EM Model – TEM Horn Antenna
��� ����� ����� ����� ��� ����� ����� �� �� ���� ������ ���� �� � �� ���� ����
��� ��������� ��� �!��"�� �$# %���"'& ����(�)
* +, -. /0,1
2 ��"���� ��3�%��546��%�� �7�8� ���$9:��� �;��& �$<��'& �$= >@?� � A � ���7�> � A � ���7�
� �:B � :B � � �6B � � �@B � �
�
�
�
�
���
���
<:& ��CD3��'��E�FG# =H>�? )
* +, -. /0,1
2I��"'��� �83�%�� = �'� �J<'�D&6KL& ����%�('� %��2I����('3'& �'MN�D�7�OP�����Q('R������

University of Kansas
EM Model – TEM Horn Antenna
��� ����� ����� ����� ���� ����� ����� � �� ����� ������ �
� ��B �
� �
� �'B �
�
�'B �
��� �7� �7�8� ��� �!��"�� �$# %���"'& ����(�)
��� �
��, ��� �� +�, �
�
��
� �+��
�-��
�. �
�1
4:��� ����� � �QO���� ��F 4:��%�� �7�8� ���$96�7� � �'& �$<��'& �$= >6?� � A � �����> � A � �����
� �:B � @B � � �:B � � �@B � � �@B �
� �@B �
�
�@B �
�@B �
�@B
�@B �
�
��B �
<D& ��C'3��'��E�F # = >�? )
��� �
��, ��� �� +�, �
�
��
� �+��
�-��
�. �
�1
4���� ���8� � �5O �'� ��F <��D&:K & ����%�('� %��

University of Kansas
Radar System Transfer Function
• NA Calibration and Amp/Cable Assembly
� ��� � � ��� � � ��� � � ��� � ������ �
�����
���
���� �
���� �
���� �
����
� � ��� �������
� �� ������ ! "#$
% %�& ' ( ()& ' * *�& ' ' ')& ' +,.-/- ',.-/-�0,.-10 ',.-100, 2 ', 20
, 3 ', 30, 4 ', 40, +'
5 6 7/8:9 ;=<�>?
@ A BACDAE DFG HIJ FKLM)NO
P QRS

University of Kansas
Radar System Transfer Function
• Calibration and Amp/Cable
P2P1
Network Analyzer
Horn AntennasAdapters
Amplifier
Reference-Plane
12" Coax
20" Coax
20" Coax
37' Coax
37' Coax
� ��� ��� ��� ��� �� � ��� �� � ����� �
� ��
� ���
� �
� ��
� ���
� ���
� ���
� ���
������������ ���
� ���
!#"�$&%���'�( �)�!+**�, -�./� 01��$ �2( �3�

University of Kansas
Dielectric Half-space Model
• Three-dimensional geometry of refracted ray can be projected onto the plane of incidence (two-dimensional)
Target, S
θ 1
θ 2
Antenna, A
y’
z
n1
n2
Ay’
Sy’
( ) ( ) ( ) ( )( )0''2
'''20'
221
21'
221
2'
2222
2221
3'
22
21
4'
22
21
=+−
+−++−−−
yzyz
yzzyy
SSnySSny
STynSynSnnySnn
( ) ( )( )( ) ( ) yyyxxx
yyyxxxy
aASaAS
aASaASa
ˆˆ
ˆˆˆ ' −+−
−+−=
( ) ( )22' yyxx SASAy −+−=

University of Kansas
Sensor Geometry• Find the optimal transmitter position that minimizes
the cross-track aperture size, R.
S1
D
0
T
θ1 θ1
φ1φ2
RM R2R1
R'1
R'2
θ2θ2
S2
R
BedrockIce
Tx
β β
yz
x

University of Kansas
Backscatter Characteristics• Bistatic forward scattering characteristics are
approximated with our knowledge of backscatter characteristics.
� � ��� ������ ���� ��� �� ����� ��� ���� �� ���
����� �
εICE = 3.2εBEDROCK = 8.0
��������� ������� ��� � ���������� ������� ��� � �
Backscatter Angle (deg)
Bac
ksca
tter
Mag
. (dB
)
Range of maximum backscatter angles
Bedrock
Ice
TX/RX
Backscatter
Angle
Bedrock
Ice
RX
Forward scatter
AngleTX

University of Kansas
Advantage of Separation
B
A
TX
TX
Swath
Swath
• As the transmitter moves away from the swath, the ice surface illuminated by the forward scatter cones grows.
• In turn, the minimum required receiver movement decreases (i.e. B < A).

University of Kansas
Disadvantages of Separation
Off-nadirWorse Resolution
NadirBest Resolution
Bedrock
Ice
ρx
• As the transmitter-receiver separation is increased, the angular resolution decreases.
!′!
! !
ρx
• The bedrock surface subtended also increases for the same angular resolution.

University of Kansas
� ������� ��� ����� �� ����� �� ����� � ����� � ����� � ����� ��������� � ��� � �� ���� � �� ���� � ������� � �� ���
� ��� ��� ������� ���
������ ��!#" $�$&%��('*)��+" $," )��.-�!0/
132 � ����� !54β2 ��6 � °
487 = 150 MHz
9:" �.;<% =�%�" >?%���@BA�%�� $�C��%9D�FEG" !.C�!H@I�FJ+K %
� ������� ��� ����� �� ����� �� ����� � ����� � ����� � ����� �������� �� �� ����� �L��M �N��O�� ���
P Q�� ��� �RS �
Plot of Receiver Array Size
• The minimum receive aperture occurs when the transmitter position is 1580 m from the center of the swath.
• The minimum receive aperture is 47 m.
Across-track resolution: 100 m
Ice thickness: 3 km
Frequency: 150 MHz
Swatch Width: 1 km
Backscatter: 7.5 deg
Minimum Receive
Array
TVUXWZY[
\^] Swath

University of Kansas
Results for 3000 m thick ice
60
611020350
21920158015350
484307243510350
748104928315350
1326020150
23447161015150
498371243510150
762112528315150
326602060
27312117101560
53553824351060
799132328315
Min. Monostatic Aperture (m)
Min. Receiver Aperture (m)
Tx Position (m)Max forward-
scatter angle (deg)Frequency
(MHz)
University of Kansas
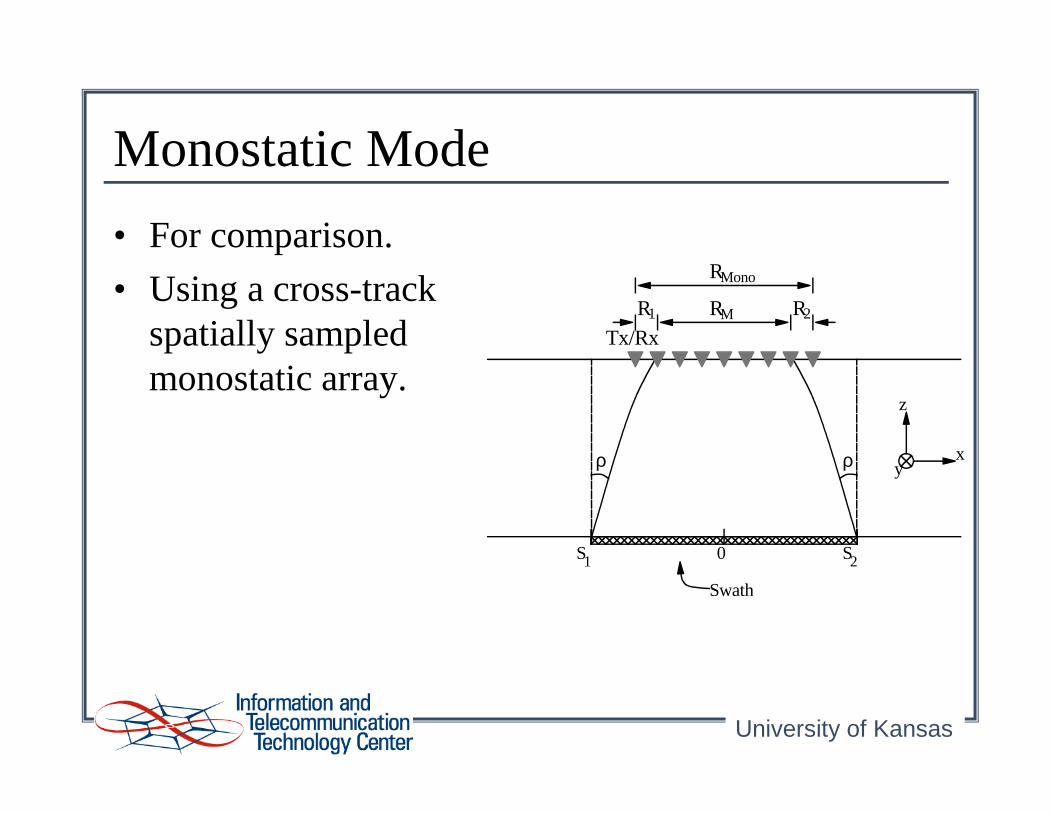
Monostatic Mode
• For comparison.
• Using a cross-track spatially sampled monostatic array.
S1 S20
Swath
z
xyρ ρ
RM R2R1
RMono
Tx/Rx

University of Kansas
Monostatic vs. Bistatic
• Minimum SAR aperture required using a bistatic configuration (also compared to monostatic).
� � ��� ��� ��� ��� ���
�����
������
������
�����
�������� � ��������
����������� ����� �������� ! #"���$&%�'�( "*) �"'�� "�"�+,
-. /. 0102 3456 1547 . 849 0:
;� ��<>=@?BA +C D�� EA �;� ��<>=F�G��%���+� !�C EA ����� ��<H=F?BA +� #�C EA ����� ��<H=*�G�I%J�+� D�� EA ���� ��<H=F?BA +� #�C EA ���� ��<H=*�G�I%J�+� D�� EA �

University of Kansas
Along-track Array
• Along-track antenna array• Sharpens along-track beam
• Less frequent along-track sampling
• Sum antenna array elements together
• SAR focusing hindered by loss of control over individual elements
Rx
Tx
Rx
Tx
zy
x
Cro
ss-t
rack
Along-track
SAR Antenna Array
TX Vehicle
University of Kansas
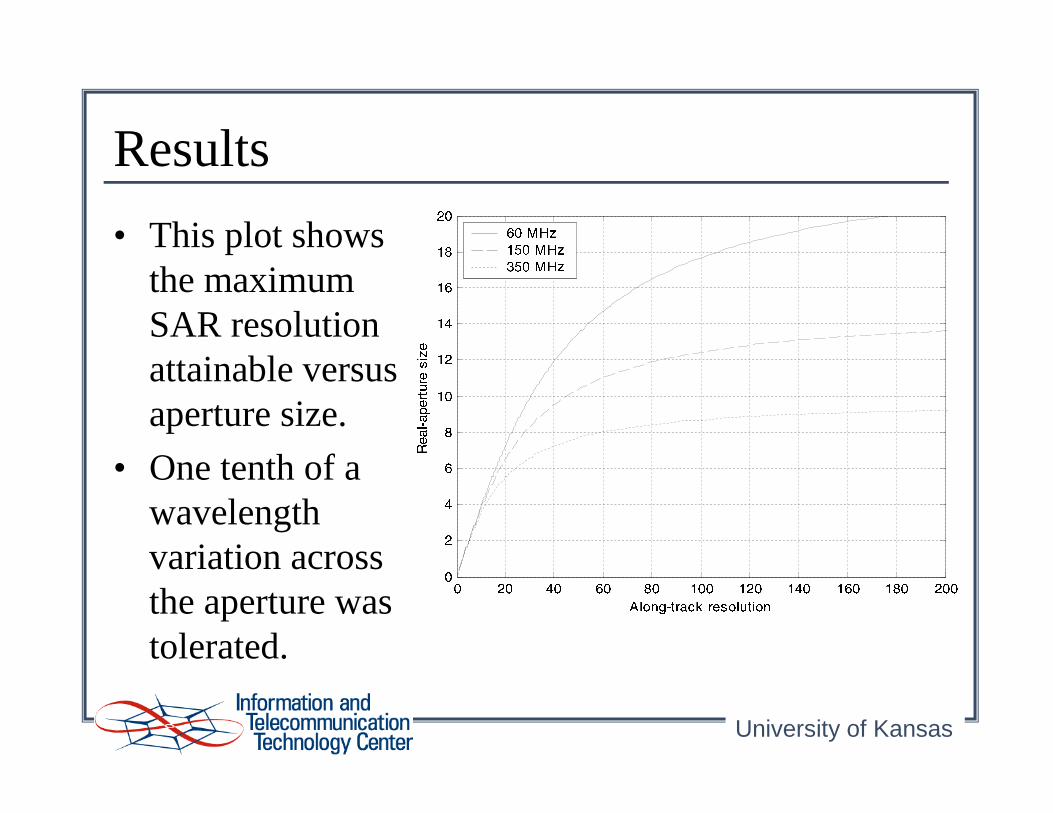
Results
• This plot shows the maximum SAR resolution attainable versus aperture size.
• One tenth of a wavelength variation across the aperture was tolerated.
� ��� ��� ��� ��� ����� ��� ���� ����� ����� ������
�
�
�
�
���
��
��
���
���
���
�� ����������������������� !��#" ��
$ %&'#(&)%*+ ,*%-. /%
���103254��6��10�2748�6��10�274

University of Kansas
Position Errors
• The Radar will derive its position using the global positioning system (GPS).
• GPS’s have errors that are a significant fraction of a wavelength
• Need to answer the question: How do positioning errors effect the performance of the SAR processor?

University of Kansas
Position Errors• Gaussian random process• Correlated errors created by low pass filtering• Topcon GPS system:
• 0.1 m standard deviation in latitude• 0.1 m standard deviation in longitude• 0.2 m standard deviation in elevation
� � � � � � � � �� � � �
� � ���
�
� ���
� � �
� ��� ��� �����
�� �� �� ��
����������� �"! #%$'& �"()+*-, ������� �"! #%$'& �"(

University of Kansas
Results for σ = 0.05 m
��� ����� ����� ����� ����� ����� ����� ����
���
���
���
���
���
���
�� ������������������� ��!
"#$% &'(
�����*) +��,�-. ��/10 -�3240 /15σ 6 �87����*)
9� �-���- � +�. :;/10 -�����<) ��- � +�. :;/10 -�����<) ��- � +�. :;/10 -��

University of Kansas
Results for σ = 0.1 m
��� ����� ����� ����� ����� ����� ����� ����
�
���
���
���
���
�� ������������������� ��!
"#$% &'(
����� ) +��,�-. ��/10 -�� 240 / 5σ 6 ��7 � )
9� �-���- � +�. :;/10 -�����<) ��- � +�. :;/10 -�����<) ��- � +�. :;/10 -��

University of Kansas
Results for σ = 0.1 m (fixed aperture)
��� ����� ����� ����� ����� ����� ����� ����
�
���
���
���
���
�� ������������������� ��!
"#$% &'(
��0 � ���<:��;� / �� +� 240 /15 σ 6 �87 � )9� �-���- � +�. :;/10 -�����<) ��- � +�. :;/10 -�����<) ��- � +�. :;/10 -��

University of Kansas
Sandbox Laboratory
• Test the EM model
• Test the SAR processing algorithm• Ability to determine the position of a target
• Ability to accurately determine the target’s reflectance

University of Kansas
Measurement Setup
• Left side: measurement setup
• Right side: simulation setup
� ��� � ��� � ��� � ��� �
� ��� � ��� �� ��� � ��� �� ������
�����
��� ���� ��� ����
�� ������ ����� � � � �����
� � !"
#$ %&
' ��� (�) � �' � ��*+� �-, ��� )��. )���) , / )�� �
0.53 m
0m
z
SandAir
Tube is Perpendicular to Figure
Tube
Tx Horn Rx Horn
0.30 m
x
0 m

University of Kansas
A-ScopesLeft side: measured datasetRight side: simulated dataset
� ����$ ��&
� �+�
� � �
� �+�
� +�
� � �
� +�
� � �
��� ������ �������� � �������� ���������� ������� � ���
! "#$%&' #
� � � �+� �+
� �
�+�
�
�+�
�
� �
� ����$ ��&
� � �
� �+�
� +�
� � �
� +�
� � �
� � �
���� ������ �������� � �������� ���������� ������� � ���
! "#$%&' #
� � � �+� �+
� �
�+�
�
�+�
�
� �

University of Kansas
SAR Processed
� ����$ ��&
� �
� � �
�
� �
� �
��� ������ � ���� ������ ������� � �����
� ����� �� �� !"
# $��%
� ��� � � ��� � � � � � ��� � ��� � � � �� ��� �
� ��� �
� ���
� ��� �
� ���
� ��� �
� ��� �
�
��� �
� ����$ ��&
�
� �
� �
� � �
�
� �
��� ������ � ���� ������ ������� � �����
� ����� �� �� !"
# $��%
� ��� � � ��� � � � � � ��� � ��� � � � �� ��� �
� ��� �
� ���
� ��� �
� ���
� ��� �
� ��� �
�
��� �
Left side: measured dataset after SAR processingRight side: simulated dataset after SAR processing

University of Kansas
Ten Targets
� ��� � � ��� � � ��� � ��� � ��� � ��� ��
���
��
�
���
����������� ��� �������! "$# ������� � # %�"'&
( )*+,- .- +/0 12
34 +/5 ). 6378
�
�
� 9
� :
;�<>=�?A@CB�D�EGF�H�I ?JI F�K�HL!M�BNH�@�O�MNPQEGF�H�I ?RI F�K�H
S TUVWX YZ[
� ���
� �
� ��
� ��
� ���
� �
�\�]������� � � �������! "C# ������� � #�%�"'&
( )*+,- .- +/0 12
34 +/5 ). 6378
� ��� � � ��� � � ��� � ��� � ��� � ��� ��
���
��
�
���

University of Kansas
Table of Results
1
1 cm-49 dBAir-filled15 cm10
1 cm-52 dBAir-filled11.5 cm9
6.08 cm-49 dBAir-filled15 cm8
2.24 cm-53 dBAir-filled11.5 cm7
3.16 cm-42 dBMetal10 cm6
2.24 cm-40 dBMetal10 cm5
1.41 cm-42 dBMetal10 cm4
2 cm-35 dBMetal12.5 cm3
5 cm-38 dBMetal10 cm2
2 cm-35 dBMetal12.5 cm
Position ErrorSignal PowerMetal/AirDiameterTarget #
• Max sidelobe is –49 dB
• Signal to sidelobe is at least 4 dB within the region of the target

University of Kansas
Conclusions
• Transmitter Location (Sensor Geometry)• The transmitter position has a very large effect on the size of the
bistatic array.
• Depending on the type of scattering and thickness of the ice, the bistatic mode may or may not be faster than the monostatic mode.
• The bistatic transmitter position that minimizes the receiver cross-track movement was found.
• Along-track Antenna Array• Along-track antenna array could be helpful in expediting the bistatic
measurements.
• For high-precision measurements (e.g. 10 m) its usefulness is limited unless each element can be controlled individually.

University of Kansas
Conclusions
• Position Errors• Position errors can be very severe at higher frequencies. Increasing
aperture length does not help position errors.
• GPS errors need to be characterized in terms of magnitude of relative error and error correlation over time and space.
• Sandbox lab tests showed:• First-order EM Model gives results consistent with the measured
results
• Ability to position targets to within a few centimeters
• Ability to distinguish targets with different reflectivities (with similar targets giving consistent reflectivities)