biosimilar pk guidance and novel approaches - bioclin...
TRANSCRIPT
Biosimilar PK Guidance andNovel Approaches
Dr Alison Wilson, Senior Pharmacokinetist,
BioClin Research Laboratories

Pharmacokinetics?
Pharmacokinetics (from Ancient Greek pharmakon "drug" and kinetikos "moving, putting in motion“
PK is a branch of pharmacology dedicated to determining the fate of substances administered externally to a living organism
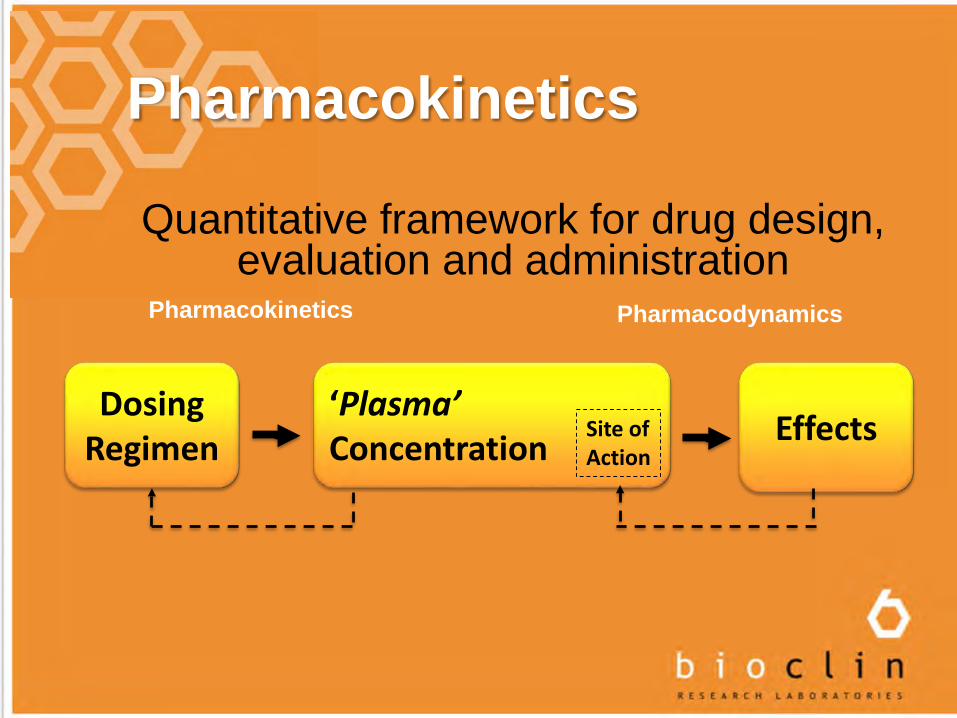
Pharmacokinetics
Quantitative framework for drug design, evaluation and administration
EffectsDosing
Regimen‘Plasma’ Concentration
Site ofAction
Pharmacokinetics Pharmacodynamics
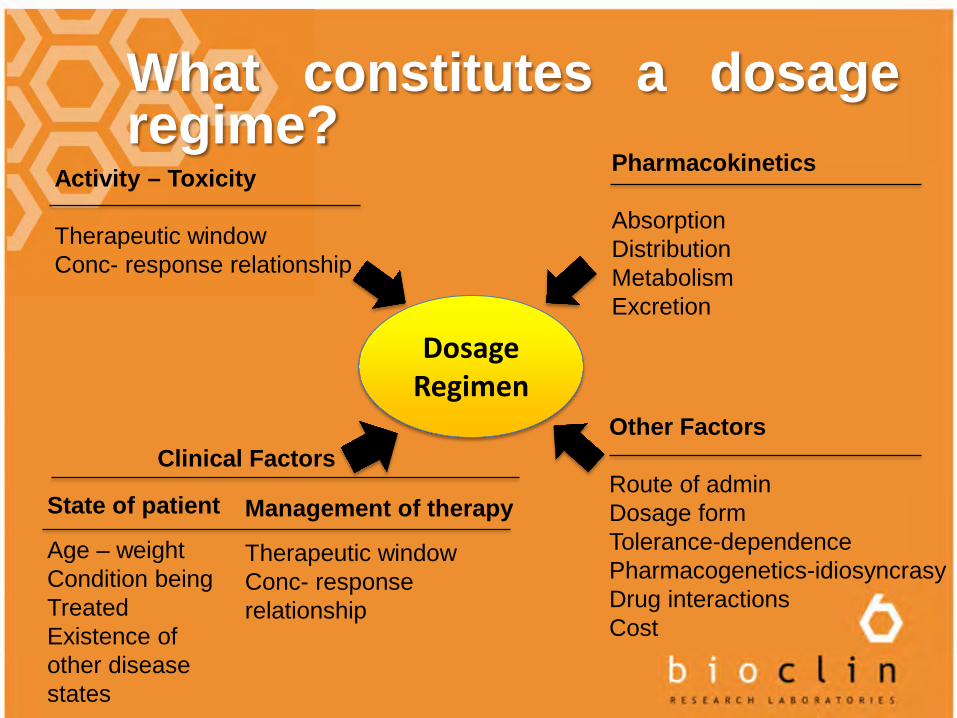
What constitutes a dosageregime?
Dosage Regimen
Activity – Toxicity
Therapeutic windowConc- response relationship
Pharmacokinetics
AbsorptionDistributionMetabolismExcretion
Other Factors
Route of adminDosage formTolerance-dependencePharmacogenetics-idiosyncrasyDrug interactionsCost
Clinical Factors
Management of therapy
Therapeutic windowConc- response relationship
State of patient
Age – weightCondition beingTreatedExistence of other disease states
Pharmacokinetics
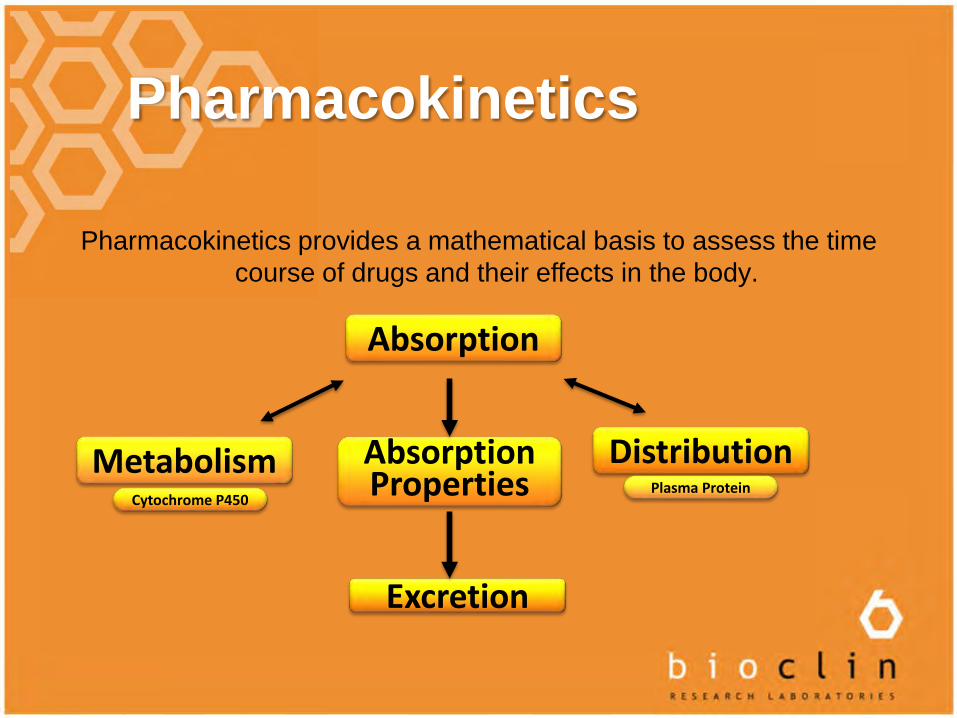
Absorption
Pharmacokinetics provides a mathematical basis to assess the time course of drugs and their effects in the body.
DistributionMetabolism
Excretion
AbsorptionPropertiesCytochrome P450
Plasma Protein
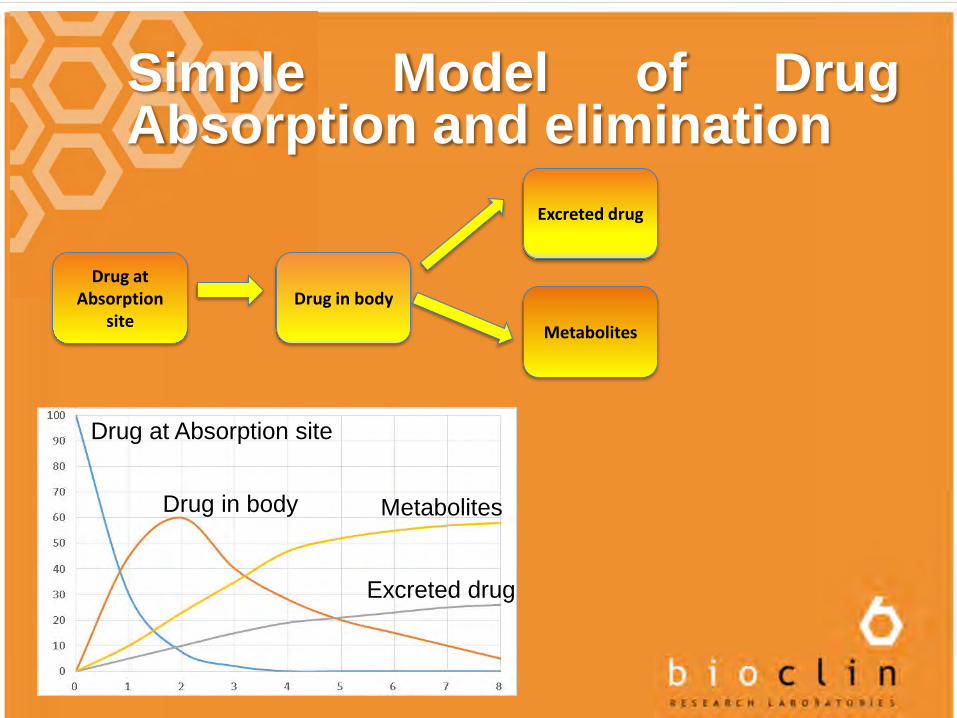
Simple Model of DrugAbsorption and elimination
Drug at Absorption
siteDrug in body
Excreted drug
Metabolites
Drug at Absorption site
Drug in body
Excreted drug
Metabolites
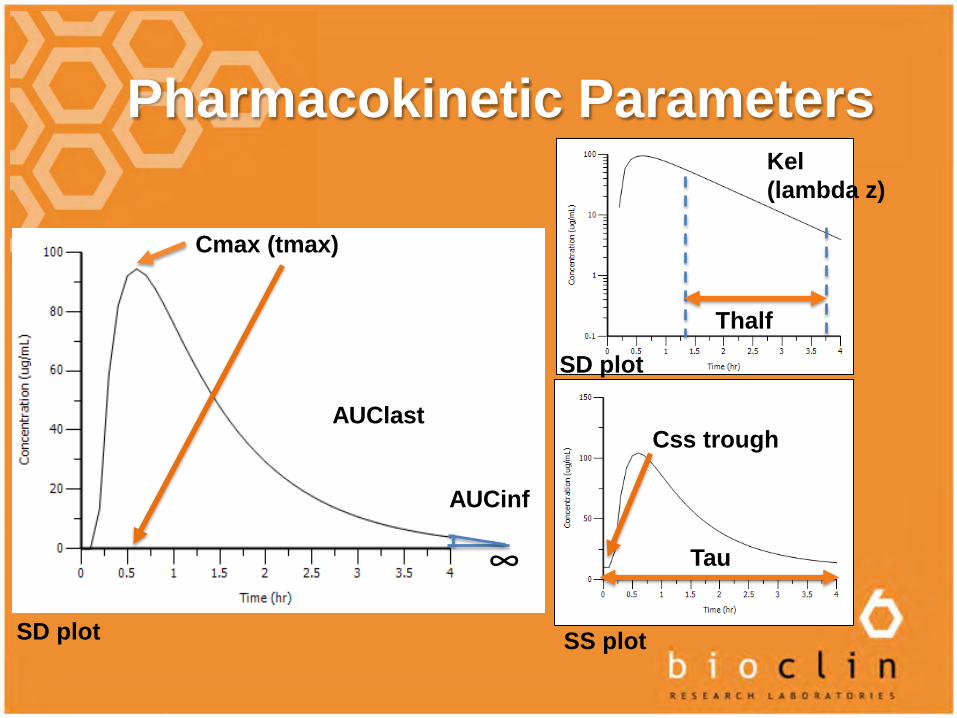
Pharmacokinetic Parameters
Cmax (tmax)
AUClast
AUCinf
Kel (lambda z)
Thalf
∞ Tau
Css trough
SS plotSD plot
SD plot
Guidance for Industry Clinical Pharmacology Data to Support a Demonstration
of Biosimilarity to a Reference Product
U.S. Department of Health and Human Services Food and Drug Administration Center for Drug Evaluation and Research (CDER) Center for Biologics Evaluation and Research (CBER)
May 2014 Biosimilars
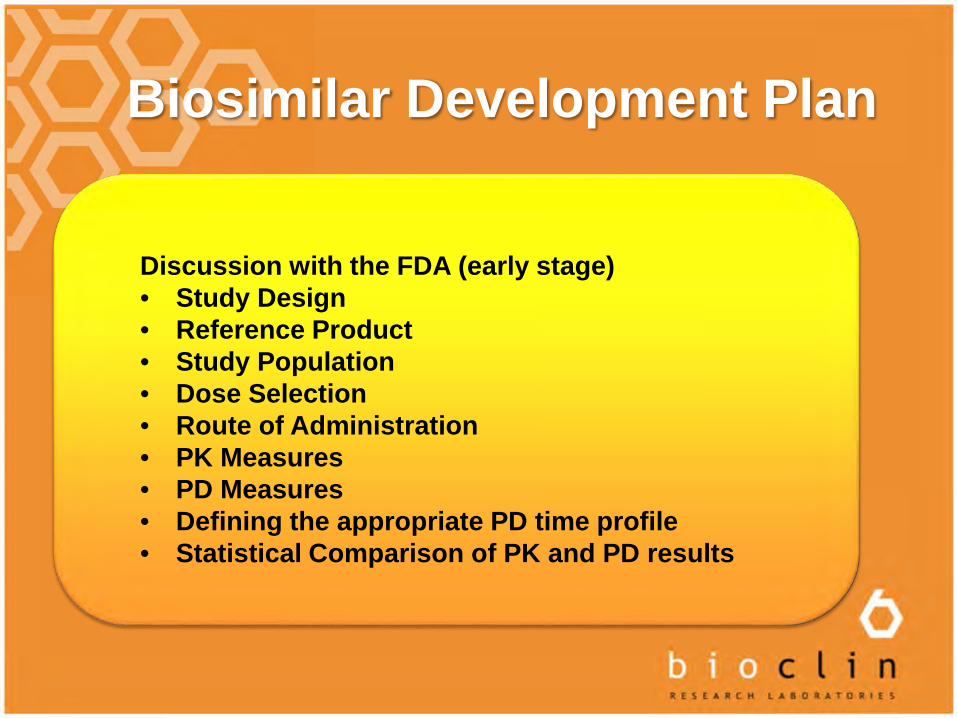
Biosimilar Development Plan
Discussion with the FDA (early stage)• Study Design• Reference Product• Study Population• Dose Selection• Route of Administration• PK Measures• PD Measures• Defining the appropriate PD time profile• Statistical Comparison of PK and PD results
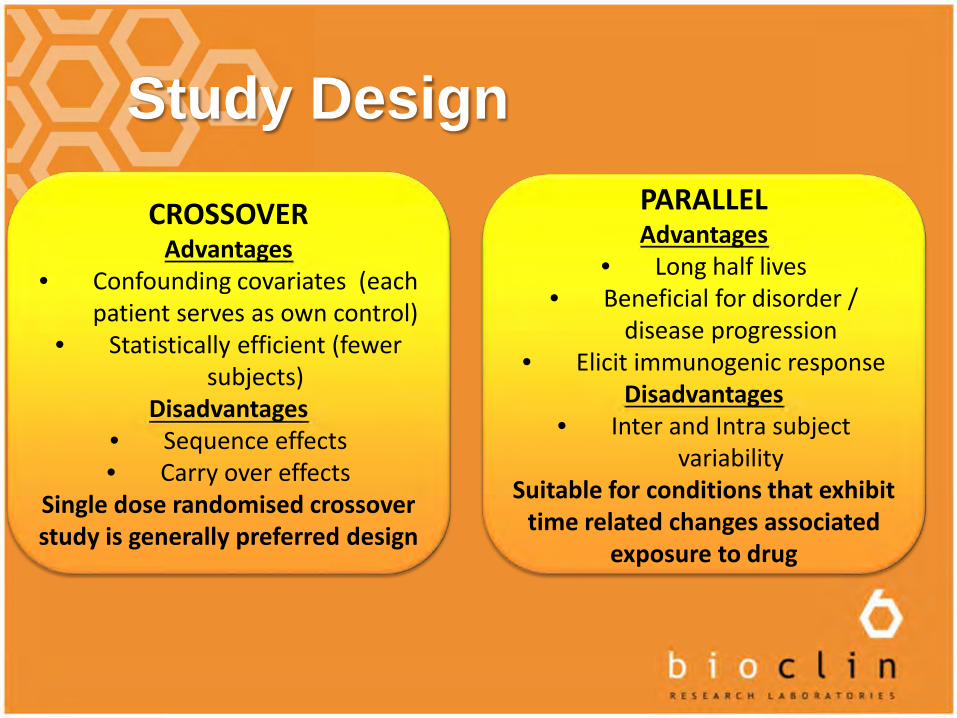
Study Design
CROSSOVERAdvantages
• Confounding covariates (each patient serves as own control)
• Statistically efficient (fewer subjects)
Disadvantages• Sequence effects• Carry over effects
Single dose randomised crossover study is generally preferred design
PARALLELAdvantages
• Long half lives• Beneficial for disorder /
disease progression• Elicit immunogenic response
Disadvantages• Inter and Intra subject
variabilitySuitable for conditions that exhibit
time related changes associated exposure to drug
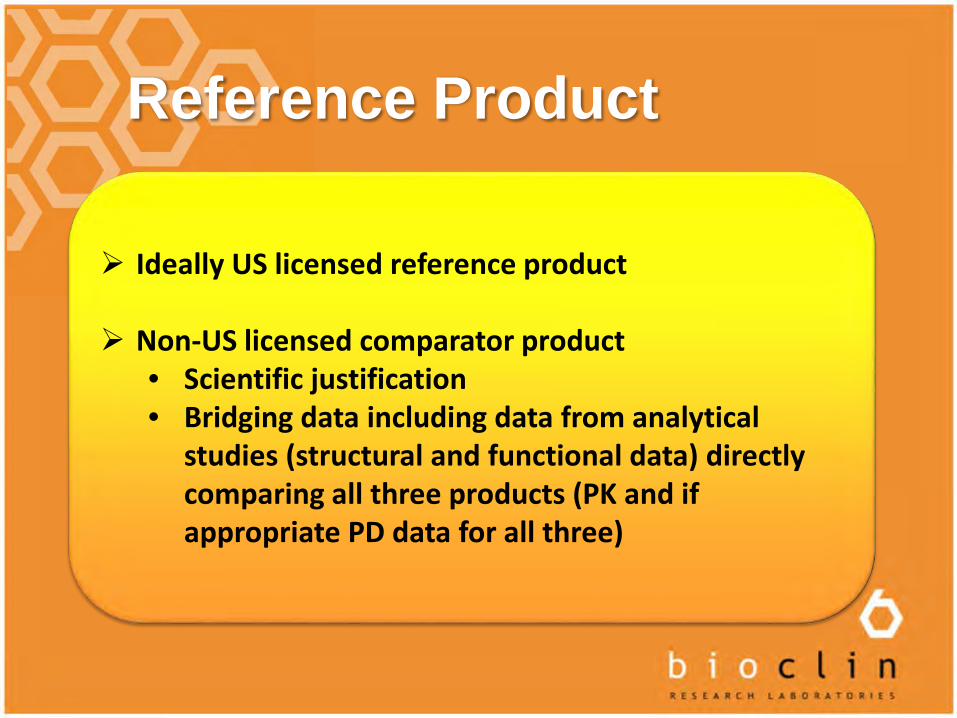
Reference Product
Ideally US licensed reference product
Non-US licensed comparator product• Scientific justification• Bridging data including data from analytical
studies (structural and functional data) directly comparing all three products (PK and if appropriate PD data for all three)
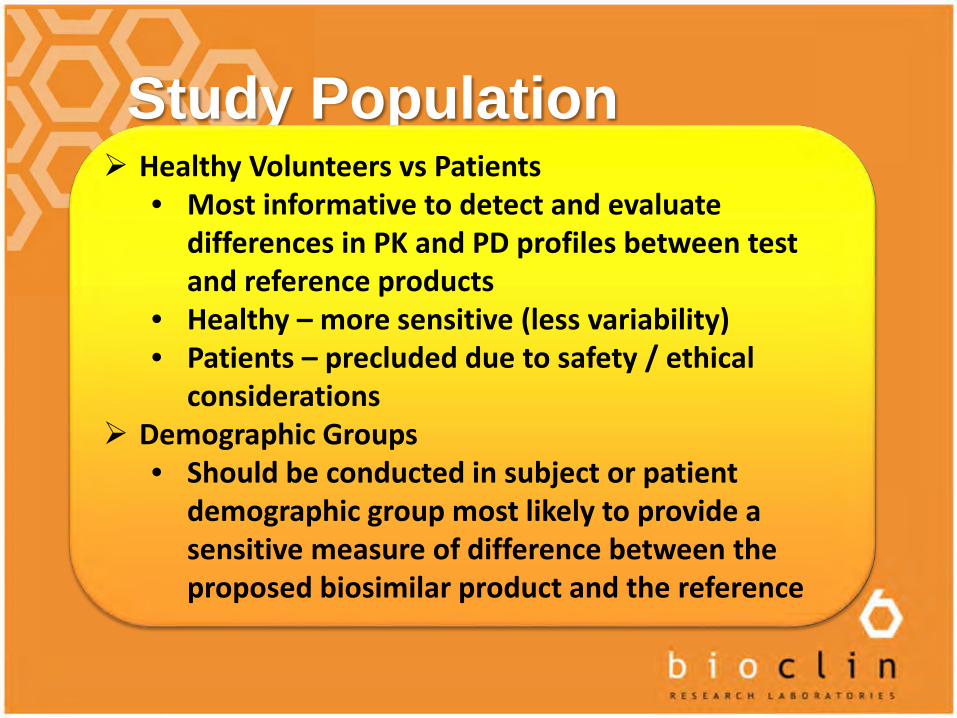
Study Population Healthy Volunteers vs Patients
• Most informative to detect and evaluate differences in PK and PD profiles between test and reference products
• Healthy – more sensitive (less variability)• Patients – precluded due to safety / ethical
considerations Demographic Groups
• Should be conducted in subject or patient demographic group most likely to provide a sensitive measure of difference between the proposed biosimilar product and the reference

Study Population
Total number of subjects to provide adequate power for similarity assessment
Analysis of the data from all subjects as one group represents the primary study endpoint, and a statistical analysis of the data from the subgroups would be exploratory only
Dose Selection Dose selected should be the most sensitive to detect
and evaluate differences in the PK and PD profiles Dose should be the one most likely to provide
clinically meaningful and interpretable data Patient study – approved dose for the reference
product (best demonstrate pharmacological effect in clinical setting) / lower dose if non-linear PK or if exceeds dose required for max PD effect
Healthy volunteer study – lower dose in the steep part of the exposure – response curve maybe appropriate
Adequate justification required
Route of Administration Same route of administration in both test and
reference products
If there are multiple routes approved for the reference product, route selected for the assessment of PK and PD similarity should be the one most sensitive for detecting clinically meaningful results
Subcutaneous or other extravascular routes preferred (more information on the PK differences during the absorption phase in addition to distribution and elimination phase
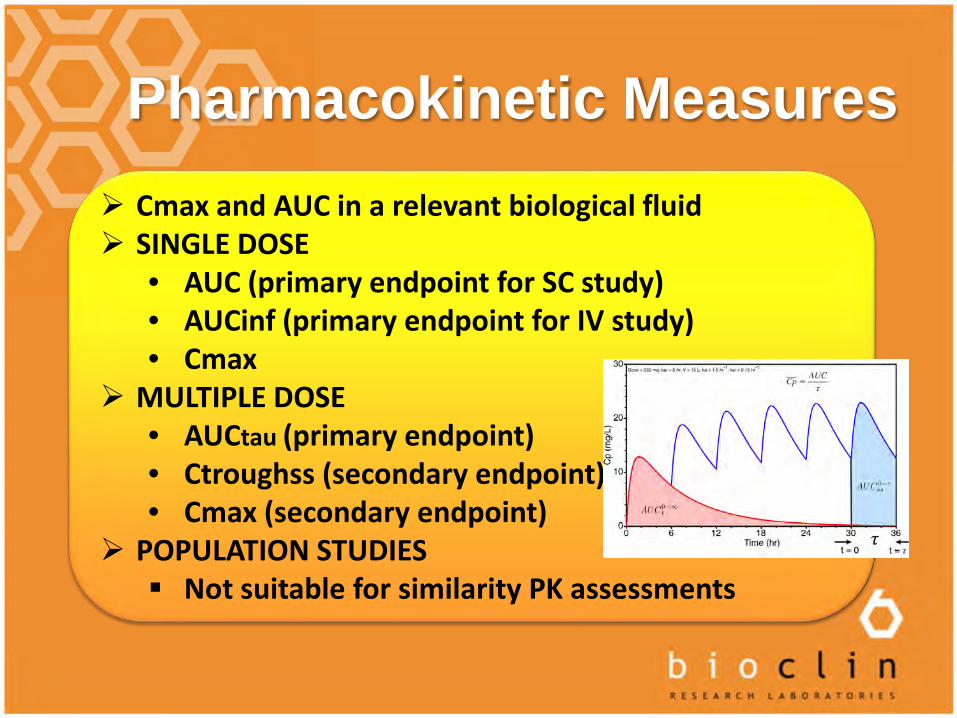
Pharmacokinetic Measures Cmax and AUC in a relevant biological fluid SINGLE DOSE
• AUC (primary endpoint for SC study)• AUCinf (primary endpoint for IV study)• Cmax
MULTIPLE DOSE• AUCtau (primary endpoint) • Ctroughss (secondary endpoint)• Cmax (secondary endpoint)
POPULATION STUDIES Not suitable for similarity PK assessments
PD Measures Human PK and PD data that demonstrate similar
exposure and response may be sufficient to completely assess clinically meaningful differences between the products. If PD measure reflects the mechanism of drug
action (wide dynamic range over a range of drug concentrations)
Time points and durations very important If PD response lags after administration, MD
study and SS conditions may be important If only one PD measure , simultaneous drug
concentration measurement necessary (broader panel of biomarkers adds value)
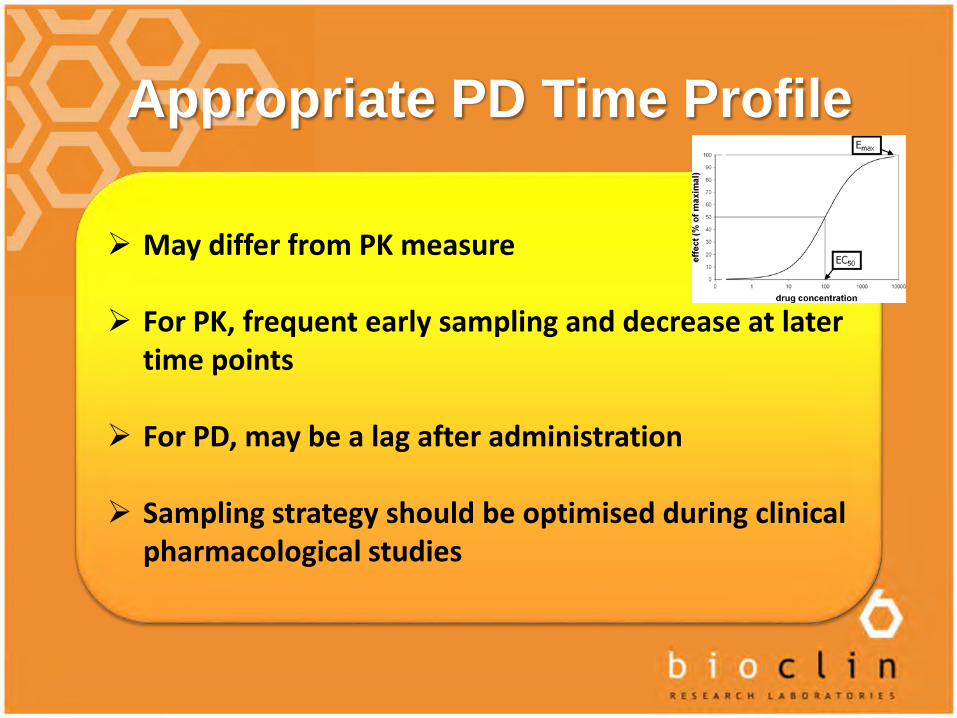
Appropriate PD Time Profile
May differ from PK measure
For PK, frequent early sampling and decrease at later time points
For PD, may be a lag after administration
Sampling strategy should be optimised during clinical pharmacological studies
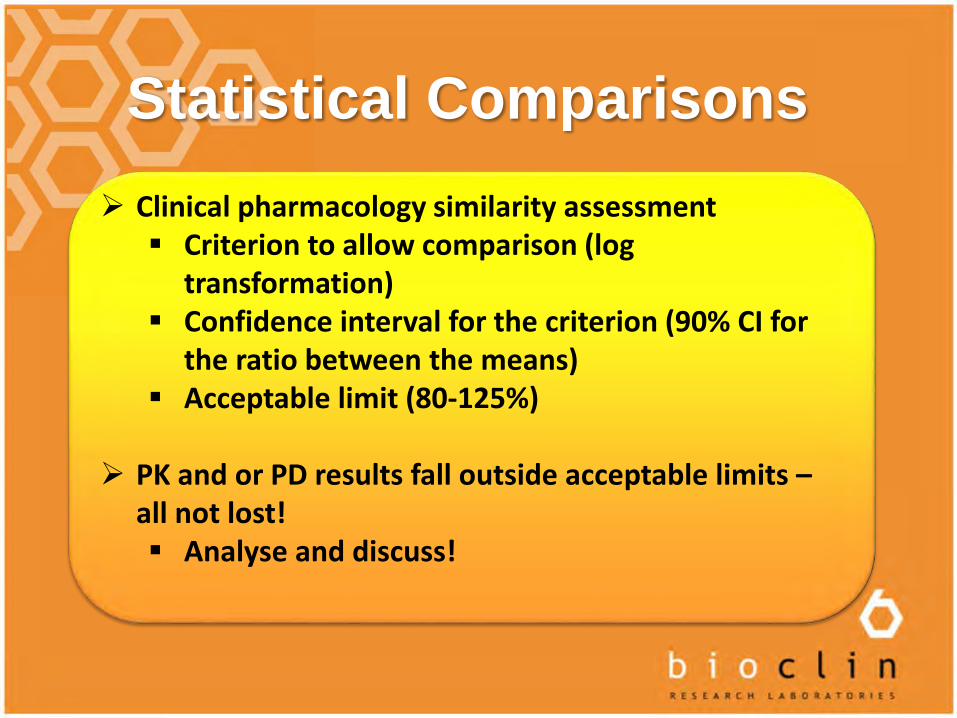
Statistical Comparisons Clinical pharmacology similarity assessment Criterion to allow comparison (log
transformation) Confidence interval for the criterion (90% CI for
the ratio between the means) Acceptable limit (80-125%)
PK and or PD results fall outside acceptable limits –all not lost! Analyse and discuss!
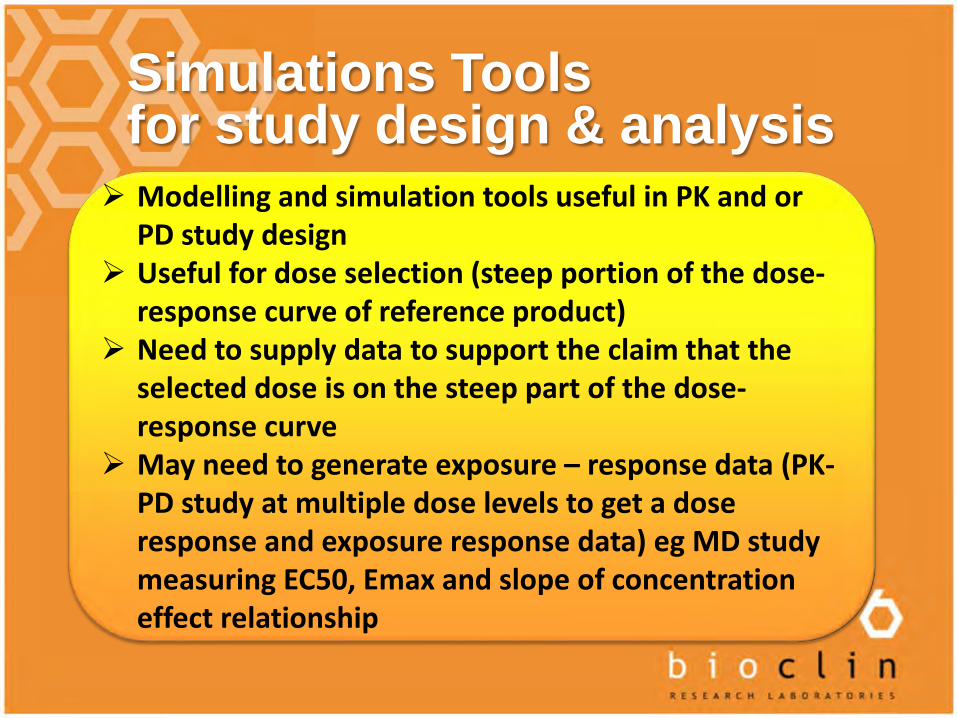
Simulations Tools for study design & analysis Modelling and simulation tools useful in PK and or
PD study design Useful for dose selection (steep portion of the dose-
response curve of reference product) Need to supply data to support the claim that the
selected dose is on the steep part of the dose-response curve
May need to generate exposure – response data (PK-PD study at multiple dose levels to get a dose response and exposure response data) eg MD study measuring EC50, Emax and slope of concentration effect relationship
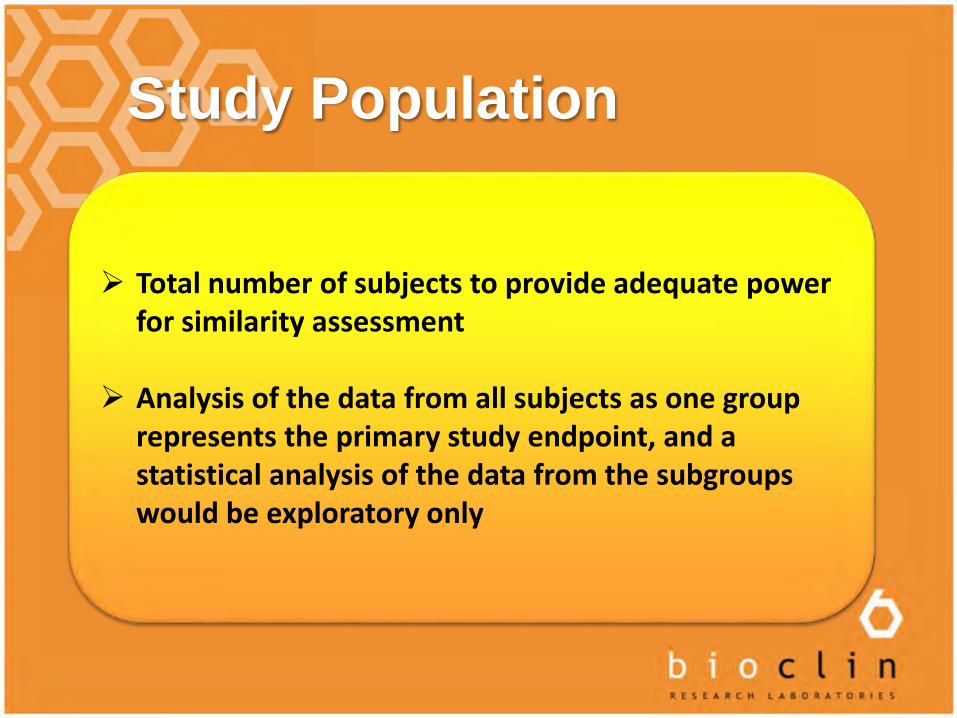
Study Population
Total number of subjects to provide adequate power for similarity assessment
Analysis of the data from all subjects as one group represents the primary study endpoint, and a statistical analysis of the data from the subgroups would be exploratory only

Novel Approaches
Simulations – Step 1
Objective: To attain target concentrations & duration of time cover
Range of doses Range of lag times Range of sustained release properties
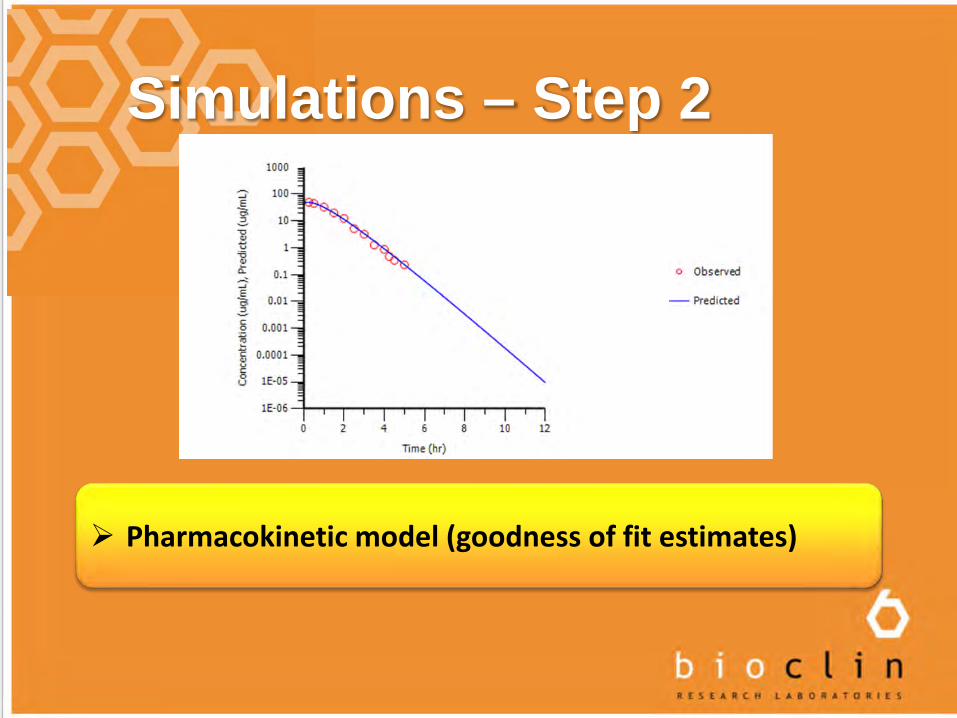
Simulations – Step 2
Pharmacokinetic model (goodness of fit estimates)
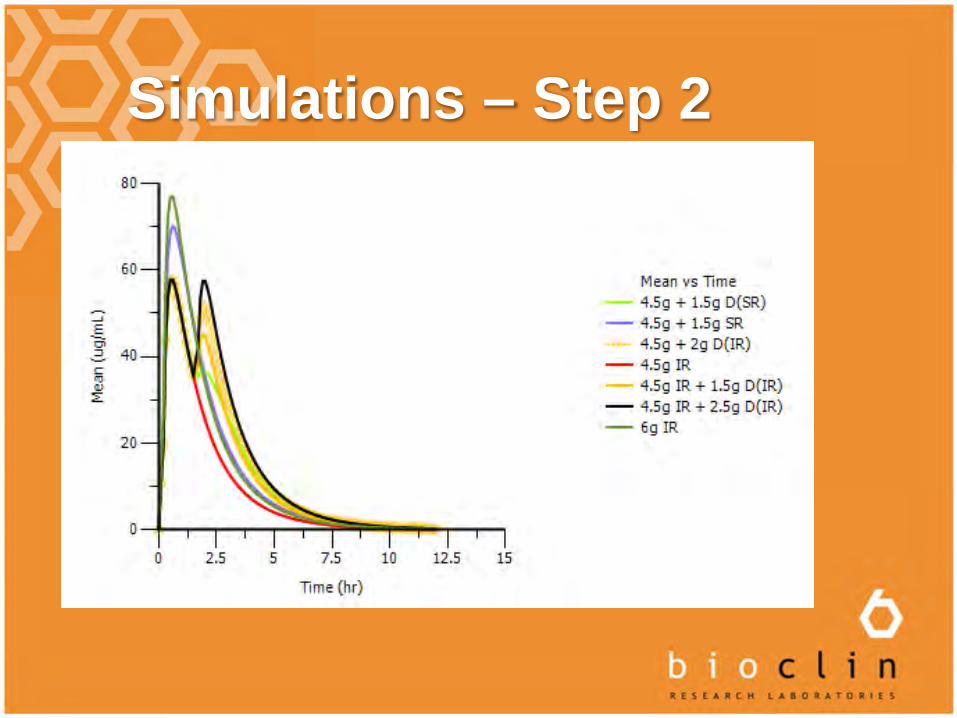
Simulations – Step 2
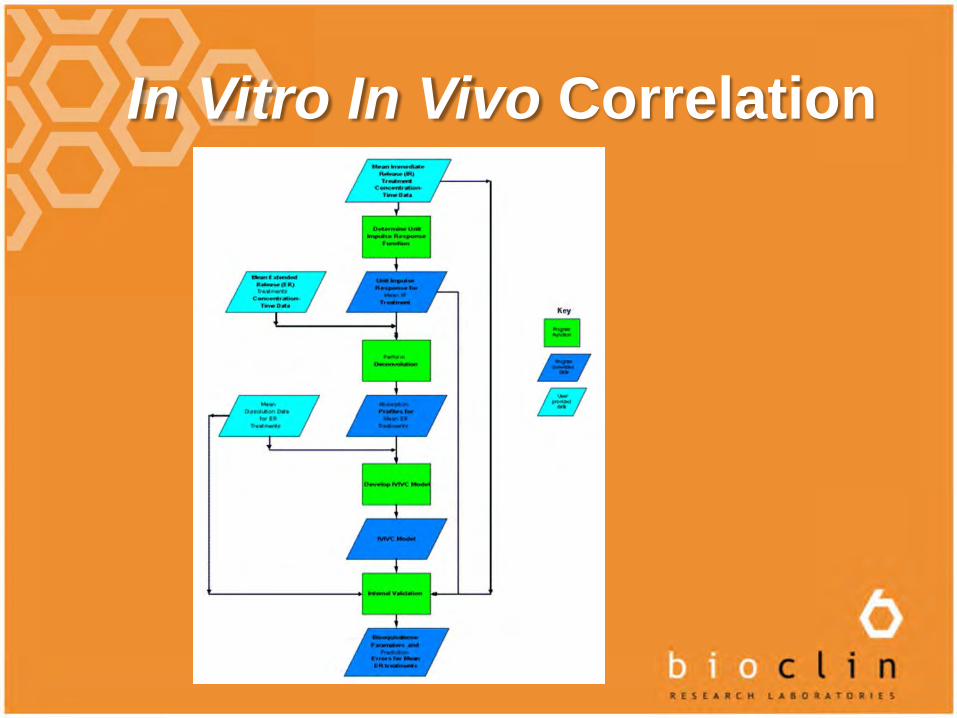
In Vitro In Vivo Correlation
IVIVC are the predictive, mathematical models relating an in vitro property (e.g. dissolution) and the in vivo response (e.g. amount of drug absorbed) thus allowing an evaluation of the QC specifications, change in process, site, formulation and application for a biowaivers etc.
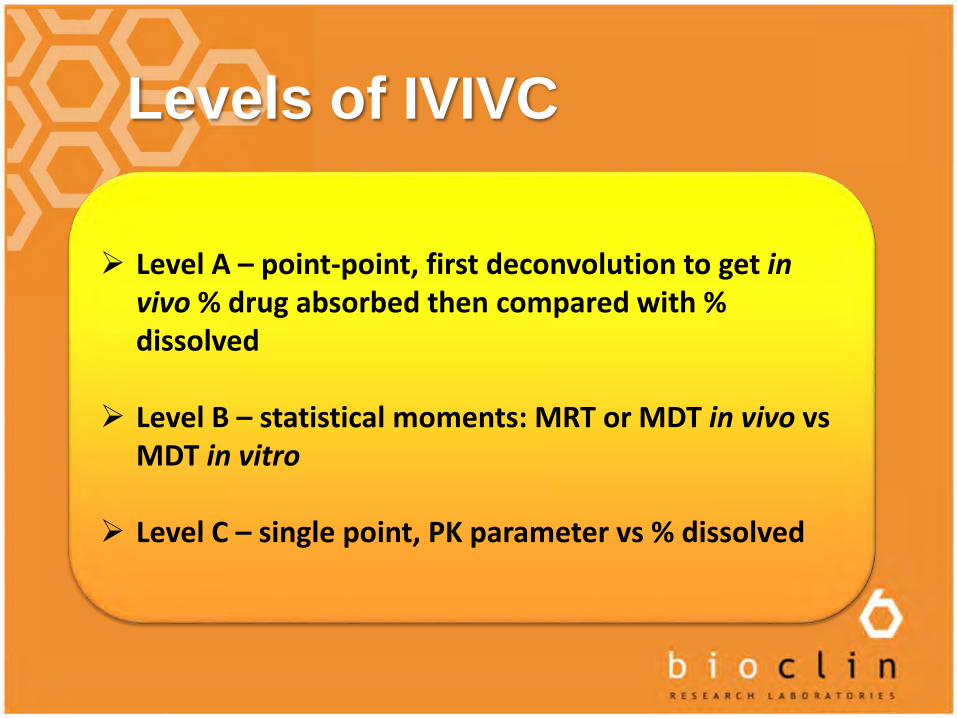
Levels of IVIVC
Level A – point-point, first deconvolution to get in vivo % drug absorbed then compared with % dissolved
Level B – statistical moments: MRT or MDT in vivo vs MDT in vitro
Level C – single point, PK parameter vs % dissolved
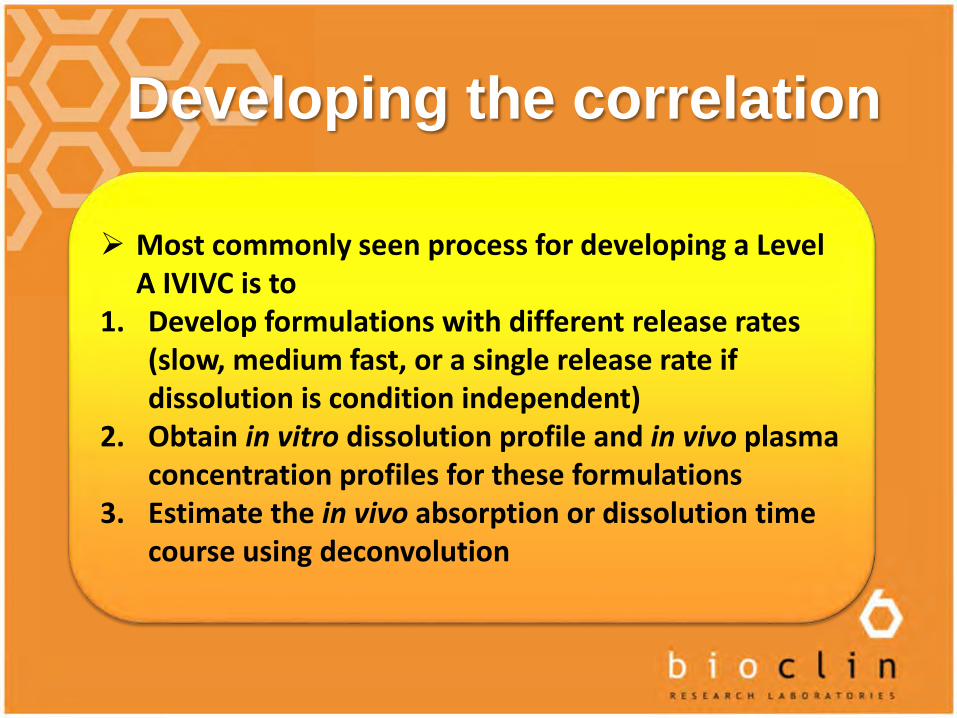
Developing the correlation
Most commonly seen process for developing a Level A IVIVC is to
1. Develop formulations with different release rates (slow, medium fast, or a single release rate if dissolution is condition independent)
2. Obtain in vitro dissolution profile and in vivo plasma concentration profiles for these formulations
3. Estimate the in vivo absorption or dissolution time course using deconvolution
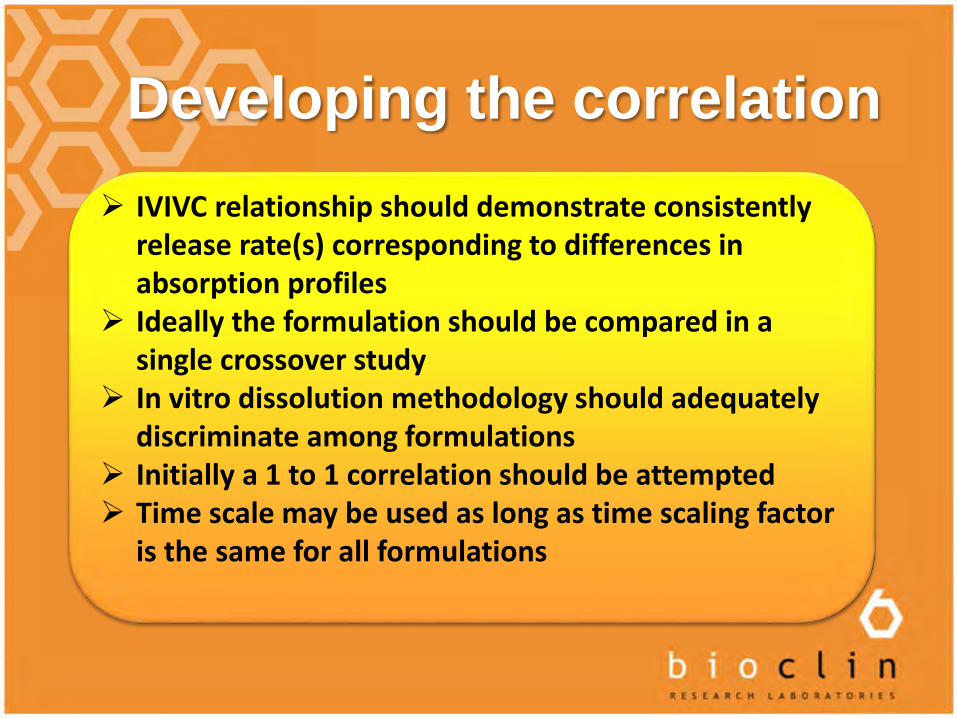
Developing the correlation IVIVC relationship should demonstrate consistently
release rate(s) corresponding to differences in absorption profiles
Ideally the formulation should be compared in a single crossover study
In vitro dissolution methodology should adequately discriminate among formulations
Initially a 1 to 1 correlation should be attempted Time scale may be used as long as time scaling factor
is the same for all formulations
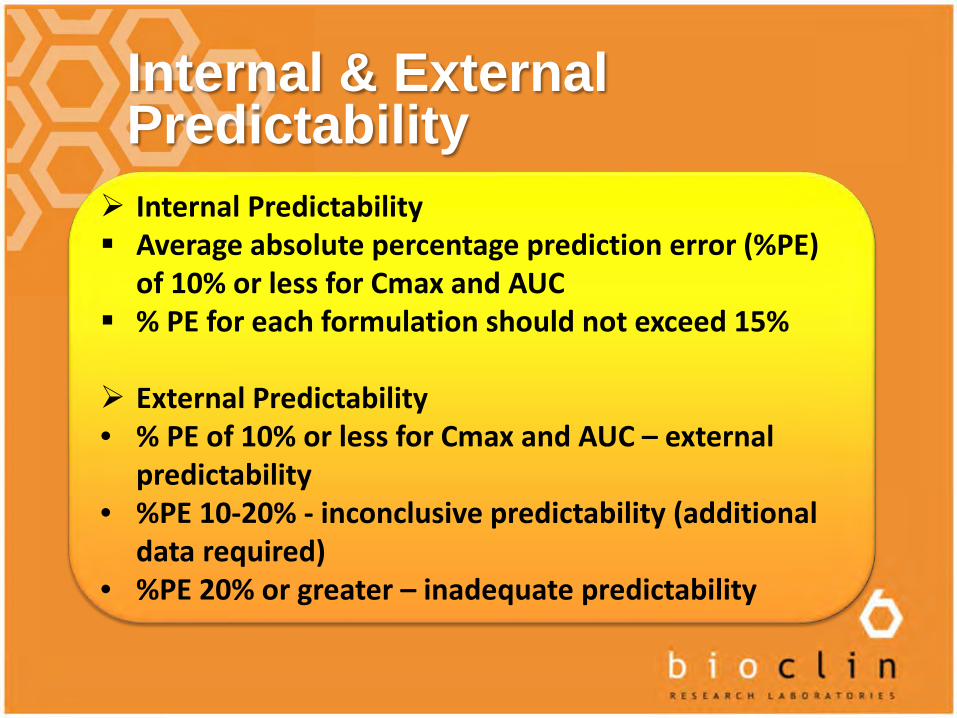
Internal & ExternalPredictability Internal Predictability Average absolute percentage prediction error (%PE)
of 10% or less for Cmax and AUC % PE for each formulation should not exceed 15%
External Predictability• % PE of 10% or less for Cmax and AUC – external
predictability• %PE 10-20% - inconclusive predictability (additional
data required)• %PE 20% or greater – inadequate predictability
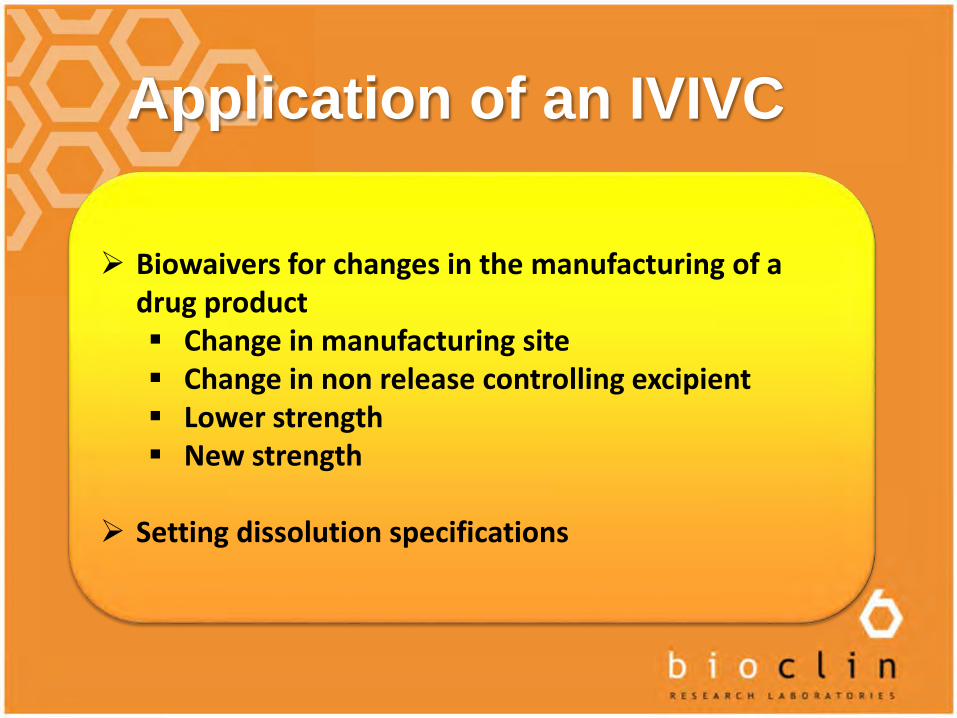
Application of an IVIVC
Biowaivers for changes in the manufacturing of a drug product Change in manufacturing site Change in non release controlling excipient Lower strength New strength
Setting dissolution specifications
In Vitro In Vivo Correlation
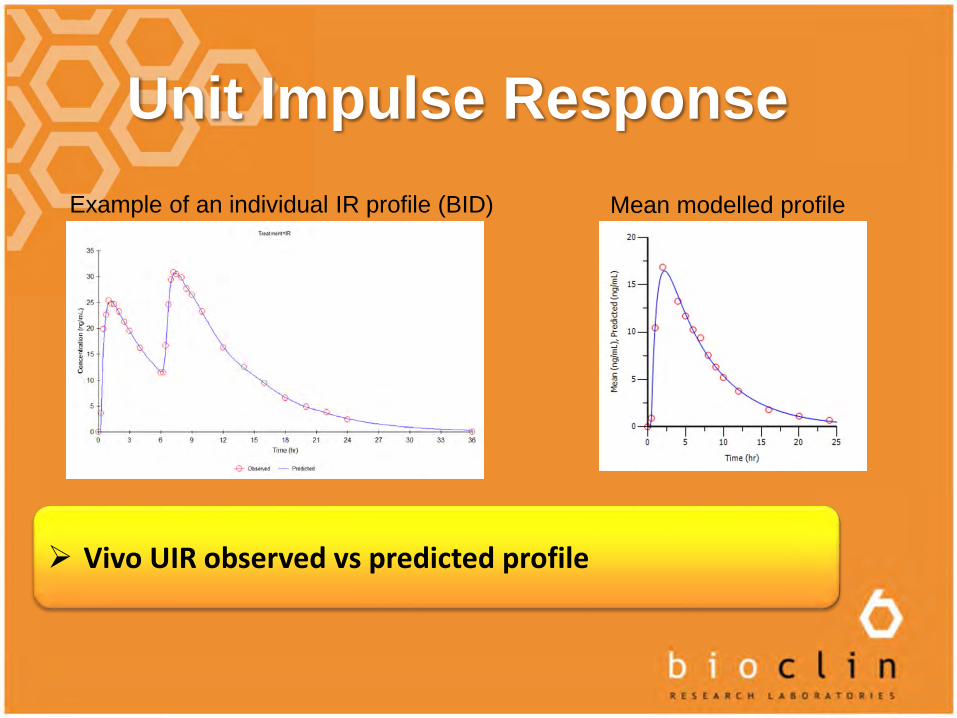
Unit Impulse Response
Vivo UIR observed vs predicted profile
Example of an individual IR profile (BID) Mean modelled profile
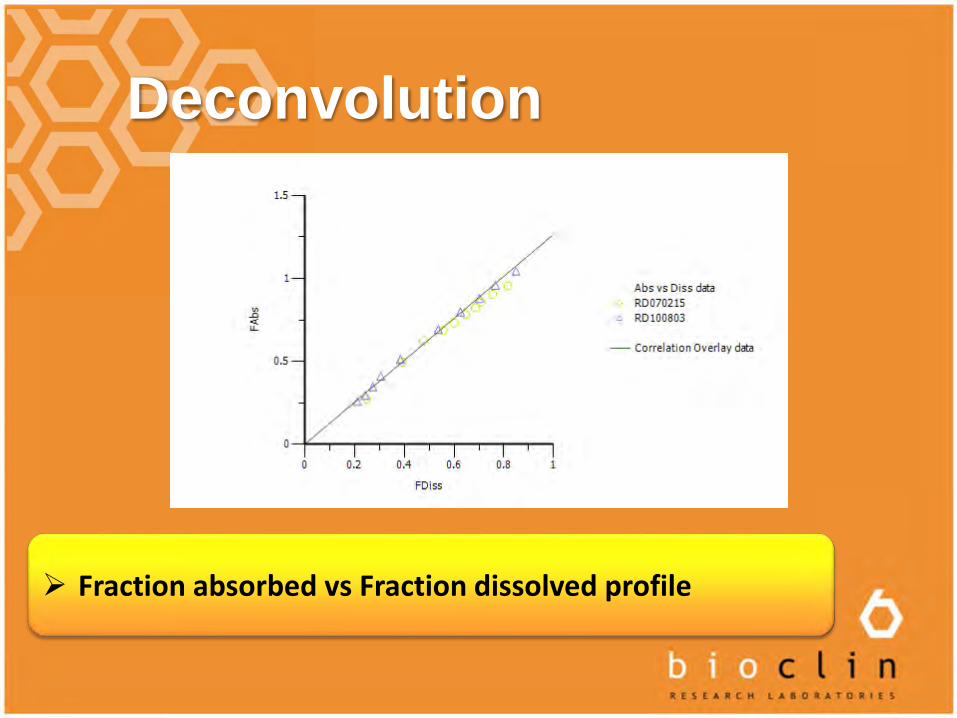
Deconvolution
Fraction absorbed vs Fraction dissolved profile
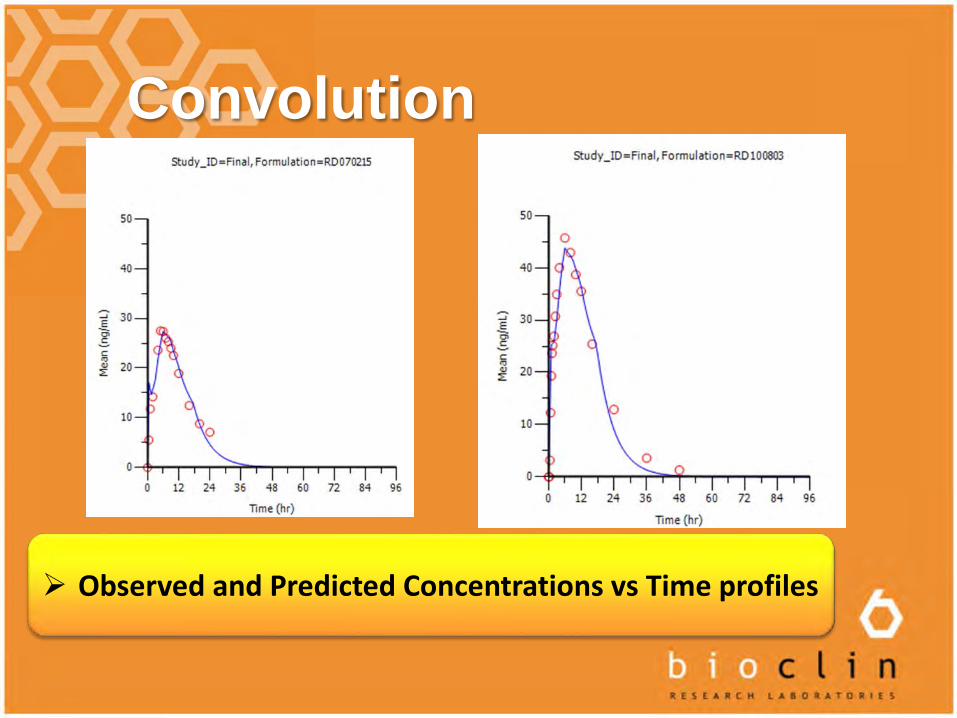
Convolution
Observed and Predicted Concentrations vs Time profiles
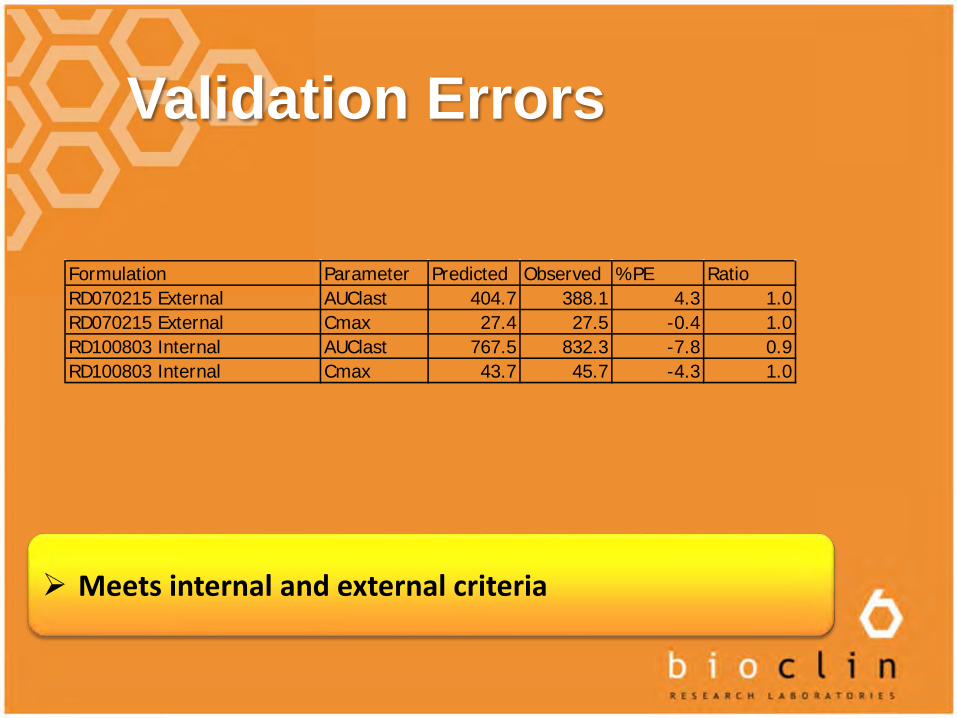
Validation Errors
Meets internal and external criteria
Formulation Parameter Predicted Observed %PE RatioRD070215 External AUClast 404.7 388.1 4.3 1.0RD070215 External Cmax 27.4 27.5 -0.4 1.0RD100803 Internal AUClast 767.5 832.3 -7.8 0.9RD100803 Internal Cmax 43.7 45.7 -4.3 1.0

we have made it!!Thank you for listening!
any questions?