bioremediation of drought stressed wheat (triticum ...€¦ · 2016 vol.5 (4) october-december, pp....
TRANSCRIPT
Indian Journal of Plant Sciences ISSN: 2319–3824(Online) An Open Access, Online International Journal Available at http://www.cibtech.org/jps.htm 2016 Vol.5 (4) October-December, pp. 83-93/Abou-Zeid and Abdel-Latif
Research Article
Centre for Info Bio Technology (CIBTech) 83
BIOREMEDIATION OF DROUGHT STRESSED WHEAT (TRITICUM
AESTIVUM L.) SEEDLINGS
*Hanan M. Abou-Zeid1 and Salwa A. Abdel–Latif
2
1Botany and Microbiology Department, Faculty of Science, Alexandria University, Alexandria, Egypt
2Biology and Geology Department, Faculty of Education, Alexandria University, Egypt
*Author for Correspondence
ABSTRACT
A study was conducted to evaluate the effects of microbin biofertilizer, a mixture of nitrogen-fixing and
phosphate-dissolving bacteria (Azotobacter sp. and Azospirillium sp. and Bacillus megaterium) for
ameliorating negative effects of drought stress on growth and growth indices, photosynthetic efficiency,
antioxidant enzymes, and phytohormones of wheat (Triticum aestivum L.). Two levels of irrigation (90%
and 50% of field capacity) were employed in presence and absence of biofertilizer. Wheat seedling
exhibited a retardation of growth, a reduction of the photosynthetic efficiency, relative water content, and
membrane stability index, as well as the increase of the antioxidant enzymes like superoxide dismutase,
peroxidase, ascorbate peroxidase and catalase, the production of malondialdehyde, hydrogen peroxide,
and the extensive impairments in cellular ultra-structure in response to drought stress. Phytohormones
indole-3 acetic acid (IAA), gibberellic acid (GA) contents were decreased as a result of water deficit;
conversely, absicic acid (ABA) showed a marked increase. The interaction of microbin biofertilizer and
water stress showed a remarkable improving in growth characteristics and in some physiological
parameters. The overall results suggest that application of microbin biofertilizer inoculation alleviates to
some extent the deleterious effects of drought stress on wheat seedlings.
Keywords: Antioxidant Enzymes, Biofertilizer, Photosynthetic Efficiency, Phytohormones, Water Stress
INTRODUCTION Drought is a worldwide problem, constraining global crop production seriously and has detrimental
effects on most of plant growth stages such as germination, seedling growth, physiological activities and
ultimately the plant yield (Azimi et al., 2013). Wheat (Triticum aestivum L.) is considered the most
strategic crop for Egypt and many other developing countries. Wheat should be irrigated when 50–55% of
the available soil water is depleted in the root zone (Doorenbos and Pruitt, 1992). Limitation of irrigation
water resources is a widespread growing problem for cultivation of agricultural crops. When plants are
exposed to environmental stresses such as drought, reactive oxygen species (ROS) like, superoxide (O2•),
hydrogen peroxide (H2O2), hydroxyl radicals (OH•) and singlet oxygen (1O) are produced. The balance
between the production of ROS and the quenching activity of the antioxidants is upset and this often
results in oxidative damage (Jung, 2004). To reduce the toxicity of ROS, plant cells have developed an
anti oxidative system, consisting of protective enzymes. Superoxide radicals are scavenged by superoxide
dismutase, while the resulting H2O2 is reduced to H2O by catalase, peroxidase and ascorbate peroxidase
(Apel and Hirt, 2004). Plants respond and adapt to drought stress through various biochemical changes
including changes of the endogenous hormone levels (Monneveux and Belhassen, 1996). Plants can
recruit abscisic acid as an endogenous, signal to initiate adaptive responses (Wang et al., 2008). However,
the variation of IAA and GA contents under drought stress are contradictory. It was reported that drought
resulted in a decrease of IAA content in the leaves of wheat (Xie et al., 2003). However, Pustovoitova et
al., (2004) reported that adaptation to drought was accompanied with an increase in the IAA content.
Current soil management strategies are mainly dependent on inorganic chemical-based fertilizers, which
caused a serious threat to human health and environment. The exploitation of beneficial microbes as a
biofertilizer has become paramount importance in agriculture sector for their potential role in food safety
and sustainable crop production (Bhardwaj et al., 2014). Biofertilizers containing microorganism, which
have an ability to convert nutritionally important elements to available form through biological processes

Indian Journal of Plant Sciences ISSN: 2319–3824(Online) An Open Access, Online International Journal Available at http://www.cibtech.org/jps.htm 2016 Vol.5 (4) October-December, pp. 83-93/Abou-Zeid and Abdel-Latif
Research Article
Centre for Info Bio Technology (CIBTech) 84
(Vessey, 2003). Water and nutrients are the most important factors during plant growth and development.
Deficit irrigation and use of biological fertilizers are the critical components to crop production in
sustainable farming systems (Canbolat et al., 2006). Microorganisms could play a significant role in stress
management, also provide excellent models for understanding stress tolerance mechanisms that can be
subsequently engineered into crop plants. The main objective of this study was to investigate the effect of
microbin biofertilizer on wheat (Triticum aestivum L.) growth, photosynthetic pigments, photochemical
activity of photo system II (PSII), ultra-structure, antioxidant defense system, in addition to monitor the
relative water content, lipid peroxidation, and membrane stability index, as well as the changes in the
endogenous level of phytohormones under normal irrigation and drought stress.
MATERIALS AND METHODS Wheat (Triticum aestivum L.) cv. Sakha 93 was used in this study, purchased from the International
Research Center, El-Dokki, Giza, Egypt. Grains were subjected to surface sterilization with 0.1% sodium
hypochlorite solution for 5min and then rinsed several times with distilled water. Grain inoculation was
performed by mixing wheat grains with the microbin using Arabic gum as adhesive material. Microbin, a
commercial multi-strains biofertilizer is produced by biofertilizers unit, General Organization of
Agriculture Equalizaton Fund, Agriculture Research Centre, Ministry of Agriculture, Giza, Egypt. It is
constituted of a mixture of N2-fixing and P-dissolving bacteria, the treated biofertilizer containing N-free
living bacteria (Azotobacter sp. and Azospirillium sp.) and a phosphate dissolving bacteria (Bacillus
megaterium). The coated grains were then air dried in shade for 30 minutes and inoculated and
uninoculated grains were sown immediately in pots containing soil and sand mixture (1:2). The pots (in
triplicates) were placed in growth chamber under 14h light/10h dark cycle at 23/18±2°C for 20 days. Pots
were divided into two sets (inoculated and uninoculated) both irrigated with half strength Hoagland´s
nutrient solution (Hoagland and Arnon, 1950) till water field capacity. Drought stress treatment was
started after 5 days from sowing, two treatments were imposed viz, 90%, and 50% of the field capacity,
these treatments reflecting conditions achieved as optimum level of water supply (control plants) and
drought stress, respectively.
Plant Growth Parameters
At harvest (20 days) plant samples were collected, in order to avoid damaging the roots when they pull
out, all of the pots were temporarily waterlogged for 1h. After carefully uprooting, the plant samples were
divided into shoots and roots. The samples were washed several times with distilled water, and the plant
shoot height and root length (cm) were measured. To determine the dry weight, the shoots and roots were
oven-dried separately at 70°C for 72h. Fresh leaves were used for different biochemical analysis.
Photosynthetic Pigment Contents
The pigment fractions (chlorophyll a, chlorophyll b and carotenoids) were estimated by the method
described by Lichtenthaler (1987). Leaf tissues (50mg) were homogenized in 10ml chilled acetone (80%).
The homogenate was centrifuged at 4,000g for 12min. Absorbance of the supernatant was recorded at
663, 647 and 470nm (using a T80 UV–Vis spectrophotometer - double beam).
Chlorophyll Fluorescence
Measurements of chlorophyll fluorescence (Fv/Fm) were performed by OS-30P pulse modulated
chlorophyll fluorimeter (Opti-sciences, Hudson, USA). Before every measurement, leaves were dark-
adapted for 30 min with leaf-clips (Branquinho et al., 1997).
Estimation of Photosynthetic Activity (PS II)
Chloroplast thylakoid membranes (PS II membranes) were isolated from wheat leaves according to Arnon
(1949) method. Photo system II activity, as indicated by the rate of 2,6-dichlorophenol indophenol
(DCPIP) photo reduction, was monitored at 600nm using a spectrophotometer as described by Trebest
(1972).
Ultra-Structural Analysis
Fresh tissues (1–2mm2) taken from last fully expanded leaves were prepared according to method of
Loreto et al., (2001) for electron microscopy processing. The ultra-structure visualization and
Indian Journal of Plant Sciences ISSN: 2319–3824(Online) An Open Access, Online International Journal Available at http://www.cibtech.org/jps.htm 2016 Vol.5 (4) October-December, pp. 83-93/Abou-Zeid and Abdel-Latif
Research Article
Centre for Info Bio Technology (CIBTech) 85
photographing were carried out using the Transmission Electron Microscope (JEOL-TEM 100 CX) at the
Electron Microscopic Unit, Faculty of science, Alexandria University.
Relative Water Content
The relative water content was estimated according to Turner (1981 ( and was evaluated from the
equation: RWC (%) = (FW – DW) / (TW – DW) x100, where FW is the fresh weight of the leaves, TW is
the weight at full turgor, measured after floating the leaves for 24 hours in water at room temperature and
DW is the weight estimated after drying the leaves for 4 hours at 80ºC or until a constant weight is
achieved.
Membrane Stability Index
Membrane stability index (MSI) was determined by recording the electrical conductivity of leaf leachates
in double distilled water at 40 and 100ºC. Leaf samples (0.1g) were cut into discs of uniform size and
taken in test tubes containing 10 ml of double distilled water in two sets. One set was kept at 40ºC for 30
minutes and another set at 100ºC in boiling water bath for 15 minutes and their respective electric
conductivities C1 and C2 were measured by conductivity meter (Deshmukh et al., 1991).
Membrane stability index = [1- (C1/C2)] x 100
Determination of Malondialdehyde and Hydrogen Peroxide Content
The level of lipid peroxidation products was estimated and expressed as malondialdehyde (MDA)
according to Buege and Aust (1978). The MDA concentrations were expressed as μmol g-1
DW.
Hydrogen peroxide levels were determined according to Sergiev et al., (1997) and the concentrations
were expressed as mmol g-1
DW.
Extraction and Determination of Antioxidant Enzymes Activities
Fresh wheat leaves (1g) were homogenized in ice cold 50mM phosphate buffer (pH 7.5) containing
0.5mM EDTA with prechilled pestle and mortar.
The homogenate was centrifuged at 10,000g for 10 min at 4°C and the supernatants were collected and
used for the determination of different enzyme activities. The protein content in the enzyme extract was
determined according to Hartree (1972).
Superoxide dismutase (SOD) activity was determined following the method used by Giannopolitis and
Ries (1977) where its ability to inhibit the photo reduction of nitroblue tetrazolium (NBT) was measured.
Catalase (CAT) activity was assayed with the method of Zhang et al., (2005).
One unit of enzyme determined the amount necessary to decompose 1μmol of H2O2 per min at 25°C.
Peroxidase (POD) activity was determined according to Noreen and Ashraf (2009). Changes in
absorbance of the reaction solution at 470nm were determined after every 20s.
Ascorbate peroxidase (APX) activity was assayed by the following reduction in absorbance at 290nm as
ascorbate was oxidized according to the method of Boominathan and Doran (2002). The mixture
contained 50mM phosphate buffer (pH 7), 0.2mM EDTA, 0.5mM ascorbic acid and 50µg bovine serum
albumin.
Determination of Plant Phytohormons Hormones were extracted and purified following Kettner and Doerffling (1995) procedure. The plant
leaves (1g) were ground in 80% methanol at 4°C for 72 hr with an antioxidant, butylated hydroxyl
toluene. The extracted sample was centrifuged and the supernatant was reduced to aqueous phase using
rotary evaporator.
The pH of aqueous phase was adjusted to 2.5-3.0 and extracted four times with half volume of ethyl
acetate. The ethyl acetate was dried completely using rotary evaporator and the dried sample was
redissolved in 1ml of methanol (100%) and was analyzed on HPLC (Agilent technologies 1200 series)
Exclipse XDB C18 (5 µm, 4.6 X 150 mm) column and using UV detector. Samples were injected into
HPLC column for identification and quantification.
Isocratically eluted at 2ml min-1
with methanol, 2% acetic acid and H2O (40:20:20) as mobile phases,
detection was performed with an absorbance monitor operating at 254 nm. Identification and peak
assignment of the compound was based on comparison of its retention time with corresponding standard
and by spiking of sample with the standard.

Indian Journal of Plant Sciences ISSN: 2319–3824(Online) An Open Access, Online International Journal Available at http://www.cibtech.org/jps.htm 2016 Vol.5 (4) October-December, pp. 83-93/Abou-Zeid and Abdel-Latif
Research Article
Centre for Info Bio Technology (CIBTech) 86
Statistical Analysis
Statistical analysis of the results was carried out according to Duncan’s multiple range tests using SPSS-
20. Data were subjected to one-way ANOVA following the method of Sokal and Rohlf (1995).
Differences between treatment-means were considered statistically significant at p≤0.05.
RESULTS AND DISCUSSION
Results
Data represented in Figure 1 showed that the wheat plants (Triticum aestivum L.) inoculated with
microbin biofertilizer, recorded a significant (P˂0.05) increase in all plant growth parameters (shoot and
root lengths and dry weights) and photosynthetic pigments content comparing with uninoculated plants
in the normal irrigation (control plants) or drought treatment. In general, plants were negatively affected
by water deficit treatment as compared with normal irrigation treatment. Water stress could restrict dry
weight and tissue water content, also shoot and root lengths. The reduction in shoot and root lengths and
dry weights was 35%, 42% and 39%, 60% respectively, compared to the control. There was a reduction in
RWC, the maximum reduction in RWC reached about 52% compared to the control. Microbin inoculated
plants showed significantly increase in dry matter, longer shoot and root length in comparison with the
drought stressed plants (Figure 1B).
Figure 1: Effect of Inoculation by Bacterial Biofertilizer on Shoot and Root, (A) Lengths, (B) Dry
Weights and (C) Leaf RWC at Normal and Drought Treatment of Wheat Plants. Values are Means
±SD Based on Triplicate Independent Determinations, and Different Letters Means Significant
Difference as Evaluated by Duncan´s Multiple Comparison Test; C: Normal Irrigation (Control),
D: Drought, C+F: Control+ Biofertilizer, D+F: Drought + Biofertilizer
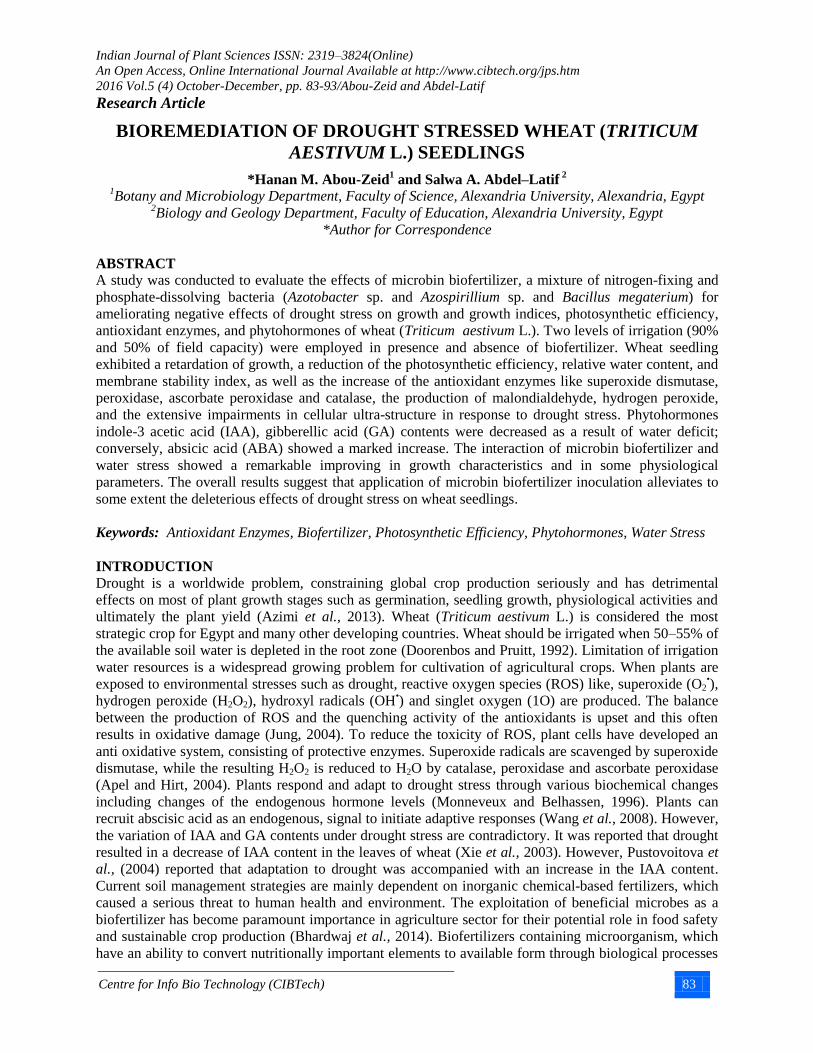
Chlorophylls and carotenoids content were also affected by drought stress; control plants exhibited higher
total chlorophyll content, the percent inhibition reached 53% in drought stressed plants. Application of
biofertilizer increases to some extent the total chlorophyll content, the increase value reached nearly about
1.2-fold compared to the control. Carotenoids were insignificantly affected by application of biofertilizer,
conversely, there was a significant increase in response to drought, and the increase value was about 1.3-
fold compared to the control (Figure 2A). In addition, the ratio of Car/Chl significantly increased under
drought with respect to the control and the biofertilizer treated plants (Figure 2B). The study of PSII
a
b
a
c
a b c
a
0
5
10
15
20
25
30
C D C+F D+F
Len
gth
(cm
)
A Shoot Root
a
b
c
d
a b
a c
0
0.5
1
1.5
2
C D C+F D+ F
Dry
wei
ght
(g 5
ind
t-1) B Shoot Root
a
b
a ab
0
10
20
30
40
50
60
70
80
90
C D C+F D+ F
RW
C
Treatment
C
Indian Journal of Plant Sciences ISSN: 2319–3824(Online) An Open Access, Online International Journal Available at http://www.cibtech.org/jps.htm 2016 Vol.5 (4) October-December, pp. 83-93/Abou-Zeid and Abdel-Latif
Research Article
Centre for Info Bio Technology (CIBTech) 87
photochemistry showed that there was a marked decrease in the PSII and in maximal quantum yield
Fv/Fm of water-stressed plants compared to the control, the reduction percentage was about 40% and
31% respectively. Application of biofertilizer alleviated the adverse effect of drought stress in wheat
leaves (Figure 2C and D).
Compared with the control, water deficit treatment led to considerable ultra structural alterations in
organelles. Focusing on the chloroplast, control wheat leaves exhibited a typical chloroplast structure,
ellipsoidal shape, with well displayed thylakoid membranes organized in granal and stromal membranes
(Figure 3). In the corresponding tissues of the plants submitted to drought stress, the chloroplasts suffered
severe damage. Two types of changes could be distinguished, the first one was the chloroplasts became
more rounded instead of an ellipsoidal shape; and the second, there was disruption of the membrane
structure and the integrity of the outer membrane and the internal network of thylakoid membranes was
almost completely lost. During drought and subsequent biofertilizer recovery in the chloroplasts, slight
changes of the stromal and grana lamellae region could be observed.
Figure 2: Effect of Inoculation by Bacterial Biofertilizer on Photosynthetic Pigments (A), Ratio
between Carotenoids and Chlorophylls and Photosynthesis Activity {Fv/Fm (C) and PSII (D)} at
Normal Irrigation and Drought Treatment of Wheat Plants. Values are Means ±SD Based on
Triplicate Independent Determinations and Different Letters Means Significant Difference as
Evaluated by Duncan´s Multiple Comparison Test; C: Normal Irrigation (Control), D: Drought,
C+F: Control+ Biofertilizer, D+F: Drought+ Biofertilizer
Data in Figure 4(A and B) revealed that the concentration of MDA, and H2O2 were significantly increased
in the wheat leaves due to drought stress, values reached about 2.5- and 1.7- fold higher than the control.
Treatment of biofertilizer accompanied with water deficit significantly decreased the MDA and H2O2
contents compared to the control. Data of MSI were represented in Figure 4C, compared to the control
plants; the MSI was markedly decreased under drought condition, while plants previously inoculated with
biofertilizer seemed to be ameliorated. Simple linear regression was obtained in the present study (Figure
5A and B) showed that the coefficient of determination (R2) between H2O2 , MDA content in treated and
control leaves and MSI were about 0.908 and 0.881, respectively.
a
b
c
a
a b a c
a
b
c
d
a b a a
0
0.5
1
1.5
2
2.5
3
3.5
4
C D C+F D+F
mg
g-1 F
W
A Chl.a Chl.b Chl.a+ Chl.b Carot.
18%a
47%c
14%b
21%a
Car/a+b B
C D
C+F D+ F
a
b
a a
0
0.1
0.2
0.3
0.4
0.5
0.6
0.7
0.8
0.9
C D C+F D+ F
Fv/F
m
Treatment
C
a
b
a
c
0
20
40
60
80
100
120
140
160
180
200
C D C+F D+ F
PS
II(µ
m D
CP
IP r
ed. m
gCh
l.-1
h-1
)
Treatment
D

Indian Journal of Plant Sciences ISSN: 2319–3824(Online) An Open Access, Online International Journal Available at http://www.cibtech.org/jps.htm 2016 Vol.5 (4) October-December, pp. 83-93/Abou-Zeid and Abdel-Latif
Research Article
Centre for Info Bio Technology (CIBTech) 88
Figure 3: Transmission Electron Micrographs of Leaf Mesophyll Cells from Normal Irrigation and Drought
Treatment of Wheat Plants Inoculated by Bacterial Biofertilizer and Uninoculated; C: Normal Irrigation
(Control), D: Drought, D+F: Drought + Biofertilizer, (Th) Thylakoid, (CM) Chloroplast Membrane, (M)
Mitochondria, (CW) Cell Wall
Figure 4: Effect of Inoculation by Bacterial Biofertilizer on (A) H2O2), (B) MDA Content and (C)
MSI at Normal Irrigation and Drought Treatment of Wheat Plants. Values are Means ±SD Based
on Triplicate Independent Determinations, and Different Letters Means Significant Difference as
Evaluated by Duncan´s Multiple Comparison Test; C: Normal Irrigation (Control), D: Drought,
C+F: Control+ Biofertilizer, D+F: Drought + Biofertilizer
a
b
a c
0
0.5
1
1.5
2
C D C+F D+ F
H2O
2 (m
mo
l g-1
DW
)
Treatment
A
a
b
a
a
0
10
20
30
40
50
C D C+F D+ F
MD
A (
μm
ol g
-1 D
W)
Treatment
B
29%a
18%c 29%a
24%b
MSI C
C
D
C+F
D+ F

Indian Journal of Plant Sciences ISSN: 2319–3824(Online) An Open Access, Online International Journal Available at http://www.cibtech.org/jps.htm 2016 Vol.5 (4) October-December, pp. 83-93/Abou-Zeid and Abdel-Latif
Research Article
Centre for Info Bio Technology (CIBTech) 89
Figure 5: Regression Analysis between the H2O2, (A) MDA (B) and MSI
Results in Figure 6 illustrated that drought stress caused a significant increase of SOD, POD CAT, and
APX specific activities, the values were 2-, 1.7-, 1.6-, and 1.6-fold higher than that of the control. Data of
plants under well watered conditions, inoculated with biofertilizer showed activities nearly similar to that
of the control. On the other hand plants inoculated with biofertilizer and stressed showed reduction in the
specific activities of all tested antioxidant enzymes compared to the drought stressed ones.
Except for abscisic acid, the IAA and GA contents of wheat leaves were inhibited by ratio of 28% and
46% respectively due to water deficit compared to the control. Application of biofertilizer in well watered
plants enhanced both IAA and GA, the amount was increased about 1.8- and 1.2-fold, respectively
compared with uninoculated plants. Absicic acid was markedly increased under drought stress; the
amount was 5-fold greater than control. In leaves treated with biofertilizer and grown under drought
condition the ABA content was reached 35% less compared with drought stressed leaves (Figure 7).
Figure 6: Effect of Inoculation by Bacterial Biofertilizer on Antioxidant Enzymes Activities (SOD,
CAT, POD, and APX) at Normal Irrigation and Drought Treatment of Wheat Plants. Values are
Means ±SD Based on Triplicate Independent Determinations, and Different Letters Means
Significant Difference as Evaluated by Duncan´s Multiple Comparison Test; C: Normal Irrigation
(Control), D: Drought, C+F: Control + Biofertilizer, D+F: Drought + Biofertilizer
y = -0.0213x + 2.9028 R² = 0.9089
0 0.2 0.4 0.6 0.8
1 1.2 1.4 1.6 1.8
2
0 50 100
H2O
2 (m
mo
l g-1
DW
)
MSI
A
y = -0.58x + 69.553 R² = 0.8813
0 5
10 15 20 25 30 35 40 45
0 50 100
MD
A (
μm
ol g
-1 D
W)
MSI
B
a
b
ac
c
0
5
10
15
20
25
30
35
C D C+F D+ F
Un
its
mg-1
pro
tein
min
-1 SOD
a
b
c a
0
10
20
30
40
50
60
70
C D C+F D+ F
μm
ol H
2O
2m
g1p
rote
in m
in-1
CAT
a
b
a
c
0
2
4
6
8
10
12
14
16
18
C D C+F D+ F
OD
47
0 m
g-1p
rote
in m
in-1
Treatment
POD
a
b
ac c
0
2
4
6
8
10
C D C+F D+ F
∆ A
bs 2
90
mg-1
pro
tein
min
-1
Treatment
APX

Indian Journal of Plant Sciences ISSN: 2319–3824(Online) An Open Access, Online International Journal Available at http://www.cibtech.org/jps.htm 2016 Vol.5 (4) October-December, pp. 83-93/Abou-Zeid and Abdel-Latif
Research Article
Centre for Info Bio Technology (CIBTech) 90
Figure 7: Effect of Inoculation by Bacterial Biofertilizer on Phytohormons (IAA, GA, and ABA) at
Normal Irrigation and Drought Treatment of Wheat Plants. Values are Means ±SD Based on
Triplicate Independent Determinations, and Different Letters Means Significant Difference as
Evaluated by Duncan´s Multiple Comparison Test; C: Normal Irrigation (Control), D: Drought,
C+F: Control + Biofertilizer, D+F: Drought + Biofertilizer
Discussion Different bacterial strains are being used in bioremediation processes, in this study, microbin a mixed
biofertilizer was used to determine its effect to improve wheat plant tolerance for drought stress. Among
studied treatments the microbial inoculations was significant and the highest promoting effect observed in
well irrigated treatment compared with the uninoculated stressed ones. According to the results, there was
a marked decrease in growth parameters, shoot and root lengths, and dry weight, RWC and the total
chlorophyll content under drought stress condition compared with normal water supply treatment (control
plants). In consensus, Khalil and Yousef (2014) reported that, the reduction in plant growth in response to
water stress may be due to blocking up of xylem and phloem vessels thus, hindering any translocation
through them. Also, drought causes losses in tissue water content which reduce turgor pressure in cell,
thereby inhibiting enlargement and division of cell causing of reduce of plant growth and dry mass
accumulation (Delfine et al., 2002). In this investigation, the maximum photochemical efficiency of PSII
and the ratio Fv/Fm were estimated, their amounts were decreased under drought stress. The cellular
ultra-structural analysis illustrated that the chloroplasts became rounded, with a disintegrating envelope
and disrupted and irregularly shaped grana lamellae (Figure 3), this indicates serious damage to
chloroplast structure, consistent with Batra et al., (2014) who reported that drought stress causes not only
a substantial damage to photosynthetic pigments, but it also leads to deterioration of thylakoid
membranes. Under prevailing study, the carotenoids (Car) content and Car/Chl ratio were increased in
response to drought stress, this may referred to protective role of carotenoids in photosynthesis; photo
protection and their antioxidant activity. Drought caused considerable oxidative stress by accumulation of
ROS (Mittler, 2002). In present study the activities of SOD, POD, CAT, and APX enzymes in wheat
leaves were increased as a result of water stress. These results are in a good accord with the study of
Rohman et al., (2016) who found that enzymes like SOD, POD and APX were involved in scavenging
ROS in maize in breds under drought stress. Data showed that the MDA content was significantly higher
in stressed leaves this may be referred to the induction of membrane lipid per oxidation by means of ROS
our results were in agreement with Moussa and Aziz (2008). The lower membrane stability index reflects
the extent of lipid peroxidation, which in turn is a consequence of higher oxidative stress due to water
stress conditions, our data on H2O2 content also support these findings (Figure 4). In accordance with our
results Buchanan et al., (2000) confirmed that water stress caused water loss from plant tissues which
seriously impair both membrane structure and function. The results of this study also indicated a
significant decrease of IAA and GA production and increase in ABA in the leaves due to drought stress
that might be responsible, at least partly, for reduction of the root and shoot dry weight. Saleem et al.,
(2007) declared that, the over production of ABA in response to abiotic and biotic stresses leads to
a
b
c
a
a
b
c
a
a
b
a
c
0
0.5
1
1.5
2
2.5
3
3.5
C D C+F D+ F
µg
g-1 F
W
Treatment
IAA GA ABA

Indian Journal of Plant Sciences ISSN: 2319–3824(Online) An Open Access, Online International Journal Available at http://www.cibtech.org/jps.htm 2016 Vol.5 (4) October-December, pp. 83-93/Abou-Zeid and Abdel-Latif
Research Article
Centre for Info Bio Technology (CIBTech) 91
inhibition of root growth and, consequently, inhibition of the plant growth under stress conditions. Hu et
al., (2010) reported that ABA may induce antioxidant defense systems and suppress toxicity of ROS
under drought stress. Results showed that the effect of interaction between water stress and biofertilizer
(microbin) treatment was evaluated positively. The present results are in agreement with those obtained
by Heidari and Golpayegani (2012) who found that inoculation with rhizobacteria could be efficiently
used to improve growth, antioxidant status and photosynthetic pigments under water stress. They also
reported that a significant increase was found in the inoculation with growth promoting rhizobacteria,
especially combination of the bacterial species. Based on the results, the lower values of MDA and H2O2
in response to application of microbin combined with water deficit indicate that at a cellular level wheat
plants are equipped with an efficient free radical quenching system that offers protection against oxidative
stress. Moreover, microbial inoculation affect positively toward IAA and GA accumulation and reduction
in ABA content compared to the stressed leaves. The improve of the photosynthetic capacity of wheat
treated with microbin biofertilizer might be due to the increase of the availability of phosphorus, nitrogen
and other nutrients, this appeared to coincide with the positive effects on the dry mass accumulation. In
agreement with our results García-Fraile et al., (2015) reported that, bacterial biofertilizers can improve
plant growth through the synthesis of plant nutrients or phytohormones, which can be absorbed by plants.
Likewise, Selvakumar et al., (2012) reported that, biofertilizer significantly improved chlorophyll
concentration, this is because, nitrogen is the chief constituent of protein, essential for the formation of
protoplasm, which leads to cell enlargement, cell division and ultimately resulting in increased plant
growth. Furthermore, Abou-Zeid (2014) reported that, the photosynthetic capacity of maize treated with
biofertilizer increased due to the increase of intracellular macronutrients such as K, Ca, Mg, and P that
might enhance chlorophyll biosynthesis and protect the photosynthetic systems. Microbin contains
Azotobacter sp. and Azospirillium sp. and Bacillus megaterium. Cohen et al., (2015) declared that as
compensation to root exudates secreted by plants, the microorganism plant association may improve plant
growth by synthesis of vitamins, antibiotics, enzymes and phytohormones, Azospirillum sp not only
generate plant growth promoting hormones, but also sprinkle hormones such as ABA in stress conditions.
(Marulanda-Aguirre et al., (2008), observed an increased level of chlorophyll content in Lactuca
sativa inoculated with Bacillus megaterium, this could be indicating the positive interaction of B.
megaterium this interaction might trigger the chlorophyll related enzymes for chlorophyll synthesis and
leads to increase the photosynthesis; also, plant-bacterial interaction alters the carbohydrate metabolisms
of plants. Recently, Esmaeili et al., (2016) stated that the adequate supplies of the micronutrients and
biofertilizer containing Azotobacter will have favorable effects on soybean quality and growth.
Conclusion
From the obtained results, it can be concluded that the dual application of phosphorus and nitrogen
biofertilizer resulted in improve and overcome the depressive effect of water stress on wheat plant.
Moreover, biofertilizers are important component in integrated nutrients managements, they are cost
effective, eco-friendly and renewable source of plant nutrients. From the present work the data showed
that the microbin biofertilizer improved some physiological parameters of the wheat plant. Biofertilizer
could play an important role in adaptation strategies and increase of tolerance to abiotic stresses such as
drought in agricultural plants. They might replace part of the use of chemical fertilizers, reduces amount
and cost of chemical and thus prevents the environment pollution from extensive application of chemical
fertilizers.
REFERENCES
Abou-Zeid HM (2014). The promotive role of algal biofertilizer on the growth of maize (Zea mays L.)
seedlings under cadmium stress. Journal of Experimental Biology and Agricultural Sciences 2 265-264.
Apel K and Hirt H (2004). Reactive oxygen species: Metabolism, oxidative stress, and signal
transduction. Annual Review of Plant Biology 55 373-399.
Arnon DI (1949). Copper enzymes in isolated chloroplasts. Polyphenoloxidase in Beta vulgaris. Plant
Physiology 24 1-15.

Indian Journal of Plant Sciences ISSN: 2319–3824(Online) An Open Access, Online International Journal Available at http://www.cibtech.org/jps.htm 2016 Vol.5 (4) October-December, pp. 83-93/Abou-Zeid and Abdel-Latif
Research Article
Centre for Info Bio Technology (CIBTech) 92
Azimi SM, Farnia A, Shabanand M and Lak M (2013). Effect of different biofertilizers on seed yield
of barley (Hurdeom vulgar L.) Bahman cultivar. International Journal of Advanced Biological and
Biomedical Research 1(5) 538-546.
Batra NG, Sharma V and Kumari N (2014). Drought-induced changes in chlorophyll fluorescence,
photosynthetic pigments, and thylakoid membrane proteins of Vigna radiate. Journal of Plant
Interactions 9(1) 712-721.
Boominathan R and Doran PM (2002). Ni induced oxidative stress in roots of the Ni hyper
accumulator, Alyssum bertolonii. New Phytologist 156 205-215.
Branquinho C, Brown DH and Catarino F (1997). The cellular location of Cu in lichens and its effects
on membrane integrity and chlorophyll fluorescence. Environmental and Experimental Botany 38 165-
179.
Bhardwaj D, Ansari MW, Sahoo RK and Tuteja N (2014). Biofertilizers function as key player in
sustainable agriculture by improving soil fertility, plant tolerance and crop productivity. Microbial Cell
Factories 13 66-75.
Buchanan BB, Gruissem W and Jones RL (2000). Biochemistry and Molecular Biology of Plants.
(Rockville, MD, USA: American Society of Plant Physiologists).
Buege JA and Aust SD (1978). Microsomal lipid peroxidation. Methods in Enzymology 52 302-310.
Canbolat MY, Bilen S, Çakmakçı R, Ahin F and Aydın A (2006). Effect of plant growth-promoting
bacteria and soil compaction on barley seedling growth, nutrient uptake, soil properties and rhizosphere
microflora. Biology and Fertility of Soils 42 350-357.
Cohen AC, Bottini R, Pontin M, Berli FJ, Moreno D, Boccanlandro H, Travaglia CN and Piccoli
PN (2015). Azospirillum brasilense ameliorates the response of Arabidopsis thaliana to drought mainly
via enhancement of ABA levels. Physiologia Plantarum 153 79-90.
Delfine S, Tognettir R, Loreto F and Alvino A (2002). Physiological and growth responses to water
stress in field grown bell pepper (Capsicum annuum, L.). Journal of Horticultural Science and
Biotechnology 77(6) 697-704.
Deshmuukh PS, Sairam RK and Shukla DS (1991). Measurement of ion leakage as a screening
technique for drought resistance in wheat genotypes. Indian Journal of Plant Physiology 34 89-91.
Doorenbos J and Pruitt WO (1992). Calculation of crop water requirements. In: Doorenbos, J., Pruitt,
W.O. (edition), Guideline for Predicting Crop Water Requirements: FAO Irrigation and Drainage. Paper
No. 24. (FAO, Rome, Italy) 1-65.
Esmaeili M, Heidarzade A and Ramezani S (2016). The effect of plant growth promoting rhizobacteria
(PGPR) and spray of micronutirnt on two soybean (Glycine max) cultivars. Journal of Agricultural and
Biological Science 11(2) 63-68.
García-Fraile P, Menéndez E and Rivas R (2015). Role of bacterial biofertilizers in agriculture and
forestry. Bioengineering 2(3) 183-205.
Giannopolitis CN and Ries SK (1977). Superoxide dismutase: II. Purification and quantitative
relationship with water-soluble protein in seedlings. Plant Physiology 59(2) 315-318.
Hartree EF (1972). Determination of protein: a modification of the Lowry method that gives a linear
photometric response. Analytical Biochemistry 48 422-427.
Heidari M and Golpayegani AA (2012). Effects of water stress and inoculation with plant growth
promoting rhizobacteria (PGPR) on antioxidant status and photosynthetic pigments in basil (Ocimum
basilicum L.). Journal of the Saudi Society of Agricultural Sciences 11(1) 57–61.
Hoagland DR and Arnon DI (1950). The water culture method for growing plants without soil. Circular
California Agricultural Experiment Station 347.
Hu XL, Liu RX, Li YH, Wang W, Tai FJ, Xue RL and Li CH (2010). Heat shock protein 70 regulates
the abscisic acid-induced antioxidant response of maize to combined drought and heat stress. Plant
Growth Regulation 60 225-235.
Jung S (2004). Variation in antioxidant metabolism of young and mature leaves of Arabidopsis thaliana
subjected to drought. Plant Science 166 459-466.

Indian Journal of Plant Sciences ISSN: 2319–3824(Online) An Open Access, Online International Journal Available at http://www.cibtech.org/jps.htm 2016 Vol.5 (4) October-December, pp. 83-93/Abou-Zeid and Abdel-Latif
Research Article
Centre for Info Bio Technology (CIBTech) 93
Kettner J and Doerffling K (1995). Biosynthesis and metabolism of abscisic acid in tomato leaves
infected with Botrytis cinerea. Planta Journal 196 627-634.
Khalil SE and Yousef RMM (2014). Study the effect of irrigation water regime and fertilizers on
growth, yield and some fruit quality of Hibiscus sabdariffa L. International Journal of Advanced
Research 2(5) 738-750.
Lichtenthaler HK (1987). Chlorophyll and carotenoids: pigments of photosynthetic biomembranes.
Methods in Enzymolgy 148 350-382.
Loreto F, Mannozzi M, Maris C, Nascetti P, Ferranti F and Pasqualini S (2001). Ozone quenching
properties of isoprene and its antioxidant role in leaves. Plant Physiology 126 993-1000.
Marulanda-Aguirre A, Azcon R, Ruiz-Lozano JM and Aroca R (2008). Differential effects of
a Bacillus megaterium strain on Lactuca sativa plant growth depending on the origin of the arbuscular
mycorrhizal fungus coinoculated: physiologic and biochemical traits. Journal of Plant Growth Regulation
27 10-18.
Mittler R (2002). Oxidative stress, antioxidants and stress tolerance. Trends in Plant Science 7 405-410.
Monneveux P and Belhassen E (1996). The diversity of drought adaptation in the wide. Plant Growth
Regulation 20 85-92.
Moussa H and Abdel-Aziz SM (2008). Comparative response of drought tolerant and drought sensitive
maize genotypes to water stress. Australian Journal of Crop Science 1 31-36.
Noreen Z and Ashraf M (2009). Changes in antioxidant enzymes and some key metabolites in some
genetically diverse cultivars of radish (Raphanus sativus L.). Environmental and Experimental Botany
67(2) 395-402.
Pustovoitova TN, Zhdanova NE and Zholkevich VN (2004). Changes in the levels of IAA and ABA in
cucumber leaves under progressive soil drought. Russian Journal of Plant Physiology 51 569-574.
Rohman MM, Begum S, Talukder MZA, Akhi AH, Amiruzzaman1 M, Ahsan AFMS and Hossain
Z (2016). Drought sensitive maize inbred shows more oxidative damage and higher ROS scavenging
enzymes, but not glyoxalases than a tolerant one at seedling stage. Plant Omics Journal 9(4) 220- 232.
Saleem M, Arshad M, Hussain S and Bhatti AS (2007). Perspective of plant growth promoting
rhizobacteria (PGPR) containing ACC deaminase in stress agriculture. Journal of Industrial Microbiology
Biotechnology 34 635–648.
Selvakumar G, Reetha S and Thamizhiniyan P (2012). Response of Biofertilizers on growth, yield
attributes and associated Protein Profiling changes of Blackgram (Vigna mungo L.) Hepper. World
Applied Sciences Journal 16(10) 1368-1374.
Sergiev I, Alexieva V and Karanov E (1997). Effect of spermine, atrazine and combination between
them on some endogenous protective systems and stress markers in plants. Comptes Rendus de
l'Academie Bulgare des Science 51(3) 121-124.
Sokal RR and Rohlf FJ (1995). Biometry: The Principles and Practice of Statistics in Biological
Research, (W.H. Freeman and Company, New York, USA) 271-356.
Trebest A (1972). Measurements of Hill reactions and photoreduction. In. A San Pietro (edition),
Methods in Enzymology 24 146 -153, (Academic Press, New York, USA).
Turner NC (1981). Techniques and experimental approaches for the measurement of plant water status.
Plant and Soil 58 339-366.
Vessey JK (2003). Plant growth promoting Rhizobacteria as biofertilizers. Plant and Soil 255 571-586.
Wang C, Yang A, Yin H and Zhang J (2008). Influence of water stress on endogenous hormone
contents and cell damage of maize seedlings. Journal of Integrative Plant Biology 50 427- 434.
Xie ZJ, Jiang D, Cao WX, Dai TB and Jing Q (2003). Relationships of endogenous plant hormones to
accumulation of grain protein and starch in winter wheat under different post anthesis soil water statuses.
Plant Growth Regulation 41 117-127.
Zhang H, Jiang Y, He Z and Ma M (2005). Cadmium accumulation and oxidative burst in garlic
(Allium sativum). Journal of Plant Physiology 162(9) 977-984.