biorefineries for sustainability of the paper industry ... gorgens.pdfstellenbosch university ......
TRANSCRIPT

Prof Johann Görgens
Department of Process EngineeringStellenbosch University
jou kennisvernoot • your knowledge partner
Biorefineries for SustainabilityOf the Paper Industry

Drivers for Biorefineries1. Economic pressures of pulp production2. Global incentives for fuels/chemicals from
biomass (incentives, taxes, credits)3. Improved future profitability
Concepts1. Alternative fractionation methods2. Bio-energy through biological and
thermo-chemical processing3. Rigorous modelling of future
biorefineries


• North-America and Europe in decline, closures• New production capacity from South America and
East Asia• Pulp mill is already a biorefinery: Pulp and energy
• Commodities, but lack specialities• Economic value of potential products
• Biomaterials (optimal use of feedstock properties)• Biochemicals• Biofuels• Other forms of bio-energy
• Development adjacent to existing mills beneficial tofeedstock handling
Economics of Pulp Production

Biomass Refining OptionsBiomass Refining Options

Biomass Refining ExampleBiomass Refining Example

Bio
mas
s P
rod
uct
ion
, TS
&D
Ref
inin
g
TS
&D
What will we make
?
?
What inputs will be required?What will it cost?
Biomass RefiningBiomass Refining


1. Fractionation/pretreatment (“digestion”)Isolates chemical/structural components Lignocellulose made accessible for enzymatic hydrolysis
2. Biological conversionSugars as carriers of energy/carbon Conversion by pretreatment-hydrolysis or biocatalysis (enzymes, microbes)
3. Thermochemical conversionGas, bio-oil or charcoal as energy carriersConversion by thermal degradation or chemical synthesis
Conversion TechnologiesConversion Technologies

Lignocellulose FractionationLignocellulose Fractionation
� Novel pulping and matrix-opening technologies�Novel alkaline pulping, catalytic oxidation,
organosolv, steam explosion, ionic liquids, sub/supercritical extraction,
� Conversion of existing pulp mill into biorefinery, e.g. cellulosic ethanol


Fractionation – Hemis Pre-extractionFractionation – Hemis Pre-extraction� Long considered as entry-point to
biorefineries, but not practised commercially� Alkaline pre-extraction combined with
kraft/alkaline pulping� Leads to novel alkaline pulping methods, aimed at
maximising benefits from hemicellulose fraction
� One potential product: Xylan biopolymers/hydrogels� $2000/ton compare to heating value $50/ton

� Additives (pulp and paper, food & feed, textiles)� Coating (pharmacy, pulp and paper, textiles,
packaging)� Glue/gum (packaging, electrical, building) � Moisturiser (cosmetics, agriculture)� Tissue engineering (biomedical)� Encapsulation/implantation matrices (nano-
particles-nanotechnology, particle engineering)� Limitations of xylan biopolymers:
� Low degree of polymerisation, branching and substitution => High water solubility
Applications of BiopolymersApplications of Biopolymers

ControlXylan
hydrogelsXylan
hydrogels

Lignin
Adsorbents
Slow-release fertilizer/pestiside
Soil conditioner Humus formation
Dispersants
Phenolic precursors
Polymer substitution (resins, polyurethane)
Carbon fibre
Glue and binders
Fuels
SynfuelsElectricity

Biological ConversionBiological Conversion
� Sugars as energy carrier: Released from lignocellulose by pretreatment-hydrolysis
� Fermentation processes: Biogas, ethanol, butanol, organic acids, fatty acids and alcohols
� Sugar monomers for polymerization, similar to gasification-synthesis


Thermochemical ConversionThermochemical Conversion
� Combustion for heat, electricity� Pyrolysis for production of bio-oil and
charcoal� Chemicals, residual fuels and gasification
feedstocks, upgrading
� Gasification for electricity, ammonia, Fischer-Tropsch liquids, methanol, and dimethyl ether� Pure biomass gasification => use or sell� Biomass-coal co-gasification� Small-scale FT synthesis

Biomass Co-gasification with Coal for SynfuelsBiomass Co-gasification with Coal for Synfuels
� Impact of co-feeding on pyrolysis product
yields and quality
� Impact of co-feeding on pyrolysis kinetics
� Impact of co-feeding on char gasification
behaviour
Key objectives

0
5
10
15
20
25
30
South AfricaTotal 2008
PetroSA GTL2008
Sasol CTL2008
Sasol CTLFuture
Brazil EtOH2008
USA EtOH2008
Mill
ions
of m
etric
tons
Biomass use in CTL and GTL plants in South AfricaBiomass use in CTL and GTL plants in South Africa

Biomass use in CTL and GTL plants in South AfricaBiomass use in CTL and GTL plants in South Africa
0
0.2
0.4
0.6
0.8
1
1.2
1.4
1.6
USA cellulosic EtOH2010
CTL+GTL 10%biomass 2008
CTL+GTL 10%biomass future
New CTL plants 10%biomass
Mill
ions
of m
etric
tons
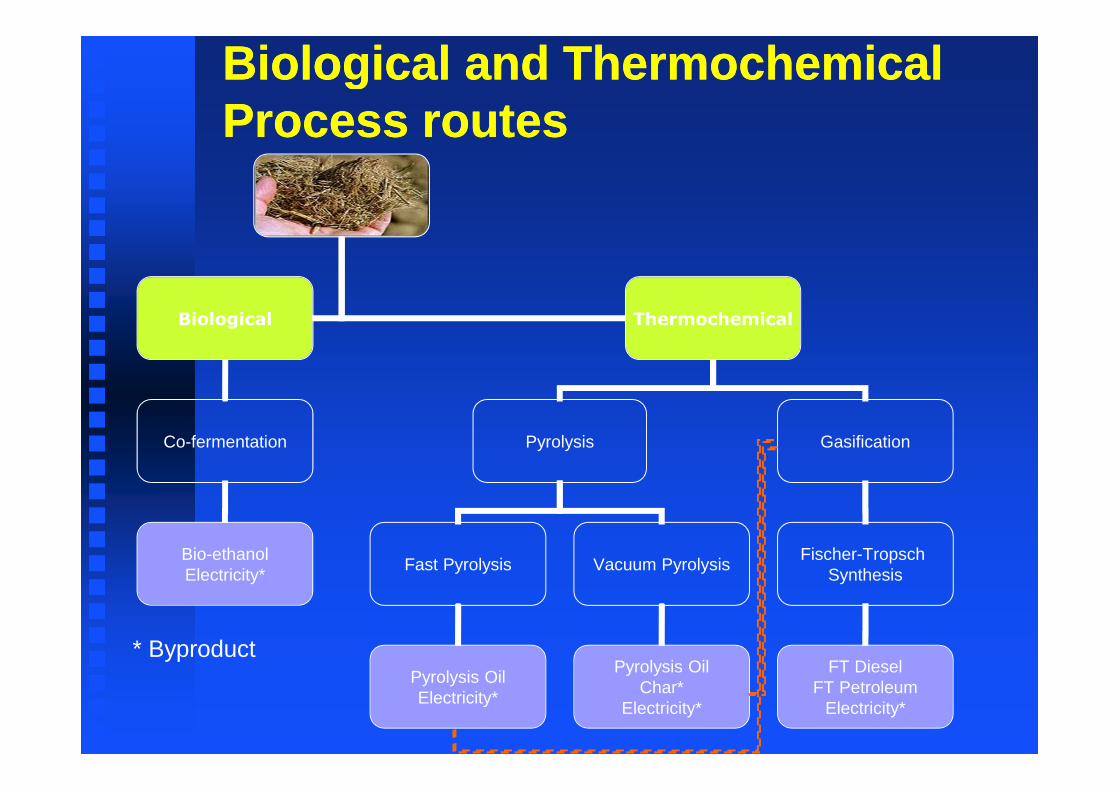
Biological and Thermochemical Process routesBiological and Thermochemical Process routes
Biological Thermochemical
Co-fermentation Pyrolysis
Fast Pyrolysis
Gasification
Fischer-Tropsch Synthesis
Pyrolysis OilElectricity*
Vacuum Pyrolysis
Pyrolysis OilChar*
Electricity*
FT DieselFT Petroleum
Electricity*
Bio-ethanolElectricity*
* Byproduct

-5%
15%
35%
55%
75%
95%
ETOH-LHW 5%
ETOH-DA 10%
ETOH-DA 35%
ETOH-SE 50%
Fast Pyrolysis
Vacuum Pyrolysis
FT-BAG (EG
1)
FT-BAG (EG
1 shift)
FT-BAG (EG
2)
FT (Kreutz and Larson)
FT-FPS (EG
2)
FT-VPS (EG
2)Energy conversion
[MW
product/
MW
input]
Liquid fuel Char Surplus electricity
Energy Conversion EfficiencyEnergy Conversion Efficiency

$0
$5
$10
$15
$20
$25
$30
$35
$40
$45
Fast Pyrolysis, 145MW
Fast Pyrolysis, 600MW
Vacuum
Pyrolysis, 145MW
Vacuum
Pyrolysis, 600MW
ETOH-35% dilute acid, 145MW
ETOH-35% dilute acid, 600MW
ETOH-steam explosion, 145MW
ETOH-steam explosion, 600MW
FT-bag (EG1), 145MW
FT-bag (EG1), 600MW
FT-bag (EG1-shift), 600 MW
FT-bag (EG2), 600 MW
FT-fps (EG1), 600MW
FT-vps (EG1), 600MW
Liquid fuel production cost [$/GJ]
$0
$20
$40
$60
$80
$100
$120
$140
$160
Breakeven Oil Price
[$/barrel crude oil]
Economic ComparisonEconomic Comparison

0%
10%
20%
30%
40%
50%
60%
28 35 42 49 56 63 70 77 84 91 98 105
112
119
Crude Oil Price [$/barrel]
Internal rate of return
Fast Pyrolysis Bioethanol (steam explosion) Fischer-Tropsch (G1)
Char high
Char low
Electricity high
Electricity low
0%
10%
20%
30%
40%
50%
60%
28 35 42 49 56 63 70 77 84 91 98 105
112
119
Crude Oil Price [$/barrel]
Internal rate of return
Fast Pyrolysis Bioethanol (steam explosion) Fischer-Tropsch (G1)
Char high
Char low
Electricity high
Electricity low
0%
10%
20%
30%
40%
50%
60%
28 35 42 49 56 63 70 77 84 91 98 105
112
119
Crude Oil Price [$/barrel]
Internal rate of return
Fast Pyrolysis Bioethanol (steam explosion) Fischer-Tropsch (G1)
Char high
Char low
Electricity high
Electricity low
Char high
Char low
Electricity high
Electricity low
Sensitivity AnalysisSensitivity Analysis

Stochastic Economic ModelsStochastic Economic Models

Biological vs. Thermochemical ConversionBiological vs. Thermochemical Conversion� Process integration offers advantages to
both� Feedstock handling, energy utilities, unit
operations� Enhance economic returns by integration of
biorefinery processes� Site-specific integration will dictate selection
� Integration based on feedstock components�Carbohydrates for biological and lignin for
thermochemical

Heat andElectricity for process
Sucrose 50%
HMF
(hydrolysis)
Mannitol(C/F)
Sorbitol (C)
Biofuels (F)
Cellulases
Glucose
Lactic acid (F)
Levulinic acid (hydrolysis)
Furfural (hydrolysis)
Xylitol/Arabinitol (C/F)
Gluconic acid (F)
Succinic acid (F)
Other
products (F)Citric acid (F)
Xylose
Hemicellulases
Arabinose
F: FermentationC: Chemical catalysis
Lignin
25%
Hemicellu
lose 25%
Cellulose
40%
Pretreatment and fractionation
Glucose 4% With
invertase(29%)
Fructose 4%With
invertase(29%)
Bagasse Molasses
Biodegradable polymers
Food additives Biodegradable
solventsFuels and fuel
additivesBuilding block
chemicals
Integrated BiorefineryIntegrated Biorefinery

Post-BiologicalProcessing
39%Residues
Power
Bioprocess(steam, power) 14%
Power(17%)
0.75% power demand displaced for every1 % transport fuel demand displaced (US)
Large baseload power contribution,compliments intermittent sources
Processing Residues from Biological Processing Offers Lots of Value
Internal cogeneration - most energy for biological processing is from waste heat accompanying power and/or FT fuel production
Maturation of biological conversion --> much larger opportunities
Post-BiologicalProcessing
39%Residues
Bioprocess(steam, power)
FT fuels(21%)
Fischer-Tropsch fuels (diesel, gasoline)
14%
Slate of fuels including bioethanol, FT diesel, FT gasoline (or added ethanol)
E90 entirely from renewables
Current
BiologicalProcessing
Post-BiologicalProcessing
100%
39%
54%
Mature
BiologicalProcessing
Post-BiologicalProcessing
100%
39%
54%


ConclusionsConclusions� Drivers for biorefineries differ between parts of
the world�Future profitability, environmental
opportunities� Fractionation
� Isolate high value biomaterials prior to destruction
� Biological and thermochemical processing� Reduce lignocellulose to preferred energy carrier� Major impact on product spread
� Rigorous biorefinery modelling and scenario building required� Looking into the glass ball of future markets for
materials, chemicals, fuels