biomass needs for global climate modeling
TRANSCRIPT

Dr. George HurttProfessor & Research Director
Science Team Leader
DEPARTMENT of GEOGRAPHICAL SCIENCES
Joint Global Carbon Cycle Center
Biomass Needs for Global Climate Modeling
September 25, 2018

DECK (entry card for CMIP)i. AMIP simulation (~1979-2014)ii. Pre-industrial control
simulationiii. 1%/yr CO2 increase iv. Abrupt 4xCO2 run
CMIP6 Historical Simulation (entry card for CMIP6) v. Historical simulation using
CMIP6 forcings (1850-2014)
Note: The themes in the outer circle of the figure might be slightly revised at the end of the MIP endorsement process
(DECK & CMIP6 Historical Simulation to be run for each model configuration used in the subsequent CMIP6-Endorsed MIPs)
Ongoing Diagnosis, Evaluation, and Characterization of Klima(DECK) Experiments
CMIP6-Endorsed Model Intercomparison Projects (MIPs)
Eyring 2015Meehl et al 2014

5-6 May, 2016 | Washington, D.C.
11
Consumer Goods Forum
x Achieve zero net deforestation by 2020, through the responsible sourcing of key commodities - soy, palm oil, paper and pulp and beef.
GEF Integrated Approach Pilot on Commodity Supply Chains
x Conservation and maintenance of globally significant biodiversity, ecosystems goods and services.
x Bring 23 million ha of land under sustainable management practices.
x Mitigate 80 million metric tonnes CO2e of GHG emissions through support for transformational shifts towards low-emission and resilient development paths, reduced deforestation and resilient supply chains.
Bonn Challenge x Restore 150 million hectares of the world’s deforested and degraded lands by 2020.
New York Declaration on Forests
x Restore 350 million hectares by 2030.
Initiative 20x20 x Bring 20 million hectares of land in Latin America and the Caribbean into restoration by 2020.
Africa Forest Landscape Restoration Initiative (AFR100)
x Restore 100 million hectares of degraded and deforested landscapes in Africa by 2030.
EverGreen Agriculture Partnership
x A shared vision of agricultural systems that can sustain a productive green cover on the land throughout the year, for the benefit of the land and livelihoods of smallholder farmers around the world
Afforestation/Reforestation Context

© Crown copyright Met Office
N. Hemi model
spread: factor 4 tropics model
spread: factor 2
Model spread in biomass
540 ± 220 PgC
Global soil and biomass carbon stores
Anav et al, 2013

Resolution/Heterogeneity
Mearns (Pers. Comm.)

Fisher et al. 2008

7
Averaged Not Averaged
Aver
aged
Not
Ave
rage
dEn
viro
nmen
tal I
nput
s
Structural Inputs

Structural InputsAveraged Not Averaged
Aver
aged
Not
Ave
rage
dEn
viro
nmen
tal I
nput
s

Heterogen. Env., Non-linear G, Fusion
9
Model too coarse for env. gradient
Data too coarse for env. gradient
Efficient solution
Hurtt et al. 2010

Duncanson et al. 2012

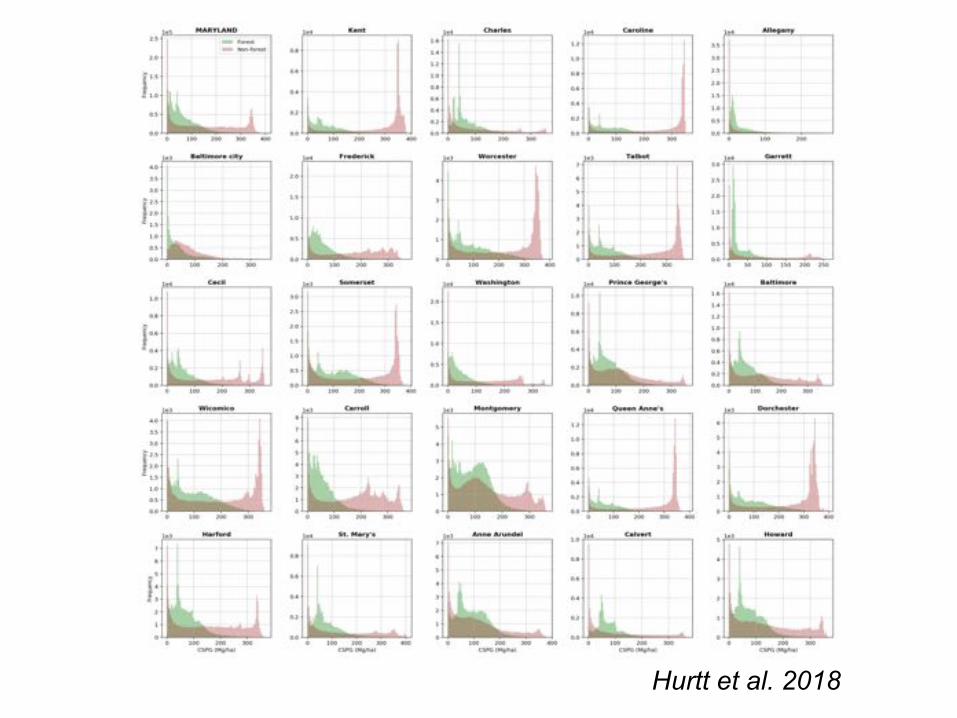
Hurtt et al. 2018

Huang et al 2015

Medvigy et al. 2012

Hurtt et al. 2018

Hurtt et al. 2018

Hurtt et al. 2018

Hurtt et al. 2018
Hurtt et al. 2018


GEDI- The Global Ecosystem Dynamics Investigation R.Dubayah 1
Science Approach and Data ProductsProduct Description
Level 1 Geolocated Waveforms
Level 2
Canopy Height/Profile Metrics• RH metrics• Canopy top height• Ground elevation• Canopy cover and cover profile• LAI and LAI profile
Level 3 Gridded Footprint Metrics
Level 4 Biomass
Level 4
Demonstrative Products• Ecosystem model outputs• Enhanced height/biomass using
fusion with Tandem X & Landsat• Habitat model outputs


Select References• Hurtt et al. (2018). Beyond MRV: High resolution forest carbon modeling for planning. ERL-
Submitted.• Huang et al. (2017). County-scale biomass map comparison: a case study for Sonoma, California.
Carbon Management 77(1) 1-19.• Hurtt et al. (2016). The Impact of Fine-Scale Disturbances on the Predictability of Vegetation
Dynamics and Carbon FluX. PLOS ONE 11(4):1-11.• Huang et al. (2015). Local discrepancies in continental scale biomass maps: a case study over forested
and non-forested landscapes in Maryland, USA. Carbon Balance and Management 10(1) 1-16.• Hurtt et al. (2014). NASA Carbon Monitoring System: Prototype Monitoring, Reporting, and
Verification. NASA Tech Report.• Meehl et al (2014). Climate Model Intercomparisons: Preparing for the Next Phase. EOS 95(9):77-78• Dubayah et al. (2010). Estimation of tropical forest height and biomass dynamics using lidar remote
sensing at La Selva, Costa Rica. JGR 115(G2):G00E09.• Hurtt et al. (2010). Linking models and data on vegetation structure. JGR 115.• Fisher et al. (2008) Clustered disturbances lead to bias in large scale estimates based on forest sample
plots. Ecol. Letters 11:554-563• Thomas et al. (2008). Using lidar data and a height-structured ecosystem model to estimate forest
carbon stocks and fluxes over mountainous terrain. Can J For Res. 34:S351-S363.• Hurtt et al. (2004). Beyond Potential Vegetation: Combining Lidar data and a height structured model
for carbon studies. Ecological Applications 14(3) 873-883.• Drake et al. (2002). Estimation of tropical forest structural characteristics using large footprint lidar.
RSE 79:305-319.