biomass energy use in kenya · biomass for cooking and diversion of household income to purchase...
TRANSCRIPT

BIOMASS ENERGY USE IN KENYA
Prepared for International Institute for Environment and
Development (IIED) by
Practical Action, Eastern Africa Office P.O. Box 39493-00623 Nairobi, Kenya [email protected]
October, 2010

Citation Mugo, F. and Gathui, T. (2010) Biomass energy use in Kenya. A background paper prepared for the International Institute for Environment and Development (IIED) for an international ESPA workshop on biomass energy, 19-21 October 2010, Parliament House Hotel, Edinburgh. Practical Action, Nairobi, Kenya. Acknowledgements This report was funded by the Ecosystem Services and Poverty Alleviation Programme of the UK Government Department for International Development (DFID), the UK Natural Environment Research Council (NERC) and the UK Economic and Social Research Council (ESRC). Additional IIED frame funds were used from the Danish International Development Agency (DANIDA), the UK Government’s Department for International Development (DFID), the Directorate General for International Cooperation, the Netherlands (DGIS), Irish Aid, the Norwegian Agency for Development Cooperation (NORAD), Swiss Agency for Development and Cooperation (SDC), the Swedish International Development Agency (SIDA). The views expressed in this report do not necessarily represent those of the supporting institutions involved. This report was prepared as one of five background reports for an international workshop on 19-21 October 2010 on biomass energy at the Parliament House Hotel, Edinburgh. The workshop was part of a UK ESPA programme Partnership and Project Development (PPD) Grant to build a consortium around a project on ‘Biomass energy – Optimising its contribution to poverty reduction and ecosystem services’. The authors are grateful for the active discussion of the draft ideas by participants of that meeting.
2 | P a g e

Table of contents 1 The scale of current biomass use in different forms .................................................... 7
1.1 Biomass energy ........................................................................................................ 7 1.1.1. Fuelwood and charcoal ..................................................................................... 7 1.1.2. Woodfuel supply and demand trend .................................................................. 7 1.1.3. Farm residues ................................................................................................... 8 1.1.4. Electricity from crop residue .............................................................................. 9 1.1.5. Wood waste ....................................................................................................... 9 1.1.6. Biogas ............................................................................................................... 9 1.1.7. Geographical dimensions of fuelwood demand and supply ............................ 10
1.2 Yield of biomass crops ........................................................................................... 10 1.2.1 Yield of woody biomass ................................................................................... 10 1.2.2 Farm residue ................................................................................................... 11 1.2.3 Impacts of forest conversion to agriculture ...................................................... 12
2 Impact of current biomass energy use on poverty reduction and ecosystem services .. 13 2.1 Poverty reduction through biomass energy use ..................................................... 13 2.2 Carbon sequestration ............................................................................................. 13 2.3 Biodiversity and ecosystem resilience .................................................................... 14 2.4 Watershed dynamics and flows .............................................................................. 15 2.5 Cultural practices and landscape integrity .............................................................. 16
2.5.1 Ecological impacts of biomass energy use and scarcity ................................. 16 2.5.2 Social economic impacts of biomass energy use and scarcity........................ 16 2.5.3 Land factors, tree planting and woodfuel supply characteristics ..................... 17
3 The main policies and legislations that govern different types of biomass use ............. 18 3.1 Specific policies and legislations that govern different types of biomass use ......... 18
3.1.1 Energy policy ................................................................................................... 18 3.1.2 Energy Act ....................................................................................................... 19 3.1.3 The Forests Act ............................................................................................... 20 3.1.4 Environmental policy ....................................................................................... 20 3.1.5 Environmental Management and Coordination Act ......................................... 20
3.2 Key Institutions and individuals in the biomass energy sector ............................... 21 4 Innovative and sustainable biomass energy projects .................................................... 24
4.1 Innovative projects .................................................................................................. 24 4.1.1 Kakuzi Ltd: Commercial growing of trees for poles and charcoal ................... 24 4.1.2 RAFDIP Community Forest Association ......................................................... 24 4.1.3 GTZ/Ministry of Energy biogas promotion project ........................................... 25 4.1.4 Electricity generation from crop residue .......................................................... 25
4.2 Factors of success and failure of the innovative projects ....................................... 25 5 Theory of change for biomass energy use in Kenya ..................................................... 26
5.1 Shift to commercial production and utilization of biomass energy .......................... 26 5.2 Preconditions for the transition ............................................................................... 26 5.3 Activities to be implemented ................................................................................... 26 5.4 Indicators for measuring success ........................................................................... 27
6 References .................................................................................................................... 28
3 | P a g e

List of tables
Table 1: Annual fuelwood and charcoal consumption by cottage industries................................. 7 Table 2: Annual household and cottage woodfuel consumption by provinces (2000) ................ 10 Table 3: Summary of current levels of biomass energy production per year .............................. 11 Table 4: Wood waste supply by province tonnes/year (year 2000) ............................................ 11 Table 5: Number of indigenous plant species under plantation of eucalyptus ............................ 14 Table 6: Institutions involved in the biomass energy sub-sector ................................................. 22 Table 7: Economic cost of charcoal from one cubic meter of wood (5.3 bags of 35 kg each) .... 24
4 | P a g e
Executive summary Biomass energy situation and consequences: Biomass energy provides 68% of Kenya’s national energy requirements and it is expected to remain the main source of energy for the foreseeable future. In 2000, Kenya was reported to use 34.3 million tonnes of biomass for fuel of which 15.1 million tonnes was in form of fuelwood while 16.5 million tonnes was wood for charcoal processed in kilns with only 10% efficiency. Up to 43% of the national consumption was from sustainable supplies while 57% was from unsustainable supplies. Of Kenya’s total land area of 57.6 million hectares, only 6% (3,456,000) is forest cover and is estimated to be decreasing at the rate of 52,000 hectares (0.09%) per year. In 1980, 94% of all the wood harvested in the country was used for woodfuel, 4% for poles and 2% for timber. By 1997, the proportions were estimated to be 90% woodfuel, 5% for industrial feedstock and another 5% for poles and posts. These proportions were projected to remain the same in the year 2000. Although biomass is a renewable resource, the high rate of its extraction and inefficient utilization renders it a non-renewable, a trend that needs to be reversed. Fuelwood, charcoal production and agriculture contribute to woodland degradation and deforestation. However, the contribution of each varies from one area to another. Rural and urban population growth, unemployment and land tenure are key drivers of woodland degradation and deforestation hence any intervention has to seriously deal with the key drivers for effective and sustainable management of the forest resources. The wider consequences of unsustainable extraction of biomass for energy include deforestation, land degradation, reduction in the ecological services of forests, woodlands and bushes, increased soil erosion, loss of biodiversity, loss of jobs, increased suffering especially for the women as they search for household energy, increased food insecurity as a result of limited biomass for cooking and diversion of household income to purchase woodfuel for energy. Given the high contribution of woody biomass for energy, there is need to emphasize and deliberately invest in wood production specifically for energy and manufacture and marketing of efficient end-use technologies to ensure efficient utilization of the resource. Policy, legal framework and potential interventions: For a long time, lack of appropriate policy, legislation and political will has hindered development of the biomass energy sub-sector. However, in the last seven years, Kenya has formulated an energy policy and legislation, forest legislation and charcoal rules to govern biomass energy development. Other relevant policy and legal provisions are a draft forest policy currently in parliament and a draft environmental policy in its final touches of completion. With policy and legal frameworks in place and the huge effective demand for charcoal and the emerging and growing market for fuelwood especially in the tea industry, commercial growing of wood for charcoal and fuelwood should be exploited. In addition, large scale investment in the manufacture and marketing of energy efficient stoves has promise. There are technologies in the country that can reduce the consumption of biomass energy by almost 80%. They include the improved charcoal stove (KCJ) which can save up to 50%, the improved wood stove that can also save 50% energy, fireless cookers that can save up to 50% and the improved charcoal kilns which can save up to 60% energy when compared to the traditional technologies. Investment in the development and promotion of other biomass technologies like biogas and woody crop residues should be considered. Way forward: To tame the high and increasing level of over 57% biomass energy supply deficit, emerging evidence shows the highest promise to be in extensive commercialization of the biomass energy sub-sector to provide energy for the country, create employment, generate income and provide ecosystem services. The recommended approaches include: a. large scale corporate production of biomass energy in designated regions where land is not a major constraint; b. small scale farmers producing charcoal and fuelwood as cash crops modelled in the line of the tea industry; c. sustainable management of naturally growing woodlands and bush lands guided by approved management plans; d. investing in
5 | P a g e

value addition of the biomass residue that is not suitable for soil fertility improvement; and e. expanded manufacture of energy efficient stoves, kilns and biogas appliances. A strong awareness and catalization programme aggressive cultivation of the necessary political will of the highest office in the land accompanied with development of suitable financial products by the financial institutions are preconditions for the transition. To start implementation of the proposed change, there is need to package the need to change to commercial production of biomass energy in convincing and easily understandable terms. Convincing case studies and models could be used to bring about this change. This should be followed by sensitization of the government of Kenya and the development partners on the need to take the commercial route. The relevant NGOs and CBOs in the sector should also be sensitized and aligned accordingly. The next step will involve development of new commercially oriented long term biomass development programmes, and mobilize sufficient resources for investing in the same. Development of markets should be given sufficient attention since they will act as a pull factor in the whole process. To ensure continuous supply of information for decision making, a biomass energy research centre/programme should be established within the Kenya Forestry Research Institute and funded sufficiently to deliver. In addition, each County should be supported to develop a biomass energy information and planning office to regularly generate vital statistics for planning and investment. Appropriate indicators to measure progress and success should be identified to help track performance of the biomass development programme for poverty alleviation and ecosystem services.
6 | P a g e

1 The scale of current biomass use in different forms 1.1 Biomass energy It is generally agreed that biomass energy will remain the main and for some the only, source of energy in developing countries for many years to come. Yet, traditional sources of supply continue to dwindle (O’Keefe et al., 1984; Republic of Kenya, 1994; Mugo, 1989; Mugo, 1997). In 1980, woodfuel was estimated to supply 71% of Kenya’s total energy requirements. Twenty years later, the most recent national biomass energy study (Republic of Kenya, 2002) reported that biomass energy provides 68% of the national energy requirements. The consumption was reported to be 34.3 million tonnes of which 15.1 million tonnes was in the form of fuelwood while 16.5 million tonnes was wood for charcoal. These require annual harvesting of 240,000 and 298,000 hectares for fuelwood and charcoal respectively. For sustainability of the wood resource in the country, afforestation or regeneration management of a similar magnitude of land is necessary on annual basis. 1.1.1. Fuelwood and charcoal In the year 2000, fuelwood supplied 89% of rural energy with a per capita annual consumption of 741 kg and 7% urban household energy with a per capita annual consumption of 691 kg. For the cottage industry, the consumption was as indicated in Table 1 with restaurants and kiosks consuming the highest estimated at 1.3 million tonnes. Charcoal on the other hand was reported to supply 82% of urban household energy with a per capita annual consumption of 152 kg, while for rural households, it contributed 34% with a per capita consumption of 156 kg. Charcoal consumption for the cottage industry is as indicated in Table 1. As for the case of fuelwood, restaurants and kiosks consumed the highest estimated at 0.43 million tonnes per year. This reflects the importance of fuelwood and charcoal in supplying energy and creating employment. Table 1: Annual fuelwood and charcoal consumption by cottage industries Industry Quantity of fuelwood in
tonnes/year Quantity of charcoal
in tonnes/year Brick making 55,772 - Tobacco 78,365 - Milk processing 4,900 540 Fishing and fish smoking 17,960 - Jaggary 180,000 - Bakeries 20,665 622 Restaurants/kiosks 1,276,155 428,025 Tea Industry 155,000 - Total 1,788,817 429,187
Source: Republic of Kenya, 2002 1.1.2. Woodfuel supply and demand trend The 1980 fuelwood study indicated that biomass energy supplied 98% of Kenya’s rural domestic sector’s energy requirements. The other 2% was obtained from petroleum fuels and was mainly for lighting. The study estimated that of the 98% biomass energy for rural domestic sector, 93% was from woodfuel while 5% was from crop residues (O’Keefe et al., 1984).
7 | P a g e

A 1988 study in Bungoma district of Kenya revealed that woodfuel was supplying only 54% of the energy required for cooking and heating annually while the rest 46% was from crop residues (Mugo, 1989) implying an increasing trend in the use of such materials. Increased use of crop residues for energy is an indication of increasing scarcity of fuelwood (Foley and Barnard, 1984). This scarcity may be physical and or economic (Dewees, 1995). Chambers and Leach (1987) found that where local markets for fuelwood exists, trees were assets which could be cut and sold at short notice to meet urgent household financial needs. This may contribute to economic fuelwood scarcities. Suggestions of the root causes of the persistent and increasing fuelwood scarcity in Kenya include: inefficient end use utilization technologies (Mugo, 1989; 1997), limiting land tenure arrangements, small land sizes and land use factors especially the type of use land is put to and limited participation of by women in tree resource decision making and management (ICRAF, 1996; Mugo, 1997; Okoth-Ogendo, 1980). For the last factor, studies have found that the more women participate the higher the availability of fuelwood. Energy supply and demand vary by region, district, village and by household classes within a village. There is enormous diversity in the availability and costs of energy supplies, levels of consumption and mix of fuels employed, end uses (e.g., cooking, water heating, space heating, lighting etc.), technologies used, energy related preferences, and modes of behaviour (Leach and Gowen, 1987). In addition, biomass fuels in the rural areas represent only one aspect of the complex interrelated systems for producing, exchanging, and using biomass materials for food, animal feed, construction, and fuels. Issues relating to biomass energy demand and supply must, therefore, be considered within the wider context of other uses of biomass resources for example if a woodlot has a higher economic and or ecological value than being used for biomass energy, it will not be used for the latter. In addition, if trees on a farm boundary have a higher functional value as a farm boundary, the trees will not be harvested for fuelwood. 1.1.3. Farm residues Farm residue comprises a broad range of vegetative materials generated from diverse agricultural operations and processes. Dung and crop residue are the dominant by-products from primary agricultural production which are occasionally used as domestic fuel. They consist of non-woody residues and woody residues. Non-woody residues comprise leaves, stalks, cobs etc. which are lighter, burn fast and have low heat content while wood residues are normally derived from mature prunings, thinnings, woody weeds, etc. which burn slowly and have a comparably high heat energy content to ordinary fuelwood. The most recent biomass energy study (Republic of Kenya, 2000) observed that nationally, only 21% of households use farm residues. Their use is mainly in the rural areas where an estimated 29% of households use it as compared to only 0.5% of urban households. Residues are used by more people (38% households) in the high agro-ecological zones which have a higher population density and suffer higher and more frequent shortage of conventional fuelwood than the medium and low potential areas. Farm residue was reported to be used by rural households for cooking (97%), water heating (46%), ironing clothes (5.5%), lighting (3.3%) and home business (1.2%). In this study, most farmers were aware that farm residues when not used for energy are important for nutrient recycling for soil fertility maintenance. Nearly all types of crops have material that may be used to provide energy, the most common being maize cobs (15%), maize stalks (9%), tea prunings (3%) and sorghum stalks (1%). The overall per capita annual crop residue consumption in the rural areas is 435 kg (1,998 kg per household). For urban households, consumption was found to be 351 kg/person per year which is approximately 1,373 kg per
8 | P a g e

household. Despite the low calorific value, especially of non-woody sources, farm residue constitutes an important fuel in areas suffering fuelwood scarcity especially for poor households. Burning of the commodity to provide domestic energy however has critical opportunity cost in terms of lost soil carbon replenishment, associated loss in crop production and the cumulative effects on national food security. Therefore, some crop residues are not necessarily desirable for energy supply especially those that can be easily used for soil fertility improvement. 1.1.4. Electricity from crop residue Among corporate players, crop residue is proving to be popular feedstock to fire steam boilers within sugar and rice milling installations. The already successful carbonization and packaging of coffee husks into commercial charcoal and generation of grid-scale electricity from bagasse shows that farm residues have commercial value especially where economies of scale are possible. Nationally, about 2% of households use animal dung for energy along with other energy sources. Animal dung particularly cow dung are used only in cases of very acute fuelwood scarcity since their value as farm manure for soil fertility improvement is highly appreciated by farmers. The Ministry of Energy in collaboration with interested investors should facilitate development of appropriate technology to tap energy from other available wastes including organic garbage and sewerage from urban areas (Republic of Kenya, 2002). 1.1.5. Wood waste This energy source includes timber off-cuts and wood rejects, wood shavings and saw dust from wood used in construction and other industrial purposes. The wood by-product is often used at the factory for steam generation and where it is not used on site, households may collect it free or purchase it at a small fee. The national percentage of households using wood waste is low at 2.5% with higher use being in urban areas at 3.7% as compared to rural areas at 2.1%. This indicates a drop in use of wood wastes from 5.1% in 1980. This is because wood waste has become scarcer and considerably more expensive for most people. Major uses for wood waste are cooking (96%), water heating (60%), lighting (8%), home business (6%) and other industrial purposes with the most common type of wood waste being off-cuts (64%) and sawdust/shavings (34%). Across agro-ecological zones, consumption is highest in the medium zone (3%) followed by the high zone (2.7%) while the low agro-ecological potential zone has the least (0.2%). This is possibly a reflection of availability i.e. more tree plantations and sawmills occur in the environments with higher production potential. 1.1.6. Biogas Biogas is a clean-burning methane-rich gas produced through anaerobic digestion (bacterial action in the absence of air) of organic feed stocks (crop residues, animal dung). In countries where suitable feed stocks are available and abundant, small family-sized biogas digesters have been introduced. In India, for example, by 1998, 2.8 million units had been installed. In the national biomass study (2000), none of the households surveyed used biogas. However, according to a study (1997) by Practical Action, 1100 plants are in operation in Kenya. Most of the units were constructed under the Ministry of Energy’s Special Energy Programme sponsored by GTZ. Most biogas systems found in Kenya are between 4-16 cubic metres. Three cubic metres of gas is considered sufficient to meet the cooking and lighting needs of a family of 5 persons in Kenya. The per capita daily consumption of biogas is 0.6 cubic metres, which translates to an annual per capita consumption of 219 cubic metres of biogas. Uptake of biogas technology in Kenya has remained very low due to high capital costs for not only the plant, but also for the modified burners and lighting units. Inadequate
9 | P a g e

maintenance and management support services required have further impeded uptake because plants are prone to cracking and leaking yet their operations require that they be air and water-tight. Lack of adequate water supplies, which is normally added in a ratio of between one and three parts water to one part feedstock, has also been an impediment. Despite these constraints, the potential is enormous. A financial credit system for interested consumers, especially in the dairy farming areas, and well trained manpower for fabrication of the different parts, construction of the units and maintenance of the same could see many households adopting the technology. 1.1.7. Geographical dimensions of fuelwood demand and supply In 1980, the country had a woodfuel supply shortfall of 30% (meaning that consumption was 30% over replenishment) of woody biomass (O’Keefe et al., 1984). By 1995, it was estimated that Kenya had a woodfuel deficit of 74%, while a 1987 World Bank/United Nations Development Programme study had projected a 1996 deficit of 50% (Republic of Kenya, 1994). The national study of 2000 estimated a deficit of 57.2% as indicated in Table 2, reflecting a worsening supply situation when compared to that of 1980 and 1996.
Table 2: Annual household and cottage woodfuel consumption by provinces (2000) Province Total wood demand
(tonnes) Biomass energy
deficit/tonne/year % deficit
Nairobi 2,315,352 2,304,903 99.55* Coast 3,007,811 1,540,367 51.21* North Eastern 1,193,379 253,394 21.23 Eastern 5,758,959 2,247,187 39.02* Central 4,628,861 3,300,154 71.30* Rift Valley 8,649,465 3,431,392 39.67* Nyanza 5,394,571 3,887,661 72.07* Western 4,171,217 3,130,047 75.04* National 35,119,616 20,095,106 57.22* *FAO Critical Scarcity Level is given as 35% deficit 1.2 Yield of biomass crops
1.2.1 Yield of woody biomass Biomass comes from various forest formations such as closed forests, woodlands, bushlands, wooded grasslands, grasslands, farms with natural vegetation and mixtures of native and exotic trees, industrial and fuelwood plantations, and residues from agricultural crops and wood-based industries (Appendix 1 – Tables 1 & 2). The supply situation for Kenya is as summarised in Table 3 with indigenous vegetation mainly woodlands, wooded grasslands generating the highest supply of 45% followed by farmlands with 39%.
10 | P a g e
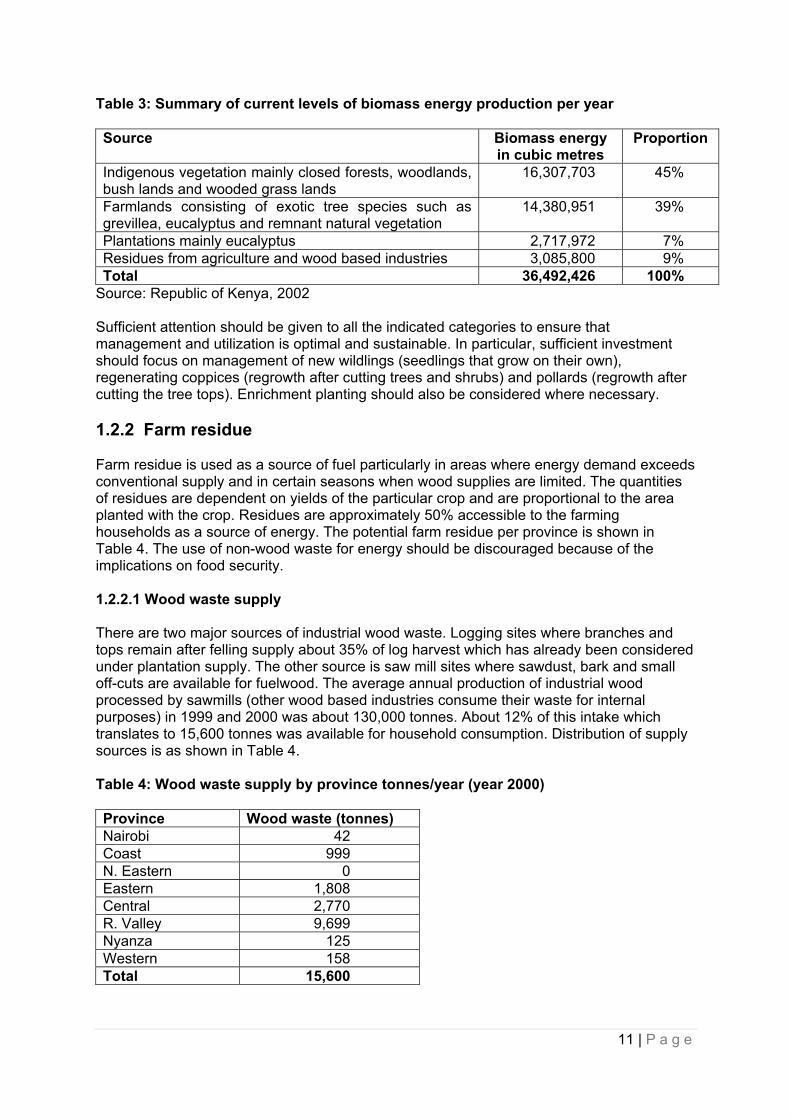
Table 3: Summary of current levels of biomass energy production per year Source Biomass energy
in cubic metres Proportion
Indigenous vegetation mainly closed forests, woodlands, bush lands and wooded grass lands
16,307,703 45%
Farmlands consisting of exotic tree species such as grevillea, eucalyptus and remnant natural vegetation
14,380,951 39%
Plantations mainly eucalyptus 2,717,972 7% Residues from agriculture and wood based industries 3,085,800 9% Total 36,492,426 100%
Source: Republic of Kenya, 2002 Sufficient attention should be given to all the indicated categories to ensure that management and utilization is optimal and sustainable. In particular, sufficient investment should focus on management of new wildlings (seedlings that grow on their own), regenerating coppices (regrowth after cutting trees and shrubs) and pollards (regrowth after cutting the tree tops). Enrichment planting should also be considered where necessary. 1.2.2 Farm residue Farm residue is used as a source of fuel particularly in areas where energy demand exceeds conventional supply and in certain seasons when wood supplies are limited. The quantities of residues are dependent on yields of the particular crop and are proportional to the area planted with the crop. Residues are approximately 50% accessible to the farming households as a source of energy. The potential farm residue per province is shown in Table 4. The use of non-wood waste for energy should be discouraged because of the implications on food security.
1.2.2.1 Wood waste supply There are two major sources of industrial wood waste. Logging sites where branches and tops remain after felling supply about 35% of log harvest which has already been considered under plantation supply. The other source is saw mill sites where sawdust, bark and small off-cuts are available for fuelwood. The average annual production of industrial wood processed by sawmills (other wood based industries consume their waste for internal purposes) in 1999 and 2000 was about 130,000 tonnes. About 12% of this intake which translates to 15,600 tonnes was available for household consumption. Distribution of supply sources is as shown in Table 4. Table 4: Wood waste supply by province tonnes/year (year 2000)
Province Wood waste (tonnes) Nairobi 42 Coast 999 N. Eastern 0 Eastern 1,808 Central 2,770 R. Valley 9,699 Nyanza 125 Western 158 Total 15,600
11 | P a g e
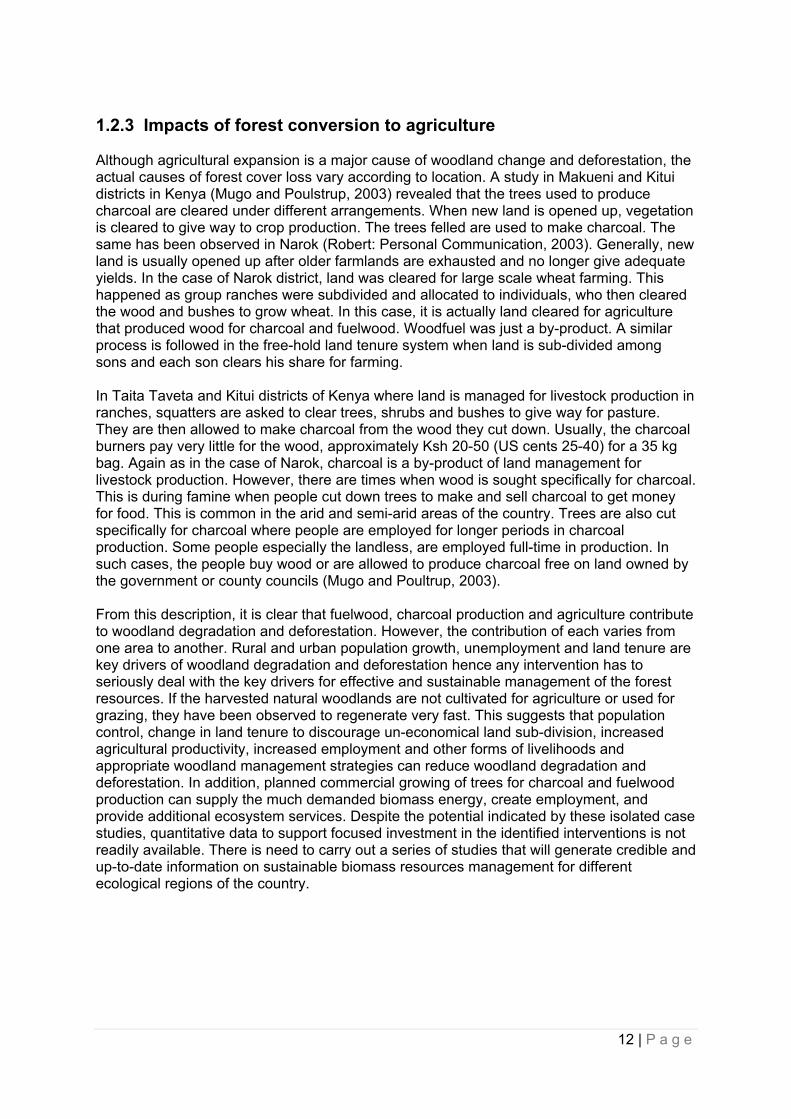
1.2.3 Impacts of forest conversion to agriculture Although agricultural expansion is a major cause of woodland change and deforestation, the actual causes of forest cover loss vary according to location. A study in Makueni and Kitui districts in Kenya (Mugo and Poulstrup, 2003) revealed that the trees used to produce charcoal are cleared under different arrangements. When new land is opened up, vegetation is cleared to give way to crop production. The trees felled are used to make charcoal. The same has been observed in Narok (Robert: Personal Communication, 2003). Generally, new land is usually opened up after older farmlands are exhausted and no longer give adequate yields. In the case of Narok district, land was cleared for large scale wheat farming. This happened as group ranches were subdivided and allocated to individuals, who then cleared the wood and bushes to grow wheat. In this case, it is actually land cleared for agriculture that produced wood for charcoal and fuelwood. Woodfuel was just a by-product. A similar process is followed in the free-hold land tenure system when land is sub-divided among sons and each son clears his share for farming. In Taita Taveta and Kitui districts of Kenya where land is managed for livestock production in ranches, squatters are asked to clear trees, shrubs and bushes to give way for pasture. They are then allowed to make charcoal from the wood they cut down. Usually, the charcoal burners pay very little for the wood, approximately Ksh 20-50 (US cents 25-40) for a 35 kg bag. Again as in the case of Narok, charcoal is a by-product of land management for livestock production. However, there are times when wood is sought specifically for charcoal. This is during famine when people cut down trees to make and sell charcoal to get money for food. This is common in the arid and semi-arid areas of the country. Trees are also cut specifically for charcoal where people are employed for longer periods in charcoal production. Some people especially the landless, are employed full-time in production. In such cases, the people buy wood or are allowed to produce charcoal free on land owned by the government or county councils (Mugo and Poultrup, 2003). From this description, it is clear that fuelwood, charcoal production and agriculture contribute to woodland degradation and deforestation. However, the contribution of each varies from one area to another. Rural and urban population growth, unemployment and land tenure are key drivers of woodland degradation and deforestation hence any intervention has to seriously deal with the key drivers for effective and sustainable management of the forest resources. If the harvested natural woodlands are not cultivated for agriculture or used for grazing, they have been observed to regenerate very fast. This suggests that population control, change in land tenure to discourage un-economical land sub-division, increased agricultural productivity, increased employment and other forms of livelihoods and appropriate woodland management strategies can reduce woodland degradation and deforestation. In addition, planned commercial growing of trees for charcoal and fuelwood production can supply the much demanded biomass energy, create employment, and provide additional ecosystem services. Despite the potential indicated by these isolated case studies, quantitative data to support focused investment in the identified interventions is not readily available. There is need to carry out a series of studies that will generate credible and up-to-date information on sustainable biomass resources management for different ecological regions of the country.
12 | P a g e
2 Impact of current biomass energy use on poverty reduction and ecosystem services
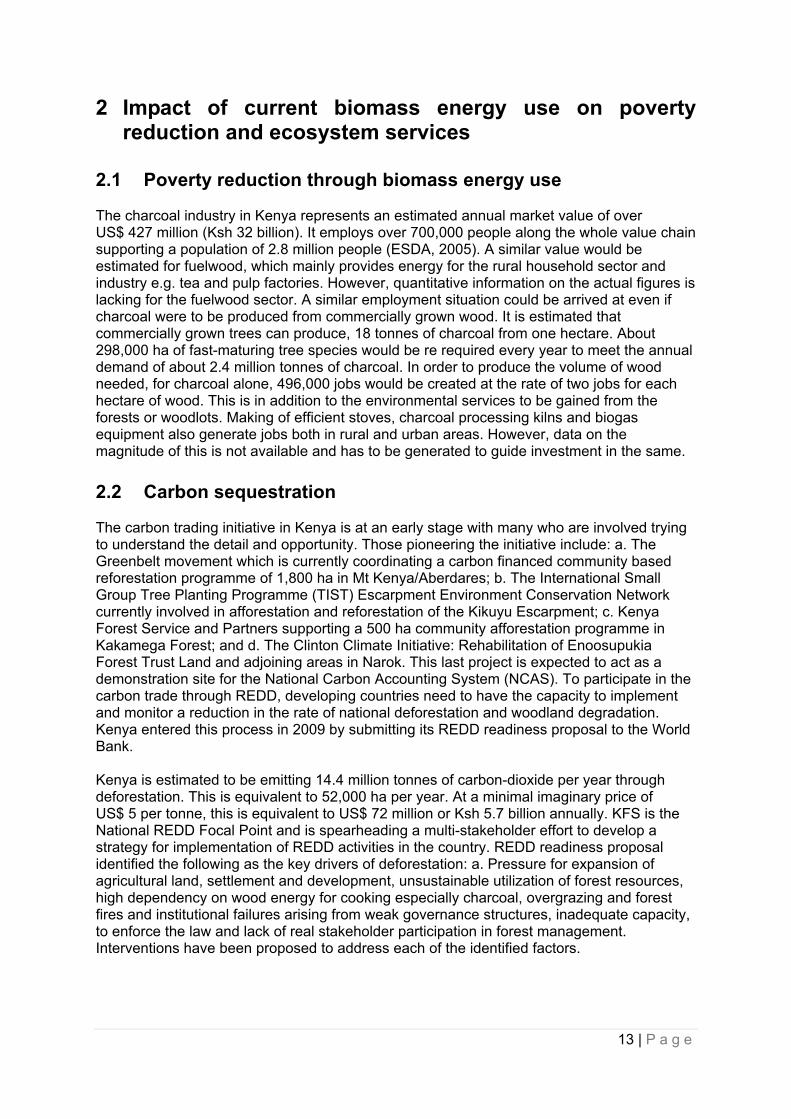
2.1 Poverty reduction through biomass energy use The charcoal industry in Kenya represents an estimated annual market value of over US$ 427 million (Ksh 32 billion). It employs over 700,000 people along the whole value chain supporting a population of 2.8 million people (ESDA, 2005). A similar value would be estimated for fuelwood, which mainly provides energy for the rural household sector and industry e.g. tea and pulp factories. However, quantitative information on the actual figures is lacking for the fuelwood sector. A similar employment situation could be arrived at even if charcoal were to be produced from commercially grown wood. It is estimated that commercially grown trees can produce, 18 tonnes of charcoal from one hectare. About 298,000 ha of fast-maturing tree species would be re required every year to meet the annual demand of about 2.4 million tonnes of charcoal. In order to produce the volume of wood needed, for charcoal alone, 496,000 jobs would be created at the rate of two jobs for each hectare of wood. This is in addition to the environmental services to be gained from the forests or woodlots. Making of efficient stoves, charcoal processing kilns and biogas equipment also generate jobs both in rural and urban areas. However, data on the magnitude of this is not available and has to be generated to guide investment in the same. 2.2 Carbon sequestration The carbon trading initiative in Kenya is at an early stage with many who are involved trying to understand the detail and opportunity. Those pioneering the initiative include: a. The Greenbelt movement which is currently coordinating a carbon financed community based reforestation programme of 1,800 ha in Mt Kenya/Aberdares; b. The International Small Group Tree Planting Programme (TIST) Escarpment Environment Conservation Network currently involved in afforestation and reforestation of the Kikuyu Escarpment; c. Kenya Forest Service and Partners supporting a 500 ha community afforestation programme in Kakamega Forest; and d. The Clinton Climate Initiative: Rehabilitation of Enoosupukia Forest Trust Land and adjoining areas in Narok. This last project is expected to act as a demonstration site for the National Carbon Accounting System (NCAS). To participate in the carbon trade through REDD, developing countries need to have the capacity to implement and monitor a reduction in the rate of national deforestation and woodland degradation. Kenya entered this process in 2009 by submitting its REDD readiness proposal to the World Bank. Kenya is estimated to be emitting 14.4 million tonnes of carbon-dioxide per year through deforestation. This is equivalent to 52,000 ha per year. At a minimal imaginary price of US$ 5 per tonne, this is equivalent to US$ 72 million or Ksh 5.7 billion annually. KFS is the National REDD Focal Point and is spearheading a multi-stakeholder effort to develop a strategy for implementation of REDD activities in the country. REDD readiness proposal identified the following as the key drivers of deforestation: a. Pressure for expansion of agricultural land, settlement and development, unsustainable utilization of forest resources, high dependency on wood energy for cooking especially charcoal, overgrazing and forest fires and institutional failures arising from weak governance structures, inadequate capacity, to enforce the law and lack of real stakeholder participation in forest management. Interventions have been proposed to address each of the identified factors.
13 | P a g e

2.3 Biodiversity and ecosystem resilience Any tree can be used for producing woodfuel. However, some tree species are preferred to others because of the quality of fuelwood and charcoal they produce. Ideally, the species known to have dense wood are harvested before the less dense species are harvested. In some regions of the country e.g. Kinango in Kwale district, all the suitable tree and shrub species have been harvested leaving behind the undesirable species and in other areas there are no trees for harvesting at all. The species preferred most for woodfuel are the acacias and other hardwoods. Some areas, especially in the arid and semi-arid areas, have depleted all their acacias. One study (Mugo and Poultrup, 2003) reported an area in Kitui that had only Commiphora africana and Commiphora baluensis which are considered almost useless for charcoal production. In an on-going study in Charengani Forest and its catchment areas (Cheboiwo et al., 2010), massive cultivation and clearance of vegetation both on farm and public forest has resulted in loss of both plant and animal biodiversity. Large animals, which used to be common are no longer present in the area. The effects of eucalyptus plantations on biodiversity have also been studied in Kenya. At Muguga, plant diversity was assessed in two Eucalyptus saligna plantations. There were about seven times more plant species in the older plantation than in the younger one indicating that species richness increases with the age of the plantation. It is also evident that the lower the stocking density, the higher the biodiversity of undergrowth plant species (Table 5). Table 5: Number of indigenous plant species under plantation of eucalyptus Characteristic Plantation 2h Plantation 1c Age in years 14 52 Number or rotations 1 4 Eucalyptus trees per hectare 1550 920 Number of indigenous plant species per hectare
50 370
There were 26% and 68% of woody species in the younger and older plantations respectively. Observations in other parts of the country have also shown that at low stocking level, or in high rainfall areas, regeneration of a wide range of indigenous plant species is found under plantation of eucalyptus. Some valuable tree species that regenerate easily under eucalyptus plantations include; Prunus africana, Polyscias fulva, Zanthoxylum gillettii, Juniperus procera, Croton macrostacyus, Carissa spinarum (Carissa edulis) and olea species, among many other lower plant species. Senbeta et al. (1998) carried out a study in Ethiopia to assess the status of indigenous species diversity in plantation of E. saligna and E. globulus. The plantations were aged between 11 and 27 years. The results showed that while there were 3,575 indigenous plant species per hectare in the 11-year old plantation of E. saligna, the plantation of 27 years had a total of 18,650 indigenous plants. Under the 16-year old plantation of E. globules, there were 2300 indigenous plants while the 22-year old plantation had 13,400 indigenous plants per ha. Studies in other countries have also given similar results. In Hawaii, it was reported that there were 42 indigenous species growing beneath E. saligna plantations of 26 to 32 years in age. Binkley and Stape (2004) confirmed that large areas of eucalyptus plantations have the potential to alter the diversity of plant and animal species but they vary based on the surrounding landscape, weather, agricultural status, savannah or natural forest and the management regime applied. For example, plantation forests in Brazil as a rule must retain at least 20% of the land under indigenous forests. The paper further indicates that some trials with mixed species have shown increased benefits. Mixed stands that contain nitrogen-fixing tree species may increase stand growth depending on site condition. Eucalyptus plantations with low stocking and open canopy create conditions favourable for regeneration of other plant species and therefore enhance biodiversity conservation. However, this is better enhanced in plantations close to
14 | P a g e

indigenous forest where seed is easily dispersed by wind and animals into the eucalyptus plantation. While there is deliberate effort to increase growing of indigenous tree and shrub species in a number of areas in the country, in many other areas that have eroded biodiversity, these deliberate efforts to increase the species diversity are minimal. Studies on biodiversity loss as a result of biomass energy use are scarce and need to be initiated. In addition pilot demonstration projects of natural regeneration of indigenous tree and shrub species and even herbaceous plant species should also be demonstrated to generate lessons that could be used to improve species diversity in all parts of the country. Specific management plans for the same could be useful. 2.4 Watershed dynamics and flows Preliminary results from an ongoing case study by the Kenya Forestry Research Institute (Cheboiwo et al., 2010) on economic valuation and compensation for environmental services of the Moiben river system of Cherengani Forest indicates that there is indiscriminate cutting of trees on private farm lands for woodfuel and construction. The Agricultural Act is not adhered to and so cultivation for crop production is up to the river bank. Terraces are not constructed and where they exist, they are not maintained. Sub-division of land to accommodate increasing on-farm population is also increasing the harvesting of trees, shrubs and clearing of other vegetation to create land for farming. The local people extract wood extensively inside the public forest and therefore, there is minimal regeneration of tree and shrub species. There is illegal cultivation in upstream forest areas that has interfered with the water catchment and stream flows. Many tributaries to the river systems have become seasonal, have very low water flows or have completely dried up. This is because the catchment areas have been cleared for potato farming. In addition, extensive interviews with the local people revealed that Moiben River was served by about 29 tributaries originating from the forest 30 years ago, but now, only 11 are remaining though with reduced volumes of water. The key issues from the study are that the institutions charged with the responsibility of natural resources management in the area are not working effectively in a coordinated manner. In most cases, the policies and legal frameworks are in conflict. In addition, the extent of critical catchment areas for conservation is not known, upstream farming, cropping expansion and forest loss has resulted in unstable river flows and decreased water volumes. There is increased sediment in the rivers as a result of farming on steep areas with a consequence of increased impurities in drinking water. Similar studies need to be undertaken for all water systems/catchment areas in the country in order to generate information for tailor made interventions. A recent review by the Kenya Forestry Research Institute has also revealed that natural and plantation forests play an important role in the hydrological cycle as they affect evaporation, runoff and infiltration (Davidson, 1995). Forests are generally known to transpire more water than short rotation crops, scrub or grass. Forests with good ground cover or undergrowth (shorter plants growing under tall trees) have high rates of infiltration and therefore low runoff. High infiltration may, however, be reduced by activities that reduce ground cover such as weeding, overgrazing, burning, soil and compaction among others. Increased infiltration rates lead to higher soil and groundwater recharge and this increases river flow during the dry season. Most trees have crowns that provide good interception of raindrops thus protecting the soil mantle and allowing for effective infiltration and groundwater recharge, hence the need to conserve forests and create more.
15 | P a g e

2.5 Cultural practices and landscape integrity
2.5.1 Ecological impacts of biomass energy use and scarcity In rural areas of Kenya, there are no established market mechanisms to bring supply and demand for biomass fuels into balance. As such, the depletion of biomass fuel resources continues unabated with severe impacts on other parts of the biomass system and on present and future household energy supplies. These impacts are most severe for the poor who cannot change to alternative forms of energy because of lack of capital and are least able to adapt to the increasing scarcity and the rising cost of available energy resources (Leach and Gowen, 1987). Households that experience woodfuel shortages adapt in numerous ways to alleviate their difficulties. In the event of scarcity of any resource, households economise on the use of the resource (Foley and Banard, 1984). Apart from reducing consumption, other responses to woodfuel shortages include fuel sharing, shared cooking, increased labour use for fuel collection, the use of alternative fuels, migration, and nomadism (Dewees, 1989). Planting and tending of trees for fuel production is one of the most obvious responses to woodfuel shortages. Studies have shown that kerosene and fossil fuels are unlikely to be used as alternatives to fuelwood as long as there is a broad range of much lower cost options (Dewees, 1989). Foley and Banard (1984) list the most common lower fuel alternatives as being dung, agricultural residues, and small wood branches from trees and bushes, which would previously have been rejected. However, no matter how imaginative the survival response to woodfuel scarcity, there can be little doubt that in such situations, the underlying, long term sustainability of the available resource is undermined. As fuelwood comes from predominantly local sources (Baidya, 1984), it is generally the area immediately surrounding the homesteads, refugee camps or population centres, which suffer most from environmental degradation (Ritter, undated). As this area becomes denuded of its forest resource, so does its inherent agricultural potential decline. This same area then becomes subject to erosion, soil degradation and loss of biological diversity (Baidya, 1984; Westoby, 1989). 2.5.2 Social economic impacts of biomass energy use and scarcity Besides the negative ecological consequences of fuelwood scarcity, many of the common responses to fuelwood scarcity have negative social and economic consequences. As the immediate source of fuelwood becomes depleted, distances, and thus times, travelled for its collection increase. O’Keefe and Raskin (1985) suggest that reduced cooking times, more infrequent meals and changes in dietary patterns may negatively affect health. This is particularly serious for more vulnerable groups such as pre-school children (Longhurst, 1987). Wangari Mathaai is quoted in Zaqueu (1991) as saying “because of lack of adequate fuelwood, households may be prompted to switch to poorer quality foods, leading to malnutrition, poor health, and low productivity”. Haugerud (1982) in her study in Embu District of Kenya lists a typical daily routine for a woman and also claims that both family welfare and productivity are diminished because of increased fuelwood collection times. The problem is also manifest in urban areas where more money must be spent on wood and charcoal and therefore, less on food (Westoby, 1989). Webourne (1990), in a study in Embu, Meru and Isiolo districts in Kenya, reports that because the fuelwood source is sometimes so far away from the homestead, men are commonly seen gathering fuel with the use of ox-carts for transportation. As the scarcity increases, Nilsson (1986) notes that regulations regarding collection of fuelwood from forest reserves may end up existing only in name since in most cases they are ignored. This has negative implications for the hydrological cycle since the water catchment areas are interfered with. To address woodfuel scarcity problems in Kenya, it will be necessary to map out the biomass energy characteristics in each County, District, and Location as the beginning of a process of identifying key problem areas and
16 | P a g e

identifying specific intervention points. A study was done for two districts to identify key characteristics and causes of biomass energy scarcity and possible intervention points. The results were as discussed in section 2.5.3. 2.5.3 Land factors, tree planting and woodfuel supply characteristics It is estimated that a household needs about 1.2 to 2.4 acres (0.5 to 1.0 ha) of land under trees to meet its requirements for fuelwood, poles and other wood needs on a sustainable basis (Pimentel et al., 1986). In 1994, the average land holding in the high potential areas of Kenya was estimated to be 1.9 acres (0.8 ha) (Republic of Kenya, 1994). Dewees (1988) argues that when land holdings become very small, land is used for planting trees rather than for agricultural crops. Investigation into what happens to fuelwood supply when the land required for its supply exceeds the available family land in the high potential densely populated areas of Kenya revealed that most of the land was under utilized since fuelwood could be supplied from appropriate tree species like Grevillea robusta planted on the farm boundary alone. In this study, the results showed that only 18% of farm boundary land had been utilized for tree planting in Vihiga while in Kirinyaga district, the proportion was 45% leading to a conclusion that trees for fuelwood supply could be planted on farm boundaries alone for those who own some land. In Kirinyaga, the study revealed that a household of 8 people required only 411 meter length of farm boundary to plant pollardable or coppice-able tree species for sufficient fuelwood supply. In Vihiga, a household of 7 persons would require 350 metre length of farm boundary length to plant grevillea trees for sustainable fuelwood supply. As woodfuel shortage increases, more households switch to using crop residues for fuel (Foley and Barnard, 1984; Mugo, 1997). But as land size decreases, the supply of agricultural crop residues also decreases. In such a case, households turn to purchase of fuelwood, charcoal or kerosene. This provides an opportunity for commercial production of fuelwood and charcoal – a stage that Kenya has reached.
17 | P a g e

3 The main policies and legislations that govern different types of biomass use
For a long time, the biomass energy sub-sector in Kenya has suffered from lack of relevant policies and legislation to govern the industry, however, in the recent years, the government has formulated an Energy Policy (2004), draft Forest Policy (currently in Parliament), and draft Environmental Policy (in its final stages of completion). In addition, an Environmental Management and Coordination Act (1999), a Forest Act (2005) and an Energy Act (2006) have also been formulated to facilitate implementation of the policies. The challenge Kenya has now is to effectively implement these policies.
3.1 Specific policies and legislations that govern different types
of biomass use
3.1.1 Energy policy The national biomass energy policy objective is to ensure sufficient supplies of the resource to meet demand on a sustained basis while minimizing the environmental impacts associated with biomass energy consumption. Specifically, the policy provides for: a. formulation of a national strategy for coordinating biomass energy research; b. increasing support for Research and Development, including capacity building for technology transfer, support property rights and innovations; c. integrating biomass energy issues, including research on biomass energy effects on climate, health, etc. into the formal education system; d. licensing charcoal to encourage its commercial production in a sustainable manner; e. promoting private sector participation in biomass energy production, distribution and marketing; f. increasing the rate of adoption of efficient charcoal stoves from 47% in 2004 to 80% in 2010 and to 100% in 2020 in urban areas; and to 40% by 2010 and 60% by 2020 respectively in the rural areas; g. increasing the rate of adoption of efficient fuelwood stoves from 4% in 2004 to 30% in 2020; h. promoting inter-fuel substitution; i. increasing the efficiency of the improved charcoal stove from the 2004 level of 30-35% to 45-50% by 2020; j. promoting introduction of efficient charcoal kilns for charcoal production; k. promoting use of fast maturing trees for energy production; l. promoting establishment of commercial woodlots including peri-urban plantations; and m. offering training opportunities for Jua Kali artisans at the village level for the manufacture, installation and maintenance of renewable energy technologies including efficient cook stoves. For other renewable energies, the Energy policy provides for promotion of cogeneration to generate 300MW from biomass residues by the year 2015 in the sugar industry and other commercial establishments where opportunities exist. This will also be accompanied with relevant research on co-generation. Within the policy, the government recognizes the importance of other biomass energy sources such as biogas and municipal waste. In order to encourage private sector participation in harnessing these sources of energy, the policy promotes: a. undertaking of feasibility studies on utilization of municipal solid waste as a source of energy, b. formulation and enforcement of standards and codes of practice on renewable technologies to safeguard consumer interests; c. packaging and disseminating information on renewable energy systems to create investor and consumer awareness on the economic potential offered by these alternative sources of energy – this includes establishment of community based pilot projects where feasible in order to promote acceptance; d. promoting research, development, and demonstration of the manufacture of cost effective renewable energy technologies; e. promoting development of appropriate local capacity for manufacture, installation, maintenance and operation of basic renewable technologies such as biodigesters; f. promoting development and widespread utilization for renewable energy technologies which are yet to reach commercialization level; g. promoting
18 | P a g e

growing of appropriate tree species for production of feedstock for manufacture of biodiesel; h. allowing duty-free importation of renewable energy hardware to promote widespread usage; i. provision of tax incentives to producers of renewable energy technologies and related accessories to promote their widespread use; j. provide fiscal incentives to financial institutions to provide credit facilities for periods of seven years to consumers and entrepreneurs; k. encouraging private sector initiatives to enter clean biomass and other renewable technologies energy market and also allocating resources to research into and promote mature alternative sources of renewable energy technologies; and l. encouraging the private sector, NGOs and other self help groups to accelerate their efforts in tree planting and environmental protection. 3.1.2 Energy Act As indicated in Part V of the Energy Act section 103, the act provides for promotion of the development and use of renewable energy technologies which include biomass, biodiesel, bioethanol, charcoal, fuelwood, biogas and municipal waste. This is to be done by the parent Ministry of Energy by: a. formulating a national strategy for coordinating research in renewable energy; b. providing an enabling framework for the efficient and sustainable production, distribution and marketing of biomass, charcoal and municipal waste; c. promoting the use of fast maturing trees for energy production and the establishment of commercial woodlots including peri-urban plantations; d. promoting the use of municipal waste for energy production; and e. promoting the development of appropriate local capacity for the manufacture, installation, maintenance and operation of basic renewable technologies such as biodigesters biomass end use technologies, solar systems and hydro turbines; f. harnessing opportunities offered under the clean development mechanism and other mechanisms including but not limited to carbon credit trading to promote the development and exploitation of renewable energy sources; g. promoting the production and use of gasohol and bio-diesel; and h. promoting international co-operation on programmes focusing on renewable energy sources; i. promoting the utilization of renewable sources of energy for either power generation or transportation; j. promoting co-generation of electric power from crop residue by sugar millers and sale of such electric power through national grid directly to the consumers. Part V section 104 of the Act provides for development and management of an energy efficiency and conservation programme, which includes: a. making, in consultation with the Kenya Bureau of Standards, requirements for the efficiency details to be displayed on labels on equipment or on appliances; b. taking all measures necessary to create awareness and for the dissemination of information for efficient use of energy and its conservation; c. strengthening consultancy services in the field of energy conservation; d. promoting research and development in the field of biomass energy conservation; e. formulating and facilitating implementation of pilot projects and demonstration projects for promotion of efficient use of energy and its conservation; f. giving financial assistance to institutions for promoting efficient use of energy and its conservation; g. supporting the preparation of educational curriculum on efficient use of energy and its conservation for educational institutions, and coordinating with them for inclusion of such curriculum in their syllabus; h. implementing international co-operation programmes relating to efficient use of energy and its conservation; i. giving financial incentives for any investment made to replace or install additional capital investments to improve energy efficiency; and j. making it mandatory, in collaboration with the Kenya Bureau of Standards, the importation of energy efficient but cost effective technologies.
19 | P a g e

3.1.3 The Forests Act Various studies have indicated that about 90% of all the wood harvested in Kenya is used for woodfuel. The remaining 10% is used for construction poles and timber. This makes the forest sector a basically biomass energy industry. Part III of the Forest Act sections 23, 24, 25, 26 provides for creation of State Forests, Local Authority (County Forests), Private and Farm Forestry, Declaration of Provisional Forests and management of the same. Each of these forests is to be managed using approved Forest Management Plans. The Forest Management Plans for state and provisional forests are to be prepared by the Kenya Forest Service. The Local Authorities are responsible for preparation of management plans for each Local Authority Forest. Participation of communities has also been provided for through the formation of Community Forest Associations (CFAs). Part IV section 47 indicates the functions of the CFAs. The key ones include the protection, conservation and management of forests based on an approved forest management plan, formulation and implementation of forest programmes consistent with the traditional forest user rights of the community concerned in accordance with sustainable use criteria and assisting the Kenya Forest Service in enforcing the provisions of the Act and any rules and regulations made pursuant to the Act in particular in relation to illegal harvesting of forest produce. The management agreement between KFS and the CFAs confers on the association the forest user rights to collect medicinal herbs, harvesting of honey, harvesting of timber or fuelwood, grass harvesting and grazing, collection of forest produce for community based industries, ecotourism and recreational activities, plantation establishment through non-resident cultivation, contracts to assist in carrying out specified silvicultural operations, and development of community wood and non-wood forest based industries. According to Part VI section 59 of the Forest Act, the Minister can formulate rules with respect to any matter which is necessary to be prescribed for carrying out or giving effect to this Act. Under this provision, The Forest (Charcoal) rules, 2009 have been formulated to guide charcoal production, processing and marketing. These rules are in their initial stage of implementation. 3.1.4 Environmental policy The key environmental challenges within the biomass sub-sector are the inadequate incentives for biomass energy supply and conservation that lead to unsustainable utilization of forest resources especially woodfuel and use of inefficient end-use technologies. The environmental policy although still in its draft form requires that all energy projects and programmes including those dealing with biomass energy, whether production or utilization should undergo Environmental Impact Assessments (EIA) to ensure that environmental concerns are taken care of during planning and implementation of such projects and programmes. 3.1.5 Environmental Management and Coordination Act The Environmental Management and Coordination Act of 1999 (EMCA) commenced on 14th January 2000. It regulates the supply of fuelwood and charcoal indirectly via an environmental conservation perspective. Article 38 conveys the obligation of the National Environment Action Plan through an authorised committee to set up operational guidelines for the planning and management of the environment and natural resources. Given the nature of the Act, this obligation presumably implies planning and management of sustainable supply of woodfuel. The provincial and district administrations are responsible for the proper management of the environment in their provinces and districts respectively. The above mentioned guidelines are to be used in the activities of Provincial and District
20 | P a g e

Environmental Committees (PEC and DEC respectively). Management of the hilly and mountainous areas of Kenya has noticeable provisions in the Act. In case of risk of degradation, the DEC is required to specify which of the areas are to be targeted for afforestation or reforestation programmes. A novel and important provision exists in EMCA. It is stated that, all intended projects with a significant impact on the environment require an environmental impact assessment (EIA) to be done by authorised personnel according to the Environmental Impact Assessment Regulations of 2003 before implementation of the projects. EMCA represents a progressive legislative endeavour towards managing the environment. As regards the demand side of firewood and charcoal, it has relevance by reason of granting the right for all persons in Kenya to have access to a clean and healthy environment including access to environmental elements which includes vegetation. It is directly mentioned in paragraph 49 that the National Environmental Management Authority (NEMA) is to promote the use of renewable energy sources through encouraging private farmers, institutions and community groups to plant trees and woodlots and creating an incentive scheme for the promotion of the energy sources. Although the Act has been in operation for about 10 years, enforcement of the provisions remains a huge challenge that needs enormous personnel and financial resources. 3.2 Key institutions and individuals in the biomass energy sector There are various institutions that are key in the governance, production and utilization of biomass energy in the country. They include the following: The Ministry of Forestry and Wildlife Resources which is the key Ministry as far as woodfuel supply is concerned. The Kenya Forest Service and the Kenya Forestry Research Institute are the development and research arms respectively of the Ministry of Forests and Wildlife hence are critical in biomass energy development. The Ministry of Energy provides the overall policy for energy development in the country and is stronger in biomass energy demand management programmes. The Ministry of Environment and Mineral Resources works collaboratively with government ministries to ensure sustainable management of the environment. The Ministry of Local Government under which the Counties fall plays a crucial role in providing policy leadership as far as utilization of trustlands is concerned. Now that the main governance units in Kenya are counties, they are critical in biomass energy development interventions. Other institutions include the Ministry of Lands for providing direction on land issues, Kenya Bureau of Standards for formulating and enforcing standards in the biomass sub-sector, the Ministry of Youth for mobilizing and funding youth in the various production, processing and marketing intervention activities of the sub-sector. Practical Action – East Africa, African Centre for Technology Studies (ACTS), the International Centre for Research in Agroforestry (ICRAF) carry out relevant policy and technological studies that contribute to biomass development. GTZ an international bilateral development organization plays a role especially in development of the biogas technology. There are a number of NGOs and numerous CBOs in the country involved in biomass energy development, however, they have to be engaged and guided on the most effective way to address the biomass energy supply challenge. Other institutions and their roles are as indicated in Table 6.
21 | P a g e

Table 6: Institutions involved in the biomass energy sub-sector Institution Current role in wood fuel sub-
sector Technical capacity
Ministry of Energy a. Policy formulation, coordination of implementation and general leadership of the sector
Have technical officer at the provincial level only
Ministry of environment Natural Resources and Wildlife
a. Provides extension services in the field of forestry
b. Issues certificates of origin for charcoal production
c. Issues movement permits on behalf of the district Environment Management Committee
Have professional technical staff up to the divisional level
Ministry of Agriculture a. Promotes agro forestry on farms
b. Promotes efficient energy utilization through the home economics Department
Have professional staff up to locational level
Ministry of local government
a. Collects cess from charcoal traders
b. Provides trade licenses to charcoal traders
c. Leases land to investors
Staff at the district headquarters and check points (barriers)
Ministry of Livestock a. Provides technical guidelines for the management of range vegetation
b. Issues certificate of origin for charcoal in ranches
The ministry works together with agriculture that has staff up to the locational level
Ministry of Cooperative Development and Marketing
a. Registers production, processing and marketing cooperatives
b. Builds the management capacity of cooperatives through training of cooperative leaders
Have staff up to the District level
Ministry of Gender, sports, Culture and social services
a. Registers CBOs e.g. self help groups
b. Trains groups in leadership and group dynamics
Have staff up to the Location, which is the second lowest administrative unit
Ministry of land and settlement
a. Develops land use policy and plans
b. Enforcement of land use plans
Have staff up to the district level
Ministry of Education a. Teaches tree planting and environmental conservation in schools
b. Teaches efficient energy utilization in schools
There are numerous schools in all the districts
22 | P a g e

Regional Development Authorities (e.g. Tana and Athi river Development Authority and coast Development Authority)
a. Own land in charcoal producing areas
Have the potential to develop a large-scale tree plantations to produce charcoal commercially as a cash crop
National Environment Management Authority
a. Environment protection-Regulating Natural Resources Utilization through legislation
Will soon post staff to all districts
Kenya Forestry Research Institute
Conducts research nationally Has staff in all the regions
Office of the president a. District Commissioner b. Chief and sub-chief c. Police
a. Coordinating development b. Verifies farm ownership
(chief) c. Verifies tree ownership(chief) d. Verifies legality of charcoal
on transit (police)
Have staff up to the sub-location, police are up to the divisional level
Practical Action Conducts biomass energy policy studies
a. Has staff at the national level
NGOs and Professional Associations e.g. Greenbelt Movement, CARPA, Kenya Society for Foresters, ICRAF, ACTS
a. Creates awareness on environmental conservation ad tree planting
b. Supports tree planting c. Carries out policy and
technical studies to inform decision making.
Generally limited staff and cover small areas like a location, division, district or a project
Community Forest Associations
Coordinates charcoal and fuelwood production, processing and trade
Limited technical knowledge
CBOs Most are formed based on specific community needs
Limited technical knowledge and market information
23 | P a g e

4 Innovative and sustainable biomass energy projects 4.1 Innovative projects
4.1.1 Kakuzi Ltd: Commercial growing of trees for poles and charcoal Kakuzi is a private limited company that grows their own trees, especially eucalyptus for treated poles and charcoal. The company harvests the straight poles, treats and sells them. The trees that are not suitable for poles are harvested and processed into charcoal using energy efficient kilns of about 28-30% efficiency. The charcoal is sold to vendors at a wholesale price which varies with the seasons. Vendors buy the charcoal and sell at a profit to consumers in the neighbouring towns especially Thika and Nairobi. The growing of trees in this manner is a sustainable way of producing the wood. During the growth period, the trees offer ecosystem services such as soil erosion control, reduction of water run-off and increased carbon dioxide uptake from the atmosphere. The value and impact of these services however needs to be quantified. According to an analysis by Kakuzi Ltd, charcoal production and trade is a profitable enterprise as indicated in Table 7 which shows the cost, economic viability and benefits of the charcoal production component of the company. In an analysis conducted by Kakuzi in 2003, the total cost of producing one bag of eucalyptus charcoal was reported to be Ksh 159. The farm-gate selling price was Ksh 260. Transportation to the main market (Nairobi) cost Ksh 50 per bag. Wholesale price in Nairobi then was Ksh 350. In this case, the producer got a profit of Ksh 101 while the trader got Ksh 40 for every bag sold. Table 7: Economic cost of charcoal from one cubic meter of wood (5.3 bags of 35 kg each) Activity Cost (Ksh) Estimated cost/bag (Ksh) Tree growing 396 75 Kiln construction 104 20 Harvesting of wood 205 39 Operational cost 56 11 Handling cost 63 12 Store and stock 18 3 Total cost 842 159
Source: Miti, 2010 4.1.2 RAFDIP Community Forest Association RAFDIP Community Forest Association is an umbrella CBO in the Bondo district of Nyanza Province. The groups came together and started growing two acacia tree species for charcoal production in 2002. The specific trees grown are Acacia xhanthophloea and Acacia polyacantha. The trees are harvested after six years for charcoal production. So far, over 240 ha of acacia woodlots have been planted. Each hectare is planted with approximately 2,500 seedlings. The CBOs are contracted by the Christian Agricultural and Related Professional’s Association (CARPA), to raise tree seedlings at a cost of Ksh 7 per seedling. The CBO is given the responsibility to identify the farmers to plant the trees. The number of trees planted depends on the number of farmers identified, number of tree seedlings demanded by the farmers and the amount of money available for raising of the seedlings. The identified farmers are given 2500 seedlings per hectare valued at Ksh 7 per seedling. As an incentive to sufficiently weed the woodlots, the farmers are also given 40 kg of crop seed per hectare particularly beans and groundnuts to intercrop with the trees for short term food supply and income generation. Intercropping with crops is done in year one and two. In the third year, the farmer is given a beehive for every 500 trees planted. With proper
24 | P a g e

management, harvesting of honey begins three months after colonization. Trees are harvested at year 6 for charcoal production. The tree stumps are left to coppice and pruned to three stems per stump and the cycle continues. Just as for the case of Kakuzi Ltd, the trees are a source of income and also provide ecosystem services such as carbon-dioxide uptake, increased rainwater infiltration and erosion control in some farms. This model of afforestation (Community Driven Commercial Afforestation – CODCA Model) is spreading very fast and has potential for wider adoption. It is a promising mode as far as income generation and ecological stability of the environment are concerned. 4.1.3 GTZ/Ministry of Energy biogas promotion project Between 1983 and 1994, the Special Energy Programme of the Ministry of Energy funded by GTZ promoted the construction and use of household biogas digesters. By the end of the project, the project was estimated to have disseminated approximately 1000 biogas units. While the biogas technology is technically viable, the cost of construction has been prohibitive and as a result, many potential adopters have not been able to construct the units even when they have the minimum required number of cattle for producing the dung. The other constraints are the high cost of the relevant appliances and lack of skilled artisans to construct and provide maintenance services. For increased adoption of the biogas technology to occur, there is need to have sufficient numbers of trained artisans who can construct for any interested clients, there is need for credit facilities to ensure that potential adopters have access to affordable credit for constructing and using the units. Where it is working optimally, this technology replaces the use of firewood and charcoal for cooking and kerosene for lighting. It therefore contributes to reducing deforestation and the effects of indoor air pollution from the use of fuelwood, charcoal and farm residues.
4.1.4 Electricity generation from crop residue The Mumias Sugar Company is a pioneer corporate institution in generating electricity from bagasse. Although the project is reported to be expensive, it has demonstrated the viability of such an investment. This provides an example for other sugar companies to follow. The potential for this kind of project exists in the country and should be exploited. The key ingredients for exploitation are sound business plans by the Sugar Companies and good will from the government. The power generated is sold to the national grid for distribution to consumers. The project has two major benefits. It provides electricity which although not directly, can be used for creating employment for the informal rural sector through power connections for small scale businesses like welding, hair dressing, cottage industries etc. and also reduces the waste build up. 4.2 Factors of success and failure of the innovative projects All the above examples of biomass energy utilization projects have potential to expand in the country. The common threat that flows through each one of them is the economic benefits of the enterprises suggesting that future interventions should have stronger leaning on the economic benefits for the key players but should be structured such that the ecological factors are sufficiently incorporated. In such a case, ecological benefits will automatically be realized. For charcoal, the negative policy environment has been a key hindrance to the growth of the sector but the enactment of the Energy Policy and Act, the Forest Act and the Charcoal Subsidiary Legislation have opened up the sector for growth. For the project on electricity from biomass, the key hindrance is the high cost of upfront investment for the industry concerned, while for biogas, it is the high cost of investment by the household and inconsistent promotion efforts. Funds are available in banks and micro-finance institutions. What is required is formulation of affordable and programme compatible financial products.
25 | P a g e

5 Theory of change for biomass energy use in Kenya
5.1 Shift to commercial production and utilization of biomass energy
Kenya has been involved in tree planting for biomass energy supply for the last 30 years. Some progress has been made but it is far from achieving a balance between supply and demand as evidenced by the latest national study which reported a deficit of 57.2%. Emerging evidence as reported in chapter 4 shows that the highest promise is in extensive commercialization of the biomass energy sub-sector especially given that it provides the required energy for the country, creates employment, generates income and provides ecosystems services. The main approaches should include: a. large scale corporate production of biomass energy in designated regions where land is not a major constraint, b. small scale farmers producing charcoal and fuelwood as cash crops modelled in the line of the tea industry (small scale tea growing with collection centres dispersed within production zones), c. sustainable management of naturally growing woodlands and bush lands guided by approved management plans, d. investing in value addition of the biomass residue that is not suitable for soil fertility improvement and e. expanded manufacture of energy efficient stoves, kilns and biogas appliances. 5.2 Preconditions for the transition As explained in chapter three, the necessary policies and legislations for biomass energy development are in place. What is required is implementation of the policies and enforcement of the legal provisions. A strong awareness and catalization programme (active engagement of all stakeholders), aggressive cultivation of the necessary political will of the highest office in the land accompanied with development of suitable financial products by the financial institutions are preconditions for the transition. 5.3 Activities to be implemented To start implementation of the proposed change, there is need to package the need to change to commercial production of biomass energy in convincing and easily understandable terms. Convincing case studies and models could be used to bring about this change. This should be followed by sensitization of the government of Kenya and the development partners on the need to take the commercial route. The relevant NGOs and CBOs in the sector should also be sensitized and aligned accordingly. The next step will involve development of new commercially oriented biomass development programmes, and mobilize sufficient resources for investing in the same. Programmes should be long enough e.g. 10 years and above to match the duration of biomass production cycles. Development of markets should be given sufficient attention since they will act as a pull factors in the whole process. To ensure continuous supply of information for decision making, a biomass energy research centre/programme should be established within the Kenya Forestry Research Institute and funded sufficiently to deliver. In addition, each County should be supported to develop local level biomass energy information and planning offices to regularly generate vital statistics for planning and investment.
26 | P a g e

5.4 Indicators for measuring success Indicators to measure progress and success will include official government commitment and number of development partners’ who will have shifted to the commercial approach for biomass energy development, the number of NGOs and CBOs involved in promoting and implementing commercial biomass energy production and utilization, the level of financial and human resources mobilized to implement the programmes, the area planted or naturally regenerated for biomass energy supply, the income generated and level of ecosystem services rendered.
27 | P a g e

6 References Baidya, K. N. (1984) Firewood shortage: ecoclimatic disasters in the third world. International Journal of Environmental Studies. Vol. 22. pp. 155-272. Binkley, D. and Stape , J.L. (2004) Sustainable management of Eucalyptus plantations in a changing World. In: Borralho, N. et al. (Ed). Eucalyptus in a changing world proceedings of IUFRO Conference, Aveiro. 11-15, October 2004. Chambers, R. and Leach, G. (1987) Trees to meet contingencies: savings and security for the rural poor. Discussion paper no. 228. Institute of Development studies, University of Sussex, England. Cheboiwo, J., Langat. D. and Kimani, S.M. (2010) Framework for economic valuation and compensation for environmental services: The Case of Moiben River system of Cherengany Forest in Marakwet district. Unpublished annual summary report for Project NF/3.2-2009/2010. Kenya Forestry Research Institute. Davidson, J. (1995) Ecological aspects of Eucalypts. In: Proceedings of Regional expert consultation on eucalyptus. Vol. 1, FAO Regional Office for Asia and Pacific, Bangok, Thailand. Dewees, P. (1989) The woodfuel crisis reconsidered: observations on the dynamic of abundance and scarcity. World Development, 17, 8, 1159-11172. Dewees, P. (1995) Farmer responses to tree scarcity: The case of woodfuel. In: Arnold, J.E.M and P.A. Dewees (eds). Tree management in farmer strategies: Responses to agricultural intensification. Oxford Forestry Institute. University of Oxford. Oxford University Press. Oxford, NewYork, Tokyo, Melbourne. Energy for Sustainable Development Africa (2005) National Charcoal Survey: Exploring potential for sustainable charcoal industry in Kenya. Foley, G. and Banard, G. (1984) Farm and Community Forestry. Technical Report No. 3. International Institute for Environment and Department. London. Haugerud (1982) Economy, ecology and fuelwood scarcity in Embu. Kenya. Kenya Woodfuel Development Programme. Beijer Institute, Box 56212. Nairobi, Kenya. International Centre for Research in Agroforesty (1996) Annual Report. ICRAF. Nairobi, Kenya. Leach, G. and Gowen, M. (1987) Household energy Handbook: an interim guide and reference manual. The World Bank. Washington DC. Longhurst, R. (1987). Household Food Security, tree planting and the poor: The case of Gujarat. ODI Social Forestry Network. Mugo, F.W. (1989) Woodfuel supply and demand in a rural set up: the case for Naitiri Sub-location, Bungoma District. Masters of Arts in Planning thesis. University of Nairobi, Nairobi, Kenya. Mugo, F.W. (1997) Factors contributing woodfuel scarcity and the consequent use of crop residues for domestic energy in Rural Kenya. A thesis presented to the Faculty of the
28 | P a g e
29 | P a g e
Graduate School of Cornell University in partial fulfillment of the requirements for the degree of Master of Science. Ithaca, NY. USA. Mugo, F.W. (1999) The effects of fuelwood demand and supply characteristics, land factors and gender roles on tree planting and fuelwood availability in highly populated rural areas of Kenya. A dissertation presented to the Faculty of Graduate School of Cornell University in Partial fulfillment of the requirements for the degree of Doctor of Philosophy. Ithaca, NY, USA. Mugo, F. and Poultrup, E. (2003) Assessment of potential approaches to charcoal as a sustainable source of income in the Arid and Semi-arid lands of Kenya. A study commissioned by Danida and Regional Land Management Unit (RELMA). Nilsson, P. (1986) Wood: The other energy crisis and struggle. Scandinavian Institute of African Studies. Stockholm Uppsala. O’Keefe, P., Raskin, P. and Steve, B. (1984) Energy and Development in Kenya: opportunities and constraints. Beijer Institute and the Scandinavian Institute of African Studies, Stockholm and Uppsala. O’Keefe, P. and Raskin, P. (1985) Fuelwood in Kenya: Crisis and Opportunity. Ambio 14. No. 4-5. 220-224. Okoth-Ogendo, H.W.O. (1980) The law in relation to land practices in Kenya. In: Proceedings of Kenya National Seminar on Agroforestry, 1980. ICRAF. Nairobi, Kenya. Pimentel, D., Dazhong, W., Eigenbrode, S.S., Lang H., Emerson, D. and Karasaki, M. (1986) Deforestation: interdependency of fuelwood and agriculture. Oikos. 46. 404-412. Republic of Kenya (1994) 1994-1996 National Development Plan. Government Printers, Nairobi, Kenya. Republic of Kenya (2002) Study on Kenya’s Energy Demand, Supply and Policy Strategy for Households, Small Scale Industries and Service Establishments. Ministry of Energy, Nairobi, Kenya. Republic of Kenya (2004) Sessional Paper No. 4 of 2004 on Energy. Government Printers. Nairobi, Kenya. Republic of Kenya (1999) Environmental Management and Coordination Act. Government Printers, Nairobi, Kenya. Republic of Kenya (2005) The Forests Act. Government Printers, Nairobi, Kenya. Republic of Kenya (2006) The Energy Act 2006. Government Printers. Nairobi, Kenya. Ritter, W. (Undated) The fuelwood crisis – Re-emergence of an old problem, in Applied Geography and Development, Vol. 35. Webourne, A. (1990) Consultancy to investigate the potential for commercial woodfuel production in Embu, Meru and Isiolo. The Bellerive Foundation, Nairobi. Westoby, J. (1989) An introduction to World Forestry. Basil Blackwell Ltd. 108 Cowley Rd. Oxford, OX4 IJF, UK. Zaque, L. (1991) African woodfuel crisis continues unabated. All Africa Press Service. Science and Technology Features Service. Box 14205, Nairobi, Kenya.

Annex 1: Table 1: Accessible sustainable wood yield per vegetation types per year (2000)
Province Closed forest
m3 Woodland m3
Bush land m3
Wooded grassland m3
Grassland m3
Farmland m3
Plantation land m3
Sub-total m3
Sub-total tonnes
Nairobi 264 - - - 91 4,510 2,600 7,470 5,230 Coast 7,070 156,696 752,427 55,781 1,420 1,003,764 57,923 2,035,090 1,424,563 N. Eastern - 67,431 1,102,818 168,204 2,500 - - 1,340,962 938,673 Eastern 8,270 71,671 541,852 154,650 3,340 3,732,953 92,679 4,605,419 3,223,793 Central 17,166 2,800 3,960 - - 1,283,307 173,472 1,480,714 1,036,500 R.Valley 40,026 108,294 783,660 412,719 1,590 4,389,870 607,414 6,343,572 4,440,500 Nyanza 297 1,400 7,630 - 29 1,552,448 7,310 1,569,136 1,098,395 Western 5,030 715 3,780 - 975,996 9,880 995,415 696,791 Total 78,143 409,022 3,196,141 79,135 8,979 12,942,85
6951,290 18,377,780 12,864,450
30

31
Annex 2: Table 2: Farm residue supply by province in tonnes per year (year 2000)
Province Maize Sorghum Wheat Millet Beans Rice Cassava Coconut Cashew nut
Coffee Tea Sisal Total availablefuel
Nairobi 4,750 - - - 537 - - - - 414 - - 5,172 Coast 36,962 190 - - 299 - 2,543 6 6 62 - 2,167 41,493 North Eastern
1,022 - - - - - - - - - - - 1,022
Eastern 148,897 26,987 159 21,704 21,918 - 1,853 - - 77,342 6,256 3,226 286,459 Central 58,092 151 1,696 - 8,689 791 98 - - 204,798 20,492 661 289,362 Rift Valley
685,497 3,720 39,570 3,425 19,713 - 518 - - 7,095 27,214 574 767,612
Nyanza 325,727 38,086 - 16,467 13,983 315 6,080 - - 13,720 6,280 979 408,394 Western 325,194 7,170 75 3,510 11,984 - 790 - - 6,457 650 373 344,218 Total 1,586,13
976,303 41,499 45,106 77,122 1,106 11,881 6 6 309,887 60,891 7,780 2,144,460