biology lab manual · through your experiment. o list three procedural errors in the experiment and...
TRANSCRIPT

Biology Lab Manual
Name: ___________________________________ Period: ________

Johnston High School Biology Lab Notebook
Table of Contents: 1. General Lab Template
2. Lab Report Grading Rubric
3. Sample Lab Report
4. Graphing Lab
5. Personal Experiment
6. Enzymes Lab
7. The Importance of Water
8. Cell Membranes - How Do Small Materials Enter Cells?
9. Osmosis - Elodea Lab
10. Respiration - Yeast Lab
11. Cell Division - Egg Lab
12. Heredity - Single Gene Inheritance Patterns
13. DNA – The Rules of DNA
14. Island evolution of the Gallotia lizards: A data analysis lab

Standard Lab Report Template Johnston High School Biology
Title:
• Write a descriptive title. Anyone who reads your title should be able to tell what your experiment is about.
Name, date and name of partner Introduction/Background Information:
• Include your preliminary observations as well as any background information about the subject.
• Address the specific questions presented with each individual lab for guidance. • Use your textbook as a source for this section.
Question/Problem:
• What question are you trying to answer? Hypothesis:
• Write a statement that says what you are testing and what you expect the outcome to be.
• Include reasoning behind why you think this will be the result. Variables:
• What is the independent variable? This is the variable that you are manipulating. • What is the dependent variable? This is the responding variable or what changes
during the experiment. You are measuring this. • What are your controlled variables? These are the variables that you will be
keeping constant throughout the experiment. Materials:
• List all items used in the lab. Experimental Design/Procedure:
• Write out in list form the steps you took to complete the experiment. • Your procedure should be written with enough detail so that anyone else could
repeat the experiment.
• Include any figures that may help your readers visualize what your experimental set-up may look like.
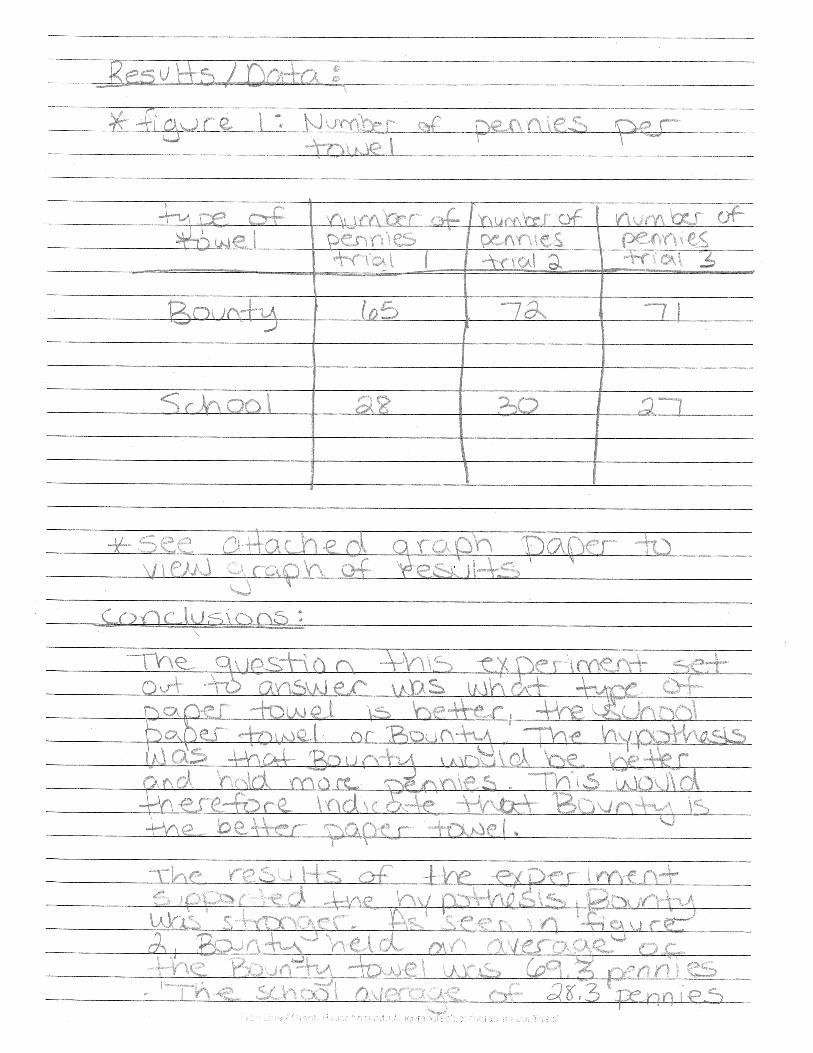
Results/Data:
• This is your data section where you include data tables and graphs of your data when applicable.
• All tables and graphs should be titled and labeled appropriately and include units of measurement.
• Graphs should be properly scaled with the dependant variable on the y-axis and the independent variable on the x-axis.
• Graphs should take up a whole page of graph paper so they are easy to read. • A caption should be included with any graphs that explain what the reader is
seeing in the graph (this is not where you analyze the graph!) Conclusions:
• Refer to each individual lab for specific questions to address in your lab report. • The minimum requirements for a conclusion include:
o Restate hypothesis and question and state whether hypothesis was supported by results or not.
o Infer or explain results by restating your data and giving logical explanations of these results. Draw conclusions based on the data obtained through your experiment.
o List three procedural errors in the experiment and how they could have affected the results. Describe what you would change if you did the experiment again.
Human errors are not the same as procedural errors. o Describe any experiments that are related to this experiment that may be
pursued in the future.


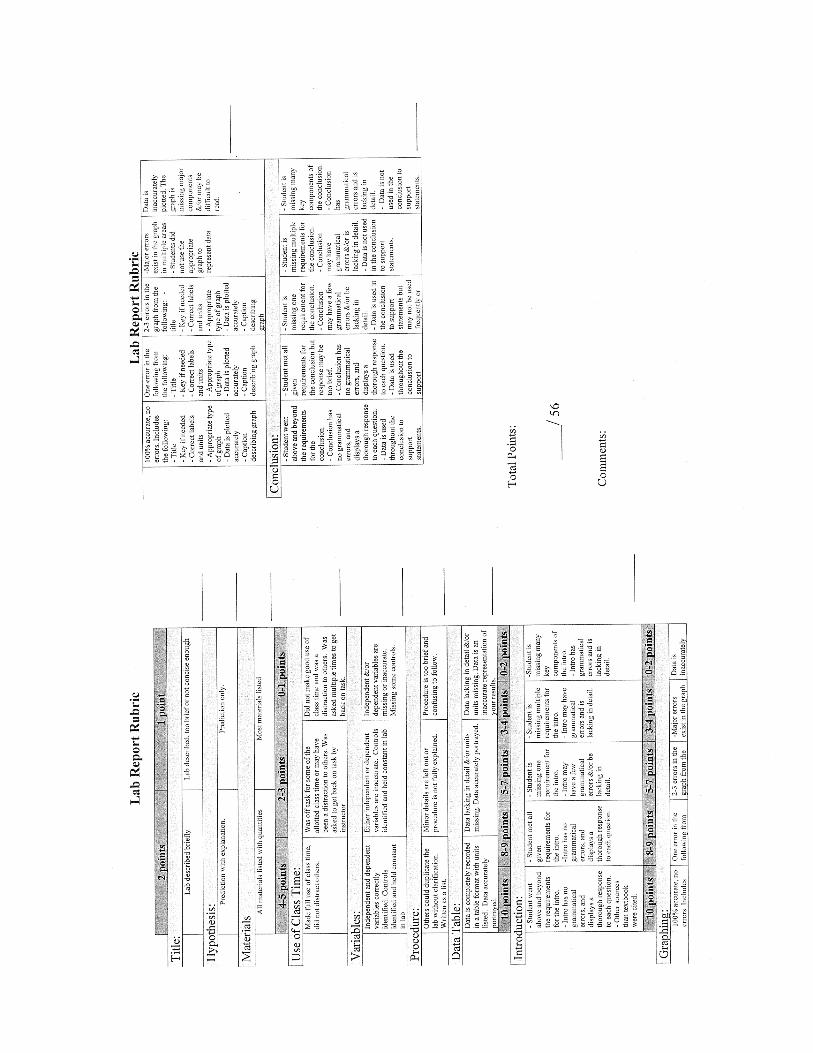
Lab Report Grading Rubric
2 points 1 point Title: Lab described briefly Lab described, too brief or not concise enough
Hypothesis: Prediction with explanation. Prediction only.
Materials All materials listed with quantities Most materials listed
4-5 points 2-3 points 0-1 points Use of Class Time: Made full use of class time,
did not distract others. Was off task for some of the allotted class time or may have been a distraction to others. Was asked to get back on task by instructor
Did not make good use of class time and was a distraction to others. Was asked multiple times to get back on task.
Variables: Independent and dependent
variables correctly identified. Controls identified and held constant in lab
Either independent or dependent variables are inaccurate. Controls identified and held constant in lab
Independent &/or dependent variables are missing or inaccurate. Missing some controls.
Procedure: Others could duplicate the
lab without clarification. Written as a list.
Minor details are left out or procedure is not fully explained.
Procedure is too brief and confusing to follow.
Data Table: Data is completely recorded
in a table format with units listed. Data accurately portrayed.
Data lacking in detail &/or units missing. Data accurately portrayed.
Data lacking in detail &/or units missing. Data is an inaccurate representation of your results.
10 points 8-9 points 5-7 points 3-4 points 0-2 points Introduction: - Student went
above and beyond the requirements for the intro. - Intro has no grammatical errors, and displays a thorough response to each question. - Other sources than textbook were cited.
- Student met all given requirements for the intro. -Intro has no grammatical errors, and displays a thorough response to each question.
- Student is missing one requirement for the intro. - Intro may have a few grammatical errors &/or be lacking in detail.
- Student is missing multiple requirements for the intro. - Intro may have grammatical errors and is lacking in detail.
-Student is missing many key components of the intro. - Intro has grammatical errors and is lacking in detail.

10 points 8-9 points 5-7 points 3-4 points 0-2 points Graphing: 100% accurate, no
errors. Includes the following: - Title - Key if needed - Correct labels and units - Appropriate type of graph - Data is plotted accurately - Caption describing graph
One error in the following from the following: - Title - Key if needed - Correct labels and units - Appropriate type of graph - Data is plotted accurately - Caption describing graph
2-3 errors in the graph from the following: - title - Key if needed - Correct labels and units - Appropriate type of graph - Data is plotted accurately - Caption describing graph
-Major errors exist in the graph in multiple areas - Students did not use the appropriate graph to represent data
Data is inaccurately plotted. The graph is missing major components &/or may be difficult to read.
Conclusion: - Student went
above and beyond the requirements for the conclusion. - Conclusion has no grammatical errors, and displays a thorough response to each question. - Data is used throughout the conclusion to support statements.
- Student met all given requirements for the conclusion but response may be too brief. - Conclusion has no grammatical errors, and displays a thorough response to each question. - Data is used throughout the conclusion to support statements.
- Student is missing one requirement for the conclusion. - Conclusion may have a few grammatical errors &/or be lacking in detail. - Data is used in the conclusion to support statements but may not be used frequently or appropriately.
- Student is missing multiple requirements for the conclusion. - Conclusion may have grammatical errors &/or is lacking in detail. - Data is not used in the conclusion to support statements.
- Student is missing many key components of the conclusion. - Conclusion has grammatical errors and is lacking in detail. - Data is not used in the conclusion to support statements.
SCORE
Total Points:
_____/ 56 Comments:

Graphing Lab
Using the materials in the room, you will need to collect three different sets of data that can be displayed by making the three types of graphs discussed in class. Each set of data will need to be displayed in a different type of graph.
Write the following information in your lab notebook. Responses should be in sentence format. Follow your lab report template and follow the towel lab for examples. Title of this lab Name, date and name of partner
Introduction/Background Information:
• Discuss the three different types of graphs discussed in class. o List the three types of graphs o Explain what type of data each graph is best at representing.
For each of the separate graphing types, write a mini lab on each that includes the following information. You will need to write all of the content listed below for each including the pie graph, the line graph and the bar graph.
Question/Problem:
• What question are you trying to answer in your experiment? Hypothesis:
• Write a statement that says what you expect the outcome to be. • Include reasoning behind why you think this will be the result.
Variables:
• What is the independent variable? This is the variable that you are manipulating.
• What is the dependent variable? This is the responding variable or what changes during the experiment. You are measuring this.
• What are your controlled variables? These are the variables that you will be keeping constant throughout the experiment.

Materials:
• List all items used in the lab. Experimental Design/Procedure:
• Write out in list form the steps you took to complete the experiment. • Your procedure should be written with enough detail so that anyone else could
repeat the experiment. • Include any figures that may help your readers visualize what your
experimental set-up may look like. Results/Data:
• This is your data section where you include data tables and graphs of your data when applicable.
• All tables and graphs should be titled and labeled appropriately and include units of measurement.
• A caption should be included with any graphs that explain what the reader is seeing in the graph (this is not where you analyze the graph!)
Conclusions:
Restate hypothesis and question and state whether hypothesis was supported by results or not.
Infer or explain results by restating the averages/data and giving logical explanations of these results. Draw conclusions based on the data obtained through your experiment.

Personal Experiment Planning Sheet Your task is to design an experiment to answer a personal question. You may choose any question you desire as long as you can:
1. Complete the experiment in under 1 week 2. Be able to collect numeric data that can be represented in a graph or chart. 3. Be able to come to a conclusion 4. Collect all materials on your own (unless Mrs. Burns specifically says she can
provide it)
1. What is your question? Be sure to word it in a complete sentence and be very specific.
a. Bad example: What food does Butters like best? b. Good example: Which type of food will Butters the fish eat first when
given the option: earth worms or fish pellets?
2. What is your hypothesis? What answer do you think will happen and why do you think this. This should be in complete sentences as well.
3. What is your independent variable? ______________________________ 4. What is your dependant variable?_______________________________
5. Do you have a control group? If so, what is it?
6. List your controlled variables:

Personal Experiment Lab Report
Title Name, date and name of partner Introduction/Background Information:
• What are controlled experiments and what importance do they serve in science?
• How many variables are tested at a time in a controlled experiment? Why? • Describe the main concept that you have decided to test in your personal
experiment.
Question/Problem: • Write the question that you are testing.
Hypothesis:
• What do you predict the result of you experiment will be? • Why do you predict this?
Materials Experimental Design/Procedure:
• Design an experiment to test your hypothesis. • List the steps that you went through to complete the experiment. • Include any necessary diagrams that may help the reader understand your lab
set-up. Results/Data:
• Organize your results in both a table and a graph. • Make sure to follow all of the guidelines in the lab report template for your
graphs. Conclusions:
• Reflect on how well you were able to control your experiment. o Were there any variables that you could not control in your experiment?
• Follow the guidelines in the lab report template for your conclusion.

Enzyme Lab
Title of Lab Name, date and name of partner Introduction/Background Information:
• What are enzymes? What function do they serve in living organisms? • Describe the structure of enzymes and how their structure relates to their
function (enzyme/substrate complex). • Discuss the importance of the enzyme catalase and its reactions in the body.
Include the equation for the reaction. • Discuss your initial observations of the enzyme catalase
Place a small piece of liver in the bottom of a test tube. Pour 2 ml of the 3% hydrogen peroxide solution into the test tube. Observe the bubbles. What gas is being released?
• Explain the difference between endothermic and exothermic reaction and tell which type of reaction the catalase reaction is
Question/Problem:
• What affect does changing catalase temperature have on reaction speed? Hypothesis:
• Write a statement that says what you are testing and what you expect the outcome to be.
• Include reasoning behind why you think this will be the result. .
Variables: • What is the independent variable? This is the variable that you are manipulating. • What is the dependent variable? This is the responding variable or what changes
during the experiment. You are measuring this. • What are your controlled variables? These are the variables that you will be
keeping constant throughout the experiment. Materials:
• List all items used in the lab.
Experimental Design/Procedure: • Write out in list form the steps you took to complete the experiment. • Set up an experiment to demonstrate what happens when the temperature of
catalase is altered. • You will need to determine a way to QUANTIFY your data…how will you graph the
rate of your reaction? • Your procedure should be written with enough detail so that anyone else could
repeat the experiment. • Include any figures that may help your readers visualize what your experimental
set-up may look like.
Results/Data: • You will need at least one data table and one graph for this report • All tables and graphs should be titled and labeled appropriately and include units
of measurement. • A caption should be included with any graphs that explain what the reader is
seeing in the graph (this is not where you analyze the graph!) Conclusions:
• What is the optimal temperature for catalase activity? Support your answer using the data in your experiment.
• Discuss what happens to enzymes when the temperature or pH of the environment that they are in changes and how your data supports this concept.
• Refer to the lab report template for guidance on writing the rest of your conclusion

The Importance of Water Title of Lab Name, date and name of partner Introduction/Background Information:
• Discuss the chemical structure of water and how this structure plays an important role in the functions of water in living systems.
• Determine one important function that water serves in living systems and discuss waters role in this process. Topic ideas are below:
o Water cycles and weather o Transpiration in plants o Turgor pressure in plants o Chemical reactions in solution o Capillary action o Effects water had on the cooling of the Earth
Question/Problem: • You will design an experiment to either demonstrate one of the important, water
related processes, or you will design an experiment to test a particular aspect of one of the above topics.
Hypothesis:
• Write a statement that says what you are testing and what you expect the outcome to be.
• Include reasoning behind why you think this will be the result. Variables:
• What is the independent variable? This is the variable that you are manipulating. • What is the dependent variable? This is the responding variable or what changes
during the experiment. You are measuring this. • What are your controlled variables? These are the variables that you will be
keeping constant throughout the experiment. Materials:
• List all items used in the lab.

Experimental Design/Procedure: • Write out in list form the steps you took to complete the experiment. • Include any figures that may help your readers visualize what your experimental
set-up may look like. Results/Data:
• Include data tables, graphs or photos to display the results of your experiment.. • All tables and graphs should be titled and labeled appropriately and include units
of measurement. • A caption should be included with any graphs that explain what the reader is
seeing in the graph (this is not where you analyze the graph!) Conclusions:
• Discuss what you learned from your experiment. • Infer or explain results by restating the trends in your data and giving logical
explanations of these results. Draw conclusions based on the data obtained through your experiment.


How do small materials enter cells?
In this lab you will observe the diffusion of a substance across a semi permeable membrane. Iodine is a known indicator for starch. An indicator is a substance that chances color in the presence of the substance it indicates. Since it is hard to experiment on actual cells, we will be using a plastic baggie as a model of the cell membrane. We will be using iodine and starch to represent small nutrients that the cell needs to let pass through the membrane. Pre-lab Observations: Describe what happened when iodine came into contact with starch. Title Name, date and name of partner Introduction/Background Information:
o Why is the cell membrane considered selectively permeable? o Why is it important that the cell membrane is selectively permeable? o What types of items need to pass in and out of the cell membrane for the cell to
be able to function and maintain the homeostasis of the cell? o Discuss what an indicator is and why starch is considered an indicator based on
your pre-lab observations. Question/Problem:
• What force causes small particles enter the cell membrane? • Your model object will be a plastic bag used to represent a cell membrane.
Variables:
• What is the independent variable? This is the variable that you are manipulating. • What is the dependent variable? This is the responding variable or what changes
during the experiment. You are measuring this. • What are your controlled variables? These are the variables that you will be
keeping constant throughout the experiment. Materials:
• List all items used in the lab.
Experimental Design/Procedure:
• Explain how we are going to be using plastic baggies and iodine in this experiment instead of real cells. What do each of these items represent in our experiment?
• How are we going to make use of starch in this experiment? • What are you going to do to determine if your baggie allows materials through it?
How will you measure this? • Write out your full procedure
Predictions: • If the baggie were permeable to starch, which way would the starch move in your
experiment? • If the baggie were permeable to iodine, which way would the iodine move in your
experiment? • If the baggie were permeable to iodine, what color would you expect the solution
in the baggie to turn? • If the baggie were permeable to starch, what color would you expect the solution
in the baggie to turn?
Results/Data: • Make a table to record your results. • Record the result of your lab after 30 minutes of processing. • Add a caption to your table explaining what your table is showing the reader.
Conclusions:
1. Based on your observations, which substance moved through the baggie membrane, the iodine or the starch?
2. How did you determine this? 3. The plastic baggie was permeable to which substance? 4. Is the plastic baggie selectively permeable? Please explain you answer. 5. FULLY explain the molecular process that caused the results of your experiment.
You can use your textbook to help research this answer. 6. Refer to the general lab report template to assist you in writing the rest of your
conclusion.

Elodea Lab
Some background information:
A new aquarist came to Petco and purchased a bunch of Elodea for his aquarium. Like many people, he did not bother researching about his new purchase before he bought it, and did not realize that Elodea is a freshwater plant. He proceeded to go home and place the lovely new plant in his saltwater aquarium.
Elodea is a pond plant that is found in fresh water. Observe your elodea under the microscope and draw a set of four cells with as many parts labeled as you can identify. Title Name, date and name of partner Introduction/Background Information:
• Summarize the above scenario. • Describe and diagram what an elodea cell looks like under normal, freshwater
conditions. • Draw a colored picture of four elodea cells in a cluster. • Label any parts of these cells that you can identify.
Question/Problem: • What happens to cells when they are placed in solutions/environments that vary
from their own? Hypothesis:
• Hypothesize what will happen to a cell that is well adapted to life in freshwater when it is placed into a saltwater environment.
• Draw your hypothesis of what would happen to the original freshwater elodea cells once you have placed them in salt water.

Experimental Design/Procedure: • Design an experiment to test your hypothesis. • I would like you to use a 40% saltwater solution to test your hypothesis. You will
need to make 40 ml of this solution. Show your calculations in your lab report.
Remember, concentration is a calculation of parts of solute per parts of solvent. Concentration is calculated in many ways, we will be using the Percent by Composition
Percent Composition by Mass (%) is the mass of the solute divided by the mass of the solution X 100. Example: Determine the percent composition by mass of a 100 ml salt solution which contains 20 g salt. Solution: 20 g NaCl / 100 ml solution x 100 = 20% NaCl solution
Results/Data: • Draw what you saw happen to your experimental cell. • Describe what you saw happen.
Conclusions:
• Use your textbook to research a complete explanation to your observations. Use what you know about the cell membrane, transport types and diffusion in your response.
• Explain what happens when a cell that is well adapted to fresh water is placed into a saltwater solution. Use data from your experiment to support your answer.
• Refer to the general lab repot template to assist you in writing the rest of your conclusion.
Extension Questions:
1. A tonoplast is a large central vacuole in plant cells. What benefits do tonoplasts serve in plants?
2. Why do your cells not have/need a tonoplast? 3. Is your cell in a hypertonic, isotonic or hypertonic situation? Explain. 4. Explain a situation where a cell is in a hypotonic situation and draw what would
happen to a cell in this type of situation. 5. Explain a situation where a cell is in an isotonic situation and draw what would
happen to a cell in this type of situation.

6. Some single celled animals called protists live in freshwater habitats. What adaptations might they need to help them survive in these environments?
7. Why are you told to gargle salt water when your throat is sore? 8. Why do people say to add salt to a leech to get it to release from your body? 9. Why do plants wilt?


Yeast Lab
A strange observation: My mom was making homemade bread. She added a tablespoon of this thing called yeast to the bread before baking it. I asked why, and she told me it made the bread rise, be more fluffy. I then asked how it did that, and she couldn’t tell me. “It just does”, my mom said. I wouldn’t take that for an answer. What is this thing called yeast? Why does it cause bread to rise? Does yeast only work with bread? I have so many questions! Helpful Information: Yeast cells perform respiration in their mitochondria just like all other eukaryotic cells that we have been studying. Title Name, date and name of partner Introduction/Background Information
• Explain what yeast is. • Explain the reactions that take place for yeast to get energy.
o Why does yeast release a gas during these reactions? What is this gas? • Explain what respiration is and what its purpose is. This should be a detailed response. • What are the three steps of respiration? • What is the purpose of each step? • What will you be testing in this experiment
Question/Problem:
• Which type of “food” gives yeast cells the highest productivity of energy production? Hypothesis:
• What type of food do you predict is the most productive for yeast? Why do you predict this?
Variables:
• What is the independent variable? This is the variable that you are manipulating. • What is the dependent variable? This is the responding variable or what changes
during the experiment. You are measuring this. • What are your controlled variables? These are the variables that you will be
keeping constant throughout the experiment.

Materials:
• List all items used in the lab. • Possible Materials:
Experimental Design/Procedure: • Design an experiment to test your hypothesis. • Write out in detail what you are going to do. How much are you going to
use, how long will it take, etc. o If you are using a liquid as your food source, use 1 tbsp of the liquid o If you are using a solid as your food source, take 1 tbsp of water
and mix 1 tsp of the solid into the water in a beaker and then pour this solution into your test tube
Topics to address in the procedure: 1. How are you going to measure yeast productivity? 2. What variables should you control to make this a fair experiment?
Results/Data:
• Record your results in a table and then graph your results. • Include a photo of your results with a caption describing each data set.
Conclusions: 1. After looking at your results do you support or reject your hypothesis? Use
your data to explain your reasoning. 2. Is your conclusion the definitive answer to the question presented at the
beginning of the lab? Explain. 3. How can you relate what you have found out in this lab to what occurs in the
human body? 4. Refer to the general lab report template to complete your conclusion.
4 test tubes Variety of food sources Water 4 balloons plastic baggie tape rulers
Graduated cylinder Spoon Beaker 1 tsp of yeast string any other item I may have in the room


Egg Lab: Limitations to Cell Size
It is often hard to perform lab experiments on living examples of organisms. For that reason, it is common to use an object to model the behaviors of living objects. In this lab, we will be using an egg as a model for a cell and dye as a model for nutrients that may be entering or leaving the cell. Title Name, date and name of partner Introduction/Background Information:
• Review from previous units why cells need to allow materials to enter and leave them as well as how these materials are able to enter and leave cells.
• Restate what the egg and dye are being used to model in this lab. • List the reasons we discussed in class as to why cells must divide and multiply in
order for an organism to increase in size instead of simply growing larger cells. • Explain what the surface area to volume ratio of a cell is and show a sample of
how to calculate surface area to volume ration of a cell. Question/Problem:
• Why is cell size limited by surface area to volume ratio of the cell?
Hypothesis: • Make a prediction about the problems that limiting surface area to volume
ratio has on a cell. Variables:
• What is the independent variable? This is the variable that you are manipulating. • What is the dependent variable? This is the responding variable or what changes
during the experiment. You are measuring this. • What are your controlled variables? These are the variables that you will be
keeping constant throughout the experiment. Materials:
• List all items used in the lab.

Experimental Design/Procedure:
• Remember, in this experiment, an egg is used to represent cells and dye is used to represent materials the cell needs to survive.
• Design an experiment to test the limitations that surface area to volume ratio presents cells when they are trying to obtain nutrients.
• You may want to look at the data table in the results section to help you brainstorm your procedure.
Results/Data:
• Complete this table using the results of the experiment that you set up. Copy this table into your lab write-up.
• Create two graphs from your data, these will be trend line graphs that show a general
trend line in the data (ask if you don’t know how) • One demonstrating the relationship of surface area to volume ratio as the y-
axis and cell size as the x-axis. o As cell gets larger, what happens the surface area to volume ratio?
• One demonstrating the relationship of diffusion percentage on the y-axis and cell size on the x-axis.
o As the surface area to volume ratio decreases, what happens to the percent diffusion into a cell?
Conclusions:
• Use your general lab report template for your conclusion. • Answer the following questions.
o As the amount of surface area per volume decreases, what happens to the rate of diffusion?
o As cells get larger, what happens to rate of diffusion?
“Cell” size
Surface Area Volume
Surface Area to Volume
Ratio Time (min)
Distance Diffused
Volume diffused
Percent Diffused
Large
Small

o Select two cell organelles and describe how their functions might be impaired if the cell were to become too large.
o In what way does this lab explain why organisms increase the number of cells that they have versus the size of their cells in order for the organism to grow larger. Use data from your lab to support your reasoning.


Heredity Lab – Single Gene Inheritance
In this lab you will be studying the inheritance patterns of known single gene characteristics to determine whether the trait is autosomal dominant or autosomal recessive. You will need to choose one characteristic from the list below that you wish to study.
• Hitchhiker thumb • Widow’s peak • Mid digital hair • Tongue rolling • Left or right interlocking fingers • Attached earlobes • PTC taste test • Chin fissure • Darwin tubercle • Short Big Toe • Freckles • Dimples
After choosing a specific characteristic to study you will need to collect data on the frequency of your trait in a test population. You will have two test populations that you will be collecting data from, your peers and your relatives. From this data you will be able to use Punnet squares and pedigrees to determine what inheritance pattern your trait follows. Title Name, date and name of partner Introduction/Background Information:
• Explain what the study of heredity is. • Discuss what genes are. Explain the interaction between dominant and recessive
forms of genes. • Describe the trait that you have chosen from the list above. • Explain how Punnet squares and pedigrees can be used to determine whether a
trait is dominant or recessive.

Question/Problem:
• Is your chosen trait autosomal dominant or autosomal recessive? Hypothesis:
• Which inheritance pattern do you think it will follow? • Why do you think this?
Experimental Design/Procedure:
• Describe the steps you will take to determine whether your trait is dominant or recessive.
• You must meet the following requirements: 1. You must collect data from as many peers as you can at school.
Determine whether they have, or do not have your trait. 2. Do your best to create a family pedigree showing the inheritance
patterns of your trait in your family. Try to go as far back in your ancestry as you can (hopefully your grandparents) as well as aunts, uncles and cousins. (this may involve some phone calls).
Results/Data:
• Create a table to organize your peer data. • Make a graph of this data. • Create a pedigree based on your family history of the trait.
Conclusions:
• Do you accept or reject your initial hypothesis? Use specific data from your lab to explain your reasoning.
• Use Punnet squares to demonstrate why your results support your conclusion. o If you can not come to a conclusion, use Punnet squares to predict what
your expected data should look like • Analyze your family pedigree and explain the trends you can see.
o Explain how your family tree results support your conclusion • Follow the general lab template to complete your conclusion.


DNA Lab: The rules of DNA
DNA is an amazing molecule. Within its molecular structure are the instructions to build you as well as make you function. The discovery of DNA’s structure is a fairly recent endeavor in biology. Before scientists were able to see DNA, they started making detailed observations on the chemical components of DNA. Many scientists contributed to this research including Griggith, Avery, Chase, Chargaff, Franklin, Watson and Crick. One of the first methods these scientists used to study DNA was to break down the molecular structure and analyze the compounds and elements that build the DNA structure. From this analysis of compounds, they were able to determine some basic rules about the structure of DNA without visually observing it. In this lab you will have a chance to analyze the molecular contents of DNA and draw some conclusions about the structure of DNA by formulating your own Rules of DNA. This lab is a simulation lab. To determine the basic compounds that DNA molecules are we have broken down a DNA molecule into its subunits. You will be given a beaker that contains a mixture of the subunits of DNA. You will need to collect data on the contents of the beaker and draw conclusions about the basic rules about the structure of DNA. Title Name, date and name of partner Introduction/Background Information:
• Explain the function of DNA in cells. • Discuss the location of DNA in cells and the two different forms that DNA
can be in your cells.
Question/Problem: • What basic set of structural rules does DNA follow?
Hypothesis:
• Make a prediction about some structural rules that DNA may follow based on your prior knowledge of DNA structure.
Experimental Design/Procedure:
• Describe the process that you went through to analyze the contents of your beaker.
Results/Data:
• Create a data table or table(s) to organize your observations of the beaker contents.
• Formulate one graph of your data. Conclusions:
• Analyze your data and discuss any general trends that you are seeing in your graph.
• Use your data to determine a list of general structural rules that DNA follows. • Describe why the structure of DNA is considered a double helix and how your
data supports this description of its structure. • Describe the difference between purines and pyrimidines in the structure of
DNA. • Summarize the contributions of the following scientists to the discovery of
DNA’s structure. o Griffith o Chargaff o Avery and Chase o Franklin o Watson and Crick


Island evolution of the Gallotia lizards: A data analysis lab
Ever since Charles Darwin formulated his hypothesis on how the finches of the Galapagos Islands evolved into 13 different species, islands have been a prime target for the study of evolution. By their very nature, islands are isolated and are essentially a living laboratory of evolution. The Canary Islands form an archipelago of 7 volcanic islands just west of the African continent. Geologists theorize that a geologic “hot spot” of upwelling magma has been drifting westward for the past 20 million years, gradually forming the islands as it moves. Thus the MOST EASTERN island, LANZAROTE, is the oldest, while the smaller western island, HIERRO, is the youngest (about 0.8 million years old). Volcanic islands are particularly good laboratories for evolutionary science because they can be dated accurately using radioactive isotope decay and because they start out as lifeless masses of rock emerging from the sea. The development of ecosystems on volcanic islands is somewhat unpredictable. What plant and animal species will colonize this new environment? Much depends on climate, closeness to other land masses, and chance. This investigation deals with 3 species of closely related lizards from the genus Gallotia. Their species names are Gallotia atlantica, Gallotia stehlini and Gallotia galloti. The species Gallotia galloti has 4 subspecies that live on separate islands in the island chain. The arrival of the Gallotia lizards was probably by RAFTING. Rafts of natural vegetation are often washed out to sea when high river levels cause river banks to collapse, carrying away both plants and clinging animals. Oceanic currents in this region vary with the seasons. Colonization by airborne organisms, such as insects and birds, usually occurs during storms. In any case, there are some general principles of island colonization:
1. The closer the island to another land mass, the higher the probability of colonization 2. The older the island, the more likely it will be colonized 3. The larger the island, the more species are likely to be established 4. Geographic isolation reduces gene flow between populations (Populations that are
separated by some geographic feature (Ex: water) can’t exchange DNA as easily) 5. Over time, colonial populations become genetically different from their parent populations
due to natural selection and other evolutionary processes. Task: In this activity, you will be looking at data that has already been collected from other researcher’s experiments and analyzing their data to determine evolutionary relationships between six populations of lizards. This is REAL DATA from REAL POPULATIONS that live on various islands in the Canary Archipelago. Data will include: 1) lizard morphology (body form) 2) geological age estimates of the islands 3) geographic distances of the islands from the mainland 4) genetic differences (DNA sequences) between the lizard populations With this information you will create a cladogram to show how the lizards of each island are evolutionarily related.

Title Name, date and name of partner Introduction/Background Information
• Explain the theory of evolution by natural selection. • Explain how Darwin used the information from the Galapagos Tortoises to
form his ideas on evolution. • Explain why islands are excellent locations to study evolutionary processes. • Explain what a cladogram is and how they are used to show the ancestral
history of organisms. Question/Problem: What colonization pattern did the Gallotia lizards follow when populating the Canary Islands? What is the evolutionary relationship between the lizards of the Canary Islands?
Hypothesis:
• Refer to the map of the Canary Islands on your data sheet. Based on the image, make a prediction about the colonization pattern the lizards followed using arrows to show your prediction. Clip out this map and paste it into your hypothesis section. Explain your prediction.
• Use that information to create a cladogram to show which lizards were most closely related to their African common ancestor.
Variables: • Since you will be analyzing data collected by others in this lab, you will not need a
variables section. Materials:
• Since you will be analyzing data collected by others in this lab, you will not need a materials section.
Experimental Design/Procedure:
• Look at the data sheet that is included for this lab. Use the information presented within these data sets to determine a procedure that the scientists may have used to collect this data.
• List their procedures in this section. Results/Data:
• Clip out figures 2-5 that are given to you on the data sheet and paste them into your data section along with any analysis sections included in the data sheet.
• Below each graph, draw a cladogram that shows your prediction of the evolutionary relationship of the six lizard populations based on the data in each figure.
• Include a final cladogram that combines the 4 sources of data into one representative cladogram. Include a description of the thought process you went through to create your final cladogram.
Conclusions:
5. After looking at your results do you support or reject your original
hypothesis? Use your data to explain your reasoning. 6. Explain the process you used to compile your four data sets to come to one
final conclusion. 7. How did multiple forms of data help to generate your results (as opposed to
one set of data) ? 8. Is your conclusion the definitive answer to the question presented at the
beginning of the lab? Explain. 9. Refer to the general lab report template and the questions that accompany
the data to complete the conclusion.
Lab based off of an activity from: ISLAND BIOGEOGRAPHY AND EVOLUTION: SOLVING A PHYLOGENETIC PUZZLE USING MOLECULAR GENETICS by RP Filson www.ucmp.berkeley.edu/fosrec/Filson.html

Island Evolution Data Sheet Use this sheet to guide your investigation. These pages will be used as the data and data analysis section of your lab write-up. You will need to cut and paste these figures and their analysis out and place them into your lab report. Figure 1:
Figure 1 Data Analysis: Use the map above to measure the distances in kilometers of each island to the mainland (Africa).
Distance from LANZAROTE to mainland = _______________ Distance from FUERTEVENTURA to mainland = ____________ Distance from GRAN CANARIA to mainland = _____________ Distance from TENERIFE to mainland = _______________ Distance from GOMERA to mainland = _______________ Distance from HIERRO to mainland = ________________ Distance from PALMA to mainland = ________________
Figure 1: Map of the Canary Islands off the coast of Africa
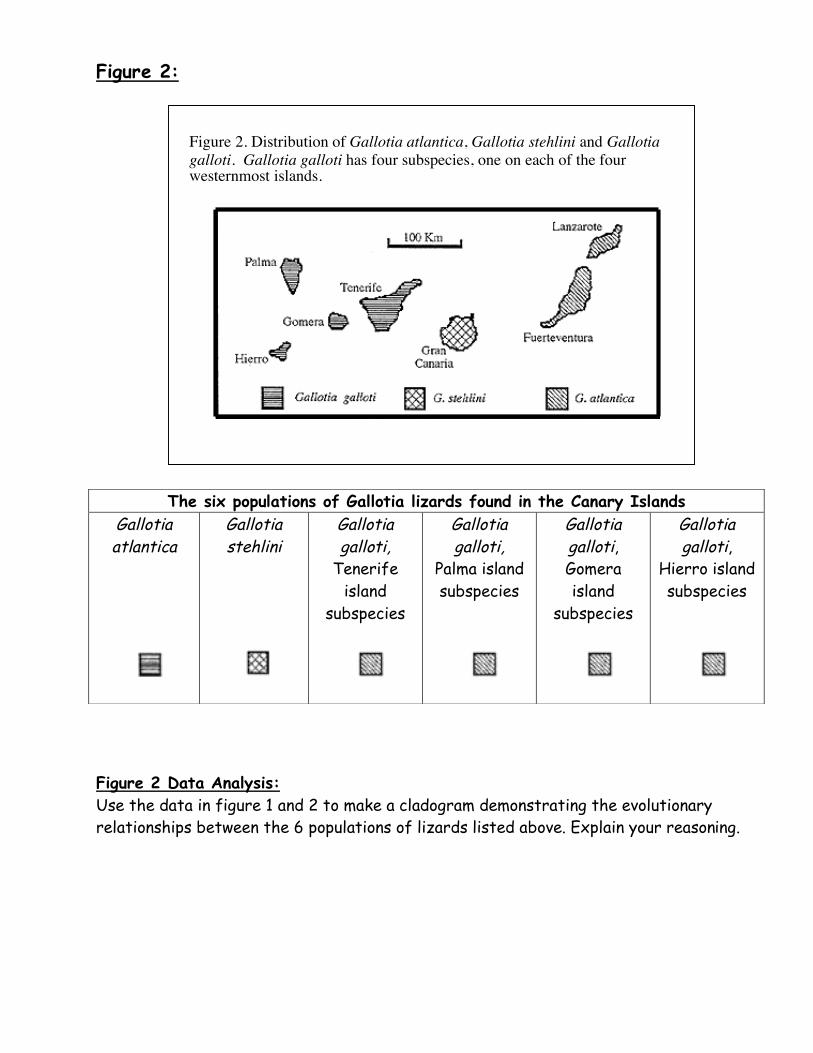
Figure 2:
Figure 2 Data Analysis: Use the data in figure 1 and 2 to make a cladogram demonstrating the evolutionary relationships between the 6 populations of lizards listed above. Explain your reasoning.
The six populations of Gallotia lizards found in the Canary Islands Gallotia atlantica
Gallotia stehlini
Gallotia galloti,
Tenerife island
subspecies
Gallotia galloti,
Palma island subspecies
Gallotia galloti, Gomera island
subspecies
Gallotia galloti,
Hierro island subspecies
Figure 2. Distribution of Gallotia atlantica, Gallotia stehlini and Gallotia galloti. Gallotia galloti has four subspecies, one on each of the four westernmost islands.

Figure 3: The maximum age of each island was estimated by sampling volcanic rocks found on all islands using potassium-argon dating. Figure 3. Maximum age of the Canary Islands in millions of years. (Anguita et al., 1986)
Lanzarote & Fuerteventura Gran Canaria Tenerife Gomera Palma Hierro
24.0 17.1 15.1 5.3 2.0 0.8
Figure 3 Analysis:
Use the data in figure 3 to make a cladogram demonstrating the evolutionary relationships between the 6 populations of lizards. Explain your reasoning.
Figure 4:
To be sure differences were genetic, and not environmental, researchers collected individuals from all island populations and bred and raised them in captivity. Their offspring still displayed differences according to their parental characteristics
Figure 4. The relative sizes of typical Gallotia lizards from each population are shown. (Thorpe et al 1994)
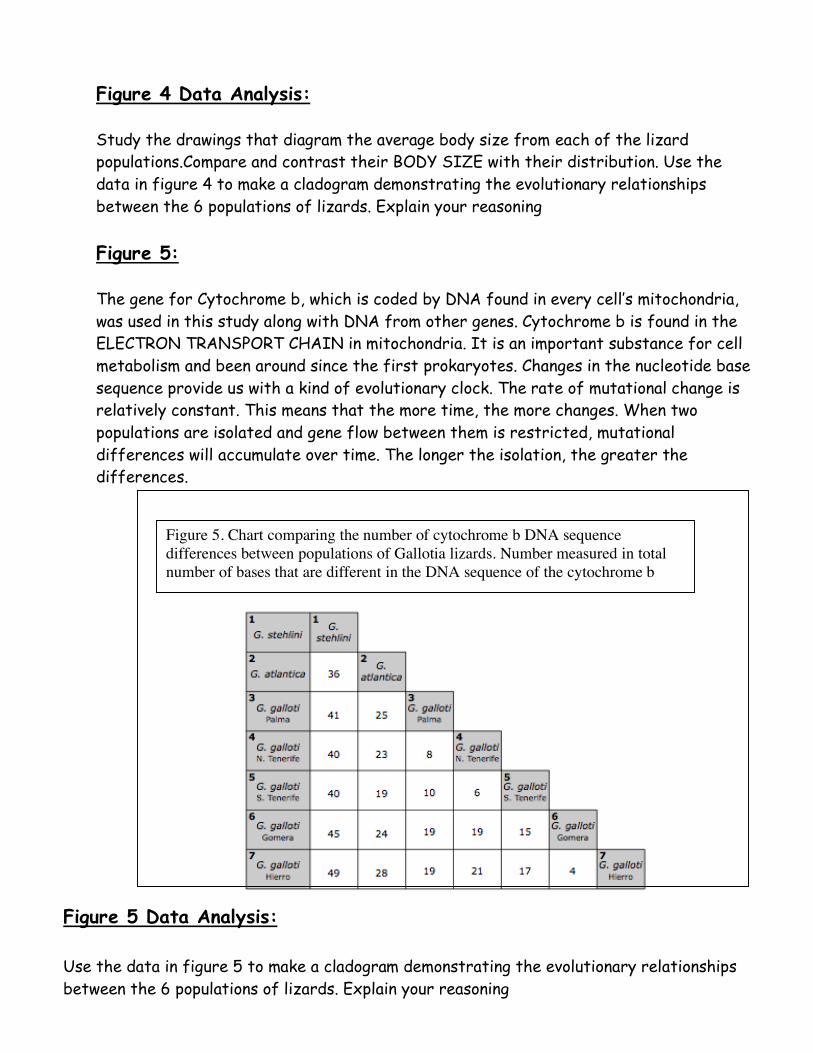
Figure 4 Data Analysis: Study the drawings that diagram the average body size from each of the lizard populations.Compare and contrast their BODY SIZE with their distribution. Use the data in figure 4 to make a cladogram demonstrating the evolutionary relationships between the 6 populations of lizards. Explain your reasoning Figure 5: The gene for Cytochrome b, which is coded by DNA found in every cell’s mitochondria, was used in this study along with DNA from other genes. Cytochrome b is found in the ELECTRON TRANSPORT CHAIN in mitochondria. It is an important substance for cell metabolism and been around since the first prokaryotes. Changes in the nucleotide base sequence provide us with a kind of evolutionary clock. The rate of mutational change is relatively constant. This means that the more time, the more changes. When two populations are isolated and gene flow between them is restricted, mutational differences will accumulate over time. The longer the isolation, the greater the differences.
Figure 5. Chart comparing the number of cytochrome b DNA sequence differences between populations of Gallotia lizards. Number measured in total number of bases that are different in the DNA sequence of the cytochrome b gene..
Figure 5 Data Analysis: Use the data in figure 5 to make a cladogram demonstrating the evolutionary relationships between the 6 populations of lizards. Explain your reasoning
