biological hydrogen production on acetate in continuous panel
TRANSCRIPT

BIOLOGICAL HYDROGEN PRODUCTION ON ACETATE IN CONTINUOUS PANEL PHOTOBIOREACTORS USING RHODOBACTER
CAPSULATUS
A THESIS SUBMITTED TO THE GRADUATE SCHOOL OF NATURAL AND APPLIED SCIENCE
OF MIDDLE EAST TECHNICAL UNIVERSITY
BY
DOMINIC DEO ANDROGA
IN PARTIAL FULFILLMENT OF THE REQUIREMENTS
FOR
THE DEGREE OF MASTER OF SCIENCE
IN
CHEMICAL ENGINEERING
JULY 2009

Approval of the thesis:
BIOLOGICAL HYDROGEN PRODUCTION ON ACETATE IN
CONTINUOUS PANEL PHOTOBIOREACTORS USING RHODOBACTER CAPSULATUS
submitted by DOMINIC DEO ANDROGA in partial fulfillment of the requirements for the degree of Master of Science in Chemical Engineering Department, Middle East Technical University by,
Prof. Dr. Canan Özgen _____________________ Dean, Graduate School of Natural and Applied Sciences Prof. Dr. Gürkan Karakaş _____________________ Head of Department, Chemical Engineering Prof. Dr. İnci Eroğlu _____________________ Supervisor, Chemical Engineering Dept., METU
Examining Committee Members: Prof. Dr. Hayrettin Yücel ______________________ Chemical Engineering Dept., METU Prof. Dr. İnci Eroğlu ______________________ Supervisor, Chemical Engineering Dept., METU Prof. Dr. Ufuk Bakır ______________________ Chemical Engineering Dept., METU Prof.Dr. Meral Yücel ______________________ Biology Department, METU Dr. Gökhan Kars ______________________ Biology Department, Selçuk University Date: 31st July, 2009
iii
I hereby declare that all information in this document has been obtained and presented in accordance with academic rules and ethical conduct. I also declare that, as required by these rules and conduct, I have fully cited and referenced all material and results that are not original to this work.
Name, Last name: Dominic Deo ANDROGA
Signature:

iv
ABSTRACT
BIOLOGICAL HYDROGEN PRODUCTION ON ACETATE IN
CONTINUOUS PANEL PHOTOBIOREACTORS USING RHODOBACTER CAPSULATUS
Androga, Dominic Deo
M.Sc., Department of Chemical Engineering
Supervisor: Prof. Dr. İnci Eroğlu
July 2009, 189 pages
Photobiological hydrogen production from organic acids occurs in the
presence of light and under anaerobic conditions. Stable and optimized
operation of the photobioreactors is the most challenging task in the
photofermentation process. The main aim of this study was to achieve in long
term, a stable and high hydrogen production on acetate, using the
photosynthetic bacteria Rhodobacter capsulatus in continuous panel
photobioreactors.
Rhodobacter capsulatus (DSM 1710), heat adapted Rhodobacter
capsulatus (DSM 1710) and Rhodobacter capsulatus YO3 (Hup-), a mutant
strain, were tested in outdoor conditions, under natural sunlight in Ankara,
Turkey. The experiments were carried out between September-December,
2008. Defined culture medium containing acetate (40 mM) and glutamate (2
mM) and a dilution rate of 0.8 l/ day were used. Steady hydrogen production
(0.4 mmol H2/lc.h) was obtained using the Rhodobacter capsulatus YO3 (Hup-)

v
mutant strain that was continuously operated for 69 days, but the cell
concentration could not be kept at a steady value.
Further efforts were focused on achieving stable biomass concentration
besides stable hydrogen production in continuous operation. The feed
composition was optimized in indoor experiments, under controlled
temperature and continuous illumination. Stable biomass (0.40 gdcw/lc) and the
highest hydrogen productivity (0.8 mmol H2/lc.h) were achieved using the feed
media containing 40 mM acetate and 4 mM glutamate with a 10% (v/v) feed
rate.
Moreover, the EU project HYVOLUTION aims to combine dark
fermentation and photo fermentation process for the conversion of biomass to
hydrogen. Effluents from the dark fementation contain high amount of
ammonium, which inhibits phototrophic hydrogen production. After treatment
it has been concluded that Gördes clinoptilolite zeolite effectively removes
ammonium ion from the dark fermenter effluent of molasses.
Keywords: R. capsulatus, hydrogen, acetate, photobioreactor, clinoptilolite

vi
ÖZ
SÜREKLI PANEL FOTOBİYOREAKTÖRLERDE FOTOSENTETİK RHODOBACTER CAPSULATUS BAKTERİSİ KULLANARAK
ASETATTAN HİDROJEN ÜRETİMİ
Dominic Deo Androga
Yüksek Lisans, Kimya Mühendisliği Bölümü
Tez Yöneticisi: Prof. Dr. İnci Eroğlu
Temmuz 2009, 189 sayfa
Işık varlığında ve oksijensiz şartlarda organik asitten fotobiyolojik
hidrojen üretimi gerçekleşir. Fotobiyoreaktörlerde sabit ve optime üretim
fotofermantasyon süreçlerindeki en zorlayıcı görevdir. Bu çalışmanın asıl
amacı sürekli panel fotobiyoreaktörlerde fotosentetik Rhodobacter capsulatus
bakterisi kullanarak asetattan uzun vadeli, sabit ve yüksek hidrojen üretimini
elde etmektir.
Türkiye Ankara’da, güneş ışığı altında açık havada Rhodobacter
capsulatus (DSM 1710), ısıl uyarlanmış Rhodobacter capsulatus (DSM 1710)
ve mutant Rhodobacter capsulatus YO3 (Hup-) test edildi. Bu deneyler Eylül-
Aralık 2008 tarihleri arasında yapıldı. Seyreltme hızı 0.8 l/gün olan ve asetat
(40 mM) ve glutamat (2 mM) içeren tanımlanmış kültür ortamı kullanıldı. 69
gün boyunca sürekli çalıştırılan panel fotobiyoreaktörde mutant Rhodobacter
capsulatus (Hup-) kullanıldığında 0.4 mmol H2/lc.h sabit hidrojen üretimi elde
edildi fakat düzgün olmayan biyokütle büyümesi gözlendi.

vii
Daha fazla çaba sürekli üretimde sabit hidrojen üretiminin yanısıra sabit
biyokütle konsantrasyonunu elde etmek için odaklandı. Bu amaca ulaşmak
için, sıcaklığı control edilen ve sürekli aydınlatılan kapalı alan deneylerinde
besleme bileşimi optimize edildi. Sabit biyokütle (0.40 gdcw/ lc) ve en yüksek
hidrojen üretimi (0.8 mmol H2/lc.h) 40 mM asetat ve 4 mM glutamat içeren
besleme ortamı kullanıldığında elde edildi.
Ayrıca EU HYVOLUTION projesinin asıl amacı biyokütlenin
hidrojene çevrimi için ışıklı ve ışıksız fermantasyon süreçlerinin
birleştirilmesidir. Işıksız fermantasyonun çıkış sıvısında yüksek miktarda
bulunan amonyum fototrofik hidrojen üretimini engeller. Yapılan amonyum
iyonlarını azaltma deneylerınden sonra Gördes klinoptilolit zeolitinin melas
ışıksız fermentor çıkış sıvısındaki amonyum iyonlarını etkili bir şekilde
ayırdığı sonucuna varıldı.
Anahtar Kelimeler: R. capsulatus, hidrojen, asetat, fotobioreaktör,
klinoptilolit

viii
To My Family
ix
ACKNOWLEDGEMENTS
First and foremost, I would like to express my sincere gratitude to my
supervisor, Prof. Dr. İnci Eroğlu for her endless guidance, advice and support
throughout this research. I would also like to thank Prof. Dr. Meral Yücel and
Prof. Dr. Ufuk Gündüz for their contribution to this study through their ideas
and suggestions.
I also thank Dr. Ebru Özgür, Dr. Başar Uyar, Dr. Yavuz Öztürk and Dr.
Gökhan Kars for their support and considerable contribution to my study
through their suggestions and recommendations.
I am grateful to my labmates S.Gökçe Avcıoğlu, Nilüfer Afşar, Kamal
Elkahlout, Pelin Sevinç, Muazzez Gürgan, Begüm Peksel, Efe Boran, Endam
Özkan and Emrah Sağır for their friendship, collaboration and unending
assistance. I greatly appreciate the discussions, suggestions and help you gave
in carrying out some of the procedures.
I acknowledge Gülten Orakçı for her help with the HPLC analyses and
Kerime Güney for the clinoptilolite zeolite chemical analysis at the Chemical
Engineering Department. I also thank Prof. Dr. Hayrettin Yücel for giving
samples of Gördes clinoptilolite zeolite for the ammonium ion reduction study.
I greatly appreciate Ahmad Bahaalddin’s help with the clinoptilolite zeolite
experiments too.
Lastly, I sincerely thank my family for their invaluable support and
love. I especially thank my parents for their love, encouragement and trust in
me. I am grateful to my friends Mustafa Yalın, Deniz Barer and Bahram Lotfi
Sadigh for their help and moral support.
This research study was supported by METU with project BAP No:
2006-07-020001, BAP No: 07-02-2009-0001 and the EU 6th Framework
Integrated Project 019825 (HYVOLUTION).

x
TABLE OF CONTENTS
ABSTRACT……..…………………………………..……...……….………...iv
ÖZ……………………………….…….…..…………...…….………..…....….vi
ACKNOWLEDGEMENTS………………..…….…..……....……….……….ix
TABLE OF CONTENTS…………….…………..……...……..….…...………x
LIST OF TABLES………………………………….....………..……….…...xvi
LIST OF FIGURES……….……………….…………….……..……...……..xix
LIST OF SYMBOLS AND ABBREVIATIONS………….…..………….....xxv
CHAPTERS
1. INTRODUCTION ........................................................................................... 1
2. LITERATURE SURVEY ............................................................................... 6
2.1 Hydrogen ....................................................................................................... 6
2.1.1 Properties and Uses of Hydrogen ........................................................ 6
2.1.2 Hydrogen Production Processes .......................................................... 7
2.2 Biological Hydrogen Production ................................................................... 9
2.2.1 Biophotolysis ....................................................................................... 9
2.2.2 Dark Fermentation ............................................................................. 10
2.2.3 Photofermentation ............................................................................. 10
2.2.4 Integrated Systems ............................................................................ 11
2.3 General Characteristics of Rhodobacter capsulatus ................................... 13
2.4 Overview of the Hydrogen Production Metabolism ................................... 15
2.4.1 The Hydrogen Production Mechanism ............................................. 16
2.4.2 Enzyme Systems ............................................................................... 18
2.4.2.1 Nitrogenase ................................................................................ 18

xi
2.4.2.2 Hydrogenase .............................................................................. 19 2.4.3 By-products ....................................................................................... 20
2.5 Acetate as a Substrate .................................................................................. 21
2.6 Photobioreactors .......................................................................................... 24
2.6.1 Types of Photobioreactors ................................................................. 24
2.6.2 Materials of Construction .................................................................. 27
2.7 Ammonium Ion Removal Using Clinoptilolite Zeolite ............................... 28
2.8 Objectives of This Study ............................................................................. 30
3. MATERIALS AND METHODS .................................................................. 32
3.1 The Microorganisms .................................................................................... 32
3.2 Culture Media .............................................................................................. 32
3.3 Experimental Setup for Hydrogen Production ............................................ 34
3.4 Experimental Procedure .............................................................................. 38
3.4.1 Preparation of the Bacterial Inoculum .............................................. 38
3.4.2 Leakage Test, Cleaning and Sterilization of the Photobioreactors ... 39
3.4.3 The Startup Procedure ....................................................................... 39
3.4.4 Operation ........................................................................................... 39
3.4.5 Shutdown ........................................................................................... 40
3.5 Analyses ...................................................................................................... 40
3.5.1 Cell Concentration ............................................................................. 40
3.5.2 pH Analysis ....................................................................................... 40
3.5.3 Temperature Measurement ................................................................ 41
3.5.4 Light Intensity Measurement ............................................................ 41
3.5.5 Gas Composition Measurement ........................................................ 41
3.5.6 Organic Acid Analysis ...................................................................... 41
3.5.7 Glutamic Acid Analysis .................................................................... 42
3.5.8 Bacteriochlorophyll a Measurement ................................................. 43
3.6 Biomass Recycle ......................................................................................... 44

xii
3.6.1 The Biomass Recycle Procedure ....................................................... 44
3.6.2 Determination of the Amount of Biomass Recycle .......................... 44
3.7 Ammonium Ion Removal ............................................................................ 45
3.7.1 Gördes Clinoptilolite Batch Pre-treatment ........................................ 45
3.7.2 Dark Fermenter Effluent Ammonium Ion Removal ......................... 45
3.7.3 Total Nitrogen Measurement ............................................................ 46
4. RESULTS AND DISCUSSIONS ................................................................. 48
4.1 Hydrogen Production in Outdoor Continuous Panel Photobioreactors
with Different R. capsulatus Strains ....................................................... ….48
4.1.1 Continuous Panel Photobioreactor with R. capsulatus
(DSM 1710)………………………………………………………………49
4.1.2 Continuous Panel Photobioreactor with Heat Adapted R. capsulatus (DSM 1710) ................................................................................................ 54
4.1.3 Continuous Panel Photobioreactor with R. capsulatus YO3 (Hup-)……………………………………………………………………..58
4.2 Comparison of the Outdoor Experiments Results ....................................... 63
4.2.1 Hydrogen Productivity ...................................................................... 63
4.2.2 Substrate Conversion Efficiency (Yield) .......................................... 65
4.2.3 Acetate Conversion ........................................................................... 66
4.3 Effect of Feed Composition on Long Term Hydrogen Production ............. 69
4.3.1 Feed Composition: 40 mM Acetate and 2 mM Glutamate ............... 69
4.3.2 Feed Composition: 40mM Acetate and 2 mM Glutamate with Biomass Recycle ........................................................................................ 73
4.3.3 Feed Composition: 40 mM Acetate and 3-4 mM Glutamate ............ 76
4.3.4 Feed Composition: 60 mM Acetate and 3- 4 mM Glutamate ........... 79
4.3.5 Feed Composition: 80 mM Acetate and 4 mM Glutamate ............... 82
4.4 Long Term Stability of Biomass ................................................................. 85
4.4.1 Effect of Biomass Recycle ................................................................ 85

xiii
4.4.2 Effect of Increasing Glutamate Concentration in the Feed keeping Acetate Concentration Constant ................................................................. 88
4.4.3 Effect of Increasing Acetate Concentration in the Feed keeping Glutamate Concentration Constant ............................................................ 89
4.5 Evaluation of the Results ............................................................................. 90
4.5.1 Effect of the C/N Ratio ...................................................................... 90
4.5.2 Light Conversion Efficiencies in the Indoor Continuous Photobioreactors ......................................................................................... 95
4.5.3 Comparison of Batch and Continuous Photobioreactors .................. 96
4.6 Ammonium Ion Removal ............................................................................ 99
4.6.1 Gördes Clinoptilolite Batch Pre-treatment ........................................ 99
4.6.2 Dark Fermenter Effluent of Sugar-Beet Thick Juice Molasses Ammonium Ion Reduction ....................................................................... 100
4.6.3 Total Nitrogen Measurement .......................................................... 100
5. MODELING ................................................................................................ 102
5.1 Cell Growth ............................................................................................... 102
5.2 The Logistic Growth Model ...................................................................... 103
5.3 Discussion ................................................................................................. 108
6. CONCLUSIONS AND RECOMMENDATIONS ...................................... 109
6.1 Conclusions ............................................................................................... 109
6.2 Recommendations ..................................................................................... 110
REFERENCES ................................................................................................ 112
APPENDICES
A. COMPOSITION OF THE FEED MEDIUM ............................................. 130
B. DETERMINATION OF THE ACETATE AND GLUTAMATE CONCENTRATION IN THE GROWTH MEDIUM ..................................... 132
C. OPTICAL DENSITY-DRY WEIGHT CALIBRATION CURVES .......... 135
D. Rhodobacter capsulatus LIGHT ABSORBTION SPECTRA ................... 137
E. SAMPLE GAS CHROMATOGRAM ........................................................ 138

xiv
F. ORGANIC ACID ANALYSIS ................................................................... 139
F1. Sample organic acid HPLC chromatogram ....................................... 139
F2. Sample Acetic Acid HPLC Calibration Curve .................................. 140
G. GLUTAMIC ACID ANALYSIS ............................................................... 141
G1. PITC (Phenyl Isothiocyanate) Derivatization Reaction .................... 141
G2. HPLC operation conditions ............................................................... 141
G3. PITC Derivatization and HPLC Analysis Chemical Compositions .. 142
G4. Sample Glutamic Acid Measurement HPLC Chromatogram ........... 143
G5. Sample Glutamic Acid HPLC Calibration Curve ............................. 144
H. DETERMINATION OF BACTERIOCHLOROPHYLL a CONTENT .... 145
I. SAMPLE CALCULATIONS FOR HYDROGEN PRODUCTION ........... 146
I1. Hydrogen Productivity ........................................................................ 146
I1.1 Volumetric Productivity .............................................................. 146
I1.2 Molar Productivity ...................................................................... 147
I2. Substrate Conversion Efficiency (Yield) ............................................ 149
I3. Acetate Conversion ............................................................................. 149
I4. Light Conversion Efficiency ............................................................... 150
J. CHEMICAL COMPOSITION AND SEM OF THE ORIGINAL GÖRDES CLINOPTILOLITE ......................................................................................... 151
K. DARK FERMENTER EFFLUENT OF SUGAR-BEET THICK JUICE MOLASSES .................................................................................................... 153
K1. Composition of the DFE of Sugar-Beet Thick Juice Molasses ......... 153
K2. Ammonium Ion Electrode Calibration Curve ................................... 153
L. PRELIMINARY STUDY ON THE USE OF PHOTOBIOREACTOR EFFLUENT AS FERTILIZER ....................................................................... 154
M. NATURAL ADAPTATION OF R. capsulatus in OUTDOOR CONDITIONS ................................................................................................. 156
N. QUANTITATIVE ANALYSIS OF PHB USING GAS CHROMATOGRAPHY .................................................................................. 157

xv
O. EXPERIMENTAL DATA ......................................................................... 161

xvi
LIST OF TABLES Table 2.1 Classification of Rhodobacter capsulatus. ....................................... 14
Table 3.1 C/N ratio constants for different acetate and glutamate
concentrations. .................................................................................................. 33
Table 4.1 Outdoor sunlight illumination periods. ............................................ 49
Table 4.2 Summary results of the outdoor continuous panel photobioreactors with Different R. capsulatus Strains. ................................................................ 68
Table 4.3 Summary results of the indoor continuous panel photobioreactors with R. capsulatus YO3 (Hup-). ....................................................................... 98
Table 4.4 Chemical analysis results of pre-treated clinoptilolite. .................... 99
Table 4.5 DFE of molasses treatment using pretreated clinoptilolite sample. 100
Table 4.6 Results of the total nitrogen measurement of NH4Cl solution. ..... .101
Table 4.7 Results of the total nitrogen measurement of NH4Cl solution and
Sugar-beet juice molasses DFE. ..................................................................... 101
Table A.1 The composition of the standard basal, growth and hydrogen production medium per litre of solution. ........................................................ 130
Table A.2 The composition of trace element solution. .................................. 131
Table A.3 The composition of the vitamin solution. ...................................... 131
Table G.1. HPLC gradient pump operation profile. ....................................... 141
Table G.2. Glutamic acid measurement mobile phase and derivatization chemicals composition. .................................................................................. 142
Table I.1: Molar productivities conversion factor. ......................................... 148
Table J.1 Chemical composition of original clinoptilolite sample. ................ 151
Table K.1 The composition of the DFE of thick beet juice molasses. ........... 153
xvii
Table N.1 Results of the PHB standards measurement using gas chromatography. ............................................................................................. 159
Table N.2 Gas chromatography PHB measurement results of the 60 mM/4 mM Ac/Glu fed media CPBR. ............................................................................... 160
Table O.1 OD, cell dry weight and pH values for R. capsulatus (DSM 1710) outdoor CPBR. ............................................................................................... 161
Table O.2 HPLC data for the R. capsulatus (DSM 1710) outdoor CPBR. .... 162
Table O.3 OD, cell dry weight and pH values for the heat adapted
R. capsulatus (DSM 1710) outdoor CPBR. ................................................... 163
Table O.4 HPLC data for the heat adapted R. capsulatus (DSM 1710) outdoor CPBR. ............................................................................................................. 166
Table O.5 OD, cell dry weight and pH values for the R. capsulatus YO3 (Hup-) outdoor CPBR. ............................................................................................... 170
Table O.6 HPLC data for the R. capsulatus YO3 (Hup-) outdoor CPBR. ..... 172
Table O.7 OD, cell dry weight and pH values for the R. capsulatus YO3
(Hup-) 40 mM/2 mM Ac/Glu fed outdoor CPBR. .......................................... 175
Table O.8 HPLC data for the R.capsulatus YO3 (Hup-) 40/2 mM Ac/Glu fed CPBR. ............................................................................................................. 177
Table O.9 OD, cell dry weight and pH values for the R. capsulatus YO3
(Hup-) 40 mM/2 mM Ac/Glu Fed CPBR with biomass recycle. ................... 179
Table O.10 HPLC data for the R. capsulatus YO3 (Hup-) 40 mM/2 mM Ac/Glu fed CPBR with biomass recycle. .................................................................... 180
Table O.11 OD, cell dry weight and pH values for the R. capsulatus YO3 (Hup-) 40 mM/3 mM – 40 mM/4 mM Ac/Glu fed CPBR. ............................. 181
Table O.12 HPLC data for the R. capsulatus YO3 (Hup-) 40 mM/3 mM – 40 mM/4 mM Ac/Glu fed CPBR. ....................................................................... 182
Table O.13 OD, Cell Dry Weight and pH values for the R.capsulatus YO3 (Hup-) 60 mM/3 mM – 60 mM/4 mM Ac/Glu Fed CPBR. ............................ 184
Table O.14 HPLC data for the R. capsulatus YO3 (Hup-) 60 mM/3 mM - 60 mM/4 mM Ac/Glu fed CPBR. ....................................................................... 185

xviii
Table O.15 OD, cell dry weight and pH values for the R. capsulatus YO3 (Hup-) 80 mM/4 mM Ac /Glu fed CPBR. ...................................................... 185
Table O.16 HPLC data for the R. capsulatus YO3 (Hup-) 80 mM/4 mM Ac/Glu fed CPBR. ....................................................................................................... 185

xix
LIST OF FIGURES Figure 2.1 Hydrogen production from combined thermophilic and photoheterotrophic fermentation (HYVOLUTION Integrated Project concept) .......................................................................................................................... 13
Figure 2.2 Microscopic picture of Rhodobacter capsulatus bacteriu..………..15
Figure 2.3 The overall scheme for hydrogen production by PNS bacteria ...... 16
Figure 2.4 A simplifed overall scheme of the carbon metabolism in PNS bacteria ............................................................................................................. 17
Figure 3.1 The panel photobioreactor, Port (1) medium feeding, Port (2) temperature probe, Port (3) gas collection and Port (4, 5) sampling ................ 34
Figure 3.2 The indoor hydrogen production experimental setup using R. capsulatus YO3 (Hup-). ............................................................................... 35
Figure 3.3 The outdoor hydrogen production experimental setup. (1, 2) Rhodobacter capsulatus YO3 (Hup-), (3) Heat adapted Rhodobacter capsulatus (DSM 1710) and (4) Rhodobacter capsulatus (DSM 1710). ........................... 36
Figure 3.4 Outdoor experiments in winter, 2008. ............................................ 37
Figure 3.5 Ammonium ion removal in the dark fermenter effluent of sugar-beet thick juice molasses using clinoptilolite. .......................................................... 46
Figure 4.1 The biomass growth and hydrogen production for R. capsulatus (DSM 1710) CPBR experiment (13th September, 2008 – 3rd October, 2008). 51
Figure 4.2 The photobioreactor temperature variation and cumulative hydrogen production in the R. capsulatus (DSM 1710) CPBR experiment (13th September, 2008 – 3rd October, 2008). .................................................... 51
Figure 4.3 Daily average sunlight intensity and cumulative hydrogen production in the R. capsulatus (DSM 1710) CPBR experiment (13th September, 2008 – 3rd October, 2008) ............................................................. 52
Figure 4.4 The change in pH in the R. capsulatus (DSM 1710) CPBR experiment (13th September, 2008 – 3rd October, 2008). ................................. 53
Figure 4.5 Organic acid utilization in the R. capsulatus (DSM 1710) CPBR experiment (13th September, 2008 – 3rd October, 2008). ................................. 54

xx
Figure 4.6 The biomass growth and hydrogen production for the heat adapted R. capsulatus (DSM 1710) CPBR experiment (20th September, 2008 - 29th December, 2008). ............................................................................................. 55
Figure 4.7 The photobioreactor and air temperature variation in the heat adapted R. capsulatus (DSM 1710) CPBR experiment (20th September, 2008 - 29th December, 2008). ...................................................................................... 56
Figure 4.8 Daily average sunlight intensity and cumulative hydrogen production in the heat adapted R. capsulatus (DSM 1710) CPBR experiment (20th September, 2008 - 29th December, 2008) ................................................ 56
Figure 4.9 The change in pH in the heat adapted R. capsulatus (DSM 1710) CPBR experiment (20th September, 2008 - 29th December, 2008). ................. 57
Figure 4.10 Organic acid utilization in the heat adapted R. capsulatus (DSM 1710) outdoor experiment CPBR experiment (20th September, 2008 - 29th December, 2008). ............................................................................................. 58
Figure 4.11 The biomass growth and hydrogen production for R. capsulatus YO3 (Hup-) experiment CPBR experiment (16th October – 24th December, 2008). ................................................................................................................ 59
Figure 4.12 The photobioreactor and air temperature variation in the R. capsulatus YO3 (Hup-) experiment (16th October – 24th December, 2008). 60
Figure 4.13 Daily average sunlight intensity and cumulative hydrogen production in the R. capsulatus YO3 (Hup-) CPBR experiment (16th October, 2008 - 24th December, 2008). ........................................................................... 61
Figure 4.14 The change in pH in the R. capsulatus YO3 (Hup-) outdoor experiment (16th October – 24th December, 2008). .......................................... 61
Figure 4.15 Organic acid utilization in the R. capsulatus YO3 (Hup-) outdoor experiment (16th October – 24th December, 2008) ......................................... 63
Figure 4.16 Comparison of the outdoor photobioreactors hydrogen productivities. ................................................................................................... 64
Figure 4.17 Comparison of the outdoor photobioreactors substrate conversion efficiencies. ....................................................................................................... 65
Figure 4.18 Comparison of the outdoor photobioreactors acetate conversions. .......................................................................................................................... 67

xxi
Figure 4.19 The biomass growth and cumulative hydrogen production in the 40 mM/2 mM Ac/Glu fed CPBR (18th September, 2008 - 2nd November, 2008). 70
Figure 4.20 The photobioreactor temperature and pH change in the 40 mM/2 mM Ac/Glu fed CPBR experiment (18th September, 2008 - 2nd November, 2008). ................................................................................................................ 71
Figure 4.21 Organic acid utilization in the 40 mM/2 mM Ac/Glu fed CPBR experiment (18th September, 2008 - 2nd November, 2008). ............................. 73
Figure 4.22 The biomass growth and hydrogen production in the 40 mM/2 mM Ac/Glu fed CPBR with biomass recycle (4th April, 2009 – 5th May, 2009). .......................................................................................................................... 74
Figure 4.23 Temperature, pH and bacteriochlorophyll variation in the 40 mM /2 mM Ac/Glu fed CPBR with biomass recycle (4th April, 2009 – 5th May, 2009). ...................................................................................................... 75
Figure 4.24 Organic acid utilization in the 40 mM/2 mM Ac/Glu fed CPBR with biomass recycle (4th April, 2009 – 5th May, 2009). .................................. 76
Figure 4.25 The biomass growth and hydrogen production in the 40 mM/3 mM – 40 mM/4 mM Ac/Glu fed CPBR experiment (25th March – 3rd May, 2009). ...................................................................................................... 77
Figure 4.26 Temperature, pH and bacteriochlorophyll variation in the 40 mM/3 mM- 40 mM/4 mM Ac/Glu fed CPBR experiment (25th March – 3rd May, 2009). ...................................................................................................... 78
Figure 4.27 Organic acid utilization in the 40/3-40/4 mM Ac/Glu fed CPBR experiment (25th March – 3rd May, 2009). ....................................................... 79
Figure 4.28 The biomass growth and hydrogen production in the 60 mM/3 mM – 60 mM/4 mM Ac/Glu fed CPBR experiment (21st March – 3rd May, 2009). .......................................................................................................................... 80
Figure 4.29 Temperature, pH and bacteriochlorophyll variation in the 60 mM/3 mM – 60 mM/4 mM Ac/Glu fed CPBR experiment (21st March – 3rd May, 2009). ................................................................................................................ 81
Figure 4.30 Organic acid utilization in the 60 mM/3 mM – 60 mM/4 mM Ac/Glu fed CPBR experiment (21st March – 3rd May, 2009). ......................... 82
Figure 4.31 The biomass growth and hydrogen production in the 80 mM/4 mM Ac/Glu fed CPBR experiment (21st March, 2009 – 1st April, 2009). ............... 83

xxii
Figure 4.32 Temperature, pH and bacteriochlorophyll variation in the 80 mM/4 mM Ac/Glu fed CPBR (21st March, 2009 – 1st April, 2009). .......... 84
Figure 4.33 Organic acid utilization in the 80 mM/4mM Ac/Glu fed continuous panel photobioreactor (21st March, 2009 – 1st April, 2009). ............................ 85
Figure 4.34 Effect of biomass recycle on biomass concentration. ................... 86
Figure 4.35 Effect of biomass recycle on: (a) Hydrogen productivity, (b) Acetate conversion and (c) Substrate conversion efficiency. ........................... 87
Figure 4.36 Biomass change with increasing glutamate concentration keeping acetate concentration constant. ......................................................................... 88
Figure 4.37 Biomass change with increasing acetate concentration keeping glutamate concentration constant. .................................................................... 89
Figure 4.38 (a) Hydrogen productivity, (b) Substrate conversion efficiency and (c) Acetate conversion in the indoor photobioreactors .................................... 91
Figure 4.39 Effect of increasing acetate and glutamate keeping C/N constant on biomass. ............................................................................................................ 94
Figure 4.40 Light conversion efficiency values for the R. capsulatus YO3 (Hup-) indoor CPBRs. ...................................................................................... 96
Figure 4.41 Comparison of batch versus continuous photobioreactors: (a)Hydrogen productivitiy, (b) Substrate conversion efficiency and (c) Light conversion efficiency. ...................................................................................... 97
Figure 5.1 Phases of bacterial cell growth ..................................................... 103
Figure 5.2 The logistic model for the Rhodobacter capsulatus (DSM 1710) CPBR outdoor experiment (13th September, 2008 – 3rd October, 2008) ..... 1034
Figure 5.3 The logistic model for the heat adapted Rhodobacter capsulatus (DSM 1710) CPBR outdoor experiment (20th September, 2008 - 29th December, 2008) ............................................................................................ 105
Figure 5.4 The logistic model for the Rhodobacter capsulatus YO3 (Hup-) outdoor experiment (16th October – 24th December, 2008) ......................... 105
Figure 5.5 The logistic model for the Rhodobacter capsulatus YO3 (Hup-) 60 mM/3 mM Ac/Glu fed CPBR indoor experiment (21st March – 3rd May, 2009). .............................................................................................................. 106

xxiii
Figure 5.6 The logistic model for the Rhodobacter capsulatus YO3 (Hup-) 80 mM/4 mM Ac/Glu CPBR indoor experiment (21st March – 1st April, 2009). ........................................................................................................................ 106
Figure C.1 Calibration curve and the regression trend line for Rhodobacter capsulatus (DSM 1710) dry weight versus OD660. ...................................... 135
Figure C.2 Calibration curve and the regression trend line for Rhodobacter capsulatus YO3 dry weight versus OD660. ................................................... 136
Figure D The light absorption spectrum of Rhodobacter capsulatus ............ 137
Figure E Sample gas analysis chromatogram ................................................. 138
Figure F.1 Sample HPLC analysis chromatogram (concentrations measured by Shimadzu 10A series high performance liquid chromatography). Peak 1 (mobile phase- H2SO4), Peak 2 (lactic acid), Peak 3 (Formic acid) and Peak 4 (acetic acid). ................................................................................................... 139
Figure F.2 Acetic acid standard calibration curve .......................................... 140
Figure G.1 Glutamic acid standard calibration curve ..................................... 143
Figure G.2 Glutamic acid standards calibration curve. .................................. 144
Figure J.1 Chemical composition of the original clinoptilolite sample ......... 152
Figure J.2 Scanning Electron Micrograph (SEM) of the original Gördes clinoptilolite .................................................................................................... 152
Figure K.1 Ammonium ion electrode (Russel Model 95-5129) calibration curve................................................................................................................153 Figure L.1 a) Comparison of the pots after wheat germination (water, PBR effluent from left to right). b) The pots placed in outdoor (water (1) and (2), PBR effluent (1) and (2) from left to right). c) The pots placed in indoor conditions (PBR effluent (1) and (2), water (1) and (2) from left to right). d) The wheat plant after fungus infection (PBR effluent (1) and (2) in front and water (1) and (2) at the back). ........................................................................ 155
Figure L.2 Comparison of the wheat plant shoot lengths grown using the PBR effluent and tap water. .................................................................................... 155
Figure N.1 Gas chromatogram for the 10 mg PHB standard. ........................ 158

xxiv
Figure N.2 Gas chromatography PHB measurement standards calibration curve…………………………………………………………………………159

xxv
LIST OF SYMBOLS AND ABBREVIATIONS A: Irradiated area (m2)
Ac: Acetate
Acetyl-CoA: Acetyl Coenzyme A
ATP: Adenosine tri-Phosphate
bchla: Bacterirochlorophyll
BR : Biomass Recycle
C/N: Carbon to Nitrogen Ratio
CPBR: Continuous Panel Photobioreactor
FAB: Fast Atom Bombardment
FID: Flame Ionization Detector
GC: Gas Chromatography
gdcw: Gram Dry Cell Weight of Bacteria
Glu: Glutamate
H2: Hydrogen Gas
Hup- : Uptake Hydrogenase Deficient (mutant)
HPLC: High Performance Liquid Chromatography
HRT: Hydraulic Retention Time
i.d: Internal Diameter
I: Light intensity (W/m2)
l: Litre
kc: Apparent Specific Growth Rate (h−1)
Lux: Luxmeter
mM: Millimolar
Me-3HB: Methyl 3-Hydroxybutyric Acid
PHB: Polyhydroxybutyrate
PNS: Purple Non-Sulphur
t: time (hours)
V: volume (ml or l)
W: Watt

xxvi
X: Cell Concentration (gdcw/lc)
Xmax: Maximum Cell Concentration
Xo : Initial Cell Concentration
Greek Letters:
η: Light conversion efficiency (%)
μ: Specific growth rate constant (h-1)
ρ: Density (g/l)
µl: Microlitre

1
CHAPTER 1
INTRODUCTION The 20th century saw the biggest increase in the world population in
human history. The green revolution led to massive increases in agricultural
productivity, technological and medical advances; mortality rate decreased in
many countries worldwide. The current world population, estimated at 6.7
billion, is projected to reach 7 billion in early 2012 and surpass 9 billion by
2050 (UN Population Division/DESA, 2009). This will lead to more demand on
energy. Energy is of paramount importance for a modern industrialized
economy; it is critical for economic growth and progress. Currently, the energy
consumed mainly comes from fossil fuels (oil, coal and gas) and nuclear
sources. However, the fossil fuel reserves are limited and a decline in
production is projected in the future. Also, fossil fuels lead to the emission of
greenhouse gases (COx, NOx and SOx) that are harmful to mankind and the
environment. For this reason, much emphasis is being laid on developing
alternative energy sources that are reliable, renewable, cheap and
environmentally friendly. The use of hydrogen as a future energy resource is
proposed.
Hydrogen is the lightest and most plentiful element in the universe. It is
a rich energy carrier that has the highest energy content compared to other
hydrocarbon fuels. On combustion, it produces water as the main product and
so is considered a ‘‘clean’’ fuel. It is used in a variety of fields; the petroleum
industry (hydrocracking), the chemical industry (production of ammonia), the
food industry (hydrogenation of fats), as a shielding gas in welding, as a
coolant gas, reactant in nuclear fission and as a transportation fuel (fuel cells).
Currently, hydrogen is mainly produced from fossil fuels through
processes like natural gas steam reformation, coal gasification and the

2
electrolytic splitting of water. It can also be produced from biomass using
thermochemical processes like biomass pyrolysis and gasification and
biologically, using microorganisms. Among the stated hydrogen production
processes, biological hydrogen production is the least energy intensive and the
most environmental benign process. Moreover, it is renewable and facilitates
the utilization of the available natural resources; sunlight and agricultural
wastes.
Biologically, hydrogen can be produced through processes such as the
biophotolysis of water using algae and cyanobacteria, fermentation of organic
compounds using fermentative bacteria, photo decomposition of organic
compounds using photosynthetic bacteria and a combination of the above
processes. Microalgae and cyanobacteria are able to biologically split water
into hydrogen and oxygen using sunlight energy and carbondioxide from the
atmosphere. Under anerobic conditions and in the absence of light, some
bacteria can break down organic matter (agricultural wastes like molasses) to
produce hydrogen and lower molecular weight organic acids. Photosynthetic
bacteria can convert organic acids into hydrogen and carbondioxide using
sunlight energy and nitrogenase enzyme, under anaerobic conditions. To avoid
competition with food production, biological hydrogen production should be
dependent on disposed biomass in which main sources are sugars and their
polymers (Asada et al., 2008).
Hydrogen production by the photo decomposition of organic
compounds using photosynthetic bacteria is considered the most favourable
method for biological hydrogen production. This is because of the high
conversion efficiency and versatility in using different substrates.
The efficiency of biological hydrogen production processes can be
increased by integration of the different processes. An example is the
combination of the dark fermentation and photofermentation systems to
achieve maximum conversion of substrates and high hydrogen yield. The lower
molecular weight organic acids produced in the dark fermentation process can
be used as feedstock to photosynthetic bacteria in photofermentation systems.

3
This would lead to the nearly all, if not complete utilization of the initial
substrate for hydrogen production. Such systems would enable hydrogen
production at an industrial scale be feasible and cost effective.
‘‘HYVOLUTION’’, an acronym for “Non-thermal production of pure
hydrogen from biomass”, is a European Union 6th framework integrated project
with a concept of generating hydrogen using combined thermophilic dark
fermentatative and phototrophic bacteria. The main objective of this project is
to develop a two-stage bioprocess for the cost-effective production of pure
hydrogen at small scale from locally obtained biomass feedstock. The
bioprocess starts with a thermophilic fermentation of feedstock to hydrogen,
carbondioxide and intermediates. Then all the intermediates produced are
converted to more hydrogen and carbondioxide in consecutive
photoheterotrophic fermentation. 75% efficiency (nearly 9 mol of hydrogen per
mole of hexose) is achieved.
A major target of the HYVOLUTION project is to form a basis for the
construction of a plant that will enable the conversion of biomass to pure
hydrogen. The project is divided into seven work packages in which each
partner is assigned a task; biomass, thermophilic fermentation, photo
fermentation, gas upgrading, system integration, societal integration and
training. These work packages represent modules which will eventually be
combined to form a blue print for a hydrogen production plant. Major scientific
and technological objectives include the development of bioreactor prototypes
for thermophilic and photofermentation and the design of an optimized
industrial scale hydrogen production plant that accounts for proper material
usage and up-to date control and monitoring equipment.
Besides scientific and technological objectives, also socio-economic
activities are included to increase public awareness and societal acceptance,
and for identification of future opportunities, stakeholders and legal
consequences of this specific bioprocess for decentral hydrogen production
(Classen and Vrije, 2006).

4
The project that was started in 2006, involves 11 EU countries, Turkey,
Russia and South Africa. METU Biohydrogen Group leads the
photofermentation research of this five year project. The group has been
studying hydrogen production by photosynthetic bacteria with respect to
kinetics, biochemistry and process development and performed the design,
construction and operation of laboratory scale reactors and an outdoor pilot
scale photo bioreactor for hydrogen production.
Hydrogen production by photosynthetic bacteria occurs in the presence
of light under anerobic and nitrogen limited conditions (high C/N ratio). The
mechanism involves three main components; enzyme systems (nitrogenase and
hydrogenase), carbon flow (TCA) cycle and the photosynthetic membrane unit.
Organic substrates, such as acetate and lactate, are broken down in the TCA
cycle to reducing equivalents (electrons and protons) and carbondioxide. The
photosynthetic centre of the bacteria captures light and converts it into energy
(ATP). Then the nitrogenase enzyme, under nitrogen limitation and excess
electrons, enzyme utilizes the ATP to convert the electrons from the TCA cycle
into hydrogen. Hydrogenase enzyme is an antagonistic enzyme which can
either convert hydrogen back to electrons or form hydrogen from electrons,
depending on the redox status of the culture.
By-products of photofermentative hydrogen production include
polyhydroxybutyrate (PHB), carotenoid and biomass. PHB is a biodegradable
thermoplastic that is a suitable substitute for petrochemical plastics. Carotenoid
is a pigment that can be used as a food colorant and antioxidant. Biomass
produced can be used as livestock feed supplement because it contains cells
rich in protein.
An important factor in photofermentative hydrogen production is the
successful design and operation of the photobioreactor. An elaborate simple
design with low material and production costs and high utilization of sunlight
within the optimum wavelength is desired. Flat panel type photobioreactors
have the advantage of being stacked together to provide a large illuminated
surface in a small ground area and can be oriented for optimal exposure.

5
Different organic substrates and photosynthetic bacterial strains have
been tested for hydrogen production by the METU Biohydrogen Research
Group. Comparisons of the different PNS bacteria that the group worked on for
hydrogen productivity showed that the Rhodobacter capsulatus performed well
in acetate containing media. Most of the experiments carried out were in batch
mode and so different strains of this bacteria remain to be tested in continuous
systems for hydrogen production in long term (Türkaslan et al., 1998; Eroğlu et
al., 1999; Yiğit et al., 2000; Suludere, 2001; Koku et al., 2002; Koku et al.,
2003; Eroğlu et al., 2004, Eroğlu et al., 2006, Öztürk et al., 2006; Uyar et al.,
2007; Eroğlu et al., 2008; Özgür et al., 2009). Acetate is a central intermediate
in the overall carbon cycle and can be easily utilised by the photosynthetic
bacteria. Besides it has a reasonable cost and is a major product of the dark
fermentation process. So research in the photofermentation process using
acetate gives an opportunity to integrate the dark fermentation and
photofermentation processes to achieve optimal hydrogen production.
An obstacle in the utilization of the dark ferment effluent (DFE) as feed
to the photofermentation process is the presence of ammonium ion in the
effluent. Ammonia inhibits nitrogenase enzyme, cutting down the hydrogen
production capability of the PNS bacteria. A possible means of reducing the
ammonia content in the DFE is the use of natural zeolites such as clinoptilolite.
It is aimed to search the applicability of Gördes clinoptilolite to remove
ammonium ions from the real DFE such as molasses for process integration of
WP2 Thermophilic fermentation with WP3 Photofermentation steps in the
HYVOLUTION Project.
The main objective of this study is to achieve a stable and high
hydrogen production on acetate using Rhodobacter capsulatus in continuous
panel photobioreactors in long term in outdoor conditions.

6
CHAPTER 2
LITERATURE SURVEY 2.1 Hydrogen
2.1.1 Properties and Uses of Hydrogen
Hydrogen, the first element on the chemical periodic table, is a very
light, odourless and colourless gas. It is the most abundant element in the
universe, making up about three quarters of all matter (Das and Veziroğlu,
2001). It has a 0.09 g/l density, -253 0C boiling point and is highly diffusive in
air with a diffusion coefficient of 0.61 cm3/s. Gaseous hydrogen burns in air at
volume concentrations between 4 - 74.5% and has the highest energy to weight
ratio of all fuels. 1 kg of hydrogen contains the same amount of energy as 2.1
kg of natural gas or 2.8 kg of gasoline (BACAS report, 2006). On combustion,
hydrogen produces water as the main product, thus considered a clean non-
polluting fuel. Shown in Equation (1) is the hydrogen combustion reaction.
Also, compared to other gaseous fuels like water gas, it is harmless to humans
and the environment (Bockris et al., 1981; Suzuki et al., 1982).
2 H2 (g) + O2 (g) → 2 H2O (l) + 286 kJ/mol (1)
The unique physical properties and environmental benignity make
hydrogen a major future energy carrier. Currently, it is mainly used in the
petroleum industry (hydrocracking and hydrodesulphurization), the chemical
industry (production of ammonia and methanol) and food industry
(hydrogenation of fats). Other uses of hydrogen are as a shielding gas in
welding, a coolant gas in electrical generators, reactant in nuclear fission and as
fuel in rocket engines and fuel cells (Czuppon et al., 1994; Veziroğlu et al.,
1995; Ramachandran et al., 1998).

7
2.1.2 Hydrogen Production Processes
Hydrogen is mostly produced from fossil fuels using processes like
steam reformation of natural gas, partial oxidation and coal gasification.
Electrolysis of water, pyrolysis of biomass and biological production are the
other production methods employed (Hassmann et al., 1993).
Steam reformation of natural gas and other lighter hydrocarbons like
naphtha account for nearly 80-85% of hydrogen produced today (Simpson et
al., 2007). In this process, natural gas and steam are passed over nickel-based
catalyst and reacted in a reactor at temperatures between 650 -700 0C. The
products are a mixture of hydrogen and carbonmonoxide. Steam reformation is
currently the least expensive method of hydrogen production but the
technology is suitable for large reformers (100,000 tons per year) where yields
higher than 80% can be achieved. Smaller scale reformers show lower
efficiencies (Mc. Auliffe et al., 1980; BACAS Report, 2006).
Coal gasification is another industrially applied method for hydrogen
production. It involves the reaction of coal with oxygen and steam in a high-
temperature and high-pressure reactor at temperatures exceeding 700 0C.
Syngas consisting of hydrogen and carbonmonoxide mixed with steam and
cardondioxide is produced. Hydrogen production from coal gasification is
highly practical with the available coal reserves worldwide, but emission of
carbondioxide is a major environmental concern. Technologies like oxygen-
blown gasification with carbondioxide capture and sequestration are applicable
but still costly compared to other industrial processes like steam reformation
(Collot, 2002).
Electrolytic splitting of water into hydrogen and oxygen is another
widely used method for hydrogen production. It is mostly used in small scale
applications when high purity of hydrogen is required. The application of the
electrolytic process offers the opportunity to utilize renewable sources like
solar, wind and hydropower but requires lots of electricity and is restricted to
the regions with the available resources, for example hydroelectricity.

8
The aforementioned industrial methods for hydrogen production are
highly energy intensive, environmentally malign due to greenhouse gases
(COx, NOx and SOx) emissions and fossil fuel dependent, thus finite. For this
reason, alternative methods that are clean and renewable are being investigated.
The use of biomass for sustainable hydrogen production is receiving much
attention because of its renewability. Hydrogen production through
thermochemical processes like biomass pyrolysis and gasification has been
shown to be feasible, but has not been demonstrated at large-scale production
levels (Ni et al., 2006).
On the other hand, biological hydrogen production processes such as
photofermentation offer an opportunity to use the available renewable
resources. They are mostly carried out at ambient temperatures and pressure
hence less energy intensive and can utilize various renewable waste materials
(Das and Veziroğlu, 2001).
2.1.3 Current Cost of Hydrogen Production
The cost of hydrogen is dependent on the cost of feed and the capital
investment. Current available technology for large scale hydrogen production
from fossil fuels (natural gas, oil and coal) make it cheaper compared to
production from renewable sources. The production cost of large scale
hydrogen production from natural gas is estimated to be 6 Euro/GJ while that
of biological hydrogen production is three to four times. Technological
improvements through continued research and development are expected to
reduce production costs from renewable resources (Reith et al., 2003). The
HYVOLUTION project focuses on the combination of thermophilic
fermentation and photofermentation to enable the complete conversion of
biomass to hydrogen. It aims to develop industrial hydrogen production at 10
Euro/GJ. This will be achieved by reducing costs in biomass treatment,
optimizing efficiencies in both thermophilic and photofermentative systems,
low-gas upgrading procedures and optimizing energy and heat utilization
systems (Claassen and Vrije, 2006).

9
2.2 Biological Hydrogen Production
In nature, micro-organisms such as algae, cyano-bacteria and
photosynthetic bacteria can utilize renewable resources (sunlight, water and
biomass) to produce hydrogen as a by-product during growth.
Biological hydrogen production can be divided into four main
categories (Das and Veziroğlu, 2001):
a. Biophotolysis of water using algae and cyanobacteria.
b. Fermentative hydrogen production from organic compounds.
c. Photodecomposition of organic compounds by photosynthetic bacteria.
d. Combined systems (Hybrid) using photosynthetic and fermentative
bacteria.
2.2.1 Biophotolysis
Biophotolysis is the biological splitting of water into hydrogen and
oxygen. Microalgae and cyanobacteria have been shown to be able to produce
hydrogen by water photolysis using light as energy source under anaerobic
condition (Gaffron and Rubin, 1992; Smith et al., 1992). These photosynthetic
organisms have nitrogenase and hydrogenase enzymes that catalyse the water
decomposition. The biophotolysis reaction is shown in Equation (2).
2 2 2 1 H O (l) H (g) + O (g)2
→ (2)
Although biophotolysis has been shown to be a good biological system
for producing hydrogen, a major obstacle is that the generated oxygen tends to
inhibit the hydrogen production enzymes leading to low production rates
(Benemann et al., 1973). Other problems include intrinsic limitations in light
conversion efficiencies and problems with gas capture and separation
(Hellenback et al., 2002; Melis, 2002).

10
2.2.2 Dark Fermentation
In fermentative hydrogen production, anaerobic bacteria produce
hydrogen by decomposing organic substrates in the absence of light. Hydrogen,
carbondioxide and lower molecular weight organic compounds such as acetate
and butyrate are the main products. The lower molecular weight organic acids
are a result of incomplete decomposition. Shown in Equation (3) is a
fermentation reaction of glucose.
6 12 6 2 2 C H O (l) H (l) + CO (l) + Organic acids→ (3)
The amount of hydrogen production by dark fermentation depends on
the chemical composition of the feed, pH value, hydraulic retention time
(HRT) and the gas partial pressure. Production of alcohols (ethanol) as end
products in the fermentation lowers hydrogen productivity. pH in the range of
5-6 is suggested and low hydrogen partial pressures 10–20 kPa have been
shown to enable bacterial growth in dark fermentative trickle bed reactors
(Fang et al., 2002; Groenestijn et al., 2002). Fermentative hydrogen production
can take place between 30-800C. Studies on hydrogen production through dark
fermentation using thermophilic species are becoming common because of the
advantages of using high temperatures. Thermophiles are microorganisms that
live at relatively high temperatures, between 45 and 80 °C. It was observed that
thermophiles had higher hydrogen yields, close to the theoretical value of 4
mol H2/mol glucose compared to their mesophilic counterparts that had 2–3
mol H2/ mol glucose yields (Kleerebezem and Loosdrecht, 2007 ; Kengen et
al., 2008).
2.2.3 Photofermentation
Photodecomposition of organic compounds by photosynthetic bacteria
is considered the most favorable method for biological hydrogen production.
The bacteria produce hydrogen by breaking down organic acids into hydrogen
and carbondioxide using sunlight energy and the nitrogenase enzyme. The
reaction is shown in Equation (4).

11
2 2 2Organic acids + 6H O 12H (g) + 6CO (g)→ (4)
The photosynthetic bacteria are reputed to have high conversion
efficiencies, show versatility in using different substrates, survive in different
environments (aerobic, anaerobic, with or without light and salty waters) and
can trap energy at a wide range of light spectrum. Also, large database is
available for genetic manipulation and enhancing hydrogen production
mechanism (Fascetti and Todini, 1995, Miyake and Kawamura, 1987).
2.2.4 Integrated Systems
Dark fermentation and photofermentation hydrogen production can be
combined to achieve maximum conversion of biomass and for high hydrogen
yield. In dark fermentation, due to thermodynamic limitations, the end products
include hydrogen, carbondioxide and lower molecular organic acids. On the
other hand, nearly stoichiometric conversion of some substrates (organic acids)
to hydrogen can be obtained through photofermentation (Chen et al., 2007). A
system in which the low molecular organic acid produced in the dark
fermentation is used as feed to the photofermentation process would lead to
complete utilization of the initial substrate for hydrogen production.
Considerations to be made in developing the integrated system include
the feed, organisms, end products, materials and methods of operation.
Employment of batch tests of dark-fermentation using microflora and
photofermentation with Rhodobacter sphaeroides SH2C led to an increase in
hydrogen yield from 3.67 mol H2/mol sucrose in dark fermentation to 6.63 mol
H2/mol sucrose using the two-step process (Tao et al., 2007). Results
demonstrated that the combination of dark and photofermentation systems was
effective and efficient in improving hydrogen yield from glucose by
immobilized Rhodopseudomonas faecalis RLD-53 using soluble metabolites
from dark fermentation with Ethanoligenens harbinese B49. Maximum
hydrogen yield at 9 g/l glucose was increased from 1.83 mol H2/mol glucose to
6.32 mol H2/mol glucose (Liu et al., 2008). Reviews and evaluations show that

12
the combined system shows greater promise for industrial application
(Redwood et al., 2008).
As stated in the introduction section, the European Union 6th framework
integrated project ‘‘HYVOLUTION’’ aims to develop a two-stage bioprocess
for the cost-effective production of pure hydrogen at small scale from locally
obtained biomass feedstock. Intermediate products from thermophilic
fermentation are to be used as feedstock in photoheterotrophic fermentation to
attain an overall 75% hydrogen production efficiency.
Thermophilic fermentation that takes place at or more than 700C is
preferred because of its higher hydrogen yield compared to its mesophilic
counterpart. Over 3 moles of hydrogen and 2 moles of acetic acid are produced
from thermophilic fermentation of glucose while 1–2 moles of hydrogen
production and reduced by-products like butyrate, propionate and ethanol is
obtained in mesophilic fermentations at ambient temperatures (Vrije et al.,
2003). Also, the production of acetate, a prime substrate for photoheterotrophic
bacteria makes thermophilic fermentation more feasible for integration with
photofermentation process. In the project, a thermophile, Caldicellulosiruptor
saccharolyticus, is used as the key microorganism for the dark fermentation
process because of its superior characteristics for hydrogen production. It
grows optimally at 70ºC, can utilise many different carbohydrates including
cellulose, xylan and pectin) and it produces high levels of hydrogen (Rainey et
al., 1994; Kadar et al., 2003; Kadar et al., 2004; van Niel et al., 2002).
Moreover, it can simultaneously convert C6- and C5- sugars, the main
constituents of commonly used biomass feedstock in the project; potato steam
peels and sugar- beet thick juice molasses. A trickling bed and fluidized bed
reactor are used in the dark fermentation process (Groenestijn et al., 2006;
Zhang et al., 2006; Groenestijn et al., 2009).
In the photofermentation process, the PNS bacteria Rhodobacter
sphaeroides and Rhodobacter capsulatus which showed good growth and
hydrogen production on acetate are used. Hydrogen production using the

13
effluent from the dark fermentation process is done in flat panel and tubular
photobioreactors.
A schematic of the combination of thermophilic and photo fermentation
concept of the HYVOLUTION integrated project is given in Figure 2.1.
Figure 2.1 Hydrogen production from combined thermophilic and
photoheterotrophic fermentation (HYVOLUTION Integrated Project concept)
(Reith et al., 2003).
2.3 General Characteristics of Rhodobacter capsulatus
Rhodobacter capsulatus is a gram-negative purple non- sulphur (PNS)
bacterium. It is a member of the Rhodospirillaceae family and belongs to the
Rhodobacter genera. It has a rod-like shaped cell with a diameter of 0.5-1.2 μm
and divides by binary fission, producing capsules and slime (Imhoff et al.,
1995). The cells are motile by polar flagella. Shown in Table 2.1 is a
classification table of the Rhodobacter species.

14
Table 2.1 Classification of Rhodobacter capsulatus (Imhoff et al., 1984).
Purple non sulphur (PNS) bacteria are prokaryotic and photosynthetic
organisms that have a single photosystem (lack photosystem II), thus can carry
out anoxygenic photosynthesis. They require vitamin for growth and are able to
perform different growth modes such as, aerobic respiration, anaerobic
respiration, and photosynthesis. They grow at pH 6-9 and temperature range
250C-350C (Sasikala et al., 1993). Also, they can live in both dark and light
conditions and can tolerate oxygen at low levels (Biebl and Pfennig, 1981).
The bacteria are pigmented with bacteriochlorophyll a and carotenoids of the
sphaerodene series. Rhodobacter capsulatus bacteriochlorophyll a has
characteristic absorption maxima values 376-378, 450-455, 478-480, 508-513,
590-592, 802-805 and 860-863 nm for living cells. Shown in Appendix D is its
light absorbtion spectrum. The PNS bacteria exhibits a yellowish brown to
greenish and deep brown colour when grown anaerobically in the presence of
light but turn red in the presence of oxygen; carotenoids are converted to
corresponding ketocarotenoids that cause the red colour change (Pellerin and
Gest, 1983). A microscopic picture of the Rhodobacter capsulatus bacterium is
shown in Figure 2.2.
Super Kingdom Prokaryota Kingdom Monera
Sub kingdom Eubacteria Phylum Gracilicutes Class Photosynthetic eubacteria Order Rhodospirillates
Family Rhodospirillaceae Genus Rhodobacter Species capsulatus

15
Figure 2.2 Microscopic picture of Rhodobacter capsulatus bacterium
(Bacterial Photobiotechnology Group, Duesseldorf University).
2.4 Overview of the Hydrogen Production Metabolism
Rhodobacter capsulatus and other PNS bacteria produce molecular
hydrogen under anaerobic and nitrogen-limiting conditions by using light as
primary energy source and organic compounds as carbon source. The nitrogen-
limiting condition (brought about by having a high C/N ratio) forces the
bacteria to ‘dump’ the excess energy and reducing power through the
production of hydrogen. The overall hydrogen production mechanism
comprises several individual components: the enzyme systems (nitrogenase
and hydrogenase enzymes), the TCA cycle (carbon flow) and the
photosynthetic membrane apparatus (Koku et al., 2002). Shown in Figure 2.3
is the overall scheme for hydrogen production.

16
Figure 2.3 The overall scheme for hydrogen production by PNS bacteria
(Koku et al., 2002).
2.4.1 The Hydrogen Production Mechanism
In the hydrogen production mechanism, substrates (organic acids such
as acetate), are oxidized in the TCA (Tricarboxylic or citric acid cycle) to
release carbondioxide, protons and electrons. A simplified diagram of the
carbon metabolism is given in Figure 2.4.

17
Figure 2.4 A simplifed overall scheme of the carbon metabolism in PNS
bacteria (Koku et al., 2002).

18
The protons and electrons produced in the TCA cycle are directed to the
nitrogenase enzyme. The photosynthetic membrane apparatus converts light
energy into ATP, which is also directed into the nitrogenase enzyme. The
protons to the nitrogenase enzyme are partly supplied by the action of ATP-
synthase, working as a part of photosynthetic apparatus. The nitrogenase
enzyme reduces the protons to molecular hydrogen (Sasikala et al., 1990).
However, hydrogenase enzyme functions primarily in the direction of
hydrogen consumption by producing ATP, protons and electrons. Therefore,
the net collected hydrogen amount is the amount produced by nitrogenase
minus the amount consumed by hydrogenase (Vignais et al., 1985).
2.4.2 Enzyme Systems
Two key enzymes, nitrogenase and hydrogenase enzymes, are involved
in the hydrogen production process.
2.4.2.1 Nitrogenase
Hydrogen production is mainly attributed to the nitrogenase enzyme.
Under anaerobic conditions, in the presence of molecular nitrogen, nitrogenase
enzyme catalyzes nitrogen fixation by the following reaction (Miyake et al.,
1989).
+ -2 3 2 iN + 8H + 8e + 16ATP 2NH + H + 16ADP + 16P (5) →
In the absence of molecular nitrogen, the enzyme converts protons to
hydrogen by the reaction below.
+ -22H + 2e + 4ATP H + 4ADP + 4Pi (6) →
The nitrogenase enzyme is inhibited by oxygen and ammonium.
Oxygen denatures MoFe and Fe proteins in the enzyme complex irreversibly
(Hall et al., 1995). High ammonia concentrations repress nitrogenase
expression and activity, but it recovers once the excess ammonia
concentrations decrease (Gogotov, 1986; Zorin, 1986). Experiments using
continuous cultures of Rhodopseudomonas capsulatus have shown that light

19
strongly stimulate nitrogenase activity (Jouanneau et al., 1985). Also, stable
nitrogenase activity was observed with alternating ligt and dark periods (Meyer
et.al., 1978).
2.4.2.2 Hydrogenase
Two types of hydrogenase enzymes are involved in the hydrogen
metabolism. The first type, designated as ‘‘reversible’’ hydrogenase is
presumed to catalyze hydrogen evolution or uptake depending on the redox
status of the culture. ‘‘Uptake’’ hydrogenase is the second type of hydrogenase
enzyme. It is membrane bound and primarily catalyzes hydrogen consumption
(Hall et al., 1995).
The hydrogenase enzyme catalyzes the reversible breakdown of
molecular hydrogen according to the reaction shown in Equation (7).
+ -2H 2H + 2e ↔ (7)
Studies using R. capsulatus have shown that the hydrogenase enzyme is
able to produce and consume hydrogen. However, since hydrogen production
is mainly attributed to the nitrogenase enzyme, its hydrogen-producing activity
is neglible. Hydrogenase activity was observed to be less than 10% of the
hydrogen consuming activity (Gogotov, 1986; Zorin, 1986).
Repression of the hydrogenase enzyme through genetic modifications
like chromosomal inactivation of the uptake hydrogenase enzyme can increase
hydrogen production. Two mutants of R. capsulatus B10, lacking the uptake
hydrogenase enzyme (Hup-) were grown in a medium containing lactate and
glutamate. They produced 10-20% more hydrogen at higher rate than their
wildtype counterpart Zorin (1996). 68% hydrogen yield was obtained from
60 mM malate feed using R. capsulatus ST410 (a Hup- mutant) compared to
25% hydrogen yield in the wildtype R. capsulatus B100 (Ooshima et.al.,
1998). Öztürk et al. (2006) developed a mutant strain (Y03) of R. capsulatus
MT1131 by genetically deleting the uptake hydrogenase through interposon
mutagenesis. They observed that when grown in a medium containing 15 mM

20
malate and 2 mM glutamate, the mutant strain had a higher hydrogen
productivity and substrate conversion efficiency compared to the wild type
strain. The mutant strain produced a total of 1.33 ml of hydrogen per ml culture
with a maximum production rate of 0.019 ml H2/ml culture.h and 67%
substrate conversion efficiency while the wild type strain produced a total of
0.94 ml of hydrogen per ml culture with a maximum production rate of 0.014
ml H2/ml culture.h and 47% substrate conversion efficiency.
2.4.3 By-products
Production of hydrogen using photosynthetic bacteria (PNS) is
accompanied by the formation of by-products. These by-products increase the
added value of the overall process. Biomass is one of the by-products. Cells
from photosynthetic are rich in high quality protein, biological-factors and
vitamins (of the group B) (Koyabashi and Kurata, 1978). Proteins of R.
capsulata are shown to be rich in essential sulphur and amino acids with high
lysine content (5.4%), thus can be used as a complementary diet of animals
because cereals are poor in lysine content Vrati (1984).
Poly-3-hydroxybutyrate (PHB) is another important by-product of the
hydrogen production process. It is the simplest poly-3-hydroxyalkanoate and a
biodegradable thermoplastic that is synthesized by bacteria during
unfavourable growth conditions; under stress conditions during stationary
phase of growth. It is used as a storage material by the bacteria and its
accumulation depend on the carbon substrate, nitrogen availability and the pH
of the medium. Under ammonium and nitrogen poor conditions, using acetate
as carbon source, high levels of PHB were produced by R. sphaeroides (Krahn
et al., 1996). The thermoplastic properties of PHB and its biodegradability
make it a suitable substitute for petrochemical plastics. Also, it can be
industrially used in the construction of biodegradable carriers for long-term
dosages, either in the agriculture for herbicides and insecticides, or in the
medical field for drugs and also for surgical sutures (Khatipov et al., 1998;
Yiğit et al., 2000; Suludere, 2001).

21
Another significant by-product is the carotenoid pigments. They are
essential in photosynthesis as they transfer nearly half of the absorbed light
energy to bacteriochlorophyll. They also prevent the photoinhibitory effects of
the sun on bacteria and enable photosynthesis to occur under oxygenic
atmosphere. They are a class of hydrocarbons (carotene) and their oxygenated
derivatives (xanthophylls). Carotenoids have been used commercially during
cancer chemoprevention, as a food colorant, natural antioxidant and provitamin
A source.
2.5 Acetate as a Substrate
PNS bacteria can utilize different low molecular weight organic acids
such as for hydrogen production under anaerobic conditions. As discussed in
the hydrogen production metabolism (Section 2.4.1), organic acids such as
malate, lactate, butyrate and acetate act as carbon sources (electron donors).
Shown below are equations relating to conversion of some organic acids to
hydrogen and carbondioxide.
3 6 3 2 2 2
4 6 5 2 2 2
4 8 2 2
Lactate: C H 3O 3H O 6H 3CO (8) Malate: C H O 3H O 6H 4CO (9)Butyrate: C H 8O 6H O
+ → ++ → +
+ 2 2
2 4 2 2 2 2
10H 4CO (10)Acetate: C H O 2H O 4H 2CO (11)
→ ++ → +
A substrate conversion efficiency of 20-100% from organic acids to
hydrogen was shown among purple non-sulfur bacteria (Segers et al., 1983;
Stevens et al., 1986). Nitrogen sources like glutamic acid contain carbon and
hydrogen that can be utilized by the photosynthetic bacteria. This would lead to
substrate conversion efficiencies of over 100%. Sasikala et al. (1990), observed
over 100% substrate conversion efficiency using R. sphaeroides and malate as
feed. They attributed this to the existence of endogenous substrates which acted
as electron donors for hydrogen production. Endogenoous substrates are known
to act as electron donors for hydrogen formation (Ormerod et al., 1961;
Hillmer and Gest, 1977). In this study, calculations on the substrate conversion

22
efficiencies were made with regards to acetate and glutamate. Glutamate
contains five carbon atoms per nitrogen atom and so is a significant additional
carbon source for the bacteria at high concentrations.
The use of expensive synthetic culture media used in the laboratory
experiments is not practical and cheap organic substrates must be used. These
are mostly residual wastes from the food industry or waste water with high
levels of organic compounds (Rocha et al., 2001). Several studies have been
done on hydrogen production using PNS bacteria from wastes; ranging from
starch, sewage sludge, whey, waste water of milk, vegetable juice and olive
mill wastes (Sasikala et al., 1991; Türkaslan et al., 1998; Zhu et al., 1999;
Yetiş et al., 2000; Eroğlu, 2006). However, major components of waste waters
are carbohydrates and proteins but photosynthetic bacteria can more effectively
use low molecular organic compounds as carbon sources. The combination of
dark and photo fermentative hydrogen production is a proposed solution
(Mao et al., 1986; Sasaki et al., 1998). Low organic substrates produced in the
dark fermentation are utilised in the photo fermentation.
Malate and lactate have been reported as the most favorable substrates
giving the highest hydrogen production (Hillmer and Gest et al., 1977, Kim et
al., 1980; Miyake et al., 1984, Sasikala et al., 1997; Eroğlu et al., 1999).
However, little is known about the conversion of acetic and butyric acids to
hydrogen by PNS bacteria (Segers et al., 1983; Sasaki et al., 1998). Enzymes
for the glyoxylate cycle were found to be present when R. capsulatus was
grown in acetate containin medium (Fuller et al., 1961, Wilson et al., 1988).
Acetate is a prime substrate for photoheterotrophic bacteria because of
several reasons. Firstly, energy from light enables photoheterotrophic bacteria
to overcome the thermodynamic barrier in the conversion of acetic acid to
hydrogen (Akkerman et al., 2002). Acetate is a central intermediate in the
overall carbon cycle and it enters the central metabolism at the level of acetyl-
coenzyme A. Acetyl-CoA, a thioester between Coenzyme A (an acyl group
carrier) and acetic acid, is a very important molecule in the TCA cycle as its
main task is conveying the carbon atoms within the acetyl group to the citric

23
acid cycle to be oxidized for energy production. Also, acetate and butyrate are
the dominant products of the dark fermenataion process (Segers et al., 1981).
Therefore, the use of acetate enables a possibility of integrating dark
fermentation with photofermentation to achieve high hydrogen production.
Moreover, acetate is cheaper and available compared to other substrates like
malate.
There are several studies done on hydrogen production from acetate by
photosynthetic bacteria. Kuriuki et al. (1998) investigated hydrogen production
from batch cultures of Rhodobacter sphaeroides RV with acetate, propionate,
lactate, butyrate and valerate. Despite being completely utilised, no hydrogen
production was observed. This indicated that it was converted to other
component such as PHB.
Rocha et al. (2001) obtained maximum hydrogen production rate at 25
ml H2/l.h on acetate using Rhodopseudomonas sphaeroides. A decrease in
acetate concentration from 22 to 11 mM resulted in a decrease in the hydrogen
evolved from 214 to 27 ml H2 per vessel.
Shi and Yu (2006) studied hydrogen production by Rhodopseudomonas
capsulata using acetate, propionate and butyrate, and a mixture of the three
organic acids (1.9 g/l acetate, 0.4 g/l propionate and 0.8 g/l butyrate. Highest
hydrogen yield of 0.65 and maximum hydrogen production rate of 17.7 ml/l.h
was obtained using acetate feed. An increase in acetate and propionate
concentration led to an increase in hydrogen production. Hydrogen yield of
0.34 and maximum production rate of 14.5 ml/l.h was obtained in the
combined organic acid mixture. The consumption order
acetate>propionate>butyrate was obtained for the combined organic acid
mixture.
Asada et al. (2008) investigated hydrogen productivity from acetate by
agar-immobilized photosynthetic bacteria under illuminated conditions.
Among the five tested strains, Rhodobacter sphaeroides RV gave highest yield
hydrogen yield of 2.81 mol H2 per mol of acetate using 21mM acetate. They
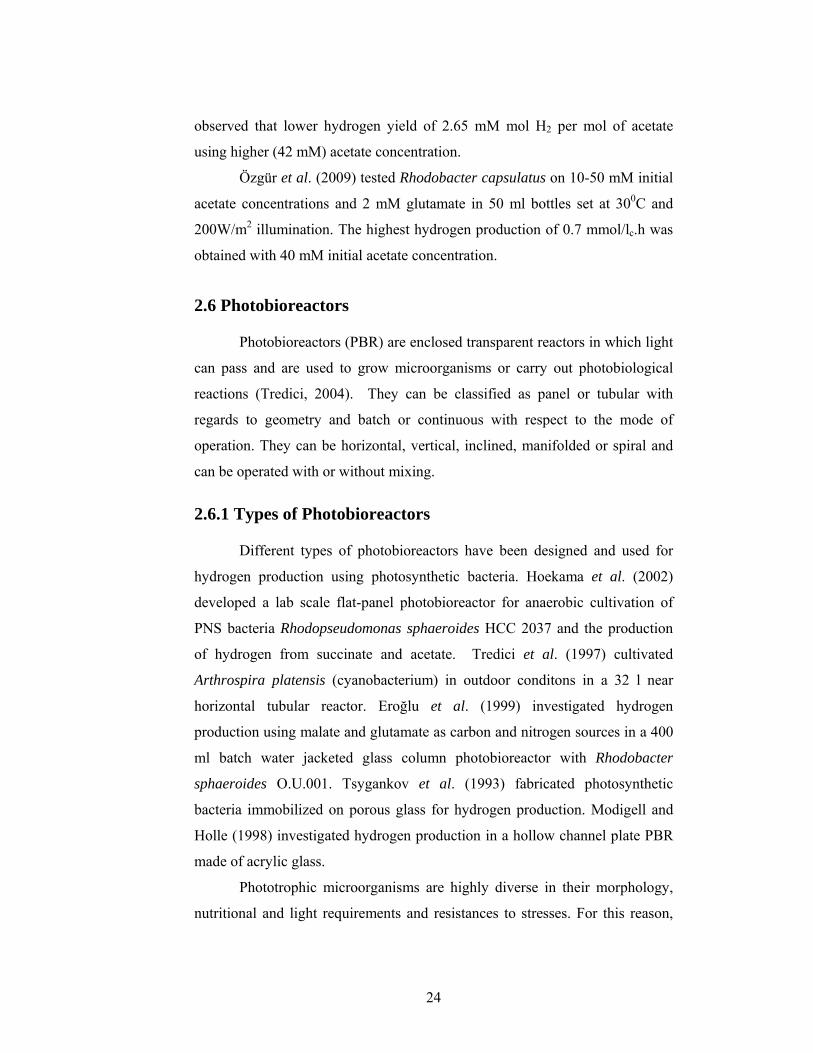
24
observed that lower hydrogen yield of 2.65 mM mol H2 per mol of acetate
using higher (42 mM) acetate concentration.
Özgür et al. (2009) tested Rhodobacter capsulatus on 10-50 mM initial
acetate concentrations and 2 mM glutamate in 50 ml bottles set at 300C and
200W/m2 illumination. The highest hydrogen production of 0.7 mmol/lc.h was
obtained with 40 mM initial acetate concentration.
2.6 Photobioreactors
Photobioreactors (PBR) are enclosed transparent reactors in which light
can pass and are used to grow microorganisms or carry out photobiological
reactions (Tredici, 2004). They can be classified as panel or tubular with
regards to geometry and batch or continuous with respect to the mode of
operation. They can be horizontal, vertical, inclined, manifolded or spiral and
can be operated with or without mixing.
2.6.1 Types of Photobioreactors
Different types of photobioreactors have been designed and used for
hydrogen production using photosynthetic bacteria. Hoekama et al. (2002)
developed a lab scale flat-panel photobioreactor for anaerobic cultivation of
PNS bacteria Rhodopseudomonas sphaeroides HCC 2037 and the production
of hydrogen from succinate and acetate. Tredici et al. (1997) cultivated
Arthrospira platensis (cyanobacterium) in outdoor conditons in a 32 l near
horizontal tubular reactor. Eroğlu et al. (1999) investigated hydrogen
production using malate and glutamate as carbon and nitrogen sources in a 400
ml batch water jacketed glass column photobioreactor with Rhodobacter
sphaeroides O.U.001. Tsygankov et al. (1993) fabricated photosynthetic
bacteria immobilized on porous glass for hydrogen production. Modigell and
Holle (1998) investigated hydrogen production in a hollow channel plate PBR
made of acrylic glass.
Phototrophic microorganisms are highly diverse in their morphology,
nutritional and light requirements and resistances to stresses. For this reason,

25
PBRs cannot be designed to fit all their conditions (Tredici et al., 2004).
However, the development of a PBR, which ensures a simple design, low
material and production costs and high utilization of sunlight within the
optimum wavelength range, is targeted for sustainable hydrogen production.
The modes of operation, size, geometry and the position (orientation) of the
photobioreactor are the most important design parameters (Wakayama et al.,
1998; Tredici et al., 1999). Photobioreactors with increased surface-to-volume
(S/V) ratio built by applying flat-plate or tubular types can utilize irradiated
light energy efficiently (Nakada et al., 1995; Ogbanna et al., 1995).
Flat panel photobioreactors facilitate the measurement of irradiance at
the culture surface hence are commonly used in the laboratory (Tredici, 2004).
They consist of a rectangular transparent box with a depth of 1-5 cm. The
height and width can be varied and so far panels with height and width less
than 1 m have been studied (Akkerman et al., 2002). An advantage of the flat
panel PBRs is that they can be tilted (oriented) at optimal angles for maximum
exposure to direct light (Tredici and Zitelli, 1997; Richmond et al., 1999).
Also, they can be arranged in a stack close to each other therefore providing a
large illuminated area in a small ground area. The packed arrangement allows a
five-fold dilution of solar radiance at the surface, an effect called lamination,
which greatly enhances the efficiency of conversion of solar radiance into
biomass (Carlozzi, 2000; Richmond and Zhang, 2001). Temperature
distribution experiments demonstrated that a 25 cm gap between the flat panel
PBRs was optimal for hydrogen production. With the 25 cm spacing, the
maximum temperature of the culture remained close to the physiological limit
(320C) at the occurrence of the highest day time temperature (Gebicki et al.,
2007). Moreover, the flat panel PBRs are flexible and easy to scale-up.
A disadvantage of flat panel PBRs is the lack of mixing. Mixing
ensures uniform distribution of cells and feed medium, thus enabling efficient
growth and utilization of substrates leading to high productivity. Zabut et al.
(2006) observed that stirring increased the total gas produced and enhanced
hydrogen production rate in 400 ml water-jacketed-glass column

26
photobioreactor. However, mixing can be achieved in these systems using gas
introduced via perforated tube at the bottom and bubbled into the reactor
(Akerman et al., 2003).
Arai et al. (1998) investigated hydrogen production by Rhodobacter
sphaeroides RV using lactate and propionate as carbon sources. Hydrogen
production rate of 12.5 ml H2/lc.h was obtained in a 4.4 l photobioreactor made
of acrylic resin.
Nakada et al. (1998) examined hydrogen evolution at various light
penetration depths in flat panel PBR using R. sphaeroides. The photobioreactor
comprised four compartments (each 5mm apart) of bacterial suspension. They
found that 69% of the incident light energy was absorbed in the first
compartment (0-5mm) and 21% was absorbed in the second (5–10 mm).
Zhang et al. (1999) evaluated the ability of a photobioreactor to fix CO2
using the thermophilic cyanobacterium, Synechocystis aquatilis SI-2. They also
investigated the effects of orientation of the vertical flat panel PBRs made of
transparent acrylic plastic and observed that an east-west facing orientation had
1.4 fold higher productivity than a north-south orientation. This was because
more solar energy was received in the former orientation.
Ogbonna et al. (1999) installed a device for collecting solar light and
distributing it inside a stirred bioreactor through optical fibers. A light tracking
sensor that rotated the lenses with the position of the sun was set up. The
system was integrated with the electric gridline and used to cultivate
C. sorokiniana IAM C-212. The stirred tank agitation speed and cultivation
temperature were 120 rpm and 36°C respectively. An average linear growth
rate of 0.11 g/l.day during cloudy days and at night was obatined. This value
was still lower than the growth rate obtained on sunny days (0.3 g/l.day), but it
provided a solution to the problems of night biomass loss and low productivity
on cloudy days.
Uyar et al. (2007) studied the effect of light intensity and light
wavelength on the growth and hydrogen production of R. Sphaeroides
O.U. 001 in gas-tight glass photobioreactors with defined medium. It was

27
found that the rate of hydrogen production increased with increasing light
intensity and reached saturation at around 270W/m2. Also, the lack of infrared
light (750–950 nm wavelength) decreased photoproduction of hydrogen by
39%.
Eroğlu et al. (2008) investigated the performance of an 8 l flat plate
solar bioreactor operating in outdoor conditions. They used different organic
acids (malate, lactate and acetate) and olive mill waste as carbon sources for
R. sphaeroides O.U.001. Highest hydrogen production (0.01 l/l/h) was obtained
with malate and formate formation was observed as the fermentation end
product. Acetate resulted in low hydrogen gas production and high PHB
accumulation.
2.6.2 Materials of Construction
Materials of construction of photobioreactors should be transparent to
allow light to pass and be utilized by the microorganism for growth and
hydrogen production. The materials should also lack toxicity. Chemically
stable (unreactive) and metal free materials are recommended because some
metals like nickel and iron are known to activate hydrogenase enzyme and
inhibit hydrogen production. In addition, the materials should be durable, have
high mechanical strength, be easy to clean and available at low cost. Several
materials for constructing PBRs are discussed.
Glass is considered a very good material for the construction of panel
PBRs because of its transparency, low hydrogen permeability and long lifespan
(10 years). However, it is brittle, rigid, heavy and not workable, thus not
suitable for large scale systems (Burgess et al., 2004).
Polymethyl methylacrylate (PMMA or Pleksiglas) is another suitable
material for panel PBR construction. It is highly transparent thermoplastic with
a density of 1,150–1,190 kg/m3; less than half the density of glass. It is soft and
easy to work with. It transmits 92% of visible light (3 mm thickness) and filters
ultraviolet (UV) light wavelengths below 300 nm while allowing infrared light
of up to 2800 nm wavelength to pass. Also, it is weather resistant and can
28
withstand outdoor conditions better compared to other plastics such as
polycarbonate. However, it is brittle, inflexible and has higher hydrogen
permeability compared to glass. A wall thickness of 4 mm minimum is needed
to avoid leakage and cracking due to mechanical stress. It has a shorter lifespan
(1-2 years) compared to glass (Burgess et al., 2004).
Low density polyethylene (LDPE) is a flexible thin material. It is
widely used in greenhouse covering, which has similar requirements as the
PBR; high visible light and near infrared transmission, low UV transmission
and low cost (Hussain et al., 2004). A major disadvantage of the LDPE is that
with the reduced wall thickness, hydrogen permeability through the walls gains
influence on the gas collected. Also, it has a short lifespan (1 year) (Burgess et
al., 2004).
2.7 Ammonium Ion Removal Using Clinoptilolite Zeolite
Ammonium ion is an inhibitor to the nitrogenase enzyme of PNS
bacteria such as Rhodobacter capsulatus as described in Section 2.4.2. High
ammonia concentrations repress nitrogenase expression and activity, but it
recovers once the excess ammonia concentrations decrease (Gogotov, 1986 and
Zorin, 1986). Hydrogen production by R. capsulatus grown on acetate and
NH4Cl as carbon and nitrogen sources was tested at different ammonium
chloride concentrations; feed medium containing 30 mM acetate and 1 mM, 2
mM, 4 mM and 8 mM NH4Cl was used. Biomass increase with increasing
NH4Cl concentration was observed. pH also increased with increasing biomass
and hydrogen production decreased. Significant hydrogen production was
observed at 1 mM NH4Cl (Uyar, 2008).
The DFE effluent from the dark fermentation process contains high
amounts of ammonium (9-12 mM) that is not suitable photo fermentation
process. To be able to utilize the DFE, it was proposed to reduce the
ammonium concentration in the DFE using clinoptilolite zeolite.

29
Clinoptilolite Zeolite
Clinoptilolite is a natural zeolite with microporous arrangement of
silica and alumina tetrahedral channels contains exchangeable cations such as
K+, Na+, Mg2+, Ca2+.1 It is a silica rich member of heulandite family of zeolites
and has Si/Al ratio of greater than 4. It has the structure
(Na, K, Mg)6(Al6Si30O7).24H2O and is mostly enriched with potassium and
sodium ions (Breck, 1971; Szostak, 1984). It is the most abundant natural
zeolite and is found with high purity in large mineable quantities, in different
parts of the world (Mumpton, 1978; Ouki et al., 1994; Sarıoğlu, 2005). In
Turkey, there are large reserves of clinoptilolite and other zeolites.
Clinoptilolites deposits can be found in Bigadiç, Balıkesir and Gördes, Manisa.
Surveys have shown that about 20 million tons of Gördes clinoptilolite are
available (Moralı, 2006).
Clinoptilolite is known to have high selectivity for certain cations; Pb+2,
NH4+1, Cd+2 , Co+2 Cr+2, Fe+2, Cs+1 and Na+1. Due to its affinity for heavy
metals, it has been investigated by many researchers for removal of various
heavy metal ions and ions in waste water (Semmens and Seyfarth, 1978; Jama
and Yücel, 1989, Zamzow et al., 1990; Ouki and Kavannagh, 1999, Abusafa et
al., 2002; Çulfaz and Yağız, 2004, Inglezakis and Grigoropoulou, 2004).
Gördes clinoptilolite was shown to have Pb+2> NH4+1 >Na+1 (Aşiroğlu, 2006).
Applications of clinoptilolite have been mainly in the removal of heavy metals
like Pb2+ and Cd2+ of ions, radioactive 137Cs+ and 90Sr2+ and ions (NH4+) from
waste water streams.
Clinoptiloite exists in two forms; natural and synthetic. The natural
form is highly selective but has a low ion exchange capacity while the
synthetic one has a high ion exchange capacity but a low selectivity. In this
study, natural Gördes clinoptilolite is used. Before usage, pretreatment of the
zeolite was mandatory. Pretreatment improves the zeolite’s ion exchange
ability by replacing the exchangeable cations in the zeolite with more easily
removable ones (Inglezakis et al., 2001). The Gördes clinoptilolite was batch

30
pretreated. Shown in Appendix J are the chemical composition and a scanning
electron micrograph of the original Gördes Clinoptilolite.
2.8 Objectives of This Study
Studies done by the METU Biohydrogen Group showed that
Rhodobacter capsulatus (DSM 1710) had a better stability and performance in
acetate containing media, compared to the other PNS bacteria the group
worked on; Rhodobacter sphaeroides and Rhodospirillum rubrum. Good
growth and high hydrogen production was obtained in batch experiments with
feed medium containing 40 mM acetate and 7.5 mM lactate as carbon sources
and 2 mM glutamate as nitrogen source (Uyar, 2008). Further indoor
experiments using Rhodobacter capsulatus (DSM 1710) strain showed that the
removal of lactate from the feed did not influence hydrogen productivity
significantly in indoor continuous photobioreactors (Avcıoğlu et al., 2009).
Also, Rhodobacter capsulatus YO3 (Hup-), a mutant strain lacking the uptake
hydrogenase enzyme developed by the group (Öztürk, 2005), portrayed better
growth and gave higher hydrogen productivities in indoor and outdoor
conditions compared to the Rhodobacter capsulatus (DSM 1710) strain
(Özgür et al., 2009). Moreover, during the summer of 2008, a heat adapted
strain of the R. capsulatus (DSM 1710) was achieved after 6 generations under
40-450C daytime temperatures. The experiments on the Rhodobacter
capsulatus strains were carried out in batch photobioreactors, so their
performance in continuously operated systems remained to be assessed.
In this study, three strains of Rhodobacter capsulatus; Rhodobacter
capsulatus (DSM 1710), heat adapted Rhodobacter capsulatus (DSM 1710)
and Rhodobacter capsulatus YO3 (Hup-), were tested for stable and high
hydrogen production using 8 l continuous panel photo bioreactors operated in
outdoor conditions. Defined hydrogen production medium containing acetate
(40 mM) and glutamate (2 mM) was used as feed. The experiments were
carried out between September-December 2008. Results were assessed with
regards to hydrogen productivity, substrate conversion efficiency and acetate

31
conversion. The findings from the outdoor experiments led to further research
on optimization of the feed composition for the Rhodobacter capsulatus YO3
(Hup-) strain. Different feed compositions containing acetate (40-80 mM) and
glutamate (2-10 mM) were examined to obtain a stable biomass and hydrogen
production. The optimization of the feed in the continuous systems can help
understand the relationship between cell growth, hydrogen production rate and
substrate concentration which will be beneficial in developing kinetic models
that can be applied in large scale hydrogen production.
Another part of this study was the reduction of ammonium ion content
in the dark fermenter effluents (DFEs) using clinoptilolite zeolite. The dark
fermentation process effluents contain high amounts of ammonium (9-12 mM)
that is not suitable for photofermentation process. High ammonia
concentrations repress nitrogenase expression and activity of the
photosynthetic bacteria (Gogotov, 1986 and Zorin, 1986). No hydrogen
production was observed in the DFE of sugar-beet thick juice molasses
containing over 1 mM ammonium ion concentration. Therefore, it was aimed
to reduce the ammonium concentration in the DFE using clinoptilolite zeolite.
Clinoptilolite is a natural zeolite with microporous arrangement of
silica and alumina tetrahedral channels. It contains exchangeable cations such
as K+, Na+, Mg2+, Ca2+.1 It has a high selectivity for ammonium ions and is
mostly used in the removal of heavy metals like Pb2+ and Cd2+ ions from waste
water streams. Gördes clinoptilolite type zeolite was used in this study. It was
pretreated using NaCl solution to enhance its ions exchange capacity. The
zeolite and DFE of sugar-beet thick juice molasses were treated using batch
procedure.
32
CHAPTER 3
MATERIALS AND METHODS
3.1 The Microorganisms
Rhodobacter capsulatus wildtype (DSM 1710), heat adapted
Rhodobacter capsulatus (DSM 1710) and Rhodobacter capsulatus YO3 (Hup-)
photosynthetic bacterial strains were used in this study. Rhodobacter
capsulatus (DSM 1710) was obtained from Deutsche Sammlung von
Mikroorganismen (DSM, Braunsweig Germany). The heat adapted
Rhodobacter capsulatus (DSM 1710) strain was obtained through six passages
done on natural adaptation of the bacteria grown in outdoor conditions, under
natural sunlight. The natural adaptation procedure is described in Appendix M.
Rhodobacter capsulatus YO3 (Hup-), a mutant strain lacking the uptake
hydrogenase enzyme (Hup-), was genetically modified by Dr. Yavuz Öztürk
(GMBE, TÜBİTAK-MAM, Gebze) from Rhodobacter capsulatus MT1131
(Öztürk et al., 2006).
3.2 Culture Media
3.2.1 Growth Media
Acetate (20 mM) and glutamate (10 mM) were added to the standard
basal medium (Biebl and Pfennig, 1981) as carbon and nitrogen sources
respectively. The component amounts in the growth media are shown in
Appendix A. The C/N ratio of the growth medium has been approved using
elemental balances as shown in Appendix B. The formula for R. capsulatus is
taken as CH1.76O0.38N0.14 as suggested by Hoekama et al. (2002). In preparing
the growth medium, the components were dissolved in distilled water and the

33
pH set to 6.3-6.4 by adding 5 M NaOH. The solution was then sterilized by
autoclaving. Vitamin, trace elements and iron-citrate were added to the solution
in a sterile cabin after autoclaving.
3.2.2 Hydrogen Production Media
Similar to the growth media, the hydrogen production media comprised
the standard basal medium and acetate and glutamate as carbon and nitrogen
sources respectively. Different acetate (40-80 mM) and glutamate (2-4 mM)
concentrations were used in the experiments. By changing their amount, the
C/N ratio is changed as shown in Table 3.1.
Table 3.1 C/N ratio constants for different acetate and glutamate
concentrations.
Acetate (mM) Glutamate (mM) C/N Ratio
20 10 9 a 40 2 45b 40 3 32 b 40 4 25 b 60 3 45 b 60 4 35 b 80 4 45 b
a) Ratio in the growth medium.
b) Ratio in the hydrogen production medium.
The hydrogen production media was prepared in the same way as the
growth media, the main difference being in the amount of acetate and
glutamate concentrations used.

34
3.3 Experimental Setup for Hydrogen Production
The hydrogen production experiments were carried out in panel
photobioreactors. The 8 l photobioreactors with 0.5 m x 0.4 m x 0.04 m
dimensions were made of 6 mm transparent acrylic sheet (Plexiglas). As shown
in Figure 3.1, each reactor had three ports at the top and two at the side wall.
The outlets at the top of the photobioreactor are for gas collection, temperature
probe and feeding purposes. The side wall ports are used for sampling.
Figure 3.1 The panel photobioreactor, Port (1) medium feeding, Port (2)
temperature probe, Port (3) gas collection and Port (4, 5) sampling.
3.3.1 Indoor Experiments
The indoor hydrogen production experiments were done under
continuous illumination and controlled temperature. Four 60 W tungsten
lamps, two placed on each side of the vertical photobioreactor, were used to
provide 1500-2500 lux (86-143 W/m2) light intensity. The room temperature
was controlled using an air conditioner (Vestel SX-12 Wall split model) and
the photobioreactor temperature was kept constant between 30-32 0C. The gas
evolved was collected in a water filled graduated glass column connected to the
top of the photobioreactor using polyurethane tubing. Shown in Figure 3.2 is
the indoor experimental setup.
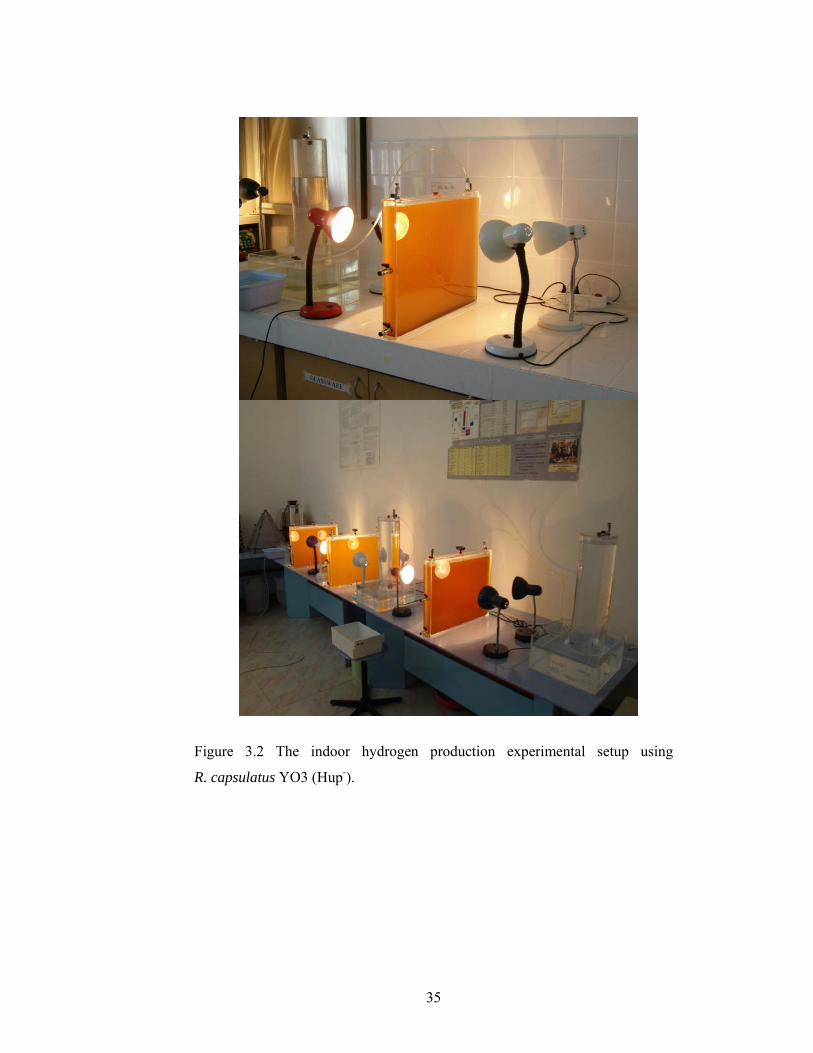
35
Figure 3.2 The indoor hydrogen production experimental setup using
R. capsulatus YO3 (Hup-).

36
3.3.2 Outdoor Experiments
In the outdoor experiments, the photobioreactors were operated under
natural sunlight conditions. They were placed 20cm apart in an east-west
facing position on a metallic construction. The east-west position was to enable
optimum heat input and light intensity utilization. An online temperature probe
(Elimko) connected to a computer was used to continuously measure the
photobioreactor and air temperature. Gas collection was done in a water filled
graduated glass column. The outdoor experiments were carried out between
September-December, 2008. On the onset of winter, the photobioreactors were
moved to a glasshouse. Shown in Figure 3.3 is an outdoor experimental setup.
Figure 3.3 The outdoor hydrogen production experimental setup. (1, 2)
Rhodobacter capsulatus YO3 (Hup-), (3) Heat adapted Rhodobacter capsulatus
(DSM 1710) and (4) Rhodobacter capsulatus (DSM 1710).
1 2 3 4

37
3.3.3 The Glass house
The glasshouse is a green house without climatization. Its dimensions
are 5 m x 4 m x 3 m and is made of transparent glass. It is connected to a
container on one side in which a computer used for continuous temperature
measurement is kept. During summer, the glasshouse is covered with a
greenhouse material to provide shading. The shading material has been shown
to pass light at wavelength between 400-900 nm and decrease light intensity by
approximately 60% (Uyar, 2008). In winter, during the day, no heating or
cooling is applied, but at night, when outside temperatures drop below 00C, the
glass house is heated using a heater (Alaadin LX 2886, 2kW heater). This
prevents the photobiorecators from freezing and rupturing. Shown in Figure 3.4
are the outdoor experiments in the glasshouse in winter, 2008.
Figure 3.4 Outdoor experiments in winter, 2008.

38
3.4 Experimental Procedure
3.4.1 Preparation of the Bacterial Inoculum
The bacterial inoculum for the hydrogen production experiments was
prepared in two steps. The first step was the activation of the bacteria. The
original bacteria that were glycerol stocked and stored in vials at -800C were
streak plated on sterile 20 ml plates containing agar solution and 20 mM/10
mM Ac/Glu growth medium. This was done in a sterile cabin to prevent
contamination. The agar plates were then placed in an incubator set at 300C and
illuminated with 60W tungsten lamps. The second step was the multiplication
of the inoculum. After growing for about 5 days, visible single bacterial
colonies on the agar plate were transferred into 10 ml vials containing growth
medium. Selection of the single colonies ensured formation of pure cultures
and minimizes the risk of contamination. It took 3-4 days for the bacteria to
grow to the desired mid-logarithmic phase (at around OD 1.0). Then the active
bacterial culture in the 10 ml vials was injected into fresh 100 ml growth
medium using sterile syringes; 10% inoculation of the active bacterial culture.
After 2-3 days, when the bacteria culture was in the mid-logarithmic phase, it
was inoculated to 1000 ml growth medium where it grew for 2-3 days befor
inoculation to the photobioreactors. The passages of the bacteria from the 10
ml to 1000 ml were done with 10% inoculation and the bottles were flushed
with argon to provide anaerobic conditions. All the inoculations were carried
out under sterile conditions in a sterile cabin and using sterile syringes. The
bacterial culture was grown in the incubator set at 300C and illuminated with
60W tungsten lamps.

39
3.4.2 Leakage Test, Cleaning and Sterilization of the Photobioreactors
The photobioreactors were tested for leakage by fully filling them with
water and providing excess liquid pressure using a peristaltic pump. Leakages
at the ports and sides were then checked for. After the leakage test, the
photobioreactors were chemically sterilized using hydrogen peroxide solution.
They were filled with 3% (w/v) H2O2 solution and after waiting for 24 hours,
emptied and thoroughly rinsed off with distilled water.
3.4.3 The Startup Procedure
At the startup of the experiment, 25% bacterial inoculation was
introduced into the photobioreactor. Leaving about 5% headspace, the 8 l
photobioreactor was filled with 5.6 l of 40 mM/2 mM Ac/Glu hydrogen
production medium and inoculated with 1.9 l of active bacterial culture. Then
argon gas was flushed into the system to remove air and make it anaerobic.
Flushing of argon also provides uniform mixing in the photobioreactors. After
flushing, the photobioreactor was connected to the gas collection column and
the bacterial culture was illuminated using tungsten lamps in the indoor
experiments or sunlight in the outdoor experiments. The culture was left to
grow and reach stationary phase (O.D≥1.5) before continuous feeding was
commenced. The startup period covered the period from the photobioreactor
setup and bacterial inoculation to the start of continuous feeding.
3.4.4 Operation
The photobioreactor was operated in fed-batch mode. After startup,
10% v/v daily feeding of hydrogen production medium was started when the
bacterial culture reached the stationary phase (OD≥ 1.5). Liquid samples for
analyses (5 ml) were taken from the side ports on the photobioreactors. During
the startup, samples were taken at fixed regular intervals of 6 hours and after
the start of feeding (continuous operation), sampling and feeding was done at
24 hours interval. Sampling was done before feeding the hydrogen production
40
medium. 800 ml bacterial effluent was removed and 800 ml hydrogen
production medium was fed into the system using sterile 60 ml syringes. The
bacterial effluent was chemically sterilized and discarded.
The daily analyses included cell concentration, pH, organic acid
concentration, bacteriochlorophyll a and temperature readings. Out of the 5 ml
samples taken for analysis, 1.5 ml sample was placed in eppendorfs and
centrifuged at 13400 rpm for 10 minutes. The supernant was transferred to
clean eppendorfs and stored at -200C for organic acid analysis using HPLC.
The residue was discarded. Also recorded daily was the total gas produced. The
gas collection columns were refilled everyday after each reading. Gas samples
were analyzed using gas chromatography.
3.4.5 Shutdown
At the end of the experiments, the photobioreactor was emptied and the
effluent chemically sterilized and discarded. The photobioreactor was washed
with clean water to remove the cell debris.
3.5 Analyses
3.5.1 Cell Concentration
The cell concentration was obtained by measuring the optical density of
the culture using visible a spectrophotometer (Shimadzu UV-1201). The
absorbance of the culture as read at 660 nm. Fresh medium was used as a blank
solution. The absorbance values were converted to dry cell weights by the help
of the calibration curves shown in Appendix C.
3.5.2 pH Analysis
The pH of the liquid samples taken from the photobioreactor was
measured using a standard combination of pH electrode (Mettler Toledo 3311).

41
3.5.3 Temperature Measurement
Temperature in the indoor experiments was measured using a digital
thermometer (Maxi-T) while in the outdoor experiments it was measured using
an online thermometer (Elimko Temperature Monitor). The thermometers were
inserted in the temperature probe located on top of the photobioreactor.
3.5.4 Light Intensity Measurement
Light intensity measurement was done by a luxmeter (Lutron LX-105
Light Meter). In the indoor experiments, using tungsten lamps, the lux-W/m2
conversion was determined as 1 W/m2= 17.5 lux (Uyar, 2008) while in the
outdoor experiments under sunlight, it was determined as 1 W/m2 = 111 lux
(Tabanoğlu, 2002).
3.5.5 Gas Composition Measurement
Gas samples were collected using a gas-tight syringe (Hamilton, 22 GA
500µL gas tight No. 1750) from the gas collection column and analyzed by gas
chromatography. The gas chromatography equipment (Agilent Technologies
6890N) had a thermal conductivity detector and a Supelco Carboxen 1010
column. In the gas analysis, argon was used as a carrier gas at a flow rate of 26
mL/min the oven, injector and detector temperatures were 140 ºC, 160 ºC and
170 ºC, respectively. A typical gas analysis chromatogram is given in
Appendix E.
3.5.6 Organic Acid Analysis
Organic acid analysis was done using HPLC (Shimadzu 10A series) in
the Chemical Engineering Department at the Middle East Technical University,
Ankara, Turkey. Liquid samples were filtered using a 45μm nylon filters
(Millipore, 13 mm) to get rid of impurities. The filtered samples were analyzed
by an Alltech IOA-1000 (300 mm x 7.8 mm) HPLC column. In the analysis,
0.085 M H2SO4 was used as the mobile phase and the oven temperature was
42
kept constant at 66 °C. A low gradient pump (Shimadzu LC-10AT) with a
degasser (Shimadzu DGU-14A) was used to maintain the mobile phase flow
rate at 0.4 ml/min. An autosampler (Shimadzu SIL-10AD) injected 10µl
sample into the system and a UV detector (Shimadzu FCV-10AT) with
absorbance set at 210 nm was used to determine the component separation.
Peak values for the samples were automatically recorded and concentrations
determined manually by constructing calibration curves for different
concentrations of pure organic acid standards. The organic acids measured
were lactic acid, formic acid, acetic acid, propionic acid and butyric acid.
Shown in Appendix F is a sample HPLC chromatogram and a calibration curve
for acetic acid.
3.5.7 Glutamic Acid Analysis
Glutamic acid analysis was carried out using HPLC (Shimadzu LC 20
A- Prominence Series) in the Chemical Engineering Department at the Middle
East Technical University, Ankara, Turkey. Since some amino acids were not
visible at UV wavelenghths because of their low absorbance values,
derivatization of the glutamic acid was necessary to convert it to a UV
recognizable component. Derivatization also helped removed interferences that
may be caused by other components in the solution mixture. Pre-column
derivatization (PITC (phenyl isothiocyanate) derivatization reaction) was
applied in the glutamic acid HPLC analysis. In this process, PITC (acetonitrile
diluted solution) and triethylamine (acetonitrile diluted solution) were used to
derivatize the photobioreactor liquid sample. The mixture was thourougly
mixed and incubated for 20 minutes in an oven set at 400C. It was then
neutralized using aqueous hydrochloric acid solution after cooling to room
temperature. Finally, n-Hexane was used to extract the derivatized sample. The
aqueous phase was injected to the HPLC for analysis. A detailed summary of
the PITC derivatization process is given in Appendix G.
In the HPLC analysis, two mobile phases were used. Mobile Phase A
contained 10 mmol/l KH2PO4 and K2HPO4 buffer while mobile Phase B was a

43
50% v/v diluted acetonitrile solution. The mobile phase was pumped at 1.0
ml/min flowrate using a high pressure gradient pump module (Shimadzu AC-
20AD) having a degasser (Shimadzu DGU-20A5). Teknokroma mediterranea
Sea 18 (150 mm x 4.6 mm, i.d 3μm) C18 HPLC column was used in the
analysis. The column was operated at 400C. 10 μl of the derivatized sample
was injected automatically by the auto-sampler (Shimadzu SIL-20 ACHT) and
a PDA detector (Shimadzu SPD-M20 A) set at absorbance 254 nm was used to
detect the peaks. As in the organic analyses, the sample peak values were
automatically recorded and the concentrations determined manually by
constructing calibration curve for pure glutamic acid standard. Shown in
Appendix G is a summary of the HPLC operation conditions for glutamic acid
analysis, the composition of the mobile phases and derivatization chemicals, a
sample glutamate chromatogram and calibration curve.
3.5.8 Bacteriochlorophyll a Measurement
For the determination of bacteriochlorophyll a content of the bacteria, 1
ml sample from the photobioreactor was centrifuged at 10000 rpm for 10
minutes. The supernatant was then discarded and acetone-methanol mixture
(7:2 v/v) was added for extraction of bacteriochlorophyll a (Cohen-Bazire,
1957). The mixture was vortexed for 1 minute to homogenize. Greater than
92% of the bacteriochlorophyll is extracted by this method (Biel, 1986). After
vortexing, the mixture was centrifuged at 10000 rpm for 10 minutes to remove
the proteins (Hirabayashi, 2006). After 10 minutes, the supernatant was
separated and its absorbance was measured at 770 nm (extinction
coefficient=76 mM-1cm-1) using a spectrophotometer (Shimadzu UV-1201). The
acetone-methanol mixture was used as blank (Clayton, 1966). The cellular
bacteriochlorophyll a content was calculated by considering the cell dry
weight. Shown in Appendix H is a sample calculation for the determination of
bacteriochlorophyll a.

44
3.6 Biomass Recycle
3.6.1 The Biomass Recycle Procedure
800 ml effluent from the photobioreactor was equally divided (200 ml)
into four 250 ml vials in a sterile laminar cabin. The vials were the centrifuged
(Sigma- model 4K15) at 4000 rpm and 200C for 20 minutes. After centrifuging,
the supernatant in the vials were discarded. UNsder aseptic conditions in a
sterile laminar cabin, hydrogen production medium is then added to the vials
containing the packed cells and the mixture shaken to suspend the cells. The re-
suspended cells in the four vials were combined in a calibrated glass bottle and
filled to 800 ml using 40 mM/ 2 mM Ac/Glu hydrogen production medium.
The 800 ml medium containing the bacteria cells were then fed back into the
photobioreactor as decribed in Section 3.4.4.
3.6.2 Determination of the Amount of Biomass Recycle
800 ml effluent from the photobioreactor was equally divided (200 ml)
into four 250 ml vials in a sterile laminar cabin. The vials were weighed before
the effluents were put in them. The effluents were then centrifuged (Sigma –
Model 4K15) at 4000 rpm and 200C for 20 minutes. The supernatant was
discarded after centrifuging. The pellets, together with the vials were dried for
96 hours in an oven set at 600C. Then the vials containing the pellets were
weighed again. The amount of biomass recycled was determined by subtracting
the weight of the empty vials from the total weight of vials and dried pellets.

45
3.7 Ammonium Ion Removal
3.7.1 Gördes Clinoptilolite Batch Pre-treatment Pre-treatment of Gördes clinoptilolite aims to replace the exchangeable
cations such as K+1, Na+1, Mg+2, Ca+2 in the zeolite with more easily removable
ones such as Na+ ions. This improves the zeolite’s effective exchange capacity,
thus a better performance in ion exchange applications.
Clinoptilolite samples obtained from Gördes-Manisa, Turkey, were
batch pre-treated (Bayraktaroğlu, 2006). The samples were first ground and
then sieved to 200-500 µm particle size. 140 g of the sieved samples were
placed in a 500 ml Erlenmeyer flask and 500 ml 1 M NaCl solution added on
it. The solution was then mixed continuously for 3 days using a magnetic
stirrer. Daily, used 500 ml NaCl solution was replaced with fresh 500 ml 1M
NaCl solution. After 3 days, the stirrer was stopped and the zeolite was
separated from the solution through decantation. It was washed using
deionized water to get rid of NaCl traces. Sodium ion presence was checked
using 1 N AgNO3 solution. After washing, the clinoptilolite was dried in an
oven set at 750C for 12 hours.
3.7.2 Dark Fermenter Effluent Ammonium Ion Removal
The pre-treated clinoptilolite was used to reduce the ammonium ions
concentration in a dark fermenter effluent of sugar-beet thick juice molasses.
The DFE composition is given in Appendix K1. Batch treatment was applied.
0.6 g of pre-treated clinoptilolite and 50 ml the DFE sample were put in a
bottle and mixed using a magnetic stirrer. The experimental setup is shown in
Figure 3.5.

46
Figure 3.5 Ammonium ion removal in the dark fermenter effluent of sugar-beet
thick juice molasses using clinoptilolite.
At regular intervals, samples were taken and ammonium ion
concentration was measured using an ammonium ion electrode (Russel Model
95-5129). Before each measurement, the ammonium electrode was calibrated
using 10-4M - 10-1M NH4Cl standard solutions. A sample calibration curve is
shown in Appendix K2. Prepared 10 mM NH4Cl solutions were also batch
treated.
3.7.3 Total Nitrogen Measurement
The total nitrogen content on the molasses DFE before and after
ammonium ion reduction using clinoptilolite was measured. HACH (DR/2400)
Total Nitrogen kit with the low measurement range 0-25 mg/l N was used in
this experiment. Alkaline persulfate digestion method whereby all forms of
nitrogen in the sample were converted to nitrate was applied. Diluted to
samples of molasses (1 mg/l) and 10 mg/l and 25 mg/l NH4Cl standard
solutions were digested. The standard samples were digested to check on the
accuracy of the measuring kit. 10 ml of the samples were placed in vials and
nitrogen persulfate reagent added. The mixture was digested in a COD set at
1050C for 30 minutes. Then sodium metabisulfite was added to eliminate
halogen oxide interferences and then chromotropic acid was added under
47
strongly acidic conditions to react with nitrate to form a yellow complex with
absorbance maximum at 410 nm. The resulting sample was then measured
using HACH spectrophotometer that gave the total N reading in mg/l.
In this method, firstly, the sample was digested (N converted to NO3-)
using nitrogen persulfate reagent pillow. Digestion took place in vials placed in
a COD reactor and run for 30 minutes at 103-1060C. After digestion, sodium
metabisulfite was added to eliminate halogen oxide interferences, and then
chromotropic acid was added and left for 5 minutes for the reaction to go to
completion. The chromotropic acid under strongly acidic conditions reacted
with nitrate to form a yellow complex with absorbance maximum at 410 nm.
The total N amount in the samples was then measured using a HACH
spectrophotomer that gave the total N reading in mg/l. The results were read
with regards to a blank prepared during the experiment.

48
CHAPTER 4
RESULTS AND DISCUSSIONS 4.1 Hydrogen Production in Outdoor Continuous Panel
Photobioreactors with Different R. capsulatus Strains
Hydrogen production experiments using the photosynthetic bacteria
Rhodobacter capsulatus were carried out in continuous panel photobioreactors
in indoor and outdoor conditions. Rhodobacter capsulatus (DSM 1710), heat
adapted Rhodobacter capsulatus (DSM 1710) and Rhodobacter capsulatus
YO3 (Hup-) bacterial strains were tested in outdoor conditions, under natural
sunlight during September-December, 2008. Defined hydrogen production
medium containing the standard basal medium, acetate (40 mM) and glutamate
(2 mM) described in Appendix A was used as feed to the 8 l panel
photobioreactors. A dilution rate of 0.8 l/ day was appplied. The outdoor
experiments showed that Rhodobacter capsulatus YO3 (Hup-) had a high
hydrogen production rate in winter, under the low light intensity and
temperature, but unstable biomass growth. Hence indoor experiments in 8 l
photobioreactors with continuous illumination and controlled temperature were
carried out to optimize the feed composition. Different feed compositions
containing acetate (40-80 mM) and glutamate (2-4 mM) were examined for
stable biomass growth and hydrogen production. In the indoor and outdoor
experiments, 40 mM/2 mM Ac/Glu containing hydrogen production media was
used at startup because it showed good bacterial growth and hydrogen
production in batch experiments with Rhodobacter capsulatus (Özgür et al.,
2009). Since the outdoor photobioreactors were not continuously illuminated,
the hydrogen productivities for the outdoor experiments were determined

49
taking into consideration only the daytime illumination period. The
illumination periods were taken as shown in the Table 4.1.
Table 4.1 Outdoor sunlight illumination periods.
Month Illumination period (hour)
September 12 October 11
November 10 December 8
4.1.1 Continuous Panel Photobioreactor with R. capsulatus (DSM 1710)
An 8 l outdoor photobioreactor with R.capsulatus DSM (1710) bacterial
strain was operated in September, 2008. The PNS bacteria was grown as
described in Section 3.4.1 and the photobioreactor started using the procedure
stated in Section 3.4.3. 24% bacterial inoculation and hydrogen production
medium containing 30 mM acetate and 2 mM glutamate was introduced into
the photobioreactor at startup. The system was started in indoor conditions to
enable easier growth of the bacteria as the high outdoor temperatures (35-40 0C) in September would hinder proper growth. In the indoor conditions,
illumination (1500 lux~86W/m2) was provided by four 60W tungsten lamps
and the room temperature was controlled by an air conditioner. After
inoculation, the photobioreactor was operated in batch mode (Phase I) with no
media feeding until the bacteria reached stationary phase at 1 gdcw/lc on the 4th
day. Biomass grew at 0.019 h-1. Then the system was moved to outdoor
conditions and continuous feeding was introduced. The photobioreactor was
continuously fed using the hydrogen production medium containing acetate (40
mM) and glutamate (2 mM) and a dilution rate of 800 ml (10% v/v) for 17
days. Shown in Figure 4.1 is the biomass growth and cumulative hydrogen
50
production for the experiment. Stable biomass growth was obtained at 1
gdcw/lc in Phase II. The hydrogen production rate at the startup was high (2.2
l/day) due to continuous illumination and controlled temperature (30-320C).
After moving to the outdoor conditions and beginning of continuous feeding on
the 4th day, the highest hydrogen production rate decreased to 0.4 l/day. This
was due to the slight decrease in temperature and light intensities in outdoor
conditions as shown in Figures 4.2 and 4.3 respectively. Hydrogen production
levels have been shown to vary with changing light and temperatures in
outdoor conditions (Wakayama et al., 1998; Özgür et al., 2009). In the outdoor
conditions, high daytime temperatures averaging 350C and low temperatures at
night (100C) were experienced in the month of September, 2008 as shown in
Figure 4.2. The daily sunlight intensities in Ankara ranged 1.5-5.5 kwh/m2.day
during this period as shown in Figure 4.3.
However, on the 9th day, the hydrogen production rate increased to 1.1
l/day. The increase can be attributed to the bacteria adapting to the outdoor
conditions and the light/dark cycle. Light/dark cycle has been stated to
stimulate hydrogen production (Koku et al., 2003; Uyar et al., 2007). The
productivity dropped again at the end of the month with decreasing light
intensities and temperatures as seen in Figures 4.2 and 4.3. The average
hydrogen productivities at the startup (Phase I) and in continuous operation
(Phase II) were 320 ml H2/lc.day and 92 ml H2/lc.day respectively. Gas
chromatography results showed that the total gas produced was 90-95%
hydrogen with the rest being carbondioxide.

51
Figure 4.1 The biomass growth and hydrogen production for R. capsulatus
(DSM 1710) CPBR experiment (13th September, 2008 – 3rd October, 2008).
Figure 4.2 The photobioreactor temperature variation and cumulative hydrogen
production in the R. capsulatus (DSM 1710) CPBR experiment (13th
September, 2008 – 3rd October, 2008).

52
Figure 4.3 Daily average sunlight intensity and cumulative hydrogen
production in the R. capsulatus (DSM 1710) CPBR experiment (13th
September, 2008 – 3rd October, 2008). Sunlight intensity data was obtained
from the National Meteorology Institute of Turkey.
The pH of the photobioreactor ranged between 7.4 and 7.6, which is in
the optimum range for hydrogen production (Sasikala et al., 1993, Arik et al.,
1996). The pH change is shown in Figure 4.4.

53
Figure 4.4 The change in pH in the R. capsulatus (DSM 1710) CPBR
experiment (13th September, 2008 – 3rd October, 2008).
Shown in Figure 4.5 is the organic acid utilization in the R. capsulatus
(DSM 1710) photobioreactor. It is observed that acetic acid was steadily
consumed at the startup in Phase I as the bacteria grew. A substrate conversion
efficiency of 35% and acetate conversion of 74% were obtained in this phase.
In Phase II, after the introduction of continuous feeding, acetic acid
concentration averaged 3 mM. The acetate conversion increased to 87% as
bacteria utilized most of the acetic acid for hydrogen production and survival.
28% substrate conversion efficiency was obtained. Also, it is observed that
there was a slight increase in acetic acid after the 15th day. This could be due to
the decrease in temperatures and light intensities at the end of the month as fall
approached as seen in Figures 4.2 and 4.3. Lactic acid, formic acid, propionic
acid and butyric acid were formed in very low amounts. Summarised in Table
4.2 is the results of the outdoor panel photobioreactor using R. capsulatus
(DSM 1710).

54
Figure 4.5 Organic acid utilization in the R. capsulatus (DSM 1710) CPBR
experiment (13th September, 2008 – 3rd October, 2008).
4.1.2 Continuous Panel Photobioreactor with Heat Adapted R. capsulatus (DSM 1710)
An outdoor experiment using heat adapted R. capsulatus (DSM 1710)
was carried out in a continuous 8 l panel photobioreactor. The panel
photobioreactor was started in outdoor conditions with 14% bacterial
inoculation and hydrogen production medium containing 40 mM / 2 mM
Ac/Glu. Continuous feeding was started on the 7th day when the biomass
reached 0.94 gdcw/lc. A daily 800 ml (10%) hydrogen production medium
containing acetate (40 mM) /glutamate (2 mM) was fed continuously. This
experiment was carried out between September-December, 2008.
Shown in Figure 4.6 is the biomass growth and cumulative hydrogen
production of the heat adapted bacteria. Steady biomass growth at a rate of
0.012 h-1 is observed in Phase I. The cell dry weight fluctuated between 1.1-
0.75 gdcw/lc in Phase II after the start of continuous feeding. Temperatures
ranged between 15-300C in this phase as shown in Figure 4.7. In Phase III, due
to the onset of winter on the 53rd day, the PBR was moved to a glasshouse to

55
prevent the bacteria from freezing. Electric heaters were used at night to
maintain temperatures above 00C as described in Section 3.3.3. During this
period the sunlight intensity ranged between 0.5-3 kwh/m2.day as seen in
Figure 4.8. Biomass stabilized at around 0.75 gdcw/lc and eventually decreased
to 0.45 gdcw/lc . The maximum hydrogen production rate observed at startup
(Phase I) was 1.34 l/day but it decreased to 0.60 l/day in Phase II with
continuous feeding. The production rate further decreased to 0.45 l/day in
Phase III. This decrease is attributed to the decrease in temperature and light
intensities in the outdoor conditions as shown in Figures 4.7 and 4.8
respectively. Average hydrogen productivities of 60, 72 and 40 ml H2/lc.day
were obtained inPhases I, II and III respectively. Gas chromatography results
showed that the total gas produced in this experiment was 90% hydrogen with
the rest being carbondioxide. The pH of the culture averaged 7.4 as shown in
Figure 4.9.
Figure 4.6 The biomass growth and hydrogen production for the heat adapted
R. capsulatus (DSM 1710) CPBR experiment (20th September, 2008 - 29th
December, 2008).

56
Figure 4.7 The photobioreactor and air temperature variation in the heat
adapted R. capsulatus (DSM 1710) CPBR experiment (20th September, 2008
- 29th December, 2008).
Figure 4.8 Daily average sunlight intensity and cumulative hydrogen
production in the heat adapted R. capsulatus (DSM 1710) CPBR experiment
(20th September, 2008 - 29th December, 2008). Sunlight intensity data was
obtained from the National Meteorology Institute of Turkey.

57
Figure 4.9 The change in pH in the heat adapted R. capsulatus (DSM 1710)
CPBR experiment (20th September, 2008 - 29th December, 2008).
Shown in Figure 4.9 is the organic acid utilization in the heat adpated
R. capsulatus PBR. In Phase I, acetic acid fed at the startup was steadily
consumed as the bacteria grew. An acetate conversion of 72% and substrate
conversion efficiency of 23% was obtained in this phase. In Phase II, after the
introduction of continuous feeding, acetic acid concentration varied between 6-
10 mM for 31 days. A 79% acetate conversion and 20% substrate conversion
efficiency was obtained in this Phase II (calculations were done for the 31 days
when acetate consumption was stable). In Phase III, acetic accumulation is
observed. This could be attributed to the low light intensity during this period
as seen in Figure 4.8. Lactic acid, formic acid, propionic acid and butyric acid
were formed in low amounts as seen in Figure 4.10. Summarised in Table 4.2
is the results of the outdoor panel photobioreactor using heat adapted R.
capsulatus (DSM 1710).

58
Figure 4.10 Organic acid utilization in the heat adapted R. capsulatus (DSM
1710) outdoor experiment CPBR experiment (20th September, 2008 - 29th
December, 2008).
4.1.3 Continuous Panel Photobioreactor with R. capsulatus YO3 (Hup-)
This experiment was carried out between October-December 2008. An
8 l panel photobioreactor was setup in outdoor conditions using R. capsulatus
YO3 (Hup-). The PNS bacteria was grown as described in Section 3.4.1 and the
photobioreactor started using the procedure stated in Section 3.4.3 in outdoor
conditions. 24% bacterial inoculation and hydrogen production medium
containing acetate (40mM) /glutamate (2mM) was used at startup. Shown in
Figure 4.11 is the biomass growth and the cumulative hydrogen production.

59
Figure 4.11 The biomass growth and hydrogen production for R. capsulatus
YO3 (Hup-) experiment CPBR experiment (16th October – 24th December,
2008).
In Phase I, slow bacterial growth was observed. This was because of the
varying temperature and light intensity in the outdoor conditions. The
photobioreactor temperature ranged between 20-35 0C during the day and it
was about 50C at night as seen in Figure 4.12. The sunlight intensity was 1-4
kwh/m2.day in this phase as seen in Figure 4.13. Average hydrogen production
rate of 66 ml H2/lc.day was obtained in this Phase I.
In Phase II, continuous feeding of the hydrogen production medium
containing 40 mM/2 mM Ac/Glu commenced on the 13th day after the bacteria
had grown to 0.535 gdcw/lc. Biomass decreased from 0.6 to 0.3 gdcw/lc in
Phase II. Average hydrogen productivity of 50 ml H2/lc.day was obtained as
sunlight intensity ranged between 1-3.5 kwh/m2.day. On the 27th day (the onset
of winter), the PBR was moved to glasshouse to prevent the bacteria from
freezing. Electric heaters were used at night to maintain temperatures above
00C as described in Section 3.3.3. To prevent further decrease in the biomass,
the glutamate amount in the feed was increased from 2 mM to 10 mM on the
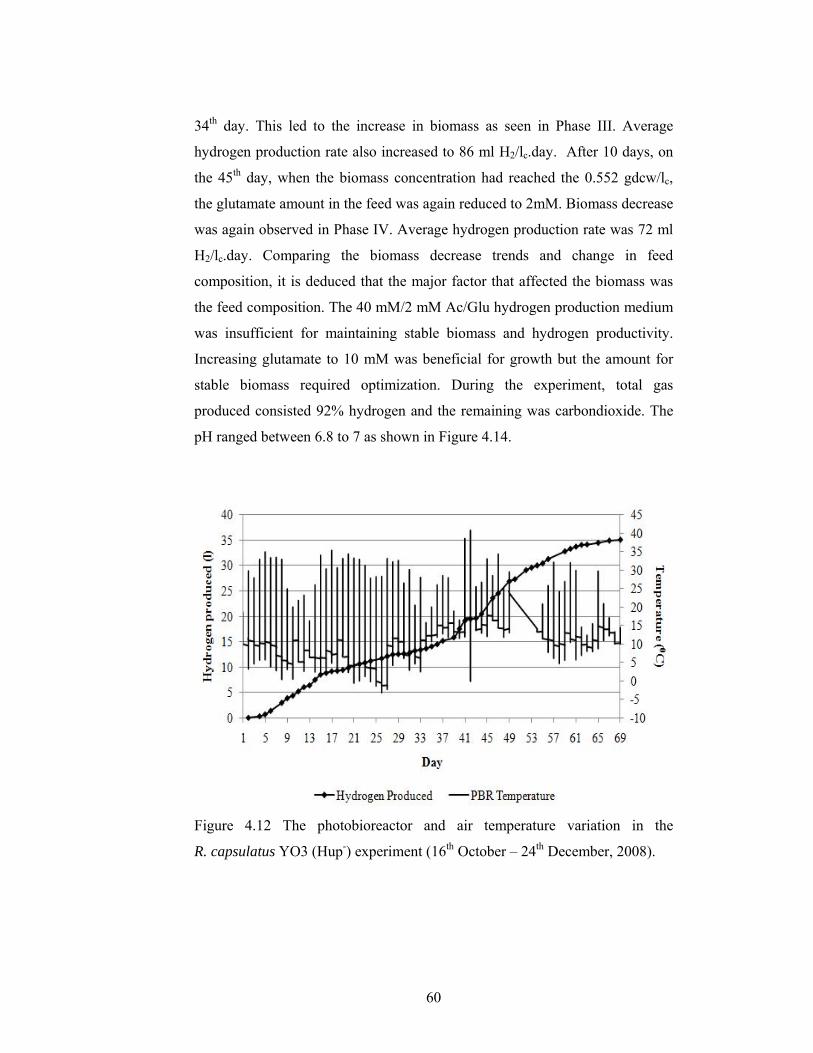
60
34th day. This led to the increase in biomass as seen in Phase III. Average
hydrogen production rate also increased to 86 ml H2/lc.day. After 10 days, on
the 45th day, when the biomass concentration had reached the 0.552 gdcw/lc,
the glutamate amount in the feed was again reduced to 2mM. Biomass decrease
was again observed in Phase IV. Average hydrogen production rate was 72 ml
H2/lc.day. Comparing the biomass decrease trends and change in feed
composition, it is deduced that the major factor that affected the biomass was
the feed composition. The 40 mM/2 mM Ac/Glu hydrogen production medium
was insufficient for maintaining stable biomass and hydrogen productivity.
Increasing glutamate to 10 mM was beneficial for growth but the amount for
stable biomass required optimization. During the experiment, total gas
produced consisted 92% hydrogen and the remaining was carbondioxide. The
pH ranged between 6.8 to 7 as shown in Figure 4.14.
Figure 4.12 The photobioreactor and air temperature variation in the
R. capsulatus YO3 (Hup-) experiment (16th October – 24th December, 2008).

61
Figure 4.13 Daily average sunlight intensity and cumulative hydrogen
production in the R. capsulatus YO3 (Hup-) CPBR experiment (16th October,
2008 - 24th December, 2008). Sunlight intensity data was obtained from the
National Meteorology Institute of Turkey.
Figure 4.14 The change in pH in the R. capsulatus YO3 (Hup-) outdoor
experiment (16th October – 24th December, 2008).

62
The organic acid HPLC of the R. capsulatus YO3 (Hup-) outdoor
experiment is shown in Figure 4.15. It is observed that acetic acid was steadily
consumed in Phase I as the bacteria grew. The acetate conversion was 85%
with a substrate conversion efficiency of 45 %. In Phase II, most of the acetate
fed was utilized and was insufficient to maintain biomass and high hydrogen
production. 97 % acetate conversion and 13% substrate conversion efficiency
was obtained in this phase. In Phase III, with the increase in glutamate amount
and biomass, acetate concentration in the culture increased. This is because the
bacteria utilized acetate and the extra glutamate provided for growth and
hydrogen production. 79% acetate conversion and 18% substrate conversion
efficiency was obtained. In Phase IV, accumulation of acetic acid in the culture
was observed. The temperature in this phase ranged between 30-100C as seen
in Figure 4.12. However, low light intensity, 0.5-2.8 kwh/m2.day was
experienced in winter in Ankara as seen in Figure 4.14. This led to the decrease
in acetate consumption by the photosynthetic bacteria. 61% acetate conversion
and 36% substrate conversion efficiency was obtained in Phase IV.
Furthermore, in the the HPLC analysis results, lactic acid, propionic acid and
butyric acid were formed in very low concentrations, however, formation of
formic acid was observed. On average, 2 mM of formic acid was produced in
Phases I, II and III while 6 mM was produced in phase IV. The increase in
formic acid could be attributed to the change in mechanism as acetate was not
sufficiently utilized by the bacteria because of low light intensity in winter.
Tabanöğlu (2002) observed formic acid formation in an outdoor experiment
using R. sphaeroides. Insufficient lighting of the photobioreactor resulted to
anaerobic dark fermentation and formic acid production. A summary of the
outdoor experiment done using the R. capsulatus YO3 (Hup-) is shown in
Table 4.1.

63
Figure 4.15 Organic acid utilization in the R. capsulatus YO3 (Hup-) outdoor
experiment (16th October – 24th December, 2008).
4.2 Comparison of the Outdoor Experiments Results
The outdoor continuous panel photobioreactors operated using the three
R. capsulatus strains were compared with respect to hydrogen productivity,
substrate conversion efficiency and acetate conversion. The R. capsulatus
(DSM 1710) photobioreactor was operated between 13th September – 3rd
October, 2008, the heat adapted R. capsulatus (DSM 1710) between 20th
September – 29th December, 2008 and the R. capsulatus YO3 (Hup-) between
16th October – 24th December, 2008.
4.2.1 Hydrogen Productivity
The highest molar hydrogen productivities of the continuous outdoor
photobioreactors were plotted in a bar graph as shown in Figure 4.16. A sample
calculation is shown in the Appendix I1.2. It was observed that the
R. capsulatus (DSM 1710), heat adapted R. capsulatus (DSM 1710) and
R. capsulatus YO3 (Hup-) had similar hydrogen productivities of 0.3, 0.3 and
0.4 mmol H2/lc.h respectively. The R. capsulatus YO3 (Hup-) strain had a

64
slightly higher productivity than the R. capsulatus (DSM 1710) despite being
operated during the winter, under lower temperatures and light intensity. The
R. capsulatus (DSM 1710) was operated in late summer. Wakayama et al.,
1998 showed that hydrogen production levels depended on irradiation of
sunlight intensity in outdoor conditions. They obtained maximum hydrogen
production rate of 4 l/m2.h with over 2% light conversion efficiency in outdoor
experiments carried out under natural sunlight using R. sphaeroides RV. The
results obtained in this study nullify the effect of the absence of the uptake
hydrogenase enzyme. Özgür et al., 2009 found that R. capsulatus YO3 (Hup-)
had a higher productivity than the R. capsulatus (DSM 1710) in batch
experiments carried out during summer and fall of 2007.
Figure 4.16 Comparison of the outdoor photobioreactors hydrogen
productivities.
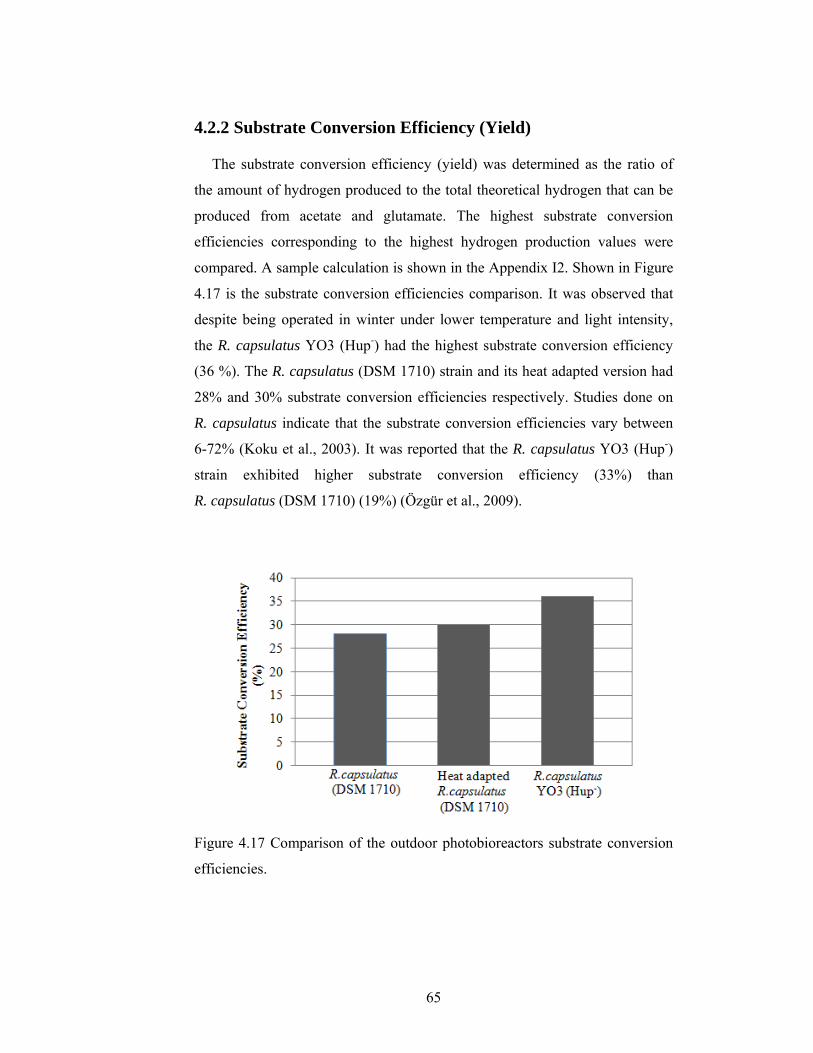
65
4.2.2 Substrate Conversion Efficiency (Yield)
The substrate conversion efficiency (yield) was determined as the ratio of
the amount of hydrogen produced to the total theoretical hydrogen that can be
produced from acetate and glutamate. The highest substrate conversion
efficiencies corresponding to the highest hydrogen production values were
compared. A sample calculation is shown in the Appendix I2. Shown in Figure
4.17 is the substrate conversion efficiencies comparison. It was observed that
despite being operated in winter under lower temperature and light intensity,
the R. capsulatus YO3 (Hup-) had the highest substrate conversion efficiency
(36 %). The R. capsulatus (DSM 1710) strain and its heat adapted version had
28% and 30% substrate conversion efficiencies respectively. Studies done on
R. capsulatus indicate that the substrate conversion efficiencies vary between
6-72% (Koku et al., 2003). It was reported that the R. capsulatus YO3 (Hup-)
strain exhibited higher substrate conversion efficiency (33%) than
R. capsulatus (DSM 1710) (19%) (Özgür et al., 2009).
Figure 4.17 Comparison of the outdoor photobioreactors substrate conversion
efficiencies.

66
4.2.3 Acetate Conversion
The acetate conversion, which is the ratio of the acetate utilized to the
amount fed, is calclulated as 87% for R. capsulatus (DSM 1710), 75% for the
heat adapted strain and 61% for R. capsulatus YO3 (Hup-) containing CPBRs.
The lower acetate conversion can be attributed to the decreasing biomass
concentration and low winter light intensities (2-3 kwh/m2.day). Low light
intensity has been shown to lead to a decrease in the total volume of hydrogen
produced (Miyake and Kawamura, 1987; Nakada et al., 1995; Yamada et al.,
1998; Uyar et al., 2007). Studies done by Barbosa et al. (2001) showed that
low light intensities led to lower acetate consumption by PNS bacteria. Using
two tungsten lamps, they investigated the effect of light intensity between 40
and 600 μmol photons m−2 s−1 and found that the highest volume (25 ml H2
/l.h) was obtained in Rhodopseudomonas sp. with light intensity of 680 μmol
photons/ m2.s. Moreover, the high acetate conversion values for R. capsulatus
(DSM 1710) in outdoor conditions assert the suitability of acetate as a substrate
for photosynthetic bacteria (Barbosa et al., 2001; Asada et al., 2008). Barbosa
et al. (2001) compared the hydrogen production of three bacterial strains
(Rhodopseudomonas sp., Rhodopseudomonas palustris and a non-identified
strain) on four different organic acids (lactate, malate, acetate and butyrate).
The substrate conversion conversion yield (72.8%), hydrogen evolved (269 ml
H2 per vessel), hydrogen production rate (25 ml H2 /l.h1) and light efficiency
(0.9%) were achieved by Rhodopseudomonas sp. with acetate as the carbon
source. Asada et al. (2008) tested 5 strains of agar immobilized PNS bacteria
and observed that R. sphaeroides IL 106 gave the highest yield of 3.03 mol of
hydrogen per acetate when acetate concentration was low. Shown in Figure
4.18 is the acetate conversion comparison.

67
Figure 4.18 Comparison of the outdoor photobioreactors acetate
conversions.
Overall, the three bacterial (R.capsulatus wildtype (DSM 1710), heat
adapted R. capsulatus wildtype (DSM 1710) and R. capsulatus wildtype YO3
(Hup-) strains had similar molar hydrogen productivities and were all suitable
for long term hydrogen production using acetate as a carbon source. These
results were obtained using defined medium described in Appendix A,
however, the performance of these strains on the real dark fermenter effluents
from thermophilic fermentation remains to be investigated. Theoretically, the
mutant (Hup-) can produce higher hydrogen than its parent (wildtype) strain
because of lack of the uptake hydrogenase enzyme. In the outdoor experiments,
it was noted that the 40 mM/2 mM Ac feed composition was insufficient to
maintain a stable cell concentration and so further studies were foccussed on
optimising the feed media composition for the R. capsulatus YO3(Hup-) strain.

68
Tabl
e 4.
2 Su
mm
ary
resu
lts o
f the
out
door
con
tinuo
us p
anel
pho
tobi
orea
ctor
s with
Diff
eren
t R. c
apsu
latu
s Stra
ins.

69
4.3 Effect of Feed Composition on Long Term Hydrogen
Production
Feed media optimization experiments to achieve stable biomass growth
and high hydrogen production using the R. capsulatus YO3 (Hup-) were carried
out in indoor conditions, under continuous illumination and controlled
temperature.
Experiments with biomass recycling to prevent the biomass decrease
was carried out. Also, experiments in which the C/N ratio was kept constant at
45 as in the 40 mM/2mM Ac/Glu feed, were carried out. The results of the
40 mM/2 mM/Ac/Glu feed with or without biomass recycle, 60 mM/3 mM
Ac/Glu feed and 80 mM/4 mM Ac/Glu feed indoor experiments are given.
4.3.1 Feed Composition: 40 mM Acetate and 2 mM Glutamate
An indoor experiment was carried out in a continuous 8 l panel
photobioreactor using R. capsulatus YO3 (Hup-) strain between September-
November, 2008. The PNS bacteria was grown as described in Section 3.4.1
and the photobioreactor started in indoor conditions using the procedure stated
in Section 3.4.3. 23% bacterial inoculation and hydrogen production medium
containing acetate (40 mM) and glutamate (2 mM) were used at startup. In
continuous operation, the photobioreactor had a daily dilution rate of 10% of
the reactor volume; 800 ml of the 40 mM/2 mM Ac/Glu hydrogen production
medium was fed every day. An air conditioner was used to control the room
temperature and constant illumination (1500 lux~86W/m2) was provided by
four 60W tungsten lamps. Figure 4.19 illustrates the biomass and hydrogen
production results of the indoor experiment.

70
Figure 4.19 The biomass growth and cumulative hydrogen production in the 40
mM/2 mM Ac/Glu fed CPBR (18th September, 2008 - 2nd November, 2008).
In Phase I, because of controlled temperature and continuous
illumination provided in the indoor conditions, a fast biomass growth
(µ=0.061 h-1) was observed. Biomass concentration of 0.8 gdcw/lc and
hydrogen production rate of 9 ml H2/l.h was obtained in this phase. Continuous
feeding was started on the 2nd day of the experiment. As seen in Phase II, there
was continuous decrease in biomass after the start of continuous feeding. The
biomass concentration decreased to 0.42 gdcw/ lc after 31 days. On the
contrary, there was high stable hydrogen production rate of 15 ml H2/l.h in this
phase. Since the temperature and light intensity were controlled, the feed
composition being insufficient was the reason for the biomass decrease. It was
suggested to increase the dilution rate slightly from 800 ml feed medium to
1000 ml per day. As seen in Phase III, the biomass further decreased to 0.33
gdcw/lc. Hydrogen production rate (16 ml H2/l.h) similar to Phase II was
obtained. In Phase IV, the dilution rate was halved to 400 ml feed medium per
day. Hydrogen production stopped in this phase because the daily 400 ml feed
medium given was not enough for biomass growth and hydrogen production.
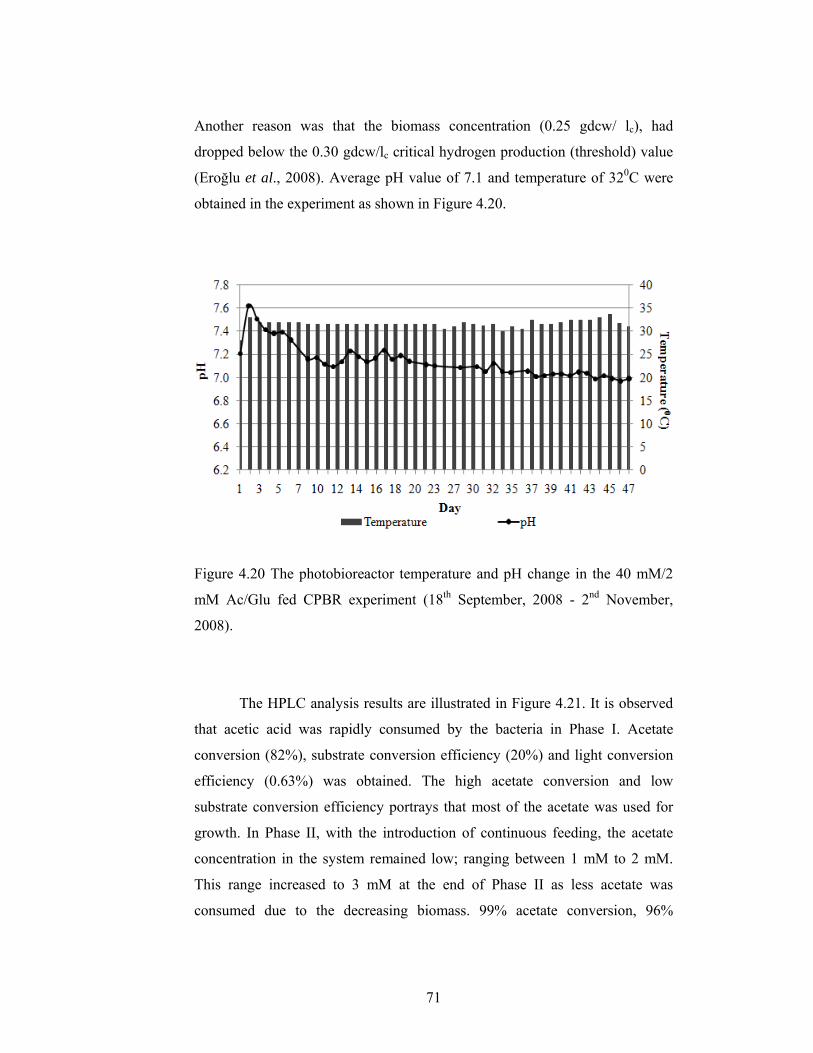
71
Another reason was that the biomass concentration (0.25 gdcw/ lc), had
dropped below the 0.30 gdcw/lc critical hydrogen production (threshold) value
(Eroğlu et al., 2008). Average pH value of 7.1 and temperature of 320C were
obtained in the experiment as shown in Figure 4.20.
Figure 4.20 The photobioreactor temperature and pH change in the 40 mM/2
mM Ac/Glu fed CPBR experiment (18th September, 2008 - 2nd November,
2008).
The HPLC analysis results are illustrated in Figure 4.21. It is observed
that acetic acid was rapidly consumed by the bacteria in Phase I. Acetate
conversion (82%), substrate conversion efficiency (20%) and light conversion
efficiency (0.63%) was obtained. The high acetate conversion and low
substrate conversion efficiency portrays that most of the acetate was used for
growth. In Phase II, with the introduction of continuous feeding, the acetate
concentration in the system remained low; ranging between 1 mM to 2 mM.
This range increased to 3 mM at the end of Phase II as less acetate was
consumed due to the decreasing biomass. 99% acetate conversion, 96%

72
substrate conversion efficiency and 0.84% light conversion efficiency was
obtained in this phase. This corresponds to the high 15 ml H2/lc.h hydrogen
productivity in this phase. In Phase III, the acetate conversion and substrate
conversion efficiency slightly decreased to 90% and 91%. The decrease had
little effect on hydrogen productivity as it remained at 15 ml H2/lc.h. Average
acetate concentration in this phase was 4 mM. In Phase IV, as seen, acetate was
completely consumed. 100% acetate conversion, 19% substrate conversion
efficiency and 0.35% light conversion efficiency was obtained. The low
substrate conversion efficiency shows that the bacteria utilized the given acetic
acid for biomass formation (maintenance purposes) instead of hydrogen
production. Also from the HPLC analysis results, it was found that lactic acid
and butyric acids were formed in very low concentrations while formic acid
accumulated in the system. On average, 6 mM formic acid concentration was
formed in the photobioreactor. The formation of formic acid in the system
could be attributed to low light intensity. Formate is a fermentation end
product. Studies on the Rhodobacter species have shown that the bacteria can
switch to fermentative mode and produce organic acids if the illumination is
below a threshold value. It shifts back its metabolism to photofermention in the
presence of sufficient light (Eroğlu et al., 2008). Shown in Table 4.3 is a
summary of the 40 mM/2 mM Ac/Glu continuous panel photobioreactor
experimental results.

73
Figure 4.21 Organic acid utilization in the 40 mM/2 mM Ac/Glu fed CPBR
experiment (18th September, 2008 - 2nd November, 2008).
4.3.2 Feed Composition: 40mM Acetate and 2 mM Glutamate with Biomass Recycle
The photobioreactor was started in indoor conditions using the
procedure stated in Section 3.4.3. 25% bacterial inoculation and hydrogen
production medium containing acetate (40 mM) and glutamate (2 mM) were
used at startup. Continuous feeding was done with the same hydrogen
production feed medium.
During continuous operation of the photobioreactors, as described in
Section 3.4.4, 800 ml bacterial effluent was initally removed and 800 ml
hydrogen production medium was fed into system. The removed bacteria
effluent was chemically sterilized and discarded. However, in the biomass
recycling case, the bacteria effluent was centrifuged and the supernatant
discarded while the pellet was dissolved in hydrogen production medium and
fed back into the photobioreactor. The details are described in Section 3.6.1.
Using the procedure described in Section 3.6.2, it was found that 0.23 g of
biomass was recycled back into the photobioreactor.

74
Shown in Figure 4.22 is the biomass growth and hydrogen production
for the 40 mM/2 mM Ac/Glu CPBR with biomass recycle. In Phase I, after
inoculation, due to constant illumination (2500 lux~143W/m2) and controlled
temperature, the bacteria grew steadily (µ =0.021 h-1) and reached stationary
Phase on the 5th day. 0.749 gdcw/lc biomass concentration and 14 ml H2/lc.h
hydrogen productivity was attained in this phase. The continuous feed with
biomass commenced on the 5th day. As seen in Phase II, biomass concentration
ranged between 0.55-0.65 gdcw/lc. Stable hydrogen production at a rate of 11
ml H2/lc.h was obtained in this phase.
Figure 4.22 The biomass growth and hydrogen production in the 40 mM/2
mM Ac/Glu fed CPBR with biomass recycle (4th April, 2009 – 5th May, 2009).
During the experiment, an average pH of 7 and bacteriochlorophyll of
10 mgbchl/lc was obtained. Bacteriochlorophyll is the bacteria’s photosynthetic
pigment that is used to trap light at different wavelengths. It remained stable
because of the constant illumination provided by the 60W tungsten lamps. The
photobioreactor temperature was maintained between 30-35 0C as shown in
Figure 4.23.

75
Figure 4.23 Temperature, pH and bacteriochlorophyll variation in the
40 mM /2 mM Ac/Glu fed CPBR with biomass recycle (4th April, 2009 – 5th
May, 2009).
In the organic acid utilization in Figure 4.24, it is seen that acetic acid
was steadily consumed at the startup (Phase I). 95% acetic acid conversion,
45% substrate conversion efficiency and 0.45% light conversion was obtained
in this phase. In Phase II, with continuous feeding and biomass recyle, the
acetic acid concentration averaged 2 mM. For the 20 days period in Phase II,
95% acetic acid conversion, 67% substrate conversion efficiency and 0.45%
light conversion was obtained. Shown in Table 4.3 is a summary of the
40 mM/2 mM Ac/Glu CPBR with biomass recycle experiment results.

76
Figure 4.24 Organic acid utilization in the 40 mM/2 mM Ac/Glu fed CPBR
with biomass recycle (4th April, 2009 – 5th May, 2009).
4.3.3 Feed Composition: 40 mM Acetate and 3-4 mM Glutamate
This experiment aimed to obtain a stable biomass and hydrogen
production by changing the glutamate concentration while keeping the acetic
acid concentration in the hydrogen production medium constant at 40 mM. An
8 l indoor photobioreactor was started as described in section 3.4.3. 22%
bacterial inoculation and hydrogen production medium containing acetate
(40 mM) and glutamate (2 mM) was used at the startup. Continuous
illumination (2500 lux~143W/m2) was provided by four 60 W tungsten lamps
and controlled temperature using an air conditioner. The biomass concentration
and hydrogen production are shown in Figure 4.25.

77
Figure 4.25 The biomass growth and hydrogen production in the
40 mM/3 mM – 40 mM/4 mM Ac/Glu fed CPBR experiment (25th March – 3rd
May, 2009).
In Phase I, the bacteria grew steadily (µ= 0.019 h-1) and reached a
biomass concentration of 0.771 gdcw/lc in 6 days as seen in Figure 4.23.
Hydrogen production medium containing 40 mM acetate and 2 mM glutamate
was used in this phase. 14 ml H2/lc.h hydrogen production with 62% acetate
conversion and 58% substrate conversion efficiency was obtained.
In Phase II, continuous feeding using 40 mM acetate and 3 mM
glutamate was introduced. Despite increasing the glutamate amount in the
feed, biomass decreased to 0.45 gdcw/lc. Higher hydrogen production rate 18
ml H2/lc.h with 84 % acetate conversion, 105 % substrate conversion efficiency
and 0.66 % light conversion efficiency was obtained. The high acetate
conversion and substrate conversion efficiency showed that the bacteria used
most of the acetate for hydrogen production. Moreover, the over 100% exceed
of the substrate conversion is because the bacteria did not only utilize acetate
and glutamate but also other sources like the side products (PHB) and biomass
in the culture for hydrogen production. Sasikala et al. (1990), observed over
100% substrate conversion efficiency using R. sphaeroides and malate as feed.

78
They attributed this to the existence of endogenous substrates which acted as
electron donors for hydrogen production. Endogenoous substrates are known to
act as electron donors for hydrogen formation (Ormerod et al., 1961; Hillmer
and Gest, 1977). To counteract further biomass decrease, the glutamate in the
daily 800 ml hydrogen production feed was increased to 4 mM.
In Phase III, it was observed that biomass stabilized at 0.4 gdcw/lc. 17
ml H2/lc.h hydrogen production rate with 98% acetate conversion, 85%
substrate conversion efficiency and 0.70 % light conversion efficiency was
obtained. Gas analysis showed that 87-92% hydrogen was produced in the
three phases. An average pH of 7 and 9 mgbchl/lc bacteriochlorophyll was also
obtained. The variation in temperature, pH and bacteriochlorophyll are shown
in Figure 4.26.
Figure 4.26 Temperature, pH and bacteriochlorophyll variation in the
40 mM/3 mM- 40 mM/4 mM Ac/Glu fed CPBR experiment (25th March – 3rd
May, 2009).

79
The organic acid utilization plot Figure 4.27 shows that acetic acid was
almost completely used in Phase III where stable biomass was attained. Lactic,
butyric and propionic acids were formed in low quantities but, formic acid was
formed and accumulated in the system. It is observed that the increase in
glutamate amount led to an increase in formic acid formation. An average of 10
mM formic acid was obtained in Phase III. Shown in Table 4.3 is a summary
of the 40 mM/3 mM - 40 mM/4 mM Ac/Glu continuous panel photobioreactor.
Figure 4.27 Organic acid utilization in the 40/3-40/4 mM Ac/Glu fed CPBR
experiment (25th March – 3rd May, 2009).
4.3.4 Feed Composition: 60 mM Acetate and 3- 4 mM Glutamate
The indoor continuous panel photobioreactor was started using the
procedure described in section 3.4.3. At the startup, 24% bacterial inoculation
and 40 mM/2 mM Ac/ Glu containing hydrogen production medium was used.
The 8 l panel photobioreactor was constantly illuminated (2500lux~143W/m2)

80
using four 60W tungsten lamps and the room temperature controlled using an
air conditioner. 10% dilution rate was used in the continuous operation.
The CPBR biomass growth and the hydrogen production is shown in
Figure 4.28. In Phase I, the bacteria was grown using 40 mM/2 mM Ac/Glu
containing hydrogen production medium. It grew steadily (µ= 0.027 h-1) and
reached 0.68 gdcw/lc on the 4th day. 7 ml H2/lc.h of hydrogen gas was also
produced. In Phase II, continuous feeding began and the feed composition was
changed to 60 mM/3 mM Ac/ Glu. Stable biomass concentration at 0.68
gdcw/lc was observed for 8 days after feeding commenced but a decrease to
0.53 gdcw/lc was obtained on the 22nd day of the experiment. Stable hydrogen
production at 11 ml H2/lc.h was got. In Phase III, to prevent further decrease in
the biomass, the daily fed hydrogen composition was changed to 60/4 mM
Ac/Glu. Biomass stabilized at 0.55 gdcw/lc and 12 ml H2/lc.h hydrogen
production rate was attained.
Figure 4.28 The biomass growth and hydrogen production in the 60 mM/3 mM
– 60 mM/4 mM Ac/Glu fed CPBR experiment (21st March – 3rd May, 2009).

81
The variation in the pH, bacterichlorophyll and temperature is shown in
Figure 4.29. An average pH of 7, 8 mg bchl/lc bacterichlorophyll and 310C
average temperature was obtained.
Figure 4.29 Temperature, pH and bacteriochlorophyll variation in the 60 mM/3
mM – 60 mM/4 mM Ac/Glu fed CPBR experiment (21st March – 3rd May,
2009).
From the organic acid utilization in Figure 4.30, accumulation of acetic
acid in the system is observed. In Phase II, with the 60 mM/3 mM Ac/Glu feed,
22 mM of acetic acid accumulated in the system. 67 % acetate conversion and
57% substrate conversion efficiency was obtained. The bacteria utilized the
acetic acid given for hydrogen production but the glutamate provided was not
enough to maintain a stable biomass. In Phase III, with the increase in the
glutamate amount in the feed from 3 mM to 4 mM, biomass stabiled at 0.55
gdcw/lc. 70 % acetate conversion and 61% substrate conversion efficiency
were obtained. The accumulated acetic acid in the system decreased to 14 mM;
it was used for growth and hydrogen production. Formic acid formation

82
increased with the increase in glutamate amount. Lactic, propionic and butyric
acid were formed in low concentrations. A summary of the 60 mM/3 mM
- 60 mM/4 mM Ac/Glu experiment is given in Table 4.3.
Figure 4.30 Organic acid utilization in the 60 mM/3 mM – 60 mM/4 mM
Ac/Glu fed CPBR experiment (21st March – 3rd May, 2009).
4.3.5 Feed Composition: 80 mM Acetate and 4 mM Glutamate
An experiment to investigate the effect of increasing the acetate and
glutamate amount keeping the C/N ratio constant at 45 (as in the 40 mM/2 mM
and 60 mM/3 mM CPBR experiment) was carried out. The photobioreactor
was started using the procedure described in section 3.4.3 with 23 % bacterial
inoculation and 40 mM/2 mM Ac/Glu hydrogen production medium. Daily 800
ml continuous feeding of the 80 mM/4 mM Ac/Glu hydrogen production
medium started on the 3rd day when the biomass concentration was 0.9 gdcw/lc.
Stable biomass at 1 gdcw/lc and 12 ml H2/lc.h hydrogen production was

83
attained in Phase II. The biomass growth and cumulative hydrogen production
is shown in Figure 4.31.
Figure 4.31 The biomass growth and hydrogen production in the 80 mM/4 mM
Ac/Glu fed CPBR experiment (21st March, 2009 – 1st April, 2009).
An average pH 7 and 12 mg bchl/lc bacterichlorophyll was obtained.
The photobioreactor temperature was maintained at 310C on average as shown
in Figure 4.32.

84
Figure 4.32 Temperature, pH and bacteriochlorophyll variation in the
80 mM/4 mM Ac/Glu fed CPBR (21st March, 2009 – 1st April, 2009).
Organic acid analyses using HPLC (Figure 4.33) showed that
acetic acid was utilized for growth in Phase I. 54% acetate conversion and
17 % substrate conversion efficiency was obtained in this phase. Accumulation
of acetic acid was observed on the onset of continuous feeding in Phase II.
Acetate conversion and substrate conversion efficiency were 75% and 39%
respectively. The accumulation was due to the excess acetic acid given during
feeding. Glutamic acid measurement showed that the bacteria fully utilized
glutamate for growth at startup and to maintain biomass at the onset of
continuous feeding. This nitrogen limited condition is desired for hydrogen
production.

85
Figure 4.33 Organic acid utilization in the 80 mM/4mM Ac/Glu fed continuous
panel photobioreactor (21st March, 2009 – 1st April, 2009).
4.4 Long Term Stability of Biomass
4.4.1 Effect of Biomass Recycle
The 40 mM/2 mM Ac/Glu fed photobioreactors with and without
biomass recycle are compared. Similar biomass change was observed in the
two photobioreactors as shown in Figure 4.34. Despite having initial different
growth rates, 0.021 h-1and 0.061 h-1 for the CPBR with and without biomass
recycle respectively, biomass concentration decreased to 0.5 gdcw/lc at the end
of the 25th day. This showed that the biomass recycle was insufficient in
curbing the decrease in biomass problem. It asserts the need to adjust the feed
composition for stable biomass and hydrogen production.

86
Figure 4.34 Effect of biomass recycle on biomass concentration.
In Figure 4.35 (a), it is seen that the 40 mM/2 mM Ac/Glu fed CPBR
had a higher molar hydrogen productivity (0.7 mmol H2/lc.h) compared to the
40 mM/2 mM Ac/Glu fed CPBR with biomass recycle (0.5 mmol H2/lc.h).
High acetate conversion was observed in both CPBRs; 96% in the 40 mM/2
mM Ac/Glu fed CPBR and 95% in the 40 mM/2 mM Ac/Glu fed CPBR with
biomass recycle. This showed that acetate was well utilized in both
photobioreactors. However, lower substrate conversion efficiency was obtained
in the biomass recycle case as seen in Figure 4.35 (c). A reason for this was
that part of the acetate fed was used by the recycled biomass for maintenance
purposes.

87
Figure 4.35 Effect of biomass recycle on: (a) Hydrogen productivity, (b)
Acetate conversion and (c) Substrate conversion efficiency.
(b)
(a)
(c)

88
4.4.2 Effect of Increasing Glutamate Concentration in the Feed keeping Acetate Concentration Constant
Glutamate contains nitrogen that is used by the bacteria for growth
purposes. Therefore, the major effect of the glutamate increase was on biomass
formation. The 40 mM/2 mM Ac/Glu and 40 mM/3 mM – 40 mM/4 mM
Ac/Glu fed continuous photobioreactors are compared in Figure 4.36. It was
observed that the increase in glutamate amount in the feed led to a stable
biomass growth during the continuous operation of the photobioreactor.
Decrease of biomass was observed in the 40 mM /2mM and 40 mM/3 mM
Ac/Glu feed composition; however stable biomass at 0.40 gdcw/lc was
achieved using the 40 mM/4 mM Ac/Glu feed. These results validate the
suitability of using glutamate as a nitrogen source as reported by Eroğlu et al.
(1999) and Koku et al. (2002).
Figure 4.36 Biomass change with increasing glutamate concentration keeping
acetate concentration constant.
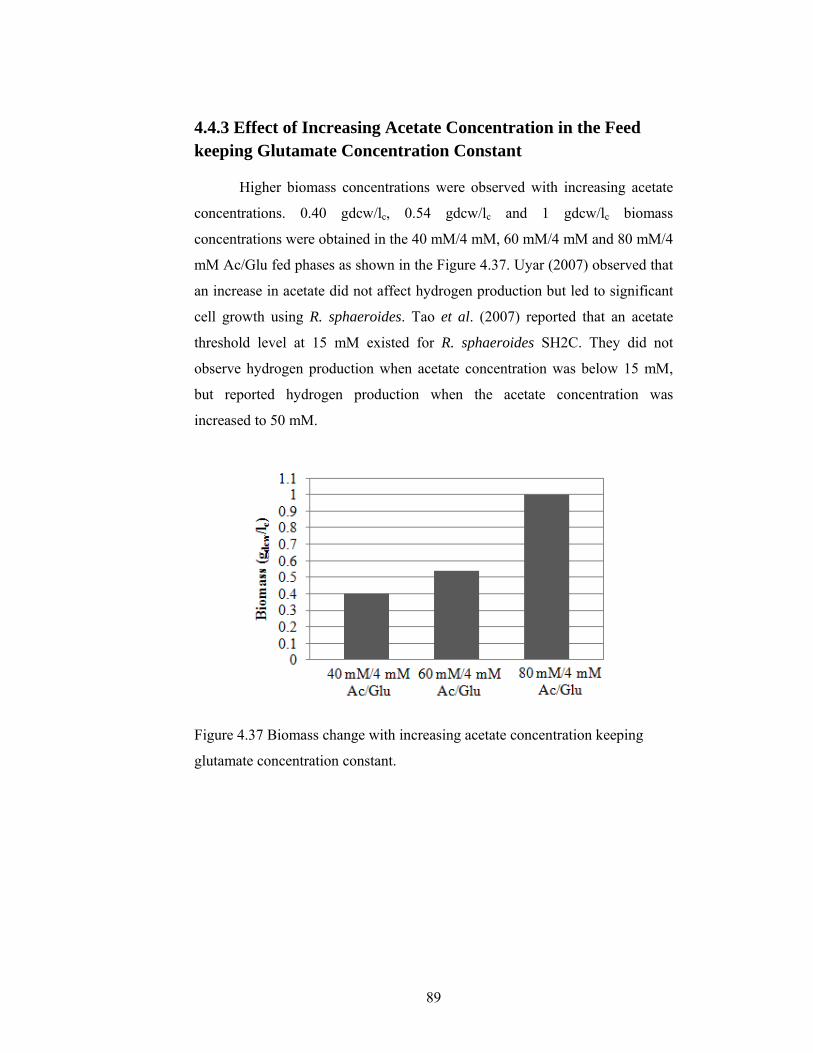
89
4.4.3 Effect of Increasing Acetate Concentration in the Feed keeping Glutamate Concentration Constant
Higher biomass concentrations were observed with increasing acetate
concentrations. 0.40 gdcw/lc, 0.54 gdcw/lc and 1 gdcw/lc biomass
concentrations were obtained in the 40 mM/4 mM, 60 mM/4 mM and 80 mM/4
mM Ac/Glu fed phases as shown in the Figure 4.37. Uyar (2007) observed that
an increase in acetate did not affect hydrogen production but led to significant
cell growth using R. sphaeroides. Tao et al. (2007) reported that an acetate
threshold level at 15 mM existed for R. sphaeroides SH2C. They did not
observe hydrogen production when acetate concentration was below 15 mM,
but reported hydrogen production when the acetate concentration was
increased to 50 mM.
Figure 4.37 Biomass change with increasing acetate concentration keeping
glutamate concentration constant.
90
4.5 Evaluation of the Results
4.5.1 Effect of the C/N Ratio
The C/N ratio in the feed media was reported as a critical
parameter for hydrogen production process (Eroğlu et al., 1999). The effect of
increasing glutamate and acetate amount in the feed (changing the C/N ratio)
and maintaining the C/N constant while increasing the feed concentrations was
investigated. The results were evaluated with regards to hydrogen productivity,
acetate conversion and substrate conversion efficiency. Shown in Figure 4.38
are the hydrogen productivities, substrate conversion efficiencies and the
acetate conversions for the indoor CPBRs.

91
Figure 4.38 (a) Hydrogen productivity, (b) Substrate conversion efficiency and
(c) Acetate conversion in the indoor photobioreactors. (40:4 stands for 40 mM
Ac/ 4 mM Glu).
(a)
(b)
(c)

92
The effect of increasing the glutamate amount in the feed media
(decreasing the C/N ratio) is discussed considering the feed media
compositions; 40 mM/2 mM Ac/Glu (C/N=45), 40 mM/3 mM Ac/Glu
(C/N=32) and 40 mM/ 4 mM (C/N=25)
An increase in hydrogen productivity was observed with increasing
glutamate concentration. Higher hydrogen productivities of 0.7 mmol H2/lc.h,
0.8 mmol H2/lc.h and 0.8 mmol H2/lc.h were obtained in the 40 mM/2 mM
Ac/Glu, 40 mM/3 mM Ac/Glu and 40 mM/ 4 mM photobioreactors
respectively as seen in Figure 4.38 (a). Also, higher substrate conversion
efficiencies were obtained with increasing the feed media’s glutamate amount,
keeping acetate constant. As seen in Figure 4.38 (b) high substrate conversion
efficiencies of 99%, 105% and 84% were attained for the 40 mM/2 mM
Ac/Glu, 40 mM/3 mM Ac/Glu and 40 mM/ 4 mM fed CPBR respectively.
105% substrate conversion efficiency observed in the 40 mM/3 mM Ac/Glu
could be attributed to the existence of endogenous sources which the bacteria
could use for hydrogen production. The bacteria did not only use acetate and
glutamate for growth (maintenance) and hydrogen production, but also other
endogenous sources such as PHB as well. Sasikala et al. (1990) observed over
100% substrate conversion efficiency using R. sphaeroides and malate as feed.
They attributed this to the existence of endogenous substrates which acted as
electron donors for hydrogen production. Endogenous substrates are known to
act as electron donors for hydrogen formation (Ormerod et al., 1961; Hillmer
and Gest, 1977). This theory is further validated by the lower acetate
conversion (84%) observed in the 40 mM/3 mM case, compared to the 40
mM/2 mM and 40 mM/4 mM Ac/Glu cases as seen in Figure 4.38 (c). Due to
the utilization of these other sources for hydrogen production, less acetate was
consumed and so decreasing the acetate conversion values. The highest acetate
conversion (98%) was observed in the 40 mM/4 mM Ac/Glu with stable
biomass.
Besides the increase in hydrogen productivity, substrate conversion
efficiency and acetate conversion, another effect of glutamate increase (C/N

93
ratio decrease) observed was on the formation of formic acid. Looking at the
HPLC results in Figures 4.21 and 4.27, it is observed that formic acid averaged
at 6 mM in the 40 mM/2 mM Ac/Glu CPBR but increased to 10 mM in the 40
mM/4 mM case. Eroğlu et al. (2008) observed that in outdoor conditions,
formate was formed during the night and utilized in daytime. It can be inferred
that the formate concentration reached a steady state concentration because of
the constant low light illumination and dilution rate. Increasing the light
intensity would alleviate the formate concentration. Uyar et al. (2007) reported
increasing hydrogen production with increasing light intensity and obtained
hydrogen production saturation at 270 W/m2. In the indoor experiments carried
out in this study, the light intensity was 143 W/m2.
Moreover, gas analysis showed a slight increase in the carbondioxide
levels with the increase in glutamate concentration. Hydrogen levels in the gas
composition decreased to 87% with 13% being carbondioxide.
The C/N ratio was also changed by increasing the acetate concentration
while maintaining the glutamate amount constant. Özgür et al. (2009) tested
the effect of increasing initial acetate concentration (10-50 mM) on hydrogen
production and biomass using R. capsulatus YO3 (Hup-) in batch PBR. They
observed growth and hydrogen production in all samples but obtained the
highest hydrogen productivity with the 40 mM/2 mM Ac/Glu. Similarly, in this
study, the highest hydrogen productivity was obtained with the 40 mM/4 mM
Ac/Glu feed, as shown in Figure 4.37 (a). A further increase in acetate, as in
the 60 mM/4 mM Ac/Glu and 80 mM/4 mM Ac/Glu feed media, led to a
decrease in hydrogen productivity.
An increase in acetate concentration also led to a decrease in
substrate conversion efficiency. This is anticipated as the HPLC analyses in
Figures 4.27, 4.30 and 4.33 show that while acetate was almost completely
utilized in the 40 mM/4 mM Ac/Glu, accumulation was observed in the
60 mM/4 mM and 80 mM/4 mM Ac/Glu cases. Highest substrate conversion
efficiency and acetate conversion was observed in the 40 mM/4 mM Ac/Glu.
In Figure 4.38 (b) substrate conversion efficiency decreased with increasing

94
acetate concentration while acetate conversion remained more or less the same.
This depicts that there exists an acetate concentration limit during operation of
continuous systems at stable biomass concentration. Above this maxima limit,
acetate accumulation occurs. For photobioreactors using R. caspulatus YO3
(Hup-) and hydrogen production medium containing 4 mM glutamate, this limit
is found to be at 40 mM acetate.
Another effect of C/N ratio investigated is the keeping of the C/N ratio
constant while increasing the acetate and glutamate concentrations. The
photobioreactors fed by 40 mM /2 mM Ac/Glu, 60 mM /3 mM Ac/Glu and 80
mM /4 mM Ac/Glu (all having C/N= 45) are compared.
Higher biomass concentration was obtained with increasing feed
component concentrations keeping C/N constant as shown in Figure 4.39
Figure 4.39 Effect of increasing acetate and glutamate keeping C/N constant on
biomass.

95
The substrate conversion efficiency was found to decrease with
increasing feed concentrations. HPLC analysis results in Figures 4.21 show
that acetate was well utilized in the 40 mM/2 mM Ac/Glu CPBR. In Figures
4.30 and 4.33, accumulation of acetic acid in the 60 mM /3 mM Ac/Glu and
80 mM /4 mM Ac/Glu CPBRs was observed which led to lower acetate
conversions as seen in Figure 4.38 (c). The highest acetate conversion (96%)
was obtained in the 40 mM /2 mM Ac/Glu. Also, the highest hydrogen
productivity was got in the 40 mM /2 mM Ac/Glu photobioreactor as shown in
Figure 4.38 (a).
Overall, 25 C/N feed composition (40 mM/4 mM Ac/Glu) ratio
was found to be optimum for stable biomass growth and hydrogen production
in the R. caspulatus YO3 (Hup-) containing CPBRs.
4.5.2 Light Conversion Efficiencies in the Indoor Continuous Photobioreactors
The photosynthetic efficiency of photoheterotrophic hydrogen
formation when sunlight or tungsten illumination is used is in the range 0.5-6%
(Otsuki et al., 1998; Steinborn and Oelze, 1989; Sasaki et al., 1998; Zürrer and
Bachofen, 1982; Hoekama, 2000). The light conversion efficiencies of the
indoor experiments in this study range between 0.24-1.21% as shown in Figure
4.40. Lower light efficiencies were observed with increasing glutamate and
acetate concentrations. An explanation for this could be the increase in biomass
and the decrease in the amount of hydrogen produced.

96
Figure 4.40 Light conversion efficiency values for the R. capsulatus YO3
(Hup-) indoor CPBRs.
4.5.3 Comparison of Batch and Continuous Photobioreactors
The indoor 40 mM/2 mM Ac/Glu CPBR carried out using R. capsulatus
YO3 (Hup-) is compared to an indoor batch experiment using 40 mM/2 mM
Ac/Glu reported by Özgür et al. (2009).
In Figures 4.41 (a), (b) and (c), it is observed that the continuous systems
have a higher hydrogen productivity, substrate conversion efficiency and light
conversion efficiency compared to the batch systems. This difference could be
because of the replenishment of used carbon and nitrogen sources through
feeding in the continuous system. This ascertains the use of continuously
operated photobioractors to batch systems for continuous hydrogen production.

97
Figure 4.41 Comparison of batch versus continuous photobioreactors:
(a) Hydrogen productivitiy, (b) Substrate conversion efficiency
(c) Light conversion efficiency.
(b)
(c)
(a)

98
Tabl
e 4.
3 Su
mm
ary
resu
lts o
f the
indo
or c
ontin
uous
pan
el p
hoto
bior
eact
ors w
ith R
. cap
sula
tus Y
O3
(Hup
- ).

99
4.6 Ammonium Ion Removal
High ammonia concentrations repress nitrogenase expression and
activity of photosynthetic bacteria (Gogotov, 1986 and Zorin, 1986). So for
continuous hydrogen production using PNS bacteria under anerobic and
nitrogen limited conditions, the removal of ammonia ions from the feed media
is a prerequisite. Clinoptilolite zeolite has a high affinity for ammonia ions and
so suitable for ammonia ions reduction.
4.6.1 Gördes Clinoptilolite Batch Pre-treatment
In Section 3.7.1 Gördes clinoptilolite batch pre-treatment procedure
was described. The chemical analysis results of the pre-treated clinoptilolite are
tabulated in Table 4.4.
Table 4.4 Chemical analysis results of pre-treated clinoptilolite.
Clinoptilolite Sample
Exchangeable Ions
Ca+2 % Mg+2 % K+1 % NaO % Original 0.083 0.073 0.062 1.08 Pretreated 0.057 0.071 0.061 3.58
From Table 4.4, it is seen that the sodium ion concentration in the
clinoptilolite was increased from 1.08% to 3.6%. These results are comparable
to that obtained by Aşiroğlu (2006) who increased sodium ion content in the
clinoptilolite from 0.6% to 3.6% via batch pretreatment procedure.

100
4.6.2 Dark Fermenter Effluent of Sugar-Beet Thick Juice Molasses Ammonium Ion Reduction
10 mM NH4Cl solution and DFE of sugar-beet thick juice molasses
were batch treated using pre-treated Gördes clinoptilolite as described in
Section 3.7.2.
Table 4.5 DFE of molasses treatment using pretreated clinoptilolite sample.
Sample gzeolite/50 ml sample
Time (h)
Concentration (mM)
% NH4+
Reduced
NH4Cl solution
1
0.5
17
17
Initial Final
93
74
10
10
0.75
2.6
Sugar- Beet Thick Juice
Molasses (DFE)
0.6
48
12.4
4.7
62
As seen in Table 4.5, ammonium ion was effectively removed from the
prepared NH4Cl solution and 62% of the ammonium in the sugar-beet thick
juice molasses was removed using clinoptilolite. Higher amounts of
ammonium ion can be removed with increasing the zeolite amount as observed
in the NH4Cl solution.
4.6.3 Total Nitrogen Measurement
The total nitrogen measurements results in Table 4.6 show that the 10
mg/l and 25 mg/l standard NH4Cl solutions were measured with 17% and 9.2%
errors respectively. These discrepancies could be attributed to measurement
errors (weighing and dilution). It is also observed that clinoptilolite was able to
remove 52% of the total nitrogen content in the sugar-beet juice molasses DFE
sample as seen in Table 4.7.

101
Table 4.6 Results of the total nitrogen measurement of NH4Cl solution.
Table 4.7 Results of the total nitrogen measurement of NH4Cl solution and
Sugar-beet juice molasses DFE.
NH4Cl solution Total N (mM) Error (%)
10 mg/l (0.7 mM)
25 mg/l (1.8 mM)
0.6
1.62
17
9.2
DFE Sample Total N (mM) Total % N Reduced
12.4 mM Sugar-beet Juice Molasses
Before clinoptilolite treatment
After clinoptilolite Treatment
105.90
51.26
52%
102
CHAPTER 5
MODELING 5.1 Cell Growth
The cell concentration change in the photobioreactor is divided into
three main phases; lag phase, exponential phase and stationary phase. In the lag
phase, after inoculation of the bacteria to the photobioreactor, the cells adjust to
the new environment and synthesize enzymes, ready to begin reproducing. The
duration of the lag phase depends on the inoculum’s growth medium. In this
study, the inoculum composition (20mM/10 mM Ac/Glu) is similar to the
hydrogen production medium (40 mM/2 mM Ac/Glu) in that it contains the
same carbon and nitrogen source (acetate and glutamate) in different
concentrations. In the exponential phase, high cell growth is observed. The cell
growth rate is proportional to the cell concentration. The cells divide at
maximum rate, utilizing the available nutrients for growth. In this study,
hydrogen production was observed in this phase. In the stationary phase, the
cell growth stops due to the depletion of nutrients and essential metabolites.
Generally, many fermentation products are produced in this phase. After the
stationary phase, due to depletion of nutrients and other factors like formation
of toxic or inhibitory by-products, the cell concentration decreases (Fogler,
2006). The stages in the cell growth are shown in Figure 5.1.

103
Figure 5.1 Phases of bacterial cell growth (Fogler, 2006).
Purple non-sulphur bacteria have been shown to retain their capacity to
produce hydrogen in the stationary phase (Zürer et al., 1979, Sasikala et al.,
1991, Koku et al., 2003, Melis et al., 2008). So for the commercial exploitation
of continuous hydrogen production, a nearly constant hydrogen evolution can
be achieved using fed-batch systems. In this system, the feed is replenished at
consecutive times in the non-growing cells. This strategy is applied in this
study.
The cell growth can be theoretically represented as:
dX Xdt
μ= (5.1)
where X is the cell dry weight concentration (gdcw/lc) and µ is the specific
growth rate (h−1).
5.2 The Logistic Growth Model
The logistic model is a suitable method for representing the entire cell
growth curve as it includes all the phases; the lag phase, exponential and
stationary phases. The hydrogen production experiments done in this study
were found to fit this model. The model can be shown as:

104
cmax
Xk 1-X
μ⎛ ⎞
= ⎜ ⎟⎝ ⎠
(5.2)
where kc is the apparent specific growth rate (h−1), X is the cell dry weight
concentration (gdcw/lc) and Xmax is the maximum cell dry weight concentration
(gdcw/lc). Substituting Equation 5.2 into Equation 5.1 and integrating,
Equation (5.3) is obtained.
( )0 c
0c
max
X exp(k t)XX1- 1 exp(k t)
X
=⎛ ⎞
−⎜ ⎟⎝ ⎠
(5.3)
where X0 is the initial bacterial cell concentration.
The experimental data collected in this study were fitted into the
logistic model using a program for fitting curves, Curve Expert 1.3. The results
are shown in the following pages.
S = 0.05278418r = 0.94897017
X Axis (units)
Y A
xis
(uni
ts)
0.0 87.9 175.7 263.6 351.5 439.4 527.20.35
0.49
0.63
0.77
0.92
1.06
1.20
Figure 5.2 The logistic model for the Rhodobacter capsulatus (DSM 1710)
CPBR outdoor experiment (13th September, 2008 – 3rd October, 2008).
40 mM / 2 mM Ac/Glu feed media was used in the experiment.

105
S = 0.06263714r = 0.97739241
X Axis (units)
Y Ax
is (u
nits
)
0.0 98.2 196.3 294.5 392.6 490.8 588.90.12
0.31
0.49
0.68
0.86
1.05
1.24
Figure 5.3 The logistic model for the heat adapted Rhodobacter capsulatus
(DSM 1710) CPBR outdoor experiment (20th September, 2008 - 29th
December, 2008). 40 mM/ 2 mM Ac/Glu feed media was used in the
experiment.
S = 0.02251404r = 0.98712032
X Axis (units)
Y Ax
is (u
nits
)
0.0 52.3 104.7 157.0 209.3 261.7 314.00.13
0.20
0.28
0.35
0.43
0.51
0.58
Figure 5.4 The logistic model for the Rhodobacter capsulatus YO3 (Hup-)
outdoor experiment (16th October – 24th December, 2008). 40 mM / 2 mM
Ac/Glu feed media used in the experiment.

106
S = 0.01443305r = 0.99654298
X Axis (units)
Y Ax
is (u
nits
)
0.0 52.4 104.7 157.1 209.4 261.8 314.10.24
0.34
0.45
0.55
0.66
0.76
0.87
Figure 5.5 The logistic model for the Rhodobacter capsulatus YO3 (Hup-)
60 mM/3 mM Ac/Glu fed CPBR indoor experiment (21st March – 3rd May,
2009).
S = 0.04245126r = 0.98599191
X Axis (units)
Y Ax
is (u
nits
)
0.0 38.3 76.6 114.9 153.3 191.6 229.90.24
0.39
0.53
0.68
0.83
0.98
1.13
Figure 5.6 The logistic model for the Rhodobacter capsulatus YO3 (Hup-)
80 mM/4 mM Ac/Glu CPBR indoor experiment (21st March – 1st April, 2009).

107
Tabl
e 5.
1 Lo
gist
ic m
odel
con
stan
t par
amet
ers f
or th
e co
ntin
uous
pho
tobi
orea
ctor
s.

108
5.3 Discussion
The logistic model very well defines the biomass change with time in
all the experiments. It indicates average biomass level that should be attained
in stable operations. The increase in cell density depends on local or momental
factors such as the increase in light intensity, temperature, acetate
concentration and pH. The cell growth rate becomes zero when the cell
concentration reaches the maximum biomass concentration. Since
R. capsulatus is a photosynthetic bacteria, it can grow with illumination. So the
change in the external effects may differently influence the maximum cell
concentration, which is about 1 gdcw/lc for the R. capsulatus (DSM 1710). The
case where maximum cell concentration is 0.55 gdcw/lc must be re-examined.
This difference could most probably be because of the differences in light
intensity. Bacteria has a threshold cell concentration above which the cells do
not get enough energy from light and so stop growing. When the cell
concentration reaches a minimum value, the cells are stimulated with light and
start growing again.
These experiments concur with the findings with R. sphaeroides (Koku
et al., 2003; Eroğlu, et al., 2008). They prove that the highest input of light
energy is utilised for cell growth. The substrates carbon source and nitrogen
source must be kept at an optimum level. Acetate is mainly utilized for
hydrogen production and the by-products for storage purposes. The specific
growth rate µ is in concurrence with kc. This asserts the fit of the logistic model
to the experimental data.

109
CHAPTER 6
CONCLUSIONS AND RECOMMENDATIONS
6.1 Conclusions
1. Several conclusions can be drawn from the indoor and outdoor experiments
carried out in the continuous photobioreactors.
• Acetate is a suitable carbon source for continuous hydrogen production
using Rhodobacter capsulatus in long term. It is utilized by the PNS
bacteria for growth and hydrogen production.
• Rhodobacter capsulatus YO3 (Hup-) strain is more suitable for
hydrogen production on acetate than Rhodobacter capsulatus (DSM
1710) and its heat adapted strains.
• Hydrogen production levels depend on the photobioreactor irradiance
level, temperature and C/N ratio of the feed medium.
• The optimum C/N ratio for Rhodobacter capsulatus YO3 (Hup-) is 25.
The feed media should contain 40 mM acetate and 4 mM glutamate.
• Stable biomass growth can be attained by adjusting the glutamate
concentration (nitrogen source) in the feed medium.
• The presence of endogenous substrates leads to obtaining of over 100%
substrate conversion efficiency by the PNS bacteria.
• Formic acid is formed as a fermentation end product when acetate is
used as carbon source to the Rhodobacter capsulatus YO3 (Hup-).
• Total gas produced in the continuous photobioreactors experiments
using Rhodobacter capsulatus comprise 87-95% hydrogen with the rest
being CO2.

110
• pH range between 7-7.5 during hydrogen production in continuous
photobioreactors using Rhodobacter capsulatus.
2. Several conclusions can be drawn from the ammonium ion removal
experiments using clinoptilolite.
• Batch pre-treatment of clinoptilolite is an effective way of increasing
the zeolite ion exchange capacity.
• Clinoptilolite zeolite is suitable to use in decreasing ammonium ion
content in the dark fermenter effluent from thermophilic fermentation.
3. The logistic model fit the experimental data from the continuous
photobioreactors.
6.2 Recommendations
1. Further experiments with the optimized feed composition can be done using
the Rhodobacter capsulatus YO3 (Hup-) strain in continuous panel
photobioreactors. They include:
• An indoor experiment with higher light intensity (270W/m2) to
investigate its effect on biomass, hydrogen production and formic acid
formation through fermentation.
• Indoor experiments to investigate the effect of increasing feed
composition while maintaining the optimized C/N ratio constant.
• An outdoor experiment with the optimized feed to test the culture
performance under natural sunlight in outdoor conditions.
2. Test of the heat adapted Rhodobacter capsulatus (DSM 1710) in outdoor
conditions in high temperatures and light intensity during the summer.
3. Design of a cooling system for the panel photobioreactors as operation in
higher light intensities would lead to temperature increase.

111
4. Suggestions in the reduction of ammonium ion using clinoptilolite zeolite
include:
• Use of different masses of clinoptilolite to determine the ion exchange
capacities of the pretreated zeolite.
• Use of ammonium ion measuring kit in determining the ammonium ion
content in the dark fermenter effluent. This would give more accurate
results because ions like K+ could interfere with the ammonium ion
measurement electrode.
5. Suggestions on the modeling of the continuous photobioreactors are:
• To try fitting the logistic model to more experimental data from the
continuous experiments.
• Re-examine factors which may affect the growth of cells in the
photobioreactors and determine a relation between these parameters and
the cell concentration. Parameters such as light intensity, temperature,
cell concentration, pH and light and dark cycle, could be examined by
performing different experiments. The relations found can be used to
create a model that will depict the behavior of the cells in certain
conditions.

112
REFERENCES
Abusafa, A., Yücel, H., 2002, ‘‘Removal of 137Cs from Aqueous Solutions
Using Different Cationic Forms of a Natural Zeolite: Clioptilolite’’, Separation
and Purification Technology, 28: 103 – 116.
Adam, P. S., Andrew, E. L., 2007, ‘‘Exergy Analysis of Hydrogen Production
via Steam Methane Reforming’’, Int. Journal Hydrogen Energy,
32: 4811 – 4820.
Akkerman, I., Janssen, M., Rocha, J., Wijffels, R.H., 2002, “Photobiological
hydrogen Production: Photochemical Efficiency and Bioreactor Design”, Int. J.
Hydrogen Energy, 27: 1195 – 1208.
Arai, T., Wakayama, T., Okana, S., Kitamura, H., 1998, “Open Air Hydrogen
Production by Photosynthetic Bacteria Used Solar Energy During Winter
Seasons in Central Japan”, presented in Int. Conference on Biological
Hydrogen Production, Hawaii, USA.
Arik, T., Ufuk G., Yücel, M., Türker L., Sediroğlu, V., Eroğlu, İ,
‘‘Photoproduction of hydrogen by Rhodobacter sphaeroides OU001’’, In:
Proceedings of the 11th World Hydrogen Energy Conference, vol. 3. Stuttgart,
Germany, 1996. p. 2417–24.
Asada, Y., Ohsawa, M., Nagai, Y., Ishimi, K., Fukatsua, M.., Hideno, A.,
Wakayama, T., Miyake, J., 2008, ‘‘Re-evaluation of Hydrogen Productivity
from Acetate by some Photosynthetic Bacteria’’, Int. J. of Hydrogen Energy
33: 5147 – 5150

113
Aşiroğlu, S., 2006, “Lead (II) and Ammoniun Exchange on Na-Form of
Gördes Clinoptilolite’’, MSc. Thesis in Chemical Engineering, Middle East
Technical University, Ankara, Turkey.
Avcıoğlu, S.G., Androga, D.D, Uyar, B., Özgür, E., Gündüz, U., Yücel, M.,
Eroğlu, İ., 2009, ‘‘Continuous Hydrogen Production by R. capsulatus on
Acetate in Panel Photobioreactors’’, HYPOTHESIS VIII, Lisbon, Portugal,
April 1-3, 2009.
BACAS Report, ‘‘Hydrogen as an Energy Carrier’’, Royal Belgian Academy
Council of Applied Science (2006).
Barbosa, M.J., Rocha, J.M.S., Tramper J., Wijffels, R.H., 2001, ‘‘Acetate as a
Carbon Source for Hydrogen Production by Photosynthetic Bacteria’’, J.
Biotechnol., 85:25–33.
Bayraktaroğlu, 2006, “Multicomponent Ion Exchange on Clinoptilolite’’, MSc.
Thesis in Chemical Engineering, Middle East Technical University, Ankara,
Turkey.
Benemann, J.R., Berenson J.A., Kaplan N.O., Kauren M.D., 1973, ‘‘Hydrogen
Evolution by a Chloroplast-Ferredoxin-Hydrogenase System’’, Proc. National
Academy Science 70:2317-20.
Berktaş, B.M., Bircan A., 2003 ‘‘Effects of Atmospheric Sulphur Dioxide and
Particulate Matter Concentrations on Emergency Room Admissions Due to
Asthma in Ankara’’, Tuberculosis and Thorax Journal, 51: 231-238.

114
Biebl, H., Pfennig, N., 1981, “Isolation of Members of the Family
Rhodosprillaceae.”, In: The prokaryotes. Editors: Starr, M.P., Stolp, H.,
Trüper, H.G., Balows, A., Schlegel, H.G., New York: Springer-Verlag,
267-273.
Biel, A.J., 1986, “Control of Bacteriochlorophyll Accumulation by Light in
Rhodobacter capsulatus”, Journal of Bacteriology, 168: 655-659.
Boran, E., Özgür, E., Gebicki, J., van der Burg, J., Yücel, M., Gündüz, U.,
Modigell, M., Eroğlu, İ., 2009, ‘‘Investigation of Influencing Factors For
Biological Hydrogen Production By R. capsulatus in Tubular Photo-
bioreactors’’, Presentation, 4th Joint Event PRES’09 & ICheaP-9, 10th -13th
May 2009, Rome, Italy.
Bockris, J’O.M., 1981, ‘‘The Economics of Hydrogen as a Fuel’’, Int. J.
Hydrogen Energy, 6,223-241.
Braunegg G., Sonnleitner B., Lafferty R.M., 1978, ‘‘A Rapid Gas
Chromatographic Method for the Determination of Boly-β-hydroxybutyric
Acid in Microbial Biomass’’, Biotechnology and Bioengineering, 6: 29-37.
Breck, D.W., 1971, “ Zeolites Molecular Sieves, Structure, Chemistry and
Use” pp 4-6, 128-130, 213, 231, John Wiley and Sons, Inc.,New York.
Burgess, G., Fernandez-Velasco, J.G., Lovegrove K., 2006, ‘‘Materials,
Geometry and Net Energy Ratio of Tubular Photobioreactors for Microalgal
Hydrogen Production’’, WHEC 16 / 13-16 June 2006 , Lyon, France.
Carlozzi, P., 2000, ‘‘Hydrodynamic Aspects and Arthrospira Growth in Two
Outdoor Tubular Undulating Row Photobioreactors’’, Appl. Mirobiol.
Biotechnol. 54,14–22.

115
Chen, SD., Sheu, DS, Chen, W.M., Lo, Y.C, Huang, T.I., Lin, C.Y., 2007,
‘‘Dark Hydrogen Fermentation from Hydrolyzed Starch Treated with
Recombinant Amylase Originating from Caldimonas taiwanensis’’,
Biotechnol. Prog. 23:1312–20.
Claassen P.A.M., Vrije T., 2006, ‘‘Non-thermal Production of Pure Hydrogen
from Biomass: HYVOLUTION’’, Int. Journal of Hydrogen Energy,
31: 1416 – 1423.
Clayton, R.K., 1966, “Spectroscopic Analysis of Bacteriochlorophylls In-vitro
and In-vivo”, Photochemistry and photobiology, 5: 669-677.
Cohen-Bazire, G., Sistrom W.R., Stanley, R.Y., 1957, ‘‘Kinetic Studies of
Pigment Synthesis by Non-Purple Sulphur Bacteria’’, J.Cell. Comp. Physiol.
49: 25-68.
Collot, A-G., 2002., ‘‘Matching Gasifiers to Coals’’, IEA Clean Coal Centre,
London, UK.
Czuppon, T.A., Knez S.A., Newsome, D.S., Othmer Encyclopedia of Chemical
Technology, New York: Wiley 1996. p. 884.
Çulfaz, A., Yagız, M., 2004, ‘‘Ion Exchange Properties of Natural
Clinoptilolite: Lead, Sodium and Cadmium-sodium Equilibria’’, Separation
and Purification Technology, 37: 93 – 105.
Das, D., Veziroğlu T.N., 2001 “Hydrogen Production by Biological Processes:
A Survey of Literature”, Int. J. Hydrogen Energy, 26: 13-28.

116
Eroglu, E., 2006, “Biological Hydrogen Production from Olive Mill
Wastewater and its Applications to Bioremediation”, Ph.D. Thesis in Chemical
Engineering, Middle East Technical University, Ankara.
Eroğlu, I., Aslan, K., Gündüz, U., Yücel, M., Türker, L., 1999, ‘‘Substrate
Consumption Rates for Hydrogen Production by Rhodobacter sphaeroides in a
Column Photobioreactor’’, J. Biotechnol. 70: 103–113.
Eroğlu, I., Tabanoglu, A., Gündüz, U., Eroglu, E., Yücel, M., 2008, “Hydrogen
Production by Rhodobacter sphaeroides O.U.001 in a Flat Plate Solar
Bioreactor”, Int. J. Hydrogen Energy,
Fascetti, E., and Todini, O., 1995, “Rhodobacter sphaeroides RV Cultivation
and Hydrogen Production in One and Two-stage Chemostat”, Appl.
Microbioal. Biotechnology, 44: 300-305.
Fang, H.H.P., Liu, H., Zhang, T., 2002, ‘‘Characterization of a Hydrogen
Producing Granular Sludge’’, Biotechnology, Bioengineering, 78: 44-52.
Fogler, H.S., 2006 ‘‘Elements of Chemical Reaction Engineering’’, Prentice
Hall International Series, 4th Edition.
Fuller, R.C., Smillie, R.M., Sisler, E.C., Kornberg, H.L., 1961, “Carbon
Metabolism in Chromatium”, J. Biol. Chem., 236: 2140.
Gaffron ,H., Rubin, J., 1992, ‘‘ Fermentative and Photochemical Production of
Hydrogen by Algae’’, J. Gen. Physiology, 26: 219-40.

117
Gebicki, J., Modigell, M., Schumacher M., ‘‘Continuously Operated
Photobioreactor for Hydrogen Production’’, R.W.T.H. HYVOLUTION
POSTER, Process Net Jahrestagung, 2007, 16-18 October 2007, Aachen,
Germany.
Gogotov, I.N., 1986, ‘‘Hydrogenases of Phototrophic Microorganisms’’,
Biochimie, 68:181–187.
Groenestijn, J.W., Hazewinkel, J.H.O., Nienoord, M., Bussmann, P.J.T., 2002,
‘‘Energy aspects of Biological Hydrogen Production in High Rate Bioreactors
Operated in the Thermophilic Temperature Range’’, Int. J. Hydrogen Energy
27:1141–1147.
Groenestijn J.W., Geelhoed J.S., Goorissen H.P., Meesters K.P.M., Stams
A.J.M., Claassen P.A.M.. 2009., ‘‘Performance and Population Analysis of a
Non-Sterile Trickle Bed Reactor Inoculated with Caldicellulosiruptor
saccharolyticus, a Thermophilic Hydrogen Producer’’, Biotechnol.,
102:1361-1367.
Hall, D.O., Markov, S.A., Watanable, Y., Rao, K.K., 1995., ‘‘The Potential
Applications of Cyanobacterial Photosynthesis for Clean Technologies’’,
Photosynth. Res. 46, 159–167.
Hallenbeck, P.C., Benemann, J.R., 2002, “Biological Hydrogen Production:
Fundamentals and Limiting Processes”, Int. J. of Hydrogen Energy,
27: 1185 –1193.
Hassmann, K., Kuhne, H. M., 1993, ‘‘Primary Energy Sources for Hydrogen
Production’’, Int. J. Hydrogen Energy, 18: 635-640.

118
Hillmer, P., Gest, H., 1977, “Hydrogen metabolism in the Photosynthetic
Bacterium Rhodopseudomonas capsulata: Hydrogen Production by Growing
Cultures”, J. Bacteriol.,129: 724-731.
Hoekema, S., Bijmans, M., Janssen, M., Tramper, J., Wijffels, R.H., 2002, “A
Pneumatically Agitated Flat-Panel Photobioreactor with Gas Re-circulation:
Anaerobic Photoheterotrophic Cultivation of a Purple Non-sulfur Bacterium”,
Int. J. Hydrogen Energy, 27: 1331– 1338.
Hirabayashi, H., Amakawa, M., Kamimura, Y., Shino Y., Satoh, H., Itoh, S.,
Tamiaki, H., 2006, “Analysis of Photooxidized Pigments in Water Soluble
Chlorophyll Protein Complex Isolated from Chenopodium Album”, Journal of
Photochemistry and Photobiology, 183: 121–125.
Imhoff, J.F., Truper H.G., Pfennig, N., 1984, ‘‘Rearrangement of the Species
and Genera of the Phototrophic Purple Non-Sulfur Bacteria’’, Int. J. Syst.
Bacteriol. 34: 340–343.
Jouanneau,Y., Wong, B., Vignais, P.M., 1985, ‘‘Stimulation by Light of
Nitrogenase Synthesis in Cells of Rhodopseudomonas capsulata Growing in
N-limited Continuous Cultures’’, Biochimica. Biophys. Act., 808, pp.149-155
Kadar, Z., Vrije T., Budde, M.A.W., Szengyel, Z., Reczy, K., Claassen,
P.A.M., 2003, ‘‘Hydrogen Production from Paper Sludge Hydrolysate’’, Appl.
Biochem. Biotechnol. 105–108:557–566.
Kadar, Z., Vrije T., van Noorden G.E., Budde, M.A.W., Szengyel, Z., Reczy,
K., Claassen, P.A.M., 2004, ‘‘Yields from Glucose, Xylose, and Paper Sludge
Hydrolysate During Hydrogen Production by the Extreme Thermophile
Caldicellulosiruptor saccharolyticus’’, Appl. Biochem. Biotechnol.
113–116:497–508.

119
Kengen, S.W.M., Goorissen, H.P., Verhaart, M., Stams, A.J.M., van Niel,
E.W.J., Claassen, PAM., 2008, ‘‘Biological Hydrogen Production by
Anaerobic Microorganisms’’, Chichester: John Wiley & Sons. p 197–221.
Khatipov, E., Miyake, M., Miyake, J., Asada, Y., 1998, “Accumulation of
Poly-hydroxybutyrate by Rhodobacter sphaeroides on Various Carbon and
Nitrogen Substrates”, FEMS Microbiology Letters, 162: 39-45.
Kim, J.S., Ito, K., Takahashi, H., 1980, “The Relationship Between
Nitrogenase Activity and Hydrogen Evolution in Rhodopseudomonas
palustris”, Agric. Biol.Chem, 44: 827–833.
Kleerebezem, R., van Loosdrecht, M.C.M., 2007, ‘‘Mixed Culture
Biotechnology for Bioenergy Production’’, Current Opinion in Biotechnology
18:207–212.
Koku H., 2001, “Hydrogen Metabolism and Factors Affecting Hydrogen
Production in Rhodobacter sphaeroides”, MSc. Thesis in Chemical
Engineering, Middle East Technical University, Ankara, Turkey.
Koku, H., Eroğlu, I., Gunduz, U., Yucel, M., Turker, L., 2002, ‘‘Aspects of the
Metabolism of Hydrogen Production by Rhodobacter sphaeroides’’, Int. J.
Hydrogen Energy, 2:1325-1329.
Koku, H., Eroğlu, İ., Gündüz, U., Yücel, M., Türker, L., ‘‘Kinetics of
Biological Hydrogen Production by Rhodobacter sphaeroides OU 001’’, Int. J.
Hydrogen Energy 2003; 28 :381–8.
120
Krahn, E., Schneider, K., Muller, A., 1996, “Comparative Characterization of
Hydrogen Production by the Conventional Mo Nitrogenase and the Alternative
"Iron-Only" Nitrogenase of Rhodobacter capsulatus Hup- Mutants”, Appl.
Biochem. Biotechnol., 70: 301-310.
Inglezakis, V.J., Hadjiandreu, K.J., Loizidou, M.D., Grigoropoulou, H.P.,
2001, ‘‘Pretreatment of Natural Clinoptilolite in a Laboratory-scale Ion
Exchange Packed Bed’’, Water Research, 35: 2161 – 2166.
Inglezakis, V.J., Grigoropoulou, H.P., 2004, ‘‘Effects of Operating Conditions
on the Removal of Heavy Metals by Zeolite in Fixed Bed Reactors’’, Journal
of Hazardous Materials, 112: 37 – 43.
Liu, B., Nan-Qi R., De-Feng, X., Jie, D., Guo-Xiang, Z., Wan-Qian, G., Ji-Fei,
X., Guo-Jun, X., 2008, ‘‘Hydrogen Production by Immobilized R. faecalis
RLD-53 using Soluble Metabolites from Ethanol Fermentation Bacteria E.
harbinense B49,’’ Bioresource Technology 100, 2719–2723.
Mark, D. R., Marion P-B., and Lynne E. M., 2008, ‘‘Integrating Dark and
Light Bio-hydrogen Production Strategies: Towards the Hydrogen Economy,’’
Reviews in Environmental Science and Biotechnology, 8: 2.
Mc, Auliffe, C. A., ‘‘Hydrogen and Energy’’, The Macmillan Press, London,
1980.
Melis, A., 2002, ‘‘Green Alga Hydrogen Production: Progress, Challenges and
Prospects”, Int. J. Hydrogen Energy, 27: 1217 – 1228.
Meng, Ni., Dennis, Y.C. L., Michael K.H. L., Sumathy K., 2006, ‘‘An
Overview of Hydrogen Production from Biomass’’, Int. Journal of Coal
Geology, 65: 191– 212.

121
Meyer, J., Kelley B.C., Vignais, P.M., 1978, ‘‘Nitrogen Fixation and Hydrogen
Metabolismin Photosynthetic Bacteria’’, Biochimie, 60: 245-260.
Miyake, J., Kawamura, S., 1987, ‘‘Efficiency of Light Energy Conversion to
Hydrogen by Photosynthetic Bacteria Rhodobacter sphaeroides’’, Int. J.
Hydrogen Energy, 12:147-9.
Miyake, J., 1989. ‘‘The Science of Biohydrogen’’, Biohydrogen, Editor: O.R.
Zaborsky, Plenum Press, New York, pp 7-19.
Modigell, M., Holle, N., 1998, “Reactor Development for a Biosolar Hydrogen
Production Process”, Renewable Energy, 14: 421-426.
Moralı, N., 2006, “Investigation of Zinc and Lead Removal from Aqueous
Solutions Using Clinoptilolite’’, MSc. Thesis in Environmental Engineering,
Middle East Technical University, Ankara,Turkey.
Mumpton, F.A., Sand, L.B., Natural Zeolites Occurrence Properties and Use,
Pergamon Press, New York, 1978.
Nakada, E., Asada, Y., Arai, T., Miyake, J., 1995, ‘‘Light Penetration into Cell
Suspensions of Photosynthetic Bacteria and Relation to Hydrogen
Production’’, J. Ferment. Bioeng., 80:57.
Nakada, E., Nishikata, S., Asada, Y., Miyake, J., 1998, “Light Penetration and
Wavelength Effect on Photosynthetic Bacteria Culture for Hydrogen
Production.” In: Biohydrogen, Zaborsky OR, editor. New York: Plenum Press.

122
Niel, E.W.J., Budde, M.A.W., de Haas G.G., van der Wal F.J., Claassen
P.A.M., Stams A.J.M., 2002, ‘‘Distinctive Properties of High Hydrogen
Producing Extreme Thermophiles, Caldicellulosiruptor saccharolyticus and
Thermotogaelfii’’, Int. J. Hydrogen Energy 27:1391–1398.
Ogbanna, J,C., Yada, H., Tanaka, H., 1995, ‘‘Light Supply Coefficient: A New
Engineering Parameter for Photobioreactor Design’’, J. Ferment Bioeng.,
80:369-376.
Ogbonna, J.C., Toshihiko, S., Tanaka, H., 1999, “An Integrated Solar and
Artificial Light System for Internal Illumination of Photobioreactors”, Journal
of Biotechnology, 70: 289–297.
Ooshima. H., Takakuwa, S., Katsuda, T., Okuda, M., Shirasawa, T., Azuma,
M., Kato, J., 1998, ‘‘Production of Hydrogen by a Hydrogenase-defcient
Mutant of Rhodobacter capsulatus’’, J. Ferment Bioeng., 85: 470–4.
Ormerod, J. G., Ormerod K.S., Gest, H., 1961, ‘‘Light dependent Utilization of
Organic Compounds and Photoproduction of Molecular Hydrogen by
Photosynthetic Bacteria: Relationships with Nitrogen Metabolism”, Arch.
Biochem. Biophys. 94: 449-463.
Ouki S.K., Cheeseman C., Perry R., 1994, ‘‘Natural Zeolite Utilisation in
Pollution Control: A Review of Applications to Metal Effluents’’, Journal of
Chemical Technology and Biotechnology, 59: 121 – 126.
Ouki S.K., Kavannagh M., 1999, ‘‘Treatment of Metals-contaminated
Wastewaters by use of Natural Zeolites’’, Water Science and Technology,
39: 115 – 122.

123
Özgür, E., Uyar, B., Öztürk, Y., Yücel, M., Gündüz, U., Eroğlu, İ., 2009,
‘‘Biohydrogen Production by Rhodobacter capsulatus on Acetate at
Fluctuating Temperatures”, Resources, Conservation and Recyling, 2147, 5.
Öztürk, Y., 2005, “Characterisation of the Genetically Modified Cytochrome
Systems and Their Application to Biohydrogen Production in Rhodobacter
Capsulatus”, Ph. D. Thesis in Biotechnology, Middle East Technical
University, Ankara.
Öztürk Y., Yücel M., Daldal F., Mandacı S., Gündüz U., Türker L., Eroglu I.,
2006, ‘‘Hydrogen Production by using Rhodobacter capsulatus Mutants with
Genetically Modified Electron Transfer Chains’’, Int. J. Hydrogen Energy,
31:1545–52.
Pellerin, N.B., and Gest, H., 1983, “Diagnostic Features of the Photosynthetic
Bacterium Rhodopseudomonas sphaeroides”, Current Microbiology,
9: 339-344.
Rainey, F.A., Donnison, A.M., Janssen, P.H., Saul, D., Rodrigo, A., Bergquist,
P.L., Daniel, R.M., Stackebrandt, E., Morgan, H.W., 1994, ‘‘Description of
Caldicellulosiruptor saccharolyticus gen. nov., sp. nov. : An Obligately
Anaerobic, Extremely Thermophilic, Cellulolytic Bacterium’’, FEMS
Microbiol. Lett. 120:263–266.
Ramachandran, R., Menon, R.K., 1998, ‘‘An Overview of Industrial Uses of
Hydrogen’’, Int. J. Hydrogen Energy, 23:593-8.
Reith, J.H, Wijffels R.H., Barten, H., Bio-methane and Bio-hydrogen: Status
and Perspectives of Biological Methane and Hydrogen Production. The Hague:
Smiet offset; 2003. p. 103–23.
124
Richmond A., Zou N., 1999, ‘‘Effect of Light-path Length in Outdoor Flat
Plate Reactors on Output Rate of cell mass and of EPA in Nannochloropsis
sp.’’, Journal of Biotechnology 70: 351–356.
Richmond, A., Cheng-Wu, Z., 2001, “Optimization of a Flat Plate Glass
Reactor for Mass Production of Nannochloropsis sp.Outdoors", J.
Biotechnology, 85: 259-269.
Sarıoglu M., 2005, ‘‘Removal of Ammonium from Municipal Wastewater
Using Natural Turkish (Dogantepe) Zeolite’’, Separation and Purification
Technology, 41: 1- 11.
Sasaki, K., 1998, ‘‘Hydrogen and 5-aminolevulinic acid production by
Photosynthetic Bacteria’’, In: Zaborsky, O.R.(Ed.), Biohydrogen. Plenum
Press, London, pp. 133–142.
Sasikala, K., Ramana, C.V., Rao, P.R., Subrahmanyam, M., 1990, “Effect of
Gas Phase on the Photoproduction of Hydrogen and Substrate Conversion
Efficiency in the Photosynthetic Bacterium Rhodobacter sphaeroides
O.U.001”, Int. J. Hydrogen Energy, 15: 795-797.
Sasikala, K., Ramana, C.H.V., Rao, P.R., 1991. Environmental Regulation for
Optimal Biomass Yield and Photoproduction of Hydrogen by Rhodobacter
sphaeroides O.U.001’’, Int. J. Hydrogen Energy, 16, 597–601.
Sasikala, K., Ramana, C.V., Rao, PR.., Kovacs, K.L., 1993, ‘‘Anoygenic
Phototropic Bacteria: Physiology and Advances in Hydrogen Production
Technology,’’ Advanced Applied Microbiolog., 38:211-295

125
Sasikala, C., Ramana, C.V., Rao, R., 1997, ‘‘Environmental Regulation for
Optimal Biomass Yield and Photoproduction of Hydrogen by Rhodobacter
sphaeroides O.U. 001’’, Int. J. Hydrogen Energy, 16 : 597–601.
Segers, L., Verstrynge, L., Verstraete, W., 1981, ‘‘Product Patterns of Non-
axenic Sucrose Fermentation as a Function of pH’’, Biotechnol. Lett.
3, 11: 635–640.
Segers, L., Verstraete, W., 1983, “Conversion of organic acids to Hydrogen by
Rhodospirillaceae Grown with Glutamate or Dinitrogen as Nitrogen Source”,
Biotechnol. Bioeng., 25: 2843–2853.
Semmens M.J., Seyfarth M., Sand L.B., Mumpton F.A., ‘‘Natural Zeolites,
Occurence, Properties and Use’’, Pergamon Press, New York, 1978.
Shi, X.Y., Yu, H.Q., 2006, ‘‘ Continuous Production of Hydrogen from Mixed
Volatile Fatty Acids with Rhodopseudomonas capsulatus’’, Int. J., Hydrogen
Energy 2006, 31:1641–7.
Simpson, A.P., Lutz, A.E., 2007, ‘‘Energy Analysis of Hydrogen Production
via Steam Methane Reforming’’, Int. J Hydrogen Energy, 32:4811–20.
Smith, G.D, Ewart, G.D., Tucker, W., 1992, ‘‘Hydrogen Production by
Cyanobacteria’’, Int. J. Hydrogen Energy, 17: 695-8.
Stevens, P., Plovie, N., de Vos, P., de Ley, J., 1986, ‘‘Photoproduction of
Molecular Hydrogen by Rhodobacter sufidophilus’’, System. Appl. Microbiol.
8: 19-23.
Senior, P.J., Dawes, E.A., 1973, ‘‘ The Regulation of Poly-b-Hydroxybutyrate
Metabolism in Azotobacter beijerinckii’’, Biochem. J. 134: 225–0.

126
Suludere, D., 2001, “Investigation of Polyhydroxybutyrate (PHB) Production
by Photosynthetic Bacterium: Rhodobacter sphaeroides O.U.001”, M.Sc.
Thesis in Biology, Middle East Technical University, Ankara, Turkey.
Suzuki, Y., 1982, ‘‘On Hydrogen as a Fuel Gas’’, Int. J. Hydrogen Energy,
7: 227-230.
Szostak R., 1984 “Handbook of Molecular Sieves”, pp. 126-132, Van Nostrand
Reinhold, New York.
Tabanoğlu, 2002, “Hydrogen Production by Rhodobacter sphaeroides O.U.001
in a Solar Bioreactor”, Msc. Thesis in Biotechnology, Middle East Technical
University, Ankara, Turkey.
Tao, Y., Chen, Y., Wu, Y., He, Y., Zhou, Z., 2007, “High hydrogen Yield from
a Two-Step Process of Dark and Photofermentation of Sucrose”, Int. J.
Hydrogen Energy, 32: 200-206.
Tredici, M.R., 1999, ‘‘Bioreactors’’, In: Flickinger, M.C., Drew, S.W.
(Editorss.), Encyclopedia of Bioprocess Technology: Fermentation,
Biocatalysis and Bioseparation, vol. 1. Wiley, New York, pp. 395–419.
Tredici, M.R., Zitelli, G., 1997, ‘‘Cultivation of Spirulina (Arthrospira)in Flat
Plate Reactors’’, In Spirulina platensis(Arthrospira): Physiology, Cell-biology
and Biotechnology, Avigad Vonshak (Ed.), Taylor and Francis, pg.117-130.
Tredici, M.R., 2004, “Mass Production of Microalgae: Photobioreactors”. In
‘Handbook of Microalgal Culture, Biotechnology and Applied Phycology”, A.
Richmond (Ed.), Blackwell Scientific, 178-214.

127
Trosehel, D., Müller, M., 1990, ‘‘Development of a Cell-free System to Study
the Membrane Assembly of Photosynthetic Proteins of Rhodobacter
capsulatus’’, Biochemisches Institut der Universitat, D-7800 Freiburg, Federal
Republic of Germany.
Tsygankov, A.A., Hirata, Y., Miyake, M., Asada, Y., Miyake, J., 1993,
‘‘Hydrogen Evolution Photosynthetic Bacterium Rhodobacter sphaeroides RV
Immobilized on Porous Glass’’, New Energy Systems and Conversions,
Universal Academy Press, pp. 229–233.
Türkarslan, S., Yiğit, D.Ö., Aslan, K.., I. Eroğlu and Gündüz U., 1998,
“Photobiological Hydrogen Production by Rhodobacter sphaeroides O.U. 001
by Utilization of Waste Water from Milk Industry”, In: O.R. Zaborsku, Editor,
Biohydrogen, Plenum Press, New York.
UN Department of Economic and Social Affairs, Population Division, ‘‘ Press
Release, 2009’’, http://www.un.org/esa/population/, 11th March, 2009.
Uyar, B., Gündüz, U., Yücel, M., Türker, L., Eroglu, I., 2007, “Effect of Light
Intensity, Wavelength and Illumination Protocol on Hydrogen Production in
Photobioreactors”, Int. J. Hydrogen Energy, 32: 4670– 4677.
Uyar, B., 2008, “Hydrogen Production by Microorganisms on Solar
Bioreactors”, P.h.D. Thesis in Biotechnology, Middle East Technical
University, Ankara, Turkey.
Veziroğlu, T.N., 1995, ‘‘Twenty Years of the Hydrogen Movement 1974 -
1994’’, Int. J. Hydrogen Energy, 20: 1-7.
128
Vignais, P.M., Colbeau, A., Willison, J.C., Jouanneau, Y., 1985,
“Hydrogenase, Nitrogenase, and Hydrogen Metabolism in Photosynthetic
Bacteria”, Adv. Microbial Phys., 26: 154-234.
Vrati, S., 1984, ‘‘Single Cell Protein Production by Photosynthetic Bacteria
Grown on the Clarified Effluents of Biogas Plant’’, Appl. Microbiol.
Biotechnol. 19, 199-202
Vrije, T., Claassen, P.A.M., Dark Hydrogen Fermentations. In: Reith, J.H.,
Wijffels, R.H., Barten, H., (Editors), ‘‘Bio-methane and Bio-hydrogen- Status
and Perspectives of Biological Methane and Hydrogen Production’’, the
Hague: Smiet offset; 2003. p. 103–23.
Wakayama, T., Miyake, J., Toriyama, A., Kawasugi, T., Arai, T., Asada, Y.,
1998, ‘‘Photohydrogen Production Using Photosynthetic Bacterium
Rhodobacter sphaeroides RV; Simulation of the Light Cycle of Natural
Sunlight Using an Artificial Source’’, In: Zaborsky OR. (Editor) Biohydrogen.
London: Plenum Press.
Willison, J.C., 1988, “Pyruvate and Acetate Metabolism in the Photosynthetic
Bacterium R. capsulatus”, J. Gen. Microbiology, 134: 2429-2439.
Yiğit, D.Ö., Gündüz, U., Türker, L., Yücel, M., Eroglu I., 1999, “Identification
of By-products in Hydrogen Producing Bacteria: Rhodobacter sphaeroides
O.U. 001 Grown in the Wastewater of a Sugar Refinery”, J. Biotechnol.,
70: 125-131.
Zabut, B., Kahlout, K. E., Yücel, M., 2006, ‘‘Hydrogen Gas Production by
Combined Systems of Rhodobacter sphaeroides O. U. 001 and Halobacterium
salinarum in a Photobioreactor’’, Int. J. of Hydrogen Energy, 31: 1553- 1562.

129
Zhang, K., Kurano, N., Miyachi, S., 1999, “Outdoor Culture of a
Cyanobacterium with a vertical Flat-plate Photobioreactor: Effects on
Productivity of the Reactor Orientation, Distance Setting between the Plates
and Culture Temperature”, Appl. Microbiol. Biotechnol., 52: 781-786.
Zhang, H.S., Bruns M.A., Logan B.E., 2006, ‘‘Biological Hydrogen Production
by Clostridium acetobutylicum in an Unsaturated Flow Reactor’’, Water Res.
40:728–734
Zorin, N.A., 1986, ‘‘Redox Properties and Active Center of Phototrophic
Bacteria Hydrogenases’’, Biochimie 1986;68:97–101.

130
APPENDIX A
COMPOSITION OF THE FEED MEDIUM Table A.1 The composition of the standard basal, growth and hydrogen
production medium per litre of solution.
Component Amount
Standard Basal Medium
KH2PO
4 (22 mM) 0.5g
MgSO4.7H
20 0.5g
CaCl2.2H
2O 0.5g
Vitamin Solution 1 ml Fe-Citrate* 0.1 ml Trace Elements 0.1 ml Growth Medium** Acetate Glutamate
20 mM 10 mM
Hydrogen Production Medium** Acetate Glutamate
40 - 80 mM 2 - 4 mM
* 0.5 g Fe-citrate was dissolved in 100 ml distilled water and sterilized by autoclaving. **Consists of the standard basal medium plus acetate and glutamate.

131
Table A.2 The composition of trace element solution.
Composition Amount Amount HCl (25% v/v) 1 ml
ZnCl2 70 mg MnCl2 × 4H2O 100 mg
H3BO3 60 mg CoCl2 × 6 H2O 200 mg CuCl2 × 2 H2O 20 mg NiCl2 × 6 H2O 20 mg
NaMoO4 × 2 H2O 40 mg H2O Complete to 1l
Table A.3 The composition of the vitamin solution.
Composition Amount
Thiamine 500 mg Niacin (Nicotinate) 500 mg
Biotin 15 mg H2O Complete to 1 l

132
APPENDIX B
DETERMINATION OF THE ACETATE AND GLUTAMATE
CONCENTRATION IN THE GROWTH MEDIUM
Equation B1 is the formation of Rhodobacter capsulatus biomass from acetic
acid.
3 5 8 4 2 1.76 0.38 0.14 2 2CH COOH C H NO .H O CH O N CO H O (B1) acetic acid glutamate biomass
a b c d e+ → + +
• Elemental balance
C: 2a + 5b = c + d (B2) H: 4a + 10b = 1.76c + 2e (B3) O: 2a + 5b = 0.38c + 2d + e (B4) N: b =0.14c (B5)
Unknowns variables: a, b c, d, e
Equations: 4
We need to define one variable to solve the four elemental balance equations.
• Assuming b = 0.14
0.14 10.14
c = =

133
• Substituting Equations (B3) and (B4)
4 10 1.76 2 5 0.38 22
2 5 0.88 2 5 0.38 2 4 (B6)
a b c a b c d
a b c a b c dc d
+ −= + − −
+ − = + − −=
• From Equation (B6),
1 = 0.254 4cd = =
• The values of the variables b, c and d obtained are substituted into
Equation (B2).
2 5
5 2
1 0.25 5(0.14) 2
0.275
a b c dc d ba
a
a
+ = ++ −
=
+ −=
=
• The obtained values of variables a, b, c and d are substituted into
Equation (B3).
4 10 1.76 2
4 10 1.76 2
4(0.275) 10(0.14) 1.76(1) 2
0.37
a b c ea b ce
e
e
+ = ++ −
=
+ −=
=

134
• Inserting the obtained values of variables a, b, c, d and e into equation 1.
3 5 8 4 2 1.76 0.38 0.14 2 21.96 CH COOH C H NO .H O 7.14CH O N 1.79CO 2.64 H O (B7)
+ → + +
• From the elementary Equation (B2), the feed C/N is determined as:
C 1.96 2 1 5 9N 1
× + ×= =
• The growth medium C/N ration is determined as:
C 20 2 10 520 mM/10 mM Ac/Glu growth medium 9N 10
× + ×= =

135
APPENDIX C
OPTICAL DENSITY-DRY WEIGHT CALIBRATION CURVES
Figure C.1 Calibration curve and the regression trend line for Rhodobacter
capsulatus (DSM 1710) dry weight versus OD660 (Uyar, 2008).
- An optical density of 1.0 at 660nm corresponds to a cell density of 0.54 gram
dry cell weight/liter of culture of Rhodobacter capsulatus (DSM 1710).

136
Figure C.2 Calibration curve and the regression trend line for Rhodobacter
capsulatus YO3 dry weight versus OD660 (Öztürk, 2005).
- An optical density of 1.0 at 660nm corresponds to a cell density of 0.47 gram
dry cell weight/liter of culture of Rhodobacter capsulatus YO3 (Hup-).

137
APPENDIX D
Rhodobacter capsulatus LIGHT ABSORBTION SPECTRA
Figure D The light absorption spectrum of Rhodobacter capsulatus (Trosehel
and Müller, 1990).

138
APPENDIX E
SAMPLE GAS CHROMATOGRAM
Figure E Sample gas analysis chromatogram (analysis done by Agilent
Technologies 6890N gas chromatography).

139
APPENDIX F
ORGANIC ACID ANALYSIS F1. Sample organic acid HPLC chromatogram
Figure F.1 Sample HPLC analysis chromatogram (concentrations measured
by Shimadzu 10A series high performance liquid chromatography). Peak 1
(mobile phase- H2SO4), Peak 2 (lactic acid), Peak 3 (Formic acid) and Peak
4 (acetic acid).

140
F2. Sample Acetic Acid HPLC Calibration Curve
Figure F.2 Acetic acid standard calibration curve (concentrations measured by
Shimadzu 10A series high performance liquid chromatography).

141
APPENDIX G
GLUTAMIC ACID ANALYSIS G1. PITC (Phenyl Isothiocyanate) Derivatization Reaction
1. 100 μl of 100 mmol/l phenyl isothiocyanate (acetonitrile solution) and
100 μl of 1 mol/l triethylamine (acetonitrile solution) were added to 200
μL of the liquid sample. The mixture is stirred and let to completely
react for 20 minutes at 400C.
2. Cool the mixture to room temperature after incubation. Add aqueous
hydrochloric acid solution to neutralize the solution (adjust pH to 7.0).
3. Finally, extract the derivatized sample with n-Hexane (3:4).
4. Separate the aqueous phase for injection to the HPLC.
G2. HPLC operation conditions Mobile Phases
MP-A: 10 mmol/l (sodium) phosphate buffer (pH 7.0)
MP-B: Acetonitrile
Flow Rate: 1.0 ml/min
Gradient Profile:
Table G.1. HPLC gradient pump operation profile.
Time Module Action Concentration 5.00 Pumps B. Concentration 10 7.50 Pumps B. Concentration 25 7.51 Pumps B. Concentration 100 13.00 Pumps B. Concentration 100
13.01 Pumps B. Concentration 5 20.00 Controller Stop

142
Column Temperature: 400C
Detection: Absorbance at 254 nm
Injection Volume: 10 μl
Column: Teknokroma mediterranea Sea 18 (150 mm X 4.6 mm i.d, 3μm)
G3. PITC Derivatization and HPLC Analysis Chemical Compositions Table G.2. Glutamic acid measurement mobile phase and derivatization chemicals composition.
Composition Concentration Volume Amount pH
Mobile phase A
KH2PO4
and K2HPO4
10 mM
1 l
KH2PO4 (1.169 g) K2HPO4 (2.438 g)
7.0
Mobile phase B Pumps N/A 1 l N/A
TEA Pumps 1.0 M 100 ml 13.9 ml N/A PITC Pumps 100 mM 100 ml 1.2 ml N/A

143
G4. Sample Glutamic Acid Measurement HPLC Chromatogram
Figure G.1 Glutamic acid standard calibration curve (concentrations
measured by Shimadzu 20A series high performance liquid
chromatography).

144
G5. Sample Glutamic Acid HPLC Calibration Curve
Figure G.2 Glutamic acid standards calibration curve (concentrations
measured by Shimadzu 20A series high performance liquid
chromatography).

145
APPENDIX H DETERMINATION OF BACTERIOCHLOROPHYLL
a CONTENT
This section describes the calculation procedure to determine
bacteriochlorophyll.
Bacteriochrophyll a properties
molecular formula = C55H74N4O6Mg
molecular weight (MW) = 911.5 g/mol
Extinction coefficient =76 mM-1cm-1
Beer Lambert’s Law: A= ε C L
where
Thus, AC =Lε ×
Shown below is a sample calculation for a 0.782 absorbance spectrophotometric reading at 770 nm.
1 1
0.782bchl content = 911.5 9.3976 1 bchla
mg mgamM cm cm mmol l− −
⎛ ⎞ ⎛ ⎞× =⎜ ⎟ ⎜ ⎟×⎝ ⎠ ⎝ ⎠
A: absorbance
ε : Extinction coefficient (mM-1cm-1)
C: concentration (mM)
L: length(cm)

146
APPENDIX I
SAMPLE CALCULATIONS FOR HYDROGEN PRODUCTION
In this section, the calculation procedure for hydrogen productivity,
substrate conversion efficiency (yield) and light conversion efficiency is
shown. To illustrate, the Phase II data for the continuous panel photobioreactor
with 40 mM/2 mM Ac/Glu feed given in section 4.3.1 will be used. The culture
volume is 7.6 l and 84.4 l of hydrogen gas was produced. 50.6 g of acetate and
6.5 g of glutamate were utilized over the 31 days. The 0.4 m2 reactor surface
was continuously illuminated by tungsten lamps providing 86 W/m2 light
intensity. These data are used to determine the hydrogen productivity, substrate
conversion and light conversion efficiency.
I1. Hydrogen Productivity
This is the rate at which hydrogen gas is produced by the bacterial
culture. It can be expressed in terms of the volume or moles of hydrogen gas
produced.
I1.1 Volumetric Productivity
The volumetric hydrogen productivity is the rate at which hydrogen is
produced in terms of volume. It is expressed as ml H2/lc.h.
Volume of hydrogen produced (ml)Volumetric Hydrogen Productivity =Volume of culture Time
⎛ ⎞⎜ ⎟×⎝ ⎠
(I1.1)

147
( )2
2
final initial H
H
Volume of hydrogen produced = V -V y (I.1.2)
where V is the volume (ml) of the total gas in the collection column and y is the
mole fraction of hydrogen
×
in the total gas produced.
A sample calculation for the volumetric productivity using the Phase II data for
the 40 mM/ 2 mM Ac/Glu fed CPBR is shown.
22
22 c
c
ml H84.4 l H 1000l HVolumetric Hydrogen Productivity = 15 ml H l .hh7.6 l 31 days 24
day
⎛ ⎞×⎜ ⎟⎜ ⎟ =⎜ ⎟× ×⎜ ⎟⎝ ⎠
I1.2 Molar Productivity
This is the rate at which hydrogen gas is produced in terms of moles. It
is expressed as mmol H2/lc.h. It determining the molar productivity, several
assumptions are made. They are:
1. The total gas collected obeys the ideal gas law.
2. There is no leakage from or into the gas collection column and the
photobioreactor.
3. The atmospheric pressure is constant at 687 mmHg.
Using the fist assumption, the moles of hydrogen produced can be determined
using the ideal gas equation.
PV=NRT (I1.3)
Equation H1.3 can be rearranged as:
N = CV (I1.4)
P where C= is a conversion factor (concentration)RT

148
The conversion factor C was determined at the temperature range
experienced in the outdoor conditions. The values obtained considering
Ankara’s atmospheric pressure 687 mmHg (Berktaş and Bircan, 2003) and at
760 mmHg are shown in Table I1.
Table I.1: Molar productivities conversion factor.
T (oC) C(mmol/ml)
687 mmHg C(mmol/ml) 760 mmHg
5 0.040 0.044 10 0.039 0.043 15 0.038 0.042 20 0.038 0.042 25 0.037 0.041 30 0.037 0.040 35 0.036 0.040 40 0.035 0.039 45 0.035 0.038
It is observed that the conversion factor remains more or less the same
at 0.04 mmol/ml. The molar productivities were determined using the
conversion factor (C= P/RT) 0.0445 mmol/ml. Koku (2001) used 0.037
mmol/ml while Uyar (2008) used 0.0446 mmol/ml.
Molar Productivity (N) = Conversion Factor Volumetric Productivity (I1.5)×
A sample calculation for the molar productivity using the Phase II data for the
40 mM/ 2 mM Ac/Glu fed CPBR is shown.
2 c
2 c
mmol Molar Productivity = 0.0445 15 ml H /l .hml
= 0.7 mmol H /l .h
×

149
I2. Substrate Conversion Efficiency (Yield)
The substrate conversion efficiency (yield) determines how effectively
the substrate (organic acid) fed to the bacterial culture is used in hydrogen
production. It is the ratio of the amount hydrogen produced to the amount of
theoretical hydrogen produced from the given carbon sources. Acetate and
glutamate were the two carbon sources used. Shown in Equation (I2) is the
substrate conversion (yield) determination.
Substrate conversion efficiency = Actual moles of H2 produced x 100 (I2) Theorectical moles of H2 produced = moles of H2 produced 4 x moles of Acetate Utilized + 10 x moles of Acetate Utilized
A sample substrate conversion efficiency (yield) calculation for the 40 mM/ 2
mM Ac/Glu fed CPBR Phase II data is shown.
I3. Acetate Conversion
In the Phase II data for the 40 mM/2 mM Ac/Glu fed CPBR described
at the beginning of the Appendix I, daily 40 mM acetate was fed and an
average of 2 mM acetate was removed as shown in the organic acid analysis
Figure 4.21.
Acetate Input (mM) - Acetate Output (mM) Acetate Conversion = 100 (I3)Acetate Input (mM)
⎛ ⎞×⎜ ⎟
⎝ ⎠
g 184.4 l 0.089l 2 g molYield 100 99%50.6 g 6.5 g(4 ) + (10 )
60.05 g mol 147.13 g mol
× ×= × =
× ×

150
I4. Light Conversion Efficiency
where ρH2 is the density of the produced hydrogen gas in g/l, VH2 is the volume
of produced hydrogen gas in l, I is the light intensity in W/m2, A is the
irradiated area in m2 and t is the duration of hydrogen production in hours.
Using the Phase II data for the continuous panel photobioreactor with 40 mM/2 mM Ac/Glu feed.
40 mM - 2 mM Acetate Conversion = 100 95%40 mM
× =
2 2H H33.61 V Light Conversion Efficiency ( ) = 100 (I4)
I A tρ
η× ×
×× ×
22
g33.61 0.089 84.4 l lLight Conversion Efficiency ( ) = 100 0.99%W h86 0.4m 31 days 24
m day
η× ×
× =× × ×

151
APPENDIX J CHEMICAL COMPOSITION AND SEM OF THE ORIGINAL GÖRDES CLINOPTILOLITE Table J.1 Chemical composition of the original clinoptilolite sample.
(Aşiroğlu, 2006)
Component % Weight Moles/100 g Exchangeable Cations meq/g
SiO2 68.2 1.137
Al2O3 11.2 0.110
Fe203 2.400 0.150
MgO 1.000 0.025 0.500
CaO 2.100 0.037 0.740
Na2O 0.600 0.010 0.200
K2O 4.400 0.046 0.920
MnO 0.100 0.001
TiO2 0.100 0.001
P2O5 <0.100 <0.001
Total 90.100 2.36

152
Figure J.2 Scanning Electron Micrograph (SEM) of the original Gördes
clinoptilolite (Aşiroğlu, 2006).

153
APPENDIX K
DARK FERMENTER EFFLUENT OF SUGAR-BEET THICK JUICE MOLASSES
K1. Composition of the DFE of Sugar-Beet Thick Juice Molasses
Table K.1 The composition of the DFE of sugar-beet thick juice molasses.
Composition Amount (mM) Acetate 95 Lactate 128 Sucrose 2 NH4Cl 12.4
K2. Ammonium Ion Electrode Calibration Curve
Figure K.1 Ammonium ion electrode (Russel Model 95-5129) calibration
curve.
154
APPENDIX L
PRELIMINARY STUDY ON THE USE OF PHOTOBIOREACTOR EFFLUENT AS FERTILIZER
A test on the use of photobioreactor effluent as a fertilizer was carried
out. The effluent was taken from an 80 l tubular photobioreactor (Boran et al.,
2009) containing R. capsulatus DSM 1710 wild type. Suumer wheat seeds
were used in the experiment.
Two pots, one watered using the effluent from the photobioreactor and
the other using tap water were run parallel to each other in indoor conditions.
The pots that contained 10 wheat seeds each were run in duplicates and put
next to a window to receive sunlight. Regularly, they were placed outside
under direct sunlight but were returned in indoor conditions.
At the start of the experiment, the PBR effluent had an O.D. of 0.440
and pH of 7.782. The pots were watered with 100 ml of the PBR effluent and
tap water after every two days.
Shown in Figures L.1 and L.2 are pictures of the pots with the wheat
seeds and a comparison of the pots with respect to the shoot length of the
wheat plant. Germination of the seeds was observed on the 2nd day after the
start of the experiment. The wheat seedlings shoots were observed on the 6th
day. Quicker growth and longer shoots were observed in the pots watered with
the PBR effluent. However, rust formation was observed after the 41st day in
the pots with the the PBR effluent. This fungal infection spread to the other
pots. Due to the fungal infection, the leaflets shriveled as shown in Figure L.1
(d). The tap watered wheat plants showed better resilience to the fungal
infections as the length of the shoots surpassed that of the PBR effluent
watered pots as seen in Figure L.2.

155
Figure L.1 a) Comparison of the pots after wheat germination (water, PBR
effluent from left to right). b) The pots placed in outdoor (water (1) and (2),
PBR effluent (1) and (2) from left to right). c) The pots placed in indoor
conditions (PBR effluent (1) and (2), water (1) and (2) from left to right). d)
The wheat plant after fungus infection (PBR effluent (1) and (2) in front and
water (1) and (2) at the back).
Figure L.2 Comparison of the wheat plant shoot lengths grown using the PBR
effluent and tap water.
a) b)
c) d)

156
APPENDIX M
NATURAL ADAPTATION OF R. capsulatus in OUTDOOR CONDITIONS
Successful operation of photobioreactors for hydrogen production in
outdoor conditions under natural sunlight and varying day and night cycle
involve the use of PNS bacteria that is able to withstand the varying outdoor
temperatures and light intensity. The PNS bacteria Rhodobacter capsulatus
(DSM 1710) was adapted to real life conditions. The experiment, carried out by
the METU Biohydrogen group members, Muazzez Gürgan, Begüm Peksel and
Nilüfer Afşar, aimed to adapt Rhodobacter capsulatus (DSM 1710) to the high
summer temperatures experienced during summer in Ankara. Described below
is the experimental procedure carried out between July-August 2008 in Ankara,
Turkey.
• 10% Rhodobacter capsulatus (DSM 1710) wildtype was innoculated
into 50 ml bottles containing 15 mM/10 mM Ac/Glu growth medium
under sterile conditions.
• Two duplicate bottles were placed outside, under direct sunlight and in
a glass house.
• Daily measurements done included:
- Temperature measurement of the outdoor, culture and the
greenhouse.
- pH and OD at 660 nm.
• When OD reached 1.0, the bacteria was passage into fresh media.
Successful adaptation with bacterial growth and hydrogen production
observed at 410C was achieved after 6 passages.

157
APPENDIX N
QUANTITATIVE ANALYSIS OF PHB USING GAS CHROMATOGRAPHY
Poly-3-hydroxybutyrate is a biodegradable thermoplastic formed as an
intracellular and carbon storage material by many genera of bacteria. It is
formed as crystalline granules at amounts of 65% or more of the dry weight of
the cells (Senior and Dawes, 1973).
In this study, PHB formation by Rhodobacter capsulatus was measured
by gas chromatography. Quantitative analysis of PHB using GC is based on the
conversion of PHB to methyl ester by acidic methanolysis reaction and
examination of the volatile methyl ester by GC. Hydrolysis and esterification
of PHB to its methyl ester form is done by treatment with chlorofoam,
methanol and sulfuric acid mixture at high temperature. The amount of PHB is
recovered in the chlorofoam phase (organic phase) after methanolysis by
addition of water.
The analysis method used in this study was developed by Braunegg et
al., 1978. It involves methanolysis of the PHB containing biomass and GC
measurement of the methyl hydroxybutyric acid (ME-3HB). In an optimization
procedure done by Selma Bulut, the PHB concentration of biomass sample
taken from the 60 mM/ 4 mM Ac/Glu fed media CPBR was measured. 150 ml
and 200ml biomass sample with O.D. of 1 were placed in 250 ml vials and
centrifuged (Sigma- model 4K15) at 10000g for 20 minutes at 40C. The
packed cell 0.7 g and 1.2 g wet weight for the 150 ml and 200 ml samples
respectively, were used in the analysis. Also, 4 ml of 2, 5, 10 and 15 mg PHB
standards (Sigma) samples were measured to construct a standard calibration
curve.
In the procedure, the first step was methanolysis. The PHB standards
and centrifuged CPBR samples were placed in rubber-stopper bottles and 2 ml
MeOH/H2SO4 (3%/10% v/v) and 2 ml Chlorofoam solutions added. The

158
rubber-stopper bottles were covered with aluminium foils to prevent exposing
the chlorofoam solution to light. The bottles were then dried in an oven at
1000C for 3.5 h. During drying, at intervals of 1 hour, the samples were shaken
for 1-2 minutes to homogenize the mixture. After methanolysis, the bottles
were cooled to room temperature and the water layer was removed leaving
behind a solution containing methanol, chlorofoam and ME-3HB produced
during methanolysis. ME-3HB is soluble in chlorofoam but insoluble in water.
In the second step, the ME-3HB was measured using GC (Agilent 6890
GC) equipped with an FAB capillary column connected to an FID system. The
injector and detector temperatures were set at 2300C and 2500C respectively.
The oven temperature was set at 700C for 1 minute and then increased at a rate
of 80C per minute until 1600C. 1µl sample of the methanolysed samples were
injected in split mode (1/20). Shown in Figure N.1 is a smplae chromatogram
for the 10 mg sample PHB standard. Methanol, chlorofoam and ME-3HB
peaks are seen at the 3.1, 3.7 and 9.7 minutes respectively.
Figure N.1 Gas chromatogram for the 10 mg PHB standard.

159
Shown in Table N.1 and Figure N.2 are the results of the PHB standards
measurement using gas chromatography and the calibration curve.
Table N.1 Results of the PHB standards measurement using gas chromatography.
Standard (mg) PHB content (mg/ml) after GC analysis Peak Area
2 500 304.49 5 1250 787.21 10 2500 1990.30 15 3750 2695.00
Figure N.2 Gas chromatography PHB measurement standards calibration
curve.

160
The determination of the PHB content is illustrated using the 2 mg standard
(4 ml methanolysed) sample.
32 10 mg mgPHBcontent = 500 (N1)
4 ml ml×
=
Shown in Table N.2 are the gas chromatography PHB measurement results of
the of the samples taken from the 60 mM/ 4 mM Ac/Glu fed media CPBR.
Table N.2 Gas chromatography PHB measurement results of the 60 mM/
4 mM Ac/Glu fed media CPBR.
Volume
(ml) Wet weight
(mg) PHB concentration after
GC analysis(mg/ml) PHB content
(%w/w) 150 700 0.632 0.36 200 1200 0.736 2.44
A sample calculation of the PHB content is illustrated using the 150 ml sample
(4 ml methanolysed) sample from the 60 mM/ 4 mM Ac/Glu fed media CPBR.
Mass of PHB PHB Content = (N2)Wet weight of sample
PHB0.632 mg 4mlml = 100 0.36%
700 mg
×× =
It was observed that the amount of PHB obtained from the CPBR
sample was very low. This could be attributed to the low amounts recovered
(extracted) after methanolysis. It is suggested that lyophilization before
methanolysis would enable the recovery of higher amounts of PHB. The
presence of water reduces the efficiency of methanolysis reaction. It is shown
that the addition of Na2SO4 after extraction increased efficiency and peak area
(Suludere, 2001).

161
APPENDIX O
EXPERIMENTAL DATA Table O.1 OD, cell dry weight and pH values for R. capsulatus (DSM 1710)
outdoor CPBR.
Day Date OD gdw/lc pH Cumulative Total Gas
Produced (l) 1 13/09/08 0.782 0.424 6.856 0.00 2 14/09/08 1.520 0.825 7.494 0.46 3 15/09/08 1.830 0.994 7.55 3.58 4 16/09/08 1.880 1.021 7.62 5.41 5 17/09/08 1.668 0.905 7.393 6.33 6 18/09/08 1.960 1.064 7.685 6.64 7 19/09/08 1.766 0.958 7.720 7.32 8 20/09/08 1.896 1.029 7.622 7.55 9 21/09/08 2.075 1.126 7.620 8.47 10 22/09/08 1.830 0.993 7.637 10.03 11 23/09/08 1.808 0.981 7.617 11.22 12 24/09/08 1.798 0.976 7.590 12.32 14 26/09/08 1.938 1.052 7.381 14.52 15 27/09/08 1.844 1.001 7.365 15.72 16 28/09/08 1.803 0.978 7.327 16.36 17 29/09/08 1.818 0.987 7.335 16.82 18 30/09/08 1.768 0.959 7.312 17.18 19 01/10/08 1.848 1.003 7.399 18.01 20 02/10/08 2.080 1.129 7.464 18.28 21 03/10/08 1.772 0.962 7.485 18.65
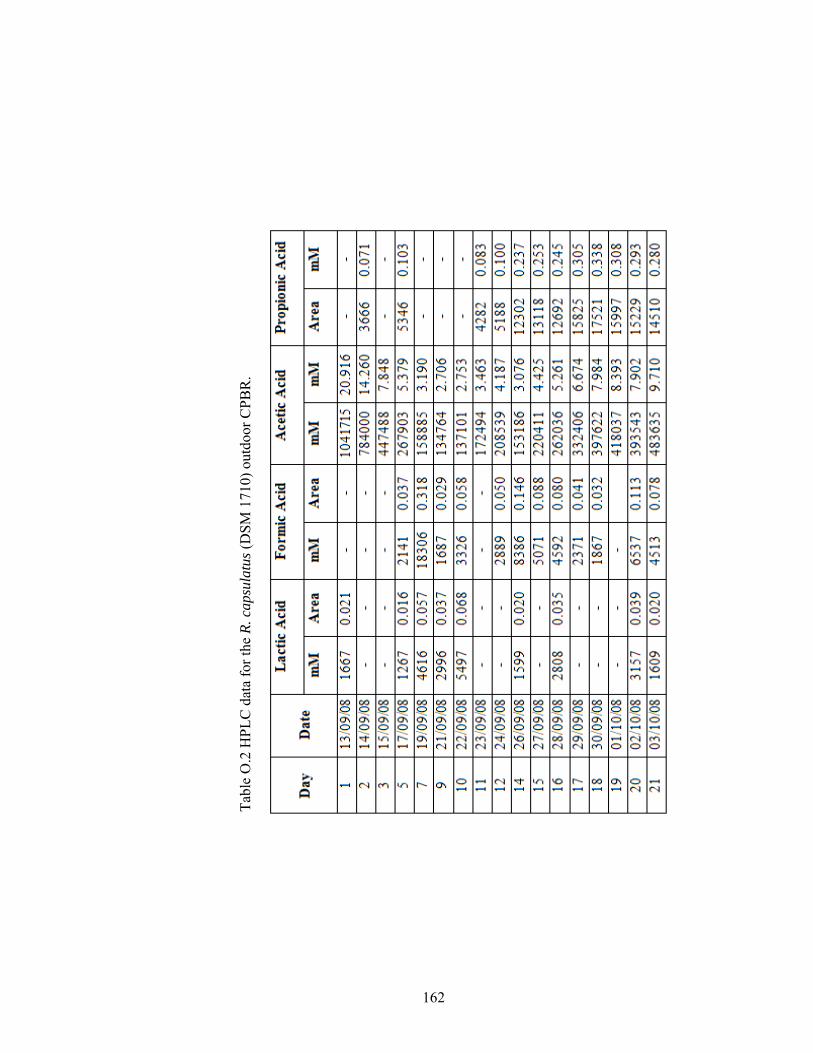
162
Tabl
e O
.2 H
PLC
dat
a fo
r the
R. c
apsu
latu
s (D
SM 1
710)
out
door
CPB
R.

163
Table O.3 OD, cell dry weight and pH values for the heat adapted
R. capsulatus (DSM 1710) outdoor CPBR.
Day Date OD Biomass (gdcw/lc)
pH Cumulative Total Gas
Produced (l) 1 20/09/08 0.392 0.213 6.771 0.00 2 21/09/08 0.524 0.284 6.917 0.00 3 22/09/08 0.824 0.447 7.164 0.00 4 23/09/08 0.888 0.482 7.213 0.28 5 24/09/08 1.248 0.677 7.411 0.28 7 26/09/08 1.730 0.939 7.445 0.28 8 27/09/08 1.634 0.887 7.343 3.21 9 28/09/08 1.622 0.880 7.312 4.29 10 29/09/08 1.692 0.918 7.294 5.45 11 30/09/08 1.660 0.901 7.259 6.48 12 01/10/08 1.710 0.928 7.410 6.81 13 02/10/08 1.812 0.983 7.596 7.39 14 03/10/08 1.750 0.950 7.754 7.96 15 04/10/08 2.105 1.142 7.772 8.38 16 05/10/08 1.936 1.051 7.780 8.79 17 06/10/08 1.866 1.013 7.723 9.61 18 07/10/08 1.856 1.007 7.782 10.60 19 08/10/08 1.790 0.971 7.692 11.18 21 10/10/08 1.882 1.021 7.635 11.84 22 11/10/08 2.060 1.118 7.598 13.24 25 14/10/08 1.958 1.063 7.629 13.66 27 16/10/08 1.806 0.980 7.506 15.55 28 17/10/08 1.864 1.012 7.430 16.21 30 19/10/08 1.776 0.964 7.468 16.79 31 20/10/08 1.676 0.910 7.363 17.70 32 21/10/08 1.642 0.891 7.347 18.53 34 23/10/08 1.796 0.975 7.367 19.52 35 24/10/08 1.648 0.894 7.299 21.66 36 25/10/08 1.618 0.878 7.259 22.16 37 26/10/08 1.508 0.818 7.271 23.06

164
Table O.3 (Continued).
Day Date OD Biomass (gdcw/lc)
pH Cumulative Total Gas
Produced (l) 38 27/10/08 1.498 0.813 7.254 23.64 39 28/10/08 1.470 0.798 7.212 23.64 40 29/10/08 1.378 0.748 7.237 23.72 41 30/10/08 1.520 0.825 7.314 23.97 42 31/10/08 1.708 0.927 7.364 24.30 43 01/11/08 1.740 0.944 7.396 24.88 44 02/11/08 1.624 0.881 7.381 25.21 45 03/11/08 1.572 0.853 7.412 25.62 46 04/11/08 1.530 0.830 7.417 26.03 48 06/11/08 1.462 0.793 7.327 26.45 49 07/11/08 1.380 0.749 7.275 26.45 50 08/11/08 1.661 0.901 7.281 26.45 52 10/11/08 1.768 0.959 7.280 26.45 53 11/11/08 1.642 0.891 7.293 26.86 54 12/11/08 1.410 0.765 7.173 27.44 55 13/11/08 1.278 0.694 7.165 27.93 56 14/11/08 1.234 0.670 7.459 28.10 57 15/11/08 1.268 0.688 7.178 28.34 59 17/11/08 1.332 0.723 7.209 28.84 60 18/11/08 1.240 0.673 7.194 29.01 61 19/11/08 1.302 0.707 7.161 29.17 62 20/11/08 1.292 0.701 7.251 29.34 63 21/11/08 1.264 0.686 7.251 29.75 64 22/11/08 1.210 0.657 7.239 30.33 66 24/11/08 1.268 0.688 7.251 30.66 67 25/11/08 1.420 0.771 7.359 31.32 68 26/11/08 1.588 0.862 7.334 32.14 69 27/11/08 1.412 0.766 7.390 32.55 70 28/11/08 1.322 0.717 7.335 32.80 71 29/11/08 1.423 0.772 7.436 33.38 73 01/12/08 1.360 0.738 7.457 34.62 74 02/12/08 1.356 0.736 7.384 35.11 76 04/12/08 1.482 0.804 7.403 36.10 77 05/12/08 1.444 0.784 7.345 36.60 79 07/12/08 1.366 0.741 7.418 37.42
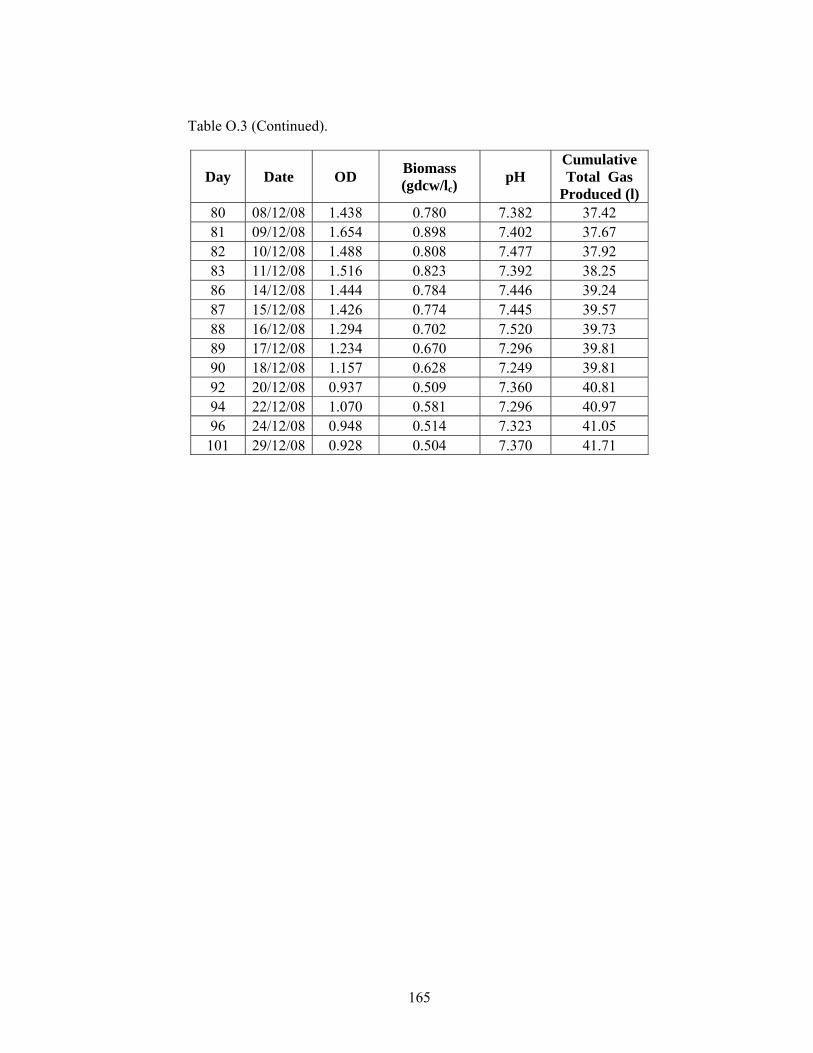
165
Table O.3 (Continued).
Day Date OD Biomass (gdcw/lc)
pH Cumulative Total Gas
Produced (l) 80 08/12/08 1.438 0.780 7.382 37.42 81 09/12/08 1.654 0.898 7.402 37.67 82 10/12/08 1.488 0.808 7.477 37.92 83 11/12/08 1.516 0.823 7.392 38.25 86 14/12/08 1.444 0.784 7.446 39.24 87 15/12/08 1.426 0.774 7.445 39.57 88 16/12/08 1.294 0.702 7.520 39.73 89 17/12/08 1.234 0.670 7.296 39.81 90 18/12/08 1.157 0.628 7.249 39.81 92 20/12/08 0.937 0.509 7.360 40.81 94 22/12/08 1.070 0.581 7.296 40.97 96 24/12/08 0.948 0.514 7.323 41.05 101 29/12/08 0.928 0.504 7.370 41.71

166
Tabl
e O
.4 H
PLC
dat
a fo
r the
hea
t ada
pted
R. c
apsu
latu
s (D
SM 1
710)
out
door
CPB
R.

167
Tabl
e O
.4 (C
ontin
ued)
.

168
Tabl
e O
.4 (C
ontin
ued)
.

169
Tabl
e O
.4 (C
ontin
ued)
.

170
Table O.5 OD, cell dry weight and pH values for the R. capsulatus YO3 (Hup-) outdoor CPBR.
Day Date OD Biomass (gdcw/lc)
pH Cumulative Total Gas
Produced (l) 1 16/10/08 0.350 0.163 6.751 0.00 2 17/10/08 0.504 0.235 6.775 0.00 4 19/10/08 0.572 0.266 6.833 0.32 5 20/10/08 0.544 0.253 6.928 0.73 6 21/10/08 0.638 0.297 6.952 1.42 8 23/10/08 0.830 0.386 6.983 3.15 9 24/10/08 0.854 0.398 6.976 4.13 10 25/10/08 0.872 0.406 6.978 4.68 11 26/10/08 0.950 0.442 7.014 5.59 12 27/10/08 1.082 0.504 7.042 6.51 13 28/10/08 1.150 0.535 7.079 6.85 14 29/10/08 1.142 0.532 7.040 8.04 15 30/10/08 1.167 0.543 7.035 9.14 16 31/10/08 1.406 0.655 7.063 9.51 17 01/11/08 1.246 0.580 7.029 9.87 18 02/11/08 1.184 0.551 7.013 9.96 19 03/11/08 1.128 0.525 7.013 10.15 20 04/11/08 1.044 0.486 7.019 10.61 22 06/11/08 0.974 0.453 6.915 11.43 23 07/11/08 0.956 0.445 6.839 11.71 24 08/11/08 0.838 0.390 6.815 12.07 26 10/11/08 0.854 0.398 6.807 12.62 27 11/11/08 0.988 0.460 6.798 13.08 28 12/11/08 0.761 0.354 6.825 13.45 29 13/11/08 0.696 0.324 6.860 13.54 30 14/11/08 0.700 0.326 6.889 13.63 31 15/11/08 0.702 0.327 6.939 13.72 32 17/11/08 0.694 0.323 6.960 14.27 34 19/11/08 0.668 0.311 6.827 14.46 35 20/11/08 0.632 0.294 6.856 14.73 36 21/11/08 0.668 0.311 6.856 15.19 37 22/11/08 0.690 0.321 6.833 15.65 39 24/11/08 0.656 0.305 6.829 16.38 40 25/11/08 0.734 0.342 6.959 17.12 41 26/11/08 0.840 0.391 6.930 18.95 42 27/11/08 0.808 0.376 6.960 20.69

171
Table O.5 (Continued).
Day Date OD Biomass (gdcw/lc)
pH Cumulative Total Gas
Produced (l) 43 28/11/08 0.995 0.463 6.950 21.24 44 29/11/08 1.186 0.552 7.027 22.16 46 01/12/08 1.160 0.540 7.054 25.55 47 02/12/08 1.134 0.528 7.028 26.56 49 04/12/08 1.086 0.506 7.040 29.13 50 05/12/08 1.010 0.470 6.997 29.58 52 07/12/08 1.036 0.482 6.993 31.51 53 08/12/08 0.974 0.453 6.961 32.06 54 09/12/08 0.942 0.439 6.989 32.52 55 10/12/08 1.001 0.466 6.997 32.98 56 11/12/08 0.960 0.447 6.988 33.89 59 14/12/08 0.912 0.425 7.032 35.54 60 15/12/08 0.888 0.413 6.999 36.09 61 16/12/08 0.908 0.423 6.982 36.55 62 17/12/08 0.898 0.418 6.826 36.92 63 18/12/08 0.828 0.386 6.815 37.01 65 20/12/08 0.776 0.361 6.950 37.38 67 22/12/08 0.794 0.370 6.897 37.84 69 24/12/08 0.790 0.368 6.924 38.02

172
T
able
O.6
HPL
C d
ata
for t
he R
. cap
sula
tus Y
O3
(Hup
- ) out
door
CPB
R.

173
T
able
O.6
(Con
tinue
d).

174
Tab
le O
.6 (C
ontin
ued)
.

175
Table O.7 OD, cell dry weight and pH values for the R. capsulatus YO3
(Hup-) 40 mM/2 mM Ac/Glu fed outdoor CPBR.
Day Date OD Biomass (gdcw/lc)
pH T(0C)Cumulative Total Gas
Produced (l)1 18/09/08 0.640 0.298 6.884 28.0 0.00 2 19/09/08 1.712 0.795 7.619 33.0 3.76 3 20/09/08 1.868 0.852 7.507 32.2 8.16 4 21/09/08 1.628 0.755 7.411 32.3 12.84 5 22/09/08 1.548 0.696 7.383 32.0 17.51 6 23/09/08 1.584 0.724 7.394 32.6 21.09 7 24/09/08 1.548 0.716 7.324 32.0 24.30 9 26/09/08 1.488 0.693 7.160 31.5 29.43 10 27/09/08 1.516 0.707 7.171 31.3 32.00 11 28/09/08 1.440 0.697 7.114 31.5 34.75 12 29/09/08 1.428 0.675 7.095 31.2 38.51 13 30/09/08 1.520 0.688 7.137 31.5 41.63 14 01/10/08 1.336 0.629 7.228 31.1 44.83 15 02/10/08 1.320 0.624 7.181 31.5 48.04 16 03/10/08 1.268 0.589 7.138 31.5 51.34 17 04/10/08 1.216 0.583 7.168 31.2 54.55 18 05/10/08 1.220 0.585 7.237 31.5 57.85 19 06/10/08 1.208 0.574 7.158 31.8 61.43 20 07/10/08 1.260 0.558 7.190 31.5 65.46 21 08/10/08 1.164 0.548 7.140 31.7 68.31 23 10/10/08 1.112 0.525 7.112 31.5 70.97 24 11/10/08 1.120 0.521 7.099 30.5 73.62 27 14/10/08 1.032 0.485 7.085 31.0 77.02 29 16/10/08 0.992 0.488 7.092 32.0 81.78 30 17/10/08 1.031 0.473 7.053 31.5 84.54 31 19/10/08 1.012 0.476 7.123 31.3 89.67 32 20/10/08 0.932 0.446 7.050 31.5 92.60 33 21/10/08 0.864 0.421 7.044 30.0 95.45 35 23/10/08 0.944 0.419 7.056 - 100.40

176
Table O.7 (Continued)
Day Date OD Biomass (gdcw/lc)
pH T(0C) Cumulative Total Gas
Produced (l) 36 24/10/08 0.900 0.419 7.010 30.5 103.51 37 25/10/08 0.836 0.389 7.018 32.5 106.82 38 26/10/08 0.806 0.375 7.028 31.5 110.76 39 27/10/08 0.766 0.357 7.030 31.5 113.97 40 28/10/08 0.786 0.366 7.014 32.0 117.27 41 29/10/08 0.750 0.349 7.047 32.5 120.84 42 30/10/08 0.714 0.332 7.036 32.5 123.78 43 31/10/08 0.682 0.318 6.987 32.5 126.16 44 01/11/08 0.718 0.334 7.015 33.7 126.99 45 02/11/08 0.637 0.297 6.992 31.8 127.54 46 03/11/08 0.608 0.283 6.970 31.0 127.90 47 04/11/08 0.552 0.257 6.990 30.5 128.36

177
Tabl
e O
.8 H
PLC
dat
a fo
r the
R.c
apsu
latu
s YO
3 (H
up- ) 4
0/2
mM
Ac/
Glu
fed
CPB
R.

178
Tab
le O
.8 (C
ontin
ued)
.

179
Table O.9 OD, cell dry weight and pH values for the R. capsulatus YO3
(Hup-) 40 mM/2 mM Ac/Glu Fed CPBR with biomass recycle.
Day Date OD gdcw/lc pH Bchla
T(0C) Cumulative Total Gas
Produced (l) Abs mgbchl/lc 1 12/04/09 0.360 0.168 6.598 0.332 8.55 17.4 0.00 2 13/04/09 0.726 0.338 6.815 0.298 7.68 32.9 5.13 3 14/04/09 0.884 0.412 6.922 0.278 7.16 32.8 9.90 3 14/04/09 1.204 0.561 7.010 0.334 8.60 33.2 13.48 3 14/04/09 0.862 0.401 6.976 0.306 7.88 35.3 15.68 4 15/04/09 1.390 0.647 7.033 0.365 9.40 33.6 16.66 5 16/04/09 1.544 0.719 7.128 0.471 12.13 32.0 19.34 6 17/04/09 1.608 0.749 7.086 0.33 8.50 31.6 21.76 7 18/04/09 1.516 0.706 7.072 0.397 10.23 30.8 24.78 8 19/04/09 1.414 0.658 7.073 0.355 9.14 31.5 27.62 9 20/04/09 1.372 0.639 7.020 0.395 10.17 33.5 30.22 10 21/04/09 1.332 0.620 7.054 0.371 9.56 34.8 32.65 11 22/04/09 1.412 0.657 7.013 0.362 9.32 35.0 37.50 12 23/04/09 1.504 0.700 7.043 0.386 9.94 31.8 41.52 13 24/04/09 1.346 0.627 7.120 0.365 9.40 30.2 43.95 15 26/04/09 1.418 0.660 7.146 0.45 11.59 31.2 46.29 17 28/04/09 1.456 0.678 7.078 0.307 7.91 29.5 49.97 18 29/04/09 1.212 0.564 7.125 0.535 13.78 31.9 52.65 19 30/04/09 1.386 0.645 7.049 0.396 10.20 31.8 54.74 21 02/05/09 1.136 0.529 7.050 0.375 9.66 33.0 57.26 22 03/05/09 1.196 0.557 7.073 0.402 10.36 31.8 59.10 23 04/05/09 1.302 0.606 7.031 0.335 8.63 32.1 61.78 24 05/05/09 1.286 0.599 7.009 0.323 8.32 33.0 9.90 25 06/05/09 1.142 0.532 7.070 0.32 8.24 32.8 13.48

180
Table O.10 HPLC data for the R. capsulatus YO3 (Hup-) 40 mM/2 mM
Ac/Glu fed CPBR with biomass recycle.
Day Date Lactic Acid Formic Acid Acetic Acid Area mM Area mM Area mM
1 13/04/09 - - 16609 0.255 1649956 32.3041 13/04/09 - - 49113 0.754 1561892 30.5802 14/04/09 1097 0.012 61215 0.940 488368 9.562 3 15/04/09 19590 0.221 224234 3.444 237050 4.641 4 16/04/09 22888 0.259 395234 6.071 212733 4.165 5 17/04/09 10629 0.120 380582 5.846 89443 1.751 6 18/04/09 1772 - 498977 7.664 98453 1.928 7 19/04/09 - - 537998 8.264 104555 2.047 8 20/04/09 3153 0.036 425319 6.533 105656 2.069 9 21/04/09 1946 0.022 547729 8.413 138797 2.717 10 22/04/09 5654 0.064 543155 8.343 149322 2.924 11 23/04/09 1345 0.015 439785 6.755 142529 2.791 12 24/04/09 1637 0.018 470841 7.232 131393 2.572 14 26/04/09 - - 459405 7.057 39194 0.767 16 28/04/09 - - 615440 9.453 1178 0.023 17 29/04/09 - - 584875 8.984 98819 1.935 18 30/04/09 - - 599383 9.207 104168 2.039 20 02/05/09 - - 628859 10.471 54035 1.245 21 03/05/09 - - 518531 8.634 199824 4.604 22 04/05/09 - - 568449 9.465 158175 3.644 23 05/05/09 - - 531151 8.844 156880 3.615

181
Table O.11 OD, cell dry weight and pH values for the R. capsulatus YO3
(Hup-) 40 mM/3 mM – 40 mM/4 mM Ac/Glu fed CPBR.
Day Date OD gdcw/lc pH Bchla
T(0C)
CumulativeTotal Gas Produced
(l) Abs mgbchl/lc
1 25/03/09 0.498 0.232 6.727 0.105 2.70 24.7 0.00 2 26/03/09 0.554 0.258 6.810 0.131 3.37 31.4 0.00 2 26/03/09 0.608 0.283 6.846 0.213 5.49 31.2 0.00 3 27/03/09 0.672 0.313 6.861 0.180 4.64 31.2 0.18 4 28/03/09 1.030 0.480 7.023 0.287 7.39 29.5 1.93 5 29/03/09 1.164 0.542 7.042 0.300 7.73 32.2 5.59 6 30/03/09 1.294 0.602 7.133 0.342 8.81 32.8 6.97 7 31/03/09 1.656 0.771 7.295 0.244 6.29 35.2 8.34 8 01/04/09 1.580 0.736 7.165 0.28 7.21 33.2 11.28 9 02/04/09 1.544 0.719 7.156 0.318 8.19 30.4 13.84 10 03/04/09 1.453 0.677 7.134 0.285 7.34 34.3 17.79 11 04/04/09 1.384 0.644 7.104 0.285 7.34 30.3 21.18 12 05/04/09 1.380 0.643 7.189 0.266 6.85 32.6 24.94 13 06/04/09 1.234 0.575 7.075 0.276 7.11 31.9 28.97 14 07/04/09 1.210 0.563 7.092 0.321 8.27 29.4 32.46 15 08/04/09 1.022 0.476 7.127 0.176 4.53 29.1 36.12 16 09/04/09 1.054 0.491 7.088 0.287 7.39 31.8 40.07 17 10/04/09 0.966 0.450 7.091 0.332 8.55 30.3 43.83 18 11/04/09 1.036 0.482 7.061 0.315 8.11 31.6 47.59 19 12/04/09 0.914 0.426 7.062 0.340 8.76 32.7 52.44 20 13/04/09 0.872 0.406 7.079 0.342 8.81 32.8 56.02 21 14/04/09 0.876 0.408 6.993 0.319 8.22 33.6 60.24 22 15/04/09 0.842 0.392 6.998 0.295 7.60 33.7 64.82 23 16/04/09 0.840 0.391 7.024 0.336 8.66 31.7 69.50 24 17/04/09 0.832 0.387 7.090 0.335 8.63 29.7 73.81 25 18/04/09 0.814 0.379 7.075 0.336 8.66 30.1 78.03 26 19/04/09 0.820 0.382 7.047 0.316 8.14 31.6 82.43 27 20/04/09 0.804 0.374 7.004 0.365 9.40 33.7 86.37 29 22/04/09 0.842 0.392 7.001 0.327 8.42 33.7 94.07 30 23/04/09 0.870 0.405 7.021 0.38 9.79 32.7 97.83 31 24/04/09 0.824 0.384 7.118 0.326 8.40 31.1 101.31 35 28/04/09 0.922 0.429 7.036 0.301 7.75 30.4 108.74 36 29/04/09 0.896 0.417 6.990 0.405 10.43 33.4 111.95 37 30/04/09 0.946 0.440 7.002 0.355 9.14 30.7 115.98 39 02/05/09 0.864 0.402 7.095 0.333 8.58 32.1 120.20

182
Tab
le O
.12
HPL
C d
ata
for t
he R
. cap
sula
tus Y
O3
(Hup
- ) 40
mM
/3 m
M –
40
mM
/4 m
M A
c/G
lu fe
d C
PBR
.

183
Tab
le O
.12
(Con
tinue
d).
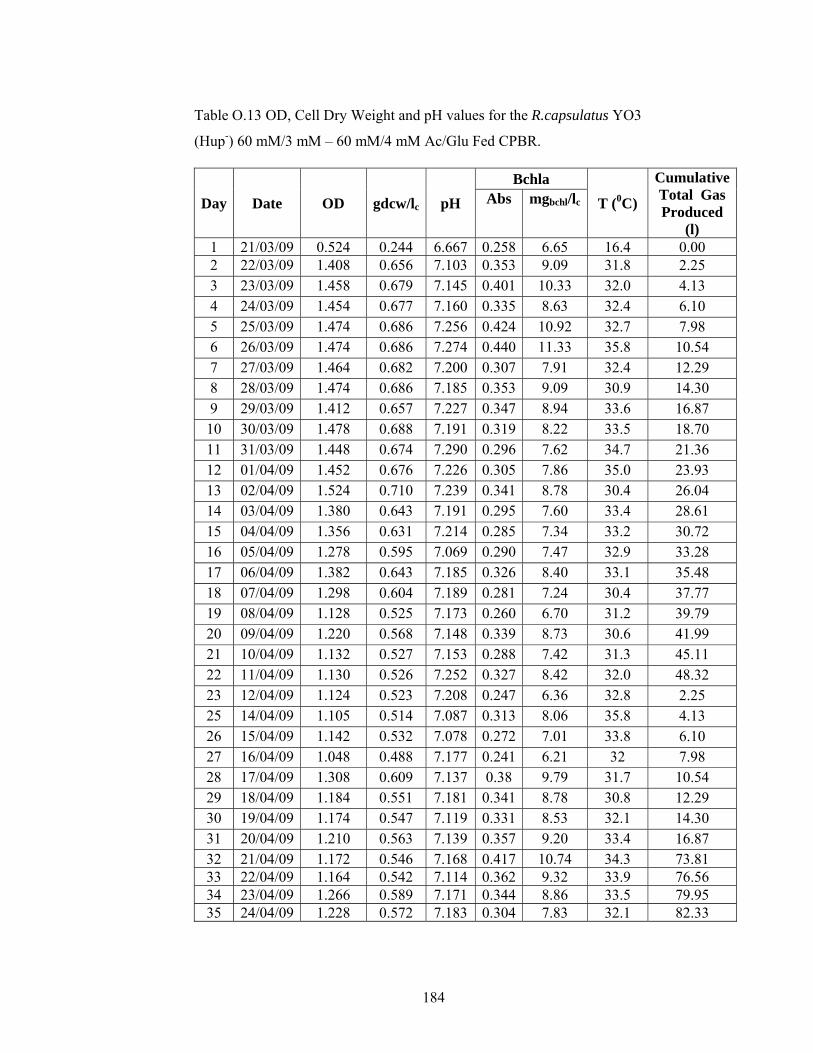
184
Table O.13 OD, Cell Dry Weight and pH values for the R.capsulatus YO3
(Hup-) 60 mM/3 mM – 60 mM/4 mM Ac/Glu Fed CPBR.
Day Date OD gdcw/lc pH Bchla
T (0C)
CumulativeTotal Gas Produced
(l)
Abs mgbchl/lc
1 21/03/09 0.524 0.244 6.667 0.258 6.65 16.4 0.00 2 22/03/09 1.408 0.656 7.103 0.353 9.09 31.8 2.25 3 23/03/09 1.458 0.679 7.145 0.401 10.33 32.0 4.13 4 24/03/09 1.454 0.677 7.160 0.335 8.63 32.4 6.10 5 25/03/09 1.474 0.686 7.256 0.424 10.92 32.7 7.98 6 26/03/09 1.474 0.686 7.274 0.440 11.33 35.8 10.54 7 27/03/09 1.464 0.682 7.200 0.307 7.91 32.4 12.29 8 28/03/09 1.474 0.686 7.185 0.353 9.09 30.9 14.30 9 29/03/09 1.412 0.657 7.227 0.347 8.94 33.6 16.87 10 30/03/09 1.478 0.688 7.191 0.319 8.22 33.5 18.70 11 31/03/09 1.448 0.674 7.290 0.296 7.62 34.7 21.36 12 01/04/09 1.452 0.676 7.226 0.305 7.86 35.0 23.93 13 02/04/09 1.524 0.710 7.239 0.341 8.78 30.4 26.04 14 03/04/09 1.380 0.643 7.191 0.295 7.60 33.4 28.61 15 04/04/09 1.356 0.631 7.214 0.285 7.34 33.2 30.72 16 05/04/09 1.278 0.595 7.069 0.290 7.47 32.9 33.28 17 06/04/09 1.382 0.643 7.185 0.326 8.40 33.1 35.48 18 07/04/09 1.298 0.604 7.189 0.281 7.24 30.4 37.77 19 08/04/09 1.128 0.525 7.173 0.260 6.70 31.2 39.79 20 09/04/09 1.220 0.568 7.148 0.339 8.73 30.6 41.99 21 10/04/09 1.132 0.527 7.153 0.288 7.42 31.3 45.11 22 11/04/09 1.130 0.526 7.252 0.327 8.42 32.0 48.32 23 12/04/09 1.124 0.523 7.208 0.247 6.36 32.8 2.25 25 14/04/09 1.105 0.514 7.087 0.313 8.06 35.8 4.13 26 15/04/09 1.142 0.532 7.078 0.272 7.01 33.8 6.10 27 16/04/09 1.048 0.488 7.177 0.241 6.21 32 7.98 28 17/04/09 1.308 0.609 7.137 0.38 9.79 31.7 10.54 29 18/04/09 1.184 0.551 7.181 0.341 8.78 30.8 12.29 30 19/04/09 1.174 0.547 7.119 0.331 8.53 32.1 14.30 31 20/04/09 1.210 0.563 7.139 0.357 9.20 33.4 16.87 32 21/04/09 1.172 0.546 7.168 0.417 10.74 34.3 73.81 33 22/04/09 1.164 0.542 7.114 0.362 9.32 33.9 76.56 34 23/04/09 1.266 0.589 7.171 0.344 8.86 33.5 79.95 35 24/04/09 1.228 0.572 7.183 0.304 7.83 32.1 82.33

185
Table O.13 (Continued).
Day Date OD gdcw/lc pH Bchl
T(0C) Cumulative Total Gas
Produced (l) Abs mgbchl/lc
37 26/04/09 1.218 0.567 7.237 0.299 7.70 33.3 87.74 39 28/04/09 1.202 0.560 7.203 0.289 7.44 30.3 91.96 40 29/04/09 1.092 0.508 7.181 0.47 12.11 30.5 93.61 41 30/04/09 1.170 0.545 7.084 0.352 9.07 31.1 96.27 43 02/05/09 1.182 0.550 7.122 0.299 7.70 32.1 100.76 44 03/05/09 1.126 0.524 7.162 0.304 7.83 31.1 103.88

186
Tab
le O
.14
HPL
C d
ata
for t
he R
. cap
sula
tus Y
O3
(Hup
- ) 60
mM
/3 m
M -
60 m
M/4
mM
Ac/
Glu
fed
CPB
R.
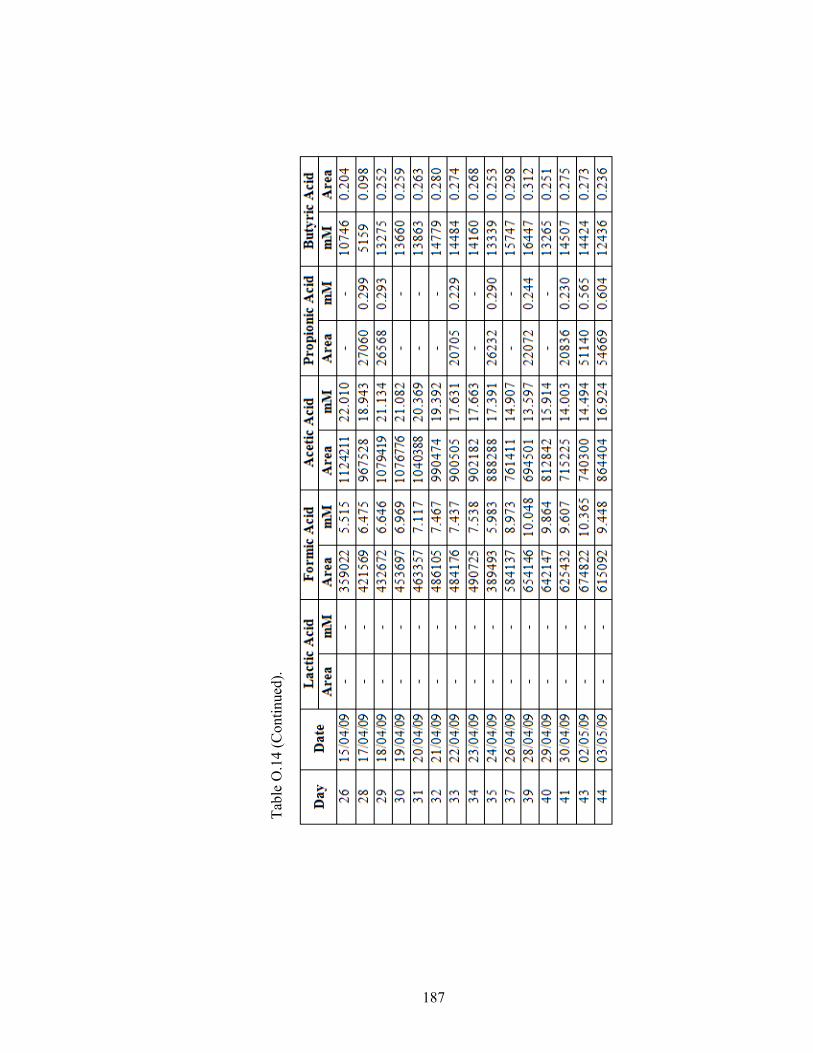
187
Tabl
e K
.14
(Con
tinue
d).
Tabl
e O
.14
(Con
tinue
d).
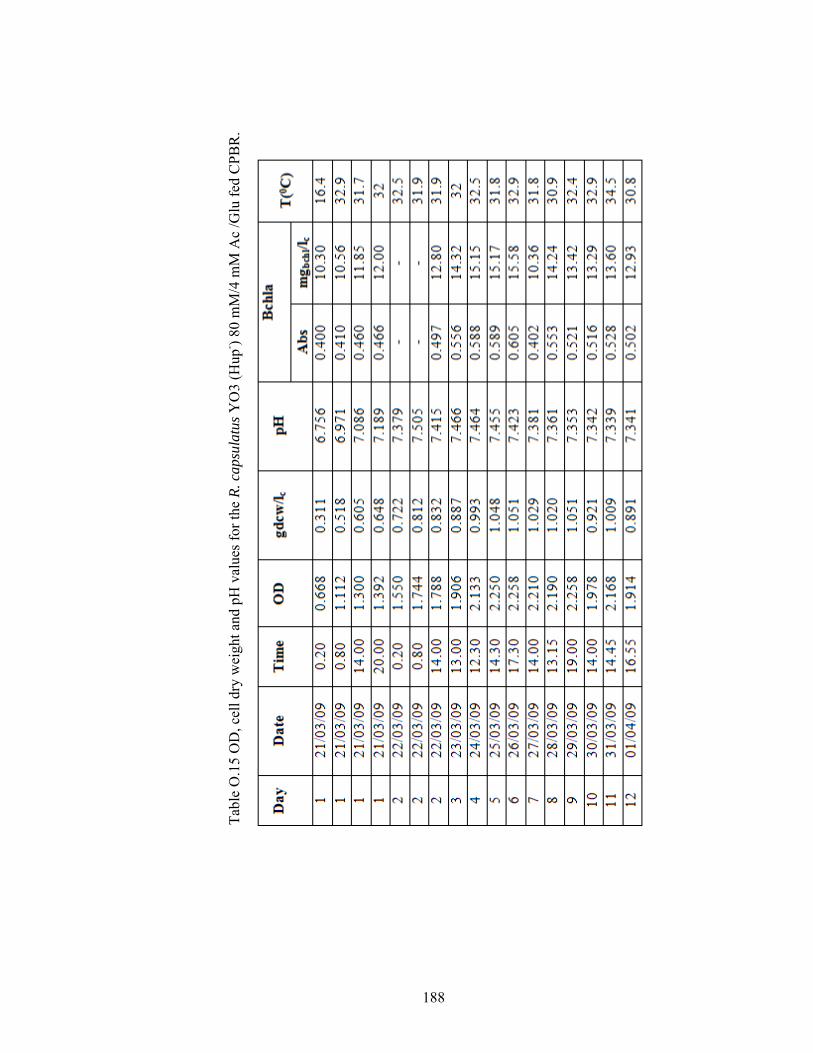
188
Tabl
e O
.15
OD
, cel
l dry
wei
ght a
nd p
H v
alue
s for
the
R. c
apsu
latu
s YO
3 (H
up- ) 8
0 m
M/4
mM
Ac
/Glu
fed
CPB
R.

189
Tab
le O
.16
HPL
C d
ata
for t
he R
. cap
sula
tus Y
O3
(Hup
- ) 80
mM
/4 m
M A
c/G
lu fe
d C
PBR
.