biological applications of localised surface … applications of localised surface plasmonic...
TRANSCRIPT

Biological applications of localised surface plasmonicphenomenae
D.A. Stuart, A.J. Haes, C.R. Yonzon, E.M. Hicks and R.P. Van Duyne
Abstract: Researchers and industrialists have taken advantage of the unusual optical, magnetic,electronic, catalytic, and mechanical properties of nanomaterials. Nanoparticles and nanoscalematerials have proven to be useful for biological uses. Nanoscale materials hold a particularinterest to those in the biological sciences because they are on the same size scale as biologicalmacromolecules, proteins and nucleic acids. The interactions between biomolecules andnanomaterials have formed the basis for a number of applications including detection, biosensing,cellular and in situ hybridisation labelling, cell tagging and sorting, point-of-care diagnostics, kineticand binding studies, imaging enhancers, and even as potential therapeutic agents. Noble metalnanoparticles are especially interesting because of their unusual optical properties which arise fromtheir ability to support surface plasmons. In this review the authors focus on biological applicationsand technologies that utilise two types of related plasmonic phenomonae: localised surface plasmonresonance (LSPR) spectroscopy and surface-enhanced Raman spectroscopy (SERS). Thebackground necessary to understand the application of LSPR and SERS to biological problemsis presented and illustrative examples of resonant Rayleigh scattering, refractive index sensing, andSERS-based detection and labelling are discussed.
1 Introduction
The intense scattering and absorption of light from noblemetal nanoparticles is the source of some of the beautifulcolours in stained glass windows and has attracted theinterest of scientists for generations. These nanoparticlesexhibit a strong UV-vis absorption band that is not presentin the spectrum of the bulk metal [1–8]. Although scientistshave learned that the characteristic hues of these noblemetal nanoparticle suspensions arise from their stronginteraction with light, the advent of the field of nanoparticleoptics has allowed for a deeper understanding of therelationship between material properties such as composi-tion, size, shape, and local dielectric environment and theobserved colour of a metal suspension. An understanding ofthe optical properties of noble metal nanoparticles holdsboth fundamental and practical significance. Fundamen-tally, it is important to systematically explore the nanoscalestructural and local environmental factors that cause opticalproperty variation, as well as provide access to regimes ofpredictable behaviour. Practically, the tunable opticalproperties of nanostructures can be applied as materialsfor surface-enhanced spectroscopy [9–13], optical filters [14,15], plasmonic devices [16–19] and sensors [20–34].
One of the most interesting properties of noble metalnanoparticles arises from their ability to support a localisedsurface plasmon resonance (LSPR). The LSPR results whenthe incident photon frequency is resonant with the collective
oscillation of the conduction electrons of the nanoparticle.The simplest theoretical approach available for modellingthe optical properties of nanoparticles is the Mie theoryestimation of the extinction of a metallic sphere in the longwavelength, electrostatic dipole limit. In the followingequation [35]:
EðlÞ ¼ 24pNAa3e3=2m
l lnð10Þei
ðer þ 2emÞ2 þ e2i
" #ð1Þ
E(l) is the extinction which is, in turn, equal to the sum ofabsorption and Rayleigh scattering, NA is the areal densityof nanoparticles, a is the radius of the metallic nanosphere,em is the dielectric constant of the medium surrounding themetallic nanosphere (assumed to be a positive, real numberand wavelength independent), l is the wavelength of theabsorbing radiation, ei is the imaginary portion of themetallic nanosphere’s dielectric function, and er is the realportion of the metallic nanosphere’s dielectric function. TheLSPR condition is met when the resonance term in thedenominator ((er+2em)
2) approaches zero. Even in thismost primitive model, it is abundantly clear that the LSPRspectrum of an isolated metallic nanosphere embedded inan external dielectric medium will depend on the nanopar-ticle radius a, the nanoparticle material (ei and er), and thenanoenvironment’s dielectric constant (em). Furthermore,when the nanoparticles are not spherical, as is always thecase in real samples, the extinction spectrum will depend onthe nanoparticle’s in-plane diameter, out-of-plane height,and shape. In this case the resonance term from thedenominator of (1) is replaced with:
ðer þ wemÞ2 ð2Þwhere w, a shape factor term [11] is a term that describes thenanoparticle’s aspect ratio. The values for w increase fromtwo (for a sphere) up to, and beyond, values of 17 for a 5:1aspect ratio nanoparticle. In addition, many of the samples
The authors are with the Department of Chemistry, Northwestern University,2145 Sheridan Road, Evanston, IL 60208-3113, USA
E-mail: [email protected]
r IEE, 2005
IEE Proceedings online no. 20045012
doi:10.1049/ip-nbt:20045012
Paper first received 22nd December 2004
IEE Proc.-Nanobiotechnol., Vol. 152, No. 1, February 2005 13

considered in this work contain an ensemble of nanopar-ticles that are supported on a substrate. Thus, the LSPRwillalso depend on interparticle spacing and the substratedielectric constant.
LSPR excitation results in wavelength selective absorp-tion with extremely large molar extinction coefficientsB3� 1011 1/Mcm [36], resonant Rayleigh scattering [37,38] with an efficiency equivalent to that of 106 fluorophors[39] and the enhanced local electromagnetic fields near thesurface of the nanoparticle which are responsible for theintense signals observed in all surface-enhanced spectro-scopies, e.g. surface-enhanced Raman scattering (SERS)and surface-enhanced fluorescence [11, 26, 27].
2 Synthetic methods to produce nanoparticles
One of the aims of any application, particularly for sensingresearch, is to be able to generate reproducible results. Innanobiological applications, this translates directly into acritical need to understand and control the syntheticmethods used to generate novel nanoscale materials. Atthe nanoscale, there are many options available rangingfrom nanoparticles in solution, to surface-bound nanopar-ticles, to nanoparticles entrapped in a three-dimensionalmatrix. With this plethora of potentially useful nanomater-ial classes, there exist a large number of fabrication methodsto controllably and reproducibly produce these samples. Inthis Section, we will discuss the most pertinent syntheticmethods used in biosensing application: chemical synthesisand lithographic techniques.
2.1 Nanoparticle synthesis by chemicalreductionThe synthesis of inorganic nanocrystals with controllableshapes and sizes has been a driving force in much ofmaterials research. This has been characterised by rapidprogress in the past few years with synthesis of spheres [40,41], rods [42–44], triangular prisms [45–47], disks [48–50],cubes [51] and branched nanocrystals [52]. These structuresare compelling for their use in biolabelling and biosensing.In this review, we will concentrate on the synthesis and useof noble metal nanoparticles for biological sensing plat-forms. The most commonly prepared shapes are spheroids,triangular prisms, rods and cubes (Fig. 1). All of theseshapes are based on the reduction of a metal salt to producenanoparticles with varied shapes and sizes. A different butrelated synthetic technique is the electrochemical reductionof metal salts in the presence of a surfactant or template[53–57]. These methods are most effective at producinglarge aspect ratio particles. The effect of nanoparticle shapeon the optical properties is clearly illustrated in Fig. 2, whichshows the scattering spectra from four different morphol-ogies [58].
2.2 Core-shell morphologiesCore-shell particles encompass a range of sample types frommetal surrounding metal [59, 60] to dielectric surroundingmetal. Most notably is the work of Ung et al. [61]. Theseparticles are produced by first creating the metal cores byone of the standard reduction reactions described above. Tostabilise the colloids and remove the citrate ions, the colloidsare mixed and allowed to react with an aminoalkane orthioalkane. Once the citrate has been completely displaced,the colloidal solution is allowed to react with a solution ofactive silica to form the shell (Fig. 3a). After 24h, theparticles can be used for further chemical modification or toincrease the shell thickness [61–63]. Transmission electronmicroscopy (TEM) and dark-field optical micrographs of
this type of core-shell structure are shown in Fig. 3b and c.Recently, Yin et al. [64] have developed a simpler and fastermethod to silica coat particles. Their method involvessuspension of aqueous phase particles within an isopropa-nol/water mixture followed by the direct addition of asmall fraction of tetraethyl orthosilicate (TEOS). The TEOS
a
166 nm
c d
b
83 nm 100 nm
125 nm
Fig. 1 Bright field TEM imagesa Gold nanorods (sample provided by Catherine Murphy)b Gold colloidsc Silver triangular prismsd Silver nanocubes (Reproduced with permission from [51]. Copyright2002)
0
1000
800
600
400
200scat
terin
g in
tens
ity
400 500 600 700
� = 52 nm (220 meV)
800wavelength, nm
900
a
1000
800
600
400
200scat
terin
g in
tens
ity
0400 500 600 700 800
wavelength, nm900
b
1000
800
600
400
200scat
terin
g in
tens
ity
0400 500 600 700 800
wavelength, nm900
d
� = 100 nm (271 meV)
900
1000
800
600
400
200scat
terin
g in
tens
ity
0400 500 600 700 800
wavelength, nm
c
Fig. 2 Resonant Rayleigh scattering spectra of four individual Agnanoparticlesa The single resonance near 540nm signifies a spherical nanoparticlewith a diameter near 50nmb and c The broad peaks near 650nm with shoulders are indicative ofplatelet-shaped nanoparticles having a polygonal cross-sectiond Two symmetric peaks, an intense one near 700nm and weaker onenear 450nm, is suggestive of a rod-shaped nanoparticle that isapproximately 40nm in diameter and 300nm long
14 IEE Proc.-Nanobiotechnol., Vol. 152, No. 1, February 2005

quickly forms a silica shell around the nanoparticleindistinguishable from those created in the Ung et al.method. The Yin et al. method is rapid, but unsuitable forcertain applications, notably the co-encapsulation of Ra-man-active species within the silica shell (see below), and thecoating of particles formed in the presence of surfactantshas met with limited success.
Another form of core-shell particles has a metal shellsurrounding a dielectric centre. The dielectric core, usuallysilica, is produced by the Stober method to producemonodispersed silica cores ranging in size from 80–500nm[65, 66]. These particles are then functionalised with3-aminopropyltrimethoxysilane. These functionalised parti-cles are then reacted with small gold nanoparticles. The goldparticles provide nucleation sites for the growth of themetallic shell from metal salts in solution. NH4OH is addedto produce preferential deposition onto the surface, rather
than initiate new particle formation in solution (Fig. 3d)[65–69]. The TEM and dark-field optical micrographs ofthis type of nanoshell are shown in Figs. 3e and 3f.
2.3 Lithographic techniquesAll nanoparticle fabrication methods discussed thus far areused to create suspensions of nanoparticles in solution.Another class of techniques addresses substrate-boundnanostructure fabrication. The standard approach formaking substrate-bound nanostructures is electron beamlithography (EBL). In EBL, the desired pattern is seriallyproduced by exposing a thin layer of photo-resist to highenergy electrons, followed by chemical development anddeposition of the noble metal, Fig. 4a. Several researchgroups have focused on the optical properties of two-dimensional arrays in order to utilise these nanoparticleassemblies as surface-enhanced spectroscopy substrates[70–72]. While EBL provides exquisite control overnanoscale morphology, it is an expensive and time-consu-ming technique. An alternative method for the large-scaleproduction of surface-bound nanoparticle arrays is nano-sphere lithography (NSL).
NSL is a powerful fabrication technique to inexpensivelyproduce nanoparticle arrays with controlled shape, size, andinterparticle spacing [73]. Every NSL structure begins withthe self-assembly of size-monodispersed nanospheres ofdiameter D to form a two-dimensional colloidal crystaldeposition mask [8, 73–75]. As the solvent evaporates,capillary forces draw the nanospheres together, and thenanospheres crystallise into a hexagonally close-packedpattern on the substrate. As in all naturally occurringcrystals, nanosphere masks include a variety of defects thatarise as a result of nanosphere polydispersity, site random-ness, point defects, line defects, and polycrystalline domains.Typical defect-free domain sizes are in the 10–100mm range.Following self-assembly of the nanosphere mask, a metal orother material is then deposited by thermal evaporation,electron beam deposition, or pulsed laser deposition,Fig. 4b. After metal deposition, the nanosphere mask isremoved, leaving behind surface-confined nanoparticleswith triangular footprints.
3 Sensing with noble metal nanostructures
It is apparent from (1) that the location of the extinctionmaximum of noble metal nanoparticles is highly dependent
b c
e f
d
a
TEOSthiosilane
60 nm
100 nm
Fig. 3 Schematic illustration and micrographs of core-shellnanoparticlesa Metal nanoparticles are functionalized with mercapto-silanes, whichserve as nucleation sites of the growth of the silica shellb TEM micrograph of silica encapsulated metal nanoparticlesc Dark-field optical micrograph of the silica-encapsulated metalnanoparticlesd A dielectic core is decorated with small gold nanoparticles, which arethen grown via electroless plating until a continuous shell is formede TEM micrograph of the dielectric core-metal shell nanoparticlesf Dark-field optical micrograph of the dielectric core-metal shellnanoparticles
a
1 µm
b
500 nm
Fig. 4a Scanning electron micrograph image of electron beam lithographyarrays. Cylindrical nanoparticles with a diameter of 200nm andheights of 40nm Ag in square arrangement with a lattice spacing of350nm. Reproduced with permission from [13]. Copyright 2003, TheAmerican Chemical Societyb Atomic force microscopy micrograph of the nanosphere lithographyarrays. Triangular nanoparticles with perpendicular bisectors of100nm and heights of 50nm Ag
IEE Proc.-Nanobiotechnol., Vol. 152, No. 1, February 2005 15

on the dielectric properties of the surrounding environmentand that wavelength shifts in the extinction maximum ofnanoparticles can be used to detect molecule-inducedchanges surrounding the nanoparticle. As a result, thereare at least four different nanoparticle-based sensingmechanisms that enable the transduction of macromolecu-lar or chemical-binding events into optical signals based onchanges in the LSPR extinction or scattering intensity shiftsin LSPR lmax, or both. These mechanisms are: (i) resonantRayleigh scattering from nanoparticle labels in a manneranalogous to fluorescent dye labels [38, 39, 76–82]; (ii)nanoparticle aggregation [83]; (iii) charge-transfer interac-tions at nanoparticle surfaces [35, 84–88]; and (iv) localrefractive index changes [20, 23–25, 27, 28, 84, 89–93].
3.1 Solution-phase nanoparticle sensingSolution-phase nanoparticle-based sensing is a simple, yetpowerful detection modality. Because many molecules ofinterest, particularly biological molecules, are in the aqueousphase, it is desirable to have a sensitive and specificdetection system that is homogenous with the phase of thetarget molecule, thereby decreasing the need for extendedsample preparation. Aggregation-based detection has be-come a mainstay in the clinical community since thedevelopment of the latex agglutination test, (LAT) in 1956[94]. In the LAT and similar tests, biomolecular-specificantibodies are conjugated to latex microspheres which,when mixed with a solution (e.g. blood or urine) containingthe target antigen, cause the latex spheres to form visibleaggregates. Whereas LATs are effective and quite rapid(15min to 1h), they are inherently insensitive, relying onhigh concentrations of analytes and on the human eye as adetector.
In contrast, for solution-phase LSPR-based sensing,signal transduction depends on the sensitivity of the surfaceplasmon to interparticle coupling. When multiple particlesin solution that support a localised surface plasmon are inclose proximity (i.e. interparticle spacings less than thenanoparticle diameter), they are able to interact electro-magnetically through a dipole coupling mechanism. Thisbroadens and red shifts the LSPR, and small clusters ofparticles possess LSPR properties similar to those of alarger single particle. Two methods of detection readily lendthemselves to monitoring these changes in the position ofthe LSPR: (i) UV-visible (UV-vis) extinction (absorptionplus scattering); and (ii) resonant Rayleigh scatteringspectroscopy.
Several papers have been published on a gold nanopar-ticle-based UV-vis technique for the detection of DNA.This colourimetric detection method is based on the changein absorbance spectra (i.e. colour) as particles are broughttogether by the hybridisation of complementary DNAstrands [95, 96]. The limits of detection (LOD) reported arein the range of tens of femtomoles of target oligonucleotide.These nanoparticle aggregation assays represent a 100-foldincrease in sensitivity over conventional fluorescence-basedassays [77]. Recently, gold nanoshells, that is, silica beadswith a thin gold coating, have been used to detect antigensin whole blood [22]. In these studies, gold nanoshells werefunctionalised with a specific immunoglobulin. The nano-shells were designed so that they exhibit plasmon resonancesin the near-infrared between the water absorption band andthe absorption of hemoglobin. Upon addition of thenanoshells to whole blood that contains the appropriateantigen, the plasmon resonance broadens, the intensitydecreases, and a slight red shift in the plasmon resonanceoccurs. This immunoassay, which occurs in less than30min, is capable of detecting picogram/millilitre quantities
of antigens. Sensing based on resonant Rayleigh scatteringdetection is a potentially more powerful, yet less wellpublished, method than the colourimetric technique men-tioned above [38, 97, 98]. Figure 5 demonstrates a simplesensing experiment, wherein the observed scattering colourchanges as gold nanoparticles are drawn together byprotein-protein interactions [99]. The disadvantages of thistype of experiment is that the aggregation of the particles,necessary to induce interparticle coupling and generate asignal, is often irreversible, difficult to quantitate, and canlead to sufficient aggregation of the nanoparticles that theysettle out of solution.
3.2 Nanoparticle labellingWhereas the application of noble metal nanostructures asoptical data storage elements is still under development,companies have already been formed to exploit noble metalnanostructures as biological labels. Nanoscale cylinderswith stripes of different metals have been used asimmunoassay tags; readout mechanisms have been basedon both the extinction [98] and reflectivity [100]. In anotherexample, Siiman and Burshteyn [101] have applied thincoatings of Ag or Au to latex microspheres that then act asflow cytometry labels. The noble metal island films make iteasy to identify different subpopulations of white blood cellswithout significantly changing the bead’s flow character-istics. When the labelled strand of DNA is exposed to acomplimentary single strand of DNA immobilised on aglass substrate, the Au nanoparticle is bound to the surface.A flatbed scanner can be used to identify DNA matches.
Noble metal nanoparticles can go beyond acting aslabels; recent advances show that changes in nanoparticleoptical properties can act as the signal transductionmechanism in chemosensing and biosensing events. Haeset al. [26] andMalinsky et al. [84] have exploited the extremeLSPR sensitivity of NSL-fabricated nanoparticles tochanges in local refractive index in order to sense smallmolecules, amino acids, proteins, and antibodies. TheLSPR shifts systematically to lower energies as the localdielectric constant increases; accordingly, chemisorption ofalkanethiols of increasing length cause a systematic red-shift
a b c
Fig. 5 Time-lapse photographs of the rapid colourimetric testa 60nm gold conjugatesb Stirring a 1:1 solution of IgG/gold conjugates and anti-human IgG/gold conjugates after approximately 3min of stirringc The same solution as (Fig. 5b), approximately 10min later. Note thereadily observed change in colour from green to orange, which iscaused by interparticle coupling
16 IEE Proc.-Nanobiotechnol., Vol. 152, No. 1, February 2005

in the LSPR (3nm/methylene unit) [84]. These nanoparticlesensors take advantage of tunable noble metal nanostruc-ture optical properties in order to sensitively and selectivelydetect trace levels of the target molecule. These experimentsare further detailed below.
3.3 Sensing on surfacesA possible method for circumventing the difficulty ofirreversible aggregate formation is to synthesise nanoparti-cles bound to substrates. Using this method, gold or silvernanoparticles can be chemically attached in a randomfashion to a transparent substrate to detect proteins [32, 89].In this format, signal transduction depends on changes inthe nanoparticles’ dielectric environment induced by solventor target molecules (not via nanoparticle coupling). Usingthis chip-based approach, a solvent refractive indexsensitivity of 76.4nm/RIU has been found and a detectionof 16nM streptavidin can be detected [32, 89]. Thisapproach has many advantages including: (i) a simplefabrication technique that can be performed in most labs;(ii) real-time biomolecule detection using UV-vis spectro-scopy; and (iii) a chip-based design that allows formultiplexed analysis.
3.4 Sensing with nanoparticle arraysThe development of biosensors for the diagnosis andmonitoring of diseases, drug discovery, proteomics, and theenvironmental detection of biological agents is an extremelysignificant problem [102]. Fundamentally, a biosensor isderived from the coupling of a ligand-receptor bindingreaction [103] to a signal transducer. Much biosensorresearch has been devoted to the evaluation of the relativemerits of various signal transduction methods includingoptical [104, 105], radioactive [106, 107], electrochemical[108, 109], piezoelectric [110, 111] magnetic [112, 113],micromechanical [114, 115] and mass spectrometric [116,117]. The development of large-scale biosensor arrayscomposed of highly miniaturised signal transducer elementsthat enable the real-time, parallel monitoring of multiplespecies is an important driving force in biosensor research.Recently, several research groups have begun to explorealternative strategies for the development of opticalbiosensors and chemosensors based on the extraordinaryoptical properties of noble metal nanoparticles. Recently, itwas demonstrated that nanoscale chemosensors andbiosensors can be realised through shifts in the LSPR lmax
of triangular silver nanoparticles. These wavelength shiftsare caused by adsorbate-induced local refractive indexchanges in competition with charge-transfer interactions atthe nanoparticle surface. In this review, a detailed study ispresented demonstrating that triangular silver nanoparticlesfabricated by NSL function as extremely sensitive andselective nanoscale affinity chemosensors and biosensors. Itwill be shown that these nanoscale biosensors based onLSPR spectroscopy operate in a manner totally analogousto propagating surface plasmon resonance (SPR) sensors bytransducing small changes in refractive index near the noblemetal surface into a measurable wavelength shift response.
3.5 SPR sensors and their relationship toLSPR sensorsThe potential of propagating SPR biosensors was recog-nised in early 1980s by Liedberg et al. [118], who were ableto detect immunoglobulin antibodies by observing thechange in critical angle when the antibodies bind selectivelyon a Au film. Propagating surface plasmons are evanescentelectromagnetic waves that travel along the flat smoothmetal-dielectric interfaces and arise from oscillations of the
conduction electrons in the metal [119]. SPR sensors detectthe local refractive index changes that occur when the targetanalyte binds to the metal film or nanoparticles. Surfacerefractive index sensors have an inherent advantage overoptical biosensors that require a chromophoric group orother label to transduce the binding event, as in the labellingexperiments described above.
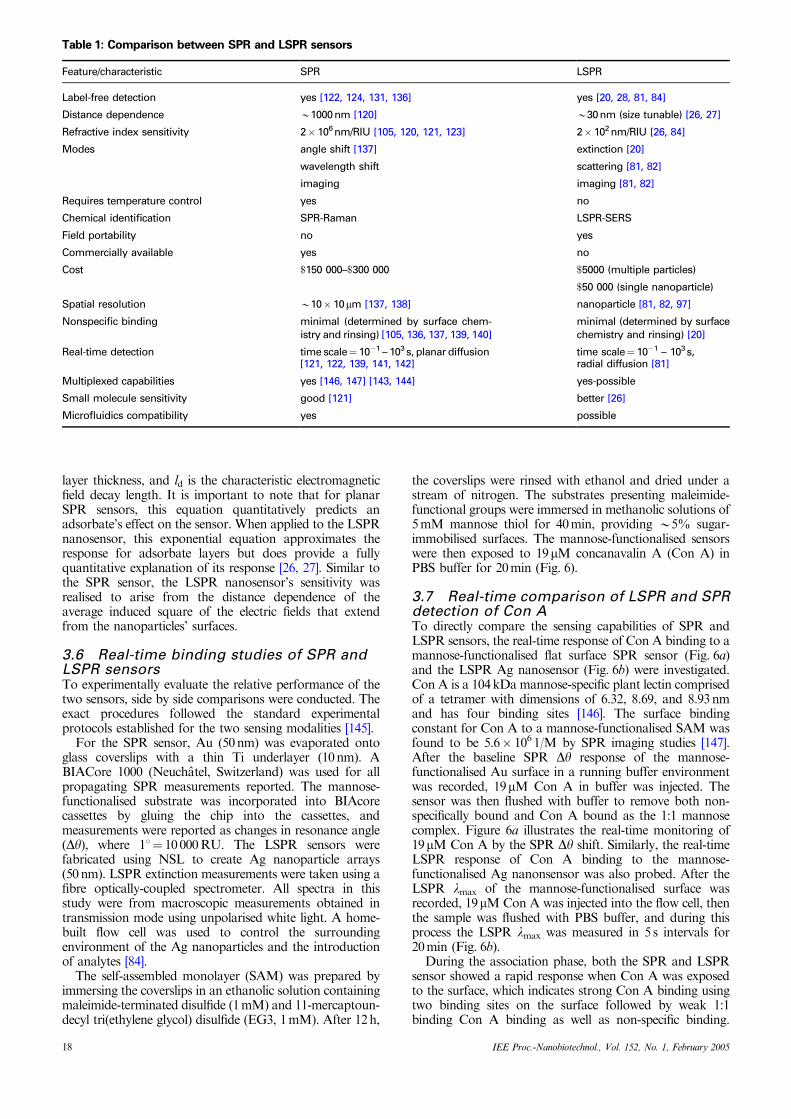
It was realised that the sensor transduction mechanism ofthis LSPR-based nanosensor is analogous to that of SPRsensors (Table 1). Since their original discovery, SPRchanges have been used in refractive-index-based sensingto detect analyte binding at or near a metal surface and hasbeen widely used to monitor a broad range of analyte-surface binding interactions including the adsorption ofsmall molecules [120–122], ligand-receptor binding [123–126], protein adsorption on self-assembled monolayers[127–129], antibody-antigen binding [130], DNA andRNA hybridisation [131–134] and protein-DNA interac-tions [135].
Important differences to appreciate between the SPR andLSPR sensors are the comparative refractive indexsensitivities and the characteristic electromagnetic fielddecay lengths. SPR sensors exhibit large refractive indexsensitivities (B2� 106nm/RIU) [120]. For this reason, theSPR response is often reported as a change in refractiveindex units. The LSPR nanosensor, on the other hand, hasa modest refractive index sensitivity (B2� 102nm/RIU)[84]. Given that this number is four orders of magnitudesmaller for the LSPR nanosensor in comparison to the SPRsensor, initial assumptions were made that the LSPRnanosensor would be 10000 times less sensitive than theSPR sensor. This, however, is not the case. In fact, the twosensors are very competitive in their sensitivities. The short(and tunable) characteristic electromagnetic field decaylength, ld, provides the LSPR nanosensor with its enhancedsensitivity [26, 27]. These LSPR nanosensor results indicatethat the decay length, ld, is B5–15nm or B1–3% of thelight’s wavelength and depends on the size, shape, andcomposition of the nanoparticles. This differs greatly fromthe 200–300nm decay length or B15–25% of the light’swavelength for the SPR sensor [120]. Also, the smallestfootprint of the SPR and LSPR sensors differ. In practice,SPR sensors require at least a 10� 10mm area for sensingexperiments. For LSPR sensing, this spot size can beminimised to a large number of individual sensing elements(1� 1010 nanoparticles for a 2mm spot size, nanospherediameter¼ 400nm) down to a single nanoparticle (with anin-plane width of B20nm) using single nanoparticlemeasurement techniques [81]. The nanoparticle approachcan deliver the same information as the SPR sensor, therebyminimising its effective pixel size to the sub-100nm regime.Because of the lower refractive index sensitivity, the LSPRnanosensor requires no temperature control whereas theSPR sensor (with a large refractive index sensitivity)requires temperature control. The final and most dramaticdifference between the LSPR and SPR sensors is cost.Commercialised SPR instruments can vary between$150000–$300000, whereas the prototype and portableLSPR system costs less than $5000.
There is, however, a unifying relationship between thesetwo seemingly different sensors. Both sensors’ overallresponse can be described using the following equation[120]:
Dlmax ¼ mDnð1�expð�2d=ldÞÞ ð3Þ
where Dlmax is the wavelength shift response, m is therefractive index sensitivity, Dn is the change in refractiveindex induced by an adsorbate, d is the effective adsorbate
IEE Proc.-Nanobiotechnol., Vol. 152, No. 1, February 2005 17
layer thickness, and ld is the characteristic electromagneticfield decay length. It is important to note that for planarSPR sensors, this equation quantitatively predicts anadsorbate’s effect on the sensor. When applied to the LSPRnanosensor, this exponential equation approximates theresponse for adsorbate layers but does provide a fullyquantitative explanation of its response [26, 27]. Similar tothe SPR sensor, the LSPR nanosensor’s sensitivity wasrealised to arise from the distance dependence of theaverage induced square of the electric fields that extendfrom the nanoparticles’ surfaces.
3.6 Real-time binding studies of SPR andLSPR sensorsTo experimentally evaluate the relative performance of thetwo sensors, side by side comparisons were conducted. Theexact procedures followed the standard experimentalprotocols established for the two sensing modalities [145].
For the SPR sensor, Au (50nm) was evaporated ontoglass coverslips with a thin Ti underlayer (10nm). ABIACore 1000 (Neuch#atel, Switzerland) was used for allpropagating SPR measurements reported. The mannose-functionalised substrate was incorporated into BIAcorecassettes by gluing the chip into the cassettes, andmeasurements were reported as changes in resonance angle(Dy), where 11¼ 10000RU. The LSPR sensors werefabricated using NSL to create Ag nanoparticle arrays(50nm). LSPR extinction measurements were taken using afibre optically-coupled spectrometer. All spectra in thisstudy were from macroscopic measurements obtained intransmission mode using unpolarised white light. A home-built flow cell was used to control the surroundingenvironment of the Ag nanoparticles and the introductionof analytes [84].
The self-assembled monolayer (SAM) was prepared byimmersing the coverslips in an ethanolic solution containingmaleimide-terminated disulfide (1mM) and 11-mercaptoun-decyl tri(ethylene glycol) disulfide (EG3, 1mM). After 12h,
the coverslips were rinsed with ethanol and dried under astream of nitrogen. The substrates presenting maleimide-functional groups were immersed in methanolic solutions of5mM mannose thiol for 40min, providing B5% sugar-immobilised surfaces. The mannose-functionalised sensorswere then exposed to 19mM concanavalin A (Con A) inPBS buffer for 20min (Fig. 6).
3.7 Real-time comparison of LSPR and SPRdetection of Con ATo directly compare the sensing capabilities of SPR andLSPR sensors, the real-time response of Con A binding to amannose-functionalised flat surface SPR sensor (Fig. 6a)and the LSPR Ag nanosensor (Fig. 6b) were investigated.Con A is a 104kDa mannose-specific plant lectin comprisedof a tetramer with dimensions of 6.32, 8.69, and 8.93nmand has four binding sites [146]. The surface bindingconstant for Con A to a mannose-functionalised SAM wasfound to be 5.6� 1061/M by SPR imaging studies [147].After the baseline SPR Dy response of the mannose-functionalised Au surface in a running buffer environmentwas recorded, 19mM Con A in buffer was injected. Thesensor was then flushed with buffer to remove both non-specifically bound and Con A bound as the 1:1 mannosecomplex. Figure 6a illustrates the real-time monitoring of19mM Con A by the SPR Dy shift. Similarly, the real-timeLSPR response of Con A binding to the mannose-functionalised Ag nanonsensor was also probed. After theLSPR lmax of the mannose-functionalised surface wasrecorded, 19mMCon A was injected into the flow cell, thenthe sample was flushed with PBS buffer, and during thisprocess the LSPR lmax was measured in 5 s intervals for20min (Fig. 6b).
During the association phase, both the SPR and LSPRsensor showed a rapid response when Con A was exposedto the surface, which indicates strong Con A binding usingtwo binding sites on the surface followed by weak 1:1binding Con A binding as well as non-specific binding.
Table 1: Comparison between SPR and LSPR sensors
Feature/characteristic SPR LSPR
Label-free detection yes [122, 124, 131, 136] yes [20, 28, 81, 84]
Distance dependence B1000nm [120] B30nm (size tunable) [26, 27]
Refractive index sensitivity 2� 106 nm/RIU [105, 120, 121, 123] 2�102 nm/RIU [26, 84]
Modes angle shift [137] extinction [20]
wavelength shift scattering [81, 82]
imaging imaging [81, 82]
Requires temperature control yes no
Chemical identification SPR-Raman LSPR-SERS
Field portability no yes
Commercially available yes no
Cost $150 000–$300 000 $5000 (multiple particles)
$50 000 (single nanoparticle)
Spatial resolution B10� 10mm [137, 138] nanoparticle [81, 82, 97]
Nonspecific binding minimal (determined by surface chem-istry and rinsing) [105, 136, 137, 139, 140]
minimal (determined by surfacechemistry and rinsing) [20]
Real-time detection time scale¼10�1 – 103 s, planar diffusion time scale¼ 10�1 – 103 s,[121, 122, 139, 141, 142] radial diffusion [81]
Multiplexed capabilities yes [146, 147] [143, 144] yes-possible
Small molecule sensitivity good [121] better [26]
Microfluidics compatibility yes possible
18 IEE Proc.-Nanobiotechnol., Vol. 152, No. 1, February 2005

However, during the dissociation phase, when the Con A-bound SPR sensor surface was flushed with PBS buffer, theresponse decreased by 60% whereas the response decreasedonly by 14% for the LSPR sensor. It is hypothesised thatthis difference is the long-range decay length of the SPRsensor electromagnetic field (ldE200nm) [120], compared tothat of the LSPR sensor (ldE5–6nm) [26, 27].
3.8 LSPR streptavidin and immunoglobulinsensing on nanoparticle arraysAs described above, nanoscale chemosensing and biosen-sing could be realised through shifts in the LSPR extinctionmaximum (lmax) of these triangular silver nanoparticles[20, 23, 28, 84]. Signal transduction is an effect caused byshifts in wavelength produced by adsorbate-induced localrefractive index changes in competition with charge-transferinteractions at the surfaces of nanoparticles. For theseexperiments, NSL was used to fabricate 25 and 50nm Agnanoparticles on glass or mica. The peak-to-peak wave-length shift noise of the baseline in repetitive experimentsfrom this spectrometer is B0.5nm. Taking the limit ofdetection as three times this value, one can conservativelyestimate the limit of detection of an assay will arise from awavelength shift of 1.5nm.
3.9 Streptavidin sensing using LSPRspectroscopyThe well-studied biotin-streptavidin system with its extre-mely high binding affinity (KaB1013 1/M) is chosen toillustrate the ultra-sensitive attributes of these LSPR-basednanoscale affinity biosensors. The biotin-streptavidin systemhas been studied in great detail by SPR spectroscopy andserves as an excellent model system for the LSPRnanosensor [20]. Streptavidin, a tetrameric protein, canbind up to four biotinylated molecules (i.e. antibodies,inhibitors, nucleic acids, etc.) with minimal impact on itsbiological activity and therefore will provide a readypathway for extending the analyte accessibility of the LSPRnanobiosensor.
In the streptavidin detection scheme, the lmax of the Agnanoparticles were monitored during each surface functio-nalisation step (Fig. 7) [20]. First, the LSPR lmax of thebare Ag nanoparticles was measured to be 561.4nm (step Ain Fig. 7). To ensure a well-ordered SAM on the Agnanoparticles, the sample was incubated in a 3:1 Octa-nethiol : mercaptoundecanoic acid (OT/MUA) for 24h.The LSPR lmax (step B in Fig. 7) was measured to be
598.6nm, a 38nm red shift. Next, biotin was covalentlyattached via amide bond formation to carboxylated surfacesites (step C in Fig. 7). The LSPR lmax after biotinattachment (step C in Fig. 7) was measured to be609.6nm, corresponding to an additional +11nm shift.Exposure to 100nM streptavidin, resulted in LSPRlmax¼ 636.6nm (step D in Fig. 7) corresponding to anadditional +27nm shift.
3.10 Anti-biotin sensing using LSPRspectroscopyA field of particular interest is the study of the interactionbetween antigens and antibodies. For these reasons we havechosen to focus the present LSPR nanobiosensor study onthe prototypical immunoassay involving biotin and anti-biotin, an IgG antibody. Ag nanotriangles were synthesisedusing NSL to develop a LSPR biosensor that monitors theinteraction between a biotinylated surface and free anti-biotin in solution [28]. The importance of this study is that itdemonstrates the feasibility of LSPR biosensing with abiological couple whose binding affinity is significantly
0.3
buffer buffer bufferCon A
0.2
0.1
0
0 200 400 600 800 400 800 1200time, s
b
time, s
∆�, d
eg
∆�m
ax, n
m
a
0
2
4
6
8
bufferCon A
experimental point
line drawn to guide the eye
Fig. 6 The real-time response of a sugar-functionalised sensor as 19mM of Con A was injected in the cell following buffer injectiona Mannose-functionalised SPR sensorb Mannose-functionalised LSPR nanosensor
0.28
0.24
0.20
0.16
300 500
561.4
598.6 609.6
636.6A
B C
D
700wavelength, nm
extin
ctio
n
Fig. 7 LSPR spectra of each step in the surface modification ofNSL-derived Ag nanoparticles to form a biotinylated Ag nanobio-sensor and the specific binding of streptavidin. Step A: Agnanoparticles before chemical modification lmax¼ 561.4 nm; StepB: Ag nanoparticles after modification with 1 mM 1:3 11-MUA: I-OT, lmax¼ 598.6 nm; Step C: Ag nanoparticles after modificationwith 1 mM biotin lmax¼ 609.6 nm. Step D: Ag nanoparticles aftermodification with 100 nm streptavidin lmax¼ 636.8 nm. All extinc-tion measurements were collected in a N2 environment. (Reproducedwith permission from [20]. Copyright 2002, The American ChemicalSociety)
IEE Proc.-Nanobiotechnol., Vol. 152, No. 1, February 2005 19

lower (1.9� 106–4.98� 108 1/M) than in the biotin/streptavidin model [20].
Each step of the functionalisation of the samples wasmonitored using UV-vis spectroscopy, as shown in Fig. 8[28]. After a 24h incubation in SAM, the LSPR extinctionwavelength of the Ag nanoparticles was measured to be670.3nm (step A in Fig. 8). The LSPR wavelength shift dueto biotin binding was measured to be +12.7nm, resultingin a LSPR extinction wavelength of 683.0nm (step B inFig. 8). At this stage, the nanosensor was ready to detect thespecific binding of anti-biotin. Incubation in 700nM anti-biotin resulted in a LSPR wavelength shift of +42.6nm,giving a lmax of 725.6nm (step C in Fig. 8).
3.11 Concentration-dependent responseIt was revealed that if the analyte solution was decreased,the LSPR wavelength shift response also decreased.Subsequently, the full response of the sensor was deter-mined over a wide concentration range. For this reason,variable analyte concentrations were exposed to a biotiny-lated LSPR chip to test the sensitivity of the systemto different molecules. Specifically, the LSPR lmax shift,DR, against analyte concentration response curve was
measured over the concentration range 1� 10�15Mo[streptavidin]o1� 10�6M and 7� 10�10Mo[anti-biotin]o7� 10�6M (Fig. 9) [20, 28]. The lines seen in Fig. 9 arenot a fit to the data. Instead, the line was computed from aresponse model (a complete analysis of this model isdescribed in [28]). It was found that this response couldbe interpreted quantitatively in terms of a model involving;(i) 1:1 binding of a ligand to a multivalent receptorwith different sites but invariant affinities; and (ii) theassumption that only adsorbate-induced local refractiveindex changes were responsible for the operation of theLSPR nanosensor.
The binding curve provides three important character-istics regarding the system being studied. First, the mass anddimensions of the molecules affect the magnitude of theLSPR shift response. Comparison of the data withtheoretical expectations yielded a saturation response,DRmax¼ 26.5nm for streptavidin, a 60kDa molecule, and38.0nm for anti-biotin antibody, a 150kDa molecule.Clearly, a larger mass density at the surface of thenanoparticle results in a larger LSPR response. Next, thesurface-confined thermodynamic binding constant Ka,surf
can be calculated from the binding curve and is estimated tobe 1� 1011 1/M for streptavidin and 4.5� 1071/M for anti-biotin antibody. These numbers are directly correlated tothe third important characteristic of the system, the LOD.The LOD is less than 1pM for streptavidin and 100pM foranti-biotin antibody. As predicted, the LOD of thenanobiosensor studied is lower for systems with higherbinding affinities such as for the well-studied biotin-streptavidin couple and higher for systems with lowerbinding affinities as seen in the anti-biotin antibody system.Given this information and analysis, a similar treatment canbe made for virtually any ligand receptor system. It shouldbe noted that the LOD of the system corresponds to thesmallest reliable wavelength shift response induced by agiven solution concentration. These ‘real’ LODs are oftentranslated to the commonly reported surface coverage interms of molecules. For the LSPR nanosensor, the surfacecoverage detection corresponds to B25 streptavidin mole-cules per nanoparticle. In the previously described experi-ments, B3� 108 nanoparticles were probed (nanoparticledensity B1� 1010 nanoparticles per square centimetre witha spot size with a 1mm radius), and this corresponds to thedetection of a 75� 108 streptavidin molecules. A clearmethod to decrease the number of molecules detectedwould be to decrease the number of nanoparticles probed.
500 600
0.08
0.10
0.12
0.14
0.16
670.3A
683.0
725.6
B
C
700 800
wavelength, nm
extin
ctio
n
Fig. 8 LSPR spectra for each step of the preparation of the Agnanobiosensor, and the specific binding of anti-biotin to biotin. StepA: Ag nanoparticles after modification with 1 mM 3:1 1-OT/11-MUA, lmax¼ 670.3 nm; Step B: Ag nanoparticles after modificationwith 1 mM biotin, lmax¼ 683.0 nm; and Step C: Ag nanoparticlesafter modification with 700 nM anti-biotin, lmax¼ 725.6 nm. Allspectra were collected in a N2 environment. Reproduced withpermission from [28]. Copyright 2003, The American ChemicalSociety
40
30
20
10
0
LSP
R r
espo
nse,
nm
10−16 10−15 10−14 10−13 10−12 10−11 10−10 10−9 10−8 10−7 10−6 10−5 10−4 10−3
concentration, M
streptavidin
Rmax = 26.5 nm
Ka, surf = 1×10¹¹ 1/M
LOD < 1 pManti-biotin
Rmax = 38.0 nm
Ka, surf = 4.5×10⁷ 1/M
LOD < 700 pM
Fig. 9 The specific binding of streptavidin (left) and anti-biotin (right) to a biotinylated Ag nanobiosensor is shown in the response curves. Allmeasurements were collected in a N2 environment. The solid line is the calculated value of the nanosensor’s response. Reproduced with permissionfrom [20]. Copyright 2002, The American Chemical Society. Reproduced with permission from [28]. Copyright 2003, The American ChemicalSociety
20 IEE Proc.-Nanobiotechnol., Vol. 152, No. 1, February 2005

This has been recently demonstrated as described in greaterdetail in a later Section.
3.12 Detection of disease markers using theLSPR sensor chipAlzheimer’s disease is the leading cause of dementia inpeople over age 65 and affects an estimated 4000000Americans [148]. Although first characterised almost 100years ago by Alois Alzheimer, who found brain lesions nowcalled plaques and tangles in the brain of a middle-agedwoman who died with dementia in her early fifties [149], themolecular cause of the disease is not understood; and anaccurate diagnostic test has yet to be developed. However,two inter-related theories for Alzheimer’s disease haveemerged that focus on the putative involvement ofneurotoxic assemblies of a small 42-amino acid peptideknown as amyloid beta (Ab) [150, 151]. The widelyinvestigated ‘amyloid cascade’ hypothesis suggests that theamyloid plaques cause neuronal degeneration and, conse-quently, memory loss and further progressive dementia. Inthis theory, the Ab protein monomers, present in all normalindividuals, do not exhibit toxicity until they assemble intoamyloid fibrils [152]. The other toxins are known as Ab-derived diffusible ligands (‘ADDLs’). ADDLs are small,globular, and readily soluble, 3-24mers of the Abmonomer[153] and are potent and selective central nervous systemneurotoxins which possibly inhibit mechanisms of synapticinformation storage with great rapidity [153]. ADDLs nowhave been confirmed to be greatly elevated in autopsiedbrains of Alzheimer’s disease subjects [154]. An ultra-sensitive method for ADDLs/anti-ADDLs antibody detec-tion potentially could emerge from LSPR nanosensortechnology, providing an opportunity to develop the firstclinical lab diagnostic for Alzheimer’s disease. Preliminaryresults indicate that the LSPR nanosensor can be used toaid in the diagnosis of Alzheimer’s disease [155, 156].
3.13 Sensing with single nanoparticlesThe extension of the LSPR sensing technique to the singlenanoparticle limit provides several improvements overexisting array- or cluster-based techniques [157, 158]. First,absolute detection limits are dramatically reduced. Thesurface area of chemically prepared Ag nanoparticles istypically less than 20000nm2, which requires that acomplete monolayer of adsorbate must constitute fewerthan approximately 100 zeptomol. The formation ofalkanethiol monolayers on Ag nanoparticles can result ina LSPR lmax shift of greater than 40nm, a change that isover 100 times larger than the resolution of convention UV-visible spectrometers [159]. This suggests that the limit ofdetection for single nanoparticle-based LSPR sensing willbe well below 1000 molecules for small molecule adsorbates.For larger molecules such as antibodies and proteins thatresult a greater change in the local dielectric environmentupon surface adsorption, the single molecule detection limitmay be achievable [28]. Second, the extreme sensitivity ofsingle nanoparticle sensors dictates that only very smallsample volumes (i.e. attolitres) are necessary to induce ameasurable response. This characteristic could eliminate theneed for analyte amplification techniques (e.g., the poly-merase chain reaction) required by other analyticalmethods. Third, single nanoparticle sensing platforms arereadily applicable to multiplexed detection schemes. Bycontrolling the size, shape, and chemical modification ofindividual nanoparticles, multiple sensing platforms can begenerated in which each unique nanoparticle can bedistinguished from the others based on the spectral locationof its LSPR [81, 157, 158]. Several of these unique
nanoparticles may then be incorporated into a one device,allowing for the rapid, simultaneous detection of thousandsof different chemical or biological species.
The key to exploiting single nanoparticles as sensingplatforms is developing a technique to monitor the LSPR ofindividual nanoparticles with a reasonable signal-to-noiseratio [81]. UV-visible absorption spectroscopy does notprovide a practical means of accomplishing this task. Evenunder the most favourable experimental conditions, theabsorbance of a single nanoparticle is very close to the shotnoise-governed limit of detection. Instead, resonant Ray-leigh scattering spectroscopy is the most straightforwardmeans of characterising the optical properties of individualmetallic nanoparticles.
3.14 Experimental procedure for singlenanoparticlesColloidal Ag nanoparticles were prepared by reducing silvernitrate with sodium citrate in aqueous solution according tothe procedure referenced above [40]. Immobilised particleson cover slips were inserted into a flow cell and wereexposed to various dielectric environments or molecularadsorbates [81]. Prior to all experiments, the nanoparticlesin the flow cell were repeatedly rinsed with methanol anddried under nitrogen. All optical measurements wereperformed using an inverted dark-field microscopeequipped with an imaging spectrograph [81, 82]. Theapparatus used in these experiments is shown in Fig. 10.
3.15 Single nanoparticle refractive indexsensitivityThe local refractive index sensitivity of the LSPR of a singleAg nanoparticle was measured by recording the resonantRayleigh scattering spectrum of the nanoparticle as it wasexposed to various solvent environments inside the flow cell.As illustrated in Fig. 11, the LSPR lmax systematically shiftsto longer wavelength as the solvent RIU is increased. Linearregression analysis for this nanoparticle yielded a refractiveindex sensitivity of 203.1nmRIU�1. The refractive indexsensitivity of several individual Ag nanoparticles wasmeasured and typical values were determined to be 170–235nm RIU�1 [81]. These are similar to the values obtainedfrom experiments utilising arrays of NSL fabricatedtriangular nanoparticles [26, 84].
condenser
flow cell
video
imaging spectrograph
CCD
NA = 0.95
outletinlet
NA = 0.5 − 1.3
Ag nanoparticles are immobilisedon the inside of the bottom window
a b
Fig. 10a Diagram of the instrumentation used for single nanoparticlespectroscopyb Close-up of the flow cell to show illumination and collectiongeometry
IEE Proc.-Nanobiotechnol., Vol. 152, No. 1, February 2005 21

3.16 Streptavidin sensing with singlenanoparticlesIn nanoparticle array sensing, it has been demonstrated thatit is possible to detecto100 streptavidin molecules pernanoparticle (in a solution concentration of 1pM). Thebiology community would like to reduce the amount ofbiological sample needed for an assay without amplifica-tion. For this reason, experiments have been conducted todetect streptavidin on single Ag nanoparticles [82]. Afterfunctionalisation with a capture biomolecule, the LSPR ofan individual nanoparticle was measured to be 508.0nm(curve (i) in Fig. 12). Next, 10nM streptavidin was injectedinto the flow cell, and the lmax of the nanoparticle wasmeasured at 520.7nm, curve (ii) in Fig. 12. This +12.7nmshift is estimated to arise from the detection of less than 700streptavidin molecules. It is hypothesised that just as in thearray format, as the streptavidin concentration decreases, afewer number of streptavidin molecules will bind to thesurface thereby causing smaller wavelength shifts.
3.17 Theoretical explanation of LSPRsensingTo model the experiment results presented above, thediscrete dipole approximation (DDA) method [160, 161] afinite element-based approach to solving Maxwell’s equa-tions for light interacting with an arbitrary shape/composi-tion nanoparticle was used to calculate the plasmonwavelength in the presence or absence of an adsorbate witha wavelength-dependent refractive index layer thickness.Bare silver nanoparticles with a truncated tetrahedral shapewere first constructed from cubic elements and one to twolayers of the adsorbate were added to the exposed surfacesof the nanoparticle to define the presence of the adsorbate.All calculations refer to silver nanoparticles with a dielectricconstant taken from Lynch and Hunter [162].
In this treatment the dielectric constant is taken to be alocal function, as there is no capability for a non-localdescription within the DDA approach. There have beenseveral earlier studies in which the DDA method has beencalibrated by comparison with experiment for truncatedtetrahedral particles, including studies of external dielectriceffects and substrate effects [11, 71, 163] and based on this itis expected that DDA analysis will provide a usefulqualitative description of the results. In particular, it hasbeen demonstrated that the plasmon resonance shift close tothe nanoparticle surface is dominated by hot spots whilethat farther away arises from colder regions around thenanoparticle surface. By comparing the overall maximumLSPR shifts of the nanoparticles, it was shown thatincreasing the aspect ratio of Ag nanotriangles produceslarger plasmon resonances shifts and shorter-ranged inter-actions.
This behaviour can be easily compared to lightning rods(invented by Ben Franklin) which are placed at the top of abuilding, and are designed to provide a location wherelightning will strike and from which the energy is carriedharmlessly to the ground. A needle-like metal tip is used in alightning rod, since this leads to high electric fields justabove the tip when the building is charged relative to theatmosphere above it, providing a more likely location forlightning to strike. A similar description can be used todescribe light’s interaction with tips of nanoscale silver andgold nanotriangles [26, 27]. This property is best displayed
100
80
60
40
20
0
450 500 550 600 650 700Wavelength, nm
inte
nsity
588.0
510.2 574.2 611.9
600.8
640
600
560
520
480
1.0 1.2 1.4 1.6refractive index
� max = 203.1×Rl+306.5
� max
, nm
a
b
Fig. 11a Resonant Rayleigh scattering spectra of an individual silvernanoparticle in various dielectric environments (N2, methanol,1-propanol, chloroform, and benzene)b A plot depicting the linear relationship between the solvent refractiveindex and the nanoparticle’s lmax. Reproduced with permission from[81]. Copyright 2003, The American Chemical Society
1200
800
400
0
450 500 550 600
scat
terin
g in
tens
ity
wavelength, nm
(ii)(i)
Fig. 12 Individual Ag nanoparticle sensor before and afterexposure to 10 nM streptavidin. All measurements were collectedin a nitrogen environment(i) Biotinylated Ag nanoparticle, lmax¼ 508.0nm.(ii) After streptavidin incubation, lmax¼ 520.7nm.
22 IEE Proc.-Nanobiotechnol., Vol. 152, No. 1, February 2005

in Fig. 13. This Figure was generated using the DDAmethod. This leads to fields around the nanoparticles whosemagnitudes relative to the incident light are plotted in theFigure. The results show that the electromagnetic fields aregreatly amplified (up to 65 000 times) in the region near thenanoparticle tips, leading to enhanced sensitivity tomolecules that might be located there. This informationcan be used as a basis for constructing nanoparticlestructures and understanding the sensing mechanism forsurface-enhanced spectroscopies.
4 Biological applications of surface-enhancedRaman scattering
Inelastic photon scattering was first witnessed by Ramanand Krishnan in 1928 [164] a process later to bear the nameRaman scattering and to garner the authors a Nobel Prizein 1930. In the original Nature paper [164] the inelasticscattering effect was recognised by ‘its feebleness incomparison with ordinary (Rayleigh) scattering, and by itspolarisation.’ Raman was able to observe this phenomenonby focusing a beam of sunlight through a telescope and agreen filter, and observing the wavelength-shifted yellowlight scattered from chloroform. The development of thelaser, as a source of high intensity and nearly monochro-matic light, enabled the more practical detection of the oneinelastically scattered photon from the 108 elasticallyscattered photons [165]. Further developments in the fieldof photonics, such as high quality interference and notchfilters, and ultra-sensitive photodetectors and CCD cam-eras, have enabled the routine use of Raman spectroscopyas a complement to conventional vibrational techniquessuch as near-infrared absorbance spectroscopy. As avibrational spectroscopy, Raman scattering generates in-formation rich spectra unique to a given molecule [165]. Thepotential to use the unique molecular information toperform optical ‘fingerprinting’ capable of distinguishingalmost any analyte by its spectroscopic signature alone hasinterested analytical chemists and biologists for years.Researchers have striven to overcome the low scatteringcross-sections inherent in normal Raman spectroscopy(NRS) which is a process approximately a million-fold lessefficient than fluorescence, and have developed a number ofimpressive biological applications. For example, NRS hasbeen used in the detection of glucose, in proteomics, thediagnosis of cancer and cardiovascular health, the identifi-
cation of small molecule drugs, and so forth. Reviews ofthese applications have recently been written by Cottonet al. [166], Nabiev et al. [167], and Petry et al. [168].However, the low signal intensities and complications withspectral identification caused by the generation of a spectralresponse all species in a complex mixture and theconcomitant confusion generated by closely spaced oroverlapping Raman bands unfortunately hinder applicationof NRS. SERS can increase the scattering cross-section of amolecule in proximity to a nanoscale roughened surface by106 to 1014 times, potentially mitigating the two aforemen-tioned disadvantages of NRS [169, 170].
SERS is a plasmonic phenomenon whereby specificmolecules at or near a nanoscale roughed metal surfaceundergo a dramatic increase in the intensity of the observedinelastically scattered light. Since the discovery of SERS byJeanmaire and Van Duyne [171] the exact mechanism ofenhancement has remained controversial [172, 173]. How-ever, it is generally agreed that two mechanisms contributeto the overall enhancement, a chemical effect (CHEM, a)and an electromagnetic (EM, E) enhancement. The intensityof Raman scattering is proportional to the square of P, theelectric field-induced dipole moment. The P term is relatedto the molecular polarisablity (a) and the electric field (E)experienced by the molecule. These relationships aremathematically expressed thus:
G / P 2 ð4Þand
P ¼ aE ð5ÞThe electromagnetic effect gives rise to an enhanced Ramanyield for a given molecular polarisability, whereas thechemical effect refers to a change in the polarisability itself.The theory of chemical enhancement (a) was invoked toaccount for a discrepancy between the enhancementpredicted the electrical model (E) (B104) and the empiri-cally determined enhancement (B106). It is thought that‘active sites’, either crystal defects or adatoms on the surfaceof the metal surface undergo a charge-transfer processenabling the CHEM (a) enhancement [170]. The depen-dence of optimal SERS excitation frequency on theelectrode potential suggests that new electronic states mayarise upon adsorption of the analyte, which leads toresonant intermediate states for Raman scattering. TheCHEM enhancement has been investigated, particularly theeffect of halide ions on increasing SERS [173–176]. Therecent discovery of single molecule SERS (SMSERS) byNie and Emory [177] and Kneipp et al. [178] in 1997, hasnecessitated further refinements to the EM mechanism.
It is well established that the EM mechanism arises fromoptical excitation of surface plasmon resonances in smallmetal particles, which leads to a significant increase in theelectromagnetic field strength at the particle surface.Initially, Moskovits [179] developed a resonant fractaltheory to explain surface Raman enhancement in exten-sively aggregated colloids. For single particles and smallaggregates, however, the case can be dramatically differentthan for an ensemble average of particles. Electromagneticenhancement is attributable to the formation a LSPR, asdescribed above. This polarises the particle with anelectromagnetic field significantly higher than the appliedfield. Recent theoretical modelling, has greatly extended thenature of the plasmonic material (e.g. particle morphology,spacing, and coupling) beyond the simple spherical modeldeveloped by Mie, and is more useful in describing actualexperimental conditions. The intensified field at rough orhighly-curved surfaces enhances both the incident laser light
0
65 000
x
0
2
4
6
8
10
zy
100
50
0
50
100
0
5
10
15
20
25
30
35
Fig. 13 Local E-field (plotted as contours of log 7E72) for aAg nanoparticle (in-plane width¼ 100 nm, out-of-plane height¼ 30 nm). Reproduced with permission from [26]. Copyright2004, The American Chemical Society
IEE Proc.-Nanobiotechnol., Vol. 152, No. 1, February 2005 23

and the scattered Raman light. Due to the dependence ofthe SERS signal intensity on the fourth-power of the EMfield, the signal drops by a factor of ten for each nanometreseparation between the molecule and the surface [180–182].This electromagnetic enhancement can be qualitativelyconceptualised as an ‘antenna’ effect, gathering andstrengthening local electric fields.
4.1 Intrinsic SERS of target moleculesSERS provides not only enhanced signal intensities but alsospecies specific spectra, so it is therefore unsurprising thatmany SERS experiments have been conducted that attemptto directly address molecules of biological interest and theirchemical interactions. The first such experiment wasconducted in 1980 by Cotton et al. on cytochrome c andhemoglobin, molecules with strong electronic absorbancesin the visible. These intense absorbances were matched withthe laser excitation wavelength, lex, to eke out a few ordersof magnitude extra enhancement by exploiting surface-enhanced resonance Raman spectroscopy (SERRS). Theresonance effect has continued to make hemoglobin andcytochrome c popular proteins for study, particularly sincethe advent of SMSERS [183, 184]. In the same year asCotton’s pioneering experiments, Billman and Otto [185]also demonstrated the successful detection of cyanide onroughened silver electrodes [188]. Cyanide, while not abiomolecule as such, is nonetheless of great interest in bothbiological, environmental, and defence circles in thedetection of cyanides and similar molecules which have adirect impact on biological systems. As another example,SERS has been used on the bio-terror front for thedetection of anthrax [186]. SERS has been demonstrated tosuccessfully detect dipicolinic acid, the principle chemicalcomponent of bacillus anthracis spores (15%wt) [187]. Sincethe 1980s, the number of biological applications of SERS(and NRS) has skyrocketed [166–168, 188–194]. Indeedsignificant strides have been made in the Raman spectro-scopy of proteins and peptides using NRS, and progresscontinues as the use of SERS expands. SERS techniqueshave been applied to an impressive variety of systems [193,195–207]. Initially, most SERS experiments were conductedon electrochemically roughened surfaces. However, sincethe discovery of SMSERS, researchers have increasinglytended to use colloidal systems as they are easy to preparechemically and to model theoretically. Exceptions arecommon, however, Maxwell et al. [208] employed size-selected nanoparticle films to study amoxicillin and adenine,and the metal film-over-nanosphere (MFON) surfacesremain popular for their mechanical stability [209].Remarkably, Kneipp et al. [210] have been able to obtainSERS spectra from gold nanoparticles sited within singleliving cells. Recently, Jarvis and Goodacre [211] have usedSERS on aggregated silver colloids in combination withchemometric techniques to classify a collection of clinicalbacterial isolates. SERS can also be used to study molecularinteractions and dynamics, such a protein interactions [212–214] and pharmacokinetics [162, 215, 216]. Naturally, bothSERS and NRS lend themselves to sensitive detectionmodalities for separation science [216–219].
4.2 SMSERSDespite its tremendous power and potential the capriciousnature of SMSERS has resulted in only a few publicationson its biological application. In 1998, Kneipp et al. [220]were the first to successfully obtain SERS spectra fromsingle nucleoside bases building on their experience with notonly SMSRS [178] but also SERS detection of DNA [221,222]. Shortley afterwards, Keller et al. [223] and Emory and
Keller [224] brought SMSERS to bear on nucleosides.Recently, Xu et al. [225] have returned to the use ofhemoglobin as the SERS analyte, but at the single moleculelevel. This 1999 study was augmented a year later by anexcellent manuscript covering the contribution of the EMmechanism of SMSERS [226]. Since then, these researchershave combined SMSERS with fluorescence correlationspectroscopy to study HRP: a highly useful component inthe bioanalytical toolkit [227]. SMSERS on myoglobin hasreported by Bizzarri and Cannistraro [228] while Habuchiet al. [229] obtained SERRS spectra from the greenfluorescent protein.
4.3 Limitations to intrinsic SERSThere are two considerable difficulties in applying SERSdirectly to biological problems. First, without resonanceenhancement (as in the case of cytochrome c) it is still oftendifficult to obtain quality Raman spectra of biologicallyinteresting molecules (e.g. drugs, protein, nucleic acids, etc.),particularly at the relatively low concentrations oftennecessitated by the expense or insolubility of the analyte.Even although SERS is potentially sensitive for singlemolecule spectroscopy, not all molecules, such as water, areefficient SERS scatterers. Also many molecules neitheradsorb nor bind to the SERS active surface, making themdifficult to detect, given the consequent lack of chemical(CHEM) enhancement and greatly diminished electromag-netic enhancement (EM). Approximately one-order ofmagnitude in SERS intensity is lost per nanometre distancethe target molecule is from the enhancing substrate, makingthe detection of certain molecules, such as some ionicspecies, carbohydrates, etc., particularly problematic. Sec-ond, large biomacromolecules and numerous small mole-cules of biological importance have complex Ramanspectra, and often have a number of overlapping peaksdue to structural similarities in the molecule. For exampleall biomacromolecules are built from a limited set ofbuilding blocks; the approximately 20 amino acids forproteins, and eight nucleic acids for DNA and RNA.Teasing out specific information about a given biomacro-molecule and its composition, conformation, or interactionsis a particularly daunting, but not impossible task. Theproblem becomes particularly difficult in complex mixtures,which are the norm for biologically interesting systems suchas environmental samples from contaminated waste sites,and the protein jungle of the cytosol.
4.4 Extrinsic SERS labellingSeveral approaches have been reported to address thedifficulties with direct SERS-based detection of biologicallyrelevant targets. An attractive option is to indirectly detectthe presence of interaction of a complex and/or weaklyscattering molecule by labelling it with a small moleculewith high intensity, well defined, and characteristic spectralfeatures [230, 231]. The extrinsic labelling schemes describedbelow are all variations on the ELISA (enzyme-linkedimmunosorbent assay). A graphical summary of the variousextrinsic SERS methods is shown in Fig. 14. In a standardELISA, molecular binding events are detected usingantibodies (Abs) possessing a high affinity for the moleculeof interest, and which are covalently bound to an enzyme(e.g. HRP). Once the target molecule is immobilised on asurface, the target is exposed to the detection AB/enzymecomplex. The substrate for the enzyme is then introduced,and the enzymatic reaction allowed to occur. Typically theproduct of the enzymatic reaction is then detected bya change in a physical property, such a colour for HRP/OPD (ortho-phenylenediamine). The amount of target is
24 IEE Proc.-Nanobiotechnol., Vol. 152, No. 1, February 2005

therefore proportional to the intensity of the colourproduced after a set period of time. Dou et al. [232] werethe first to adapt an ELISA-type assay by replacingchromogenic read out with SERS detection. Vo-Dinh andco-workers deposited silver metal on the surface of DNAchips and demonstrated that SERS spectra could beobtained from dye-labelled gene probes [233–235]. Usingcolloidal nanoparticles, Graham et al. [236, 237] reportedmultiplexed SERS detection of labelled polymerase chainreaction products, and Ni et al. [238] and Pham et al. [239]showed that colloidal gold with co-adsorbed organicmolecules and Ab could be used for immunoassay readout.Improvements were realised for this method by using larger,but more optimally enhancing 63nm gold nanoparticles,which had stronger spectral intensities and were intense
enough to permit single particle imaging [240]. Innovativeresults have also been reported by Mulvaney et al. [241] andDoering and Nie [175] who prepared silica encapsulatednanoparticles for use in multiplexed bioassays. Theseencapsulated particles are stable in the presence of highsalt (common in most biological buffers), and the silica shellprotects not only the particle from the environment, butalso the environment from the potentially toxic Ramanreporter. In a significant departure from traditional SERSsubstrates, Cao et al. [242] prepared SERS-active nano-structures by seeded growth of silver on gold anddemonstrated that these structures are useful for multi-plexed nucleic acid detection. The seeded growth methodwas extended to protein detection and labelling in [243] andcell and tissue labelling in lab [99]. Both methods use smallgold nanoparticles associated with both a reporter moleculefor signal specificity and protein to confer biological activity[244]. After binding of the bioconjugates to the target,electroless deposition is employed to develop a shell of silvermetal around the nanoparticle seed, in a process confusinglyreferred to as ‘silver enhancement’. The silver layer forms acomplex fractal surface, providing the nanoscale roughnessnecessary for efficient SERS. Whereas Cao et al. [242]synthesised reporter-labelled DNA/protein conjugates, themethod developed by Stuart et al. [99] functionalises aminereactive dye molecules directly onto existing protein goldbioconjugates. This later method not only is simpler andsubstantially less expensive, but also leads to higher reporterand protein levels which increases both the conjugate’sbinding capacity and observed signal intensity.
4.5 Spectroscopic labelling of biologicalsamples with enhanced probesSince Raman scattering can be semi-quantitative, and doesnot photobleach, this method may prove useful to manybiomedical researchers, for example, to those studyingcancer. As a test bed, the technology was applied to tissuesections in a microarray format. Colon cancer/normal tissuemicroarrays were purchased from Zymed Laboratories Inc.,and subsequently deparaffinised and re-hydrated accordingto the manufacturer’s protocol. Primary antibody (mouseanti-carcinoembryonic antigen, CEA) conjugation wasachieved by following the manufacturer’s protocol, whichcould readily be automated. Secondary labelling withmalachite green/anti-mouse gold particles and subsequentsilver enhancement was performed as per standardimmunogold and silver staining practice [245]. The limitingfactor is not the spectroscopy, which is capable of singlemolecule sensitivity and large number of strongly SERS-active reporters for multiplexing, but the availability ofsuitably specific biomolecules. Fortunately, the CEA anti-body binds to a wide range of colon cancer types, but hasminimal interaction with normal tissue. Figure 15 shows theability of the technology to discriminate between thecancerous tissues (red line) and tissues taken near (adjacentmucosa, blue line) and far from the tumor site (remotemucosa, black line). By recording the spectrum of themarking tissue, the ‘hump’ was eliminated by backgroundsubtraction. Also, the silver staining itself provides a rapidmethod of determining if particles were successfully bound,and serves as a secondary method of staining tissues [246].Figure 15 shows, however, that the level of staining requiredto generate a SERS signal is quite low. To the unaided eye,there is no difference between the normal (Fig. 15b) and thecancer tissue sections (Fig. 15c). Even under microscopicexamination, correctly identifying the silver-enhanced sec-tions of the tissue can require skill and training. Spectro-scopic labelling provides a rapid and unambiguous
enzyme
OPD
azo-compound
antigen
antibody
Ag colloid SERS
spectrum
laser excitation
a
reportermolecule
laserexcitation
Aucolloid
antigen
antibody
SERSspectrum
c
Ag colloid laser
excitation
antigenantibody
SERSspectrum
silica shell
d
laser excitation
SERSspectrum
Aucolloid
Aucolloid
antigenantibody
silver enhancement
e
SSDNA
Ag
subs
trat
e
labelledssDNA
laser excitation
SERSspectrum
b
Fig. 14 Schematic of extrinsic SERS labeling methodsa SERS used to detect enzyme reaction product.b Detection of a labelled DNA after hybridisation to capture ssDNAbound to a silver substratec Extrinsic Raman Labels (ERLs) formed by the co-addition of aRaman reporter and protein to gold colloidd Composite nanospheres with encapsulated Raman labels andprotective silica shelle Silver-enhanced SERS detection with protein-modified gold probesacting as nucleation sites for electroless silver deposition
IEE Proc.-Nanobiotechnol., Vol. 152, No. 1, February 2005 25

differentiation, and the operator familiarisation time for theinstrument would be minimal.
4.6 SERS using functionalised substratesA secondary method of overcoming the difficulty in thedirect SERS detection of problematic analytes is to employa functionalised SERS surface. By coating the SERS activesubstrate with a SAM [247], hydro-gel [248] or polymer[249] substantial gains in signal can be realised fromanalytes whose SERS spectra are otherwise difficult orimpossible to obtain. Whereas the specifics of the interac-tions between the functionalised surface and the complexmixture are inherently unique to each particular combina-tion of analyte and surface, two general mechanismsoperate simultaneously to provide the improved signal.
First, the material coating the SERS substrate can act asa barrier to undesired analytes. In this sense, the coatinglayer acts as a chemical and physical filter. For example,large species may be effectively excluded by controlling thepore size on a polymer substrate coating, or cations may berepelled by using a charged SAM bound to a SERS activesurface. Stokes et al. [249] recognised the potential ofcombining polymers with SERS. The technique of SAMfunctionalisation has been largely pioneered by [203, 218,250–252] who have used the selectivity of the SAM in the
analysis of bilirubins and salicalate from whole blood, anddrug compounds amongst other targets. From a biomedicaland device perspective, perhaps the most interestingapplication of this selective SAM approach has been thedetection glucose by the collaborative efforts at North-western University [253, 254].
4.7 SERS detection of glucoseThe NIH estimates on the number of diabetics in the US isstaggering. An estimated 17 000 000 people, or about 7% ofthe US population suffer from diabetes. Current treatmentof diabetes consists of self-regulation of blood glucose levelsthrough frequent ‘finger-stick’ monitoring. A faster, easier,automated, and less painful method for frequently measur-ing glucose levels would be of great individual, clinical, andsocietal benefit.
AgFONs with a monolayer of EG3 (Fig. 16a) wereincubated for 1h in glucose solutions (0–25mM) of clini-cally relevant concentrations. SERS spectra were thenmeasured from each sample. The chemometric method ofpartial least squares (PLS) is used when the spectrum of ananalyte of interest is embedded within a complex back-ground spectrum [255]. The result of PLS analysis is a plot
30 000
35 000
25 000
20 000
15 000
10 000
5000
coun
ts p
er s
econ
d
600 800 1000
raman shift, cm−1
1200 1400 1600 1800
cancer tissueadjacent mucosaremote mucosamarker tissue (kidney)
a
b c
Fig. 15a Spectroscopic identification of cancer tissue. Spectra from canceroustissue (red), adjacent mucosa (blue), remote mucosa (46cm distant)(black), after secondary labelling with nanoparticle/dye conjugates andsubsequent silver enhancement. The cancerous tissue display clear anddistinct peaks indicating positive labelling with the nanoparticleprobes, whereas the control tissues show broad, featureless spectrab Photomicrograph of cancer tissue before the silver enhancementprocessc Photomicrograph of normal tissue after the silver enhancementprocess
600 nm
200
400
440
400
360
320
280
240
200
160
120
80
0
0
40
40 80 120 160 200 240 280 320 360 400 440
actual concentration, mg/dl
pred
icte
d co
ncen
trat
ion,
mg/
dl E
E
D
D
BB
C
C
A
A
a
b
Fig. 16a Schematic showing hypothetical glucose concentration gradientcreated by a partition layer.b Plot of PLS predicted physiologically relevant glucose concentrationsvs against actual glucose concentrations using leave-one-out cross-validation projected on a Clark Error grid. AgFON samples weremade (sphere diameter¼ 390nm, metal thickness¼ 200nm), incu-bated for 19hs in 1mM EG3, and dosed in glucose solution (range:0–25mM) for 10min. Each SERS measurement was made whilesamples were in an environmental control cell filled with glucosesolution, using lex¼ 632.8nm (3.25mW, 30 s). Dashed line is not a fit,but rather represents a perfect prediction
26 IEE Proc.-Nanobiotechnol., Vol. 152, No. 1, February 2005

of predicted analyte concentration against actual analyteconcentration. As shown in Fig. 16b, the SERS transduc-tion mechanism successfully predicts glucose concentrationquantitatively, with the vast majority of the data pointsfalling within the A or B areas of the Clark-error grid [256].
5 Conclusions
We have highlighted representative research accomplish-ments in the area of the tunable LSPR of silver and goldnanoparticles in solution and on surfaces and the applica-tion of two unique plasmonic phenomenonae (i.e. theLSPR and SERS) to biological applications and systems.We have provided the reader with a sufficiently deep, yetaccessible, coverage of the underlying principles and theorybehind surface plasmonics and its application to nanobioa-nalysis. We have highlighted work in the field that is notonly relevant and innovative, but also shows immediatepromise for near-term implementation in real-world appli-cations such as point-of-care diagnostics, environmentalmonitoring, proteomics, drug discovery, and fundamentalbiological research. Future commercialisation of nanopar-ticle devices relies on a better understanding of theinteraction between nanoparticles and their immediateenvironment, as well as the development of techniques thatwill preserve nanoparticle optical activity under challengingbiological conditions.
6 Acknowledgments
We gratefully acknowledge financial support from theNanoscale Science and Engineering Initiative of theNational Science Foundation under NSF award EEC-0118025. Any opinions, findings, and conclusion orrecommendations expressed in this material are those ofthe authors and do not necessarily reflect those of theNational Science Foundation. A. Haes acknowledges theACS division of Analytical Chemistry sponsored byDuPont for fellowship support. This project was alsosupported by the Institute for Bioengineering and Na-noscience in Advanced Medicine at Northwestern Uni-versity, and the National Institutes of Health (EY13002 andEY13015). The authors wish to thank the followingindividuals for their experimental assistance, materials, orexpertise: L. Chang, W. E. Doering, M. Glucksberg,N. Halas, W. P. Hall, C. L. Haynes, E. Jeoung, M. Kall,W. L. Klein, O. Lyandres, M. Mrksich, C. Murphy, A. D.McFarland, S. Nie, J. C. Riboh, G. C. Schatz, K. Shafer-Peltier, J. Walsh, Y. Xia, and S. Zou.
7 References
1 Haynes, C.L., and Van Duyne, R.P.: ‘Nanosphere Lithography: AVersatile Nanofabrication Tool for Studies of Size-DependentNanoparticle Optics’, J. Phys. Chem. B, 2001, 105, pp. 5599–5611
2 Mulvaney, P.: ‘Not all that’s gold does glitter’, MRS Bull., 2001, 26,pp. 1009–1014
3 El-Sayed, M.A.: ‘Some Interesting Properties of Metals Confined inTime and Nanometer Space of Different Shapes’, Accounts Chem.Res., 2001, 34, pp. 257–264
4 Link, S., and El-Sayed, M.A.: ‘Spectral Properties and RelaxationDynamics of Surface Plasmon Electronic Oscillations in Gold andSilver Nano-dots and Nano-rods’, J. Phys. Chem. B, 1999, 103,pp. 8410–8426
5 Kreibig, U., Gartz, M., Hilger, A., and Hovel, H.: ‘Opticalinvestigations of surfaces and interfaces of metal clusters’, in Duncan,M.A. (ed.): ‘Advances in Metal and Semiconductor Clusters’ (JAIPress Inc., Stamford, , 1998), Vol. 4, pp. 345–393
6 Mulvaney, P.: ‘Surface Plasmon Spectroscopy of Nanosized MetalParticles’, Langmuir, 1996, 12, pp. 788–800
7 Kreibig, U.: ‘Optics of nanosized metals’, in Hummel, R. E. andWissmann, P. (Eds.) ‘Handbook of Optical Properties’ (CRC Press,Boca Raton FL, 1997), Vol. II, pp. 145–190
8 Hulteen, J.C., Treichel, D.A., Smith, M.T., Duval, M.L., Jensen,T.R., and Van Duyne, R.P.: ‘Nanosphere Lithography: Size-TunableSilver Nanoparticle and Surface Cluster Arrays’, J. Phys. Chem. B,1999, 103, pp. 3854–3863
9 Freeman, R.G., Grabar, K.C., Allison, K.J., Bright, R.M., Davis,J.A., Guthrie, A.P., Hommer, M.B., Jackson, M.A., Smith, P.C.,Walter, D.G., and Natan, M.J.: ‘Self-Assembled Metal ColloidMonolayers: An Approach to SERS Substrates’, Science, 1995, 267,pp. 1629–1632
10 Kahl, M., Voges, E., Kostrewa, S., Viets, C., and Hill, W.:‘Periodically structured metallic substrates for SERS’, Sens. ActuatorsB, Chem., 1998, 51, pp. 285–291
11 Schatz, G.C., and Van Duyne, R.P.: ‘Electromagnetic Mechanism ofSurface-Enhanced Spectroscopy’, (Wiley, New York, , 2002), Vol. 1
12 Haynes, C.L., and Van Duyne, R.P.: ‘Plasmon-Sampled Surface-Enhanced Raman Excitation Spectroscopy’, J. Phys. Chem. B, 2003,107, pp. 7426–7433
13 Haynes, C.L., McFarland, A.D., Zhao, L., Van Duyne, R.P., Schatz,G.C., Gunnarsson, L., Prikulis, J., Kasemo, B., and K.all, M.:‘Nanoparticle Optics: The Importance of Radiative Dipole Couplingin Two-Dimensional Nanoparticle Arrays’, J. Phys. Chem. B, 2003,107, pp. 7337–7342
14 Dirix, Y., Bastiaansen, C., Caseri, W., and Smith, P.: ‘Oriented Pearl-Necklace Arrays of Metallic Nanoparticles in Polymers: A NewRoute Toward Polarization-Dependent Color Filters’, Adv. Mater.,1999, 11, pp. 223–227
15 Haynes, C.L., and Van Duyne, R.P.: ‘Dichroic Optical Properties ofExtended Nanostructures Fabricated Using Angle-Resolved Nano-sphere Lithography’, Nano Lett., 2003, 3, pp. 939–943
16 Maier, S.A., Brongersma, M.L., Kik, P.G., Meltzer, S., Requicha,A.A.G., and Atwater, H.A.: ‘Plasmonics-A Route to NanoscaleOptical Devices’, Adv. Mater., 2001, 13, pp. 1501–1505
17 Maier, S.A., Kik, P.G., Atwater, H.A., Meltzer, S., Harel, E., Koel,B.E., and Requicha, A.A.G.: ‘Local detection of electromagneticenergy transport below the diffraction limit in metal nanoparticleplasmon waveguides’, Nature Mater., 2003, 2, pp. 229–232
18 Shelby, R.A., Smith, D.R., and Schultz, S.: ‘Experimental verifi-cation of a negative index of refraction’, Science, 2001, 292,pp. 77–78
19 Andersen, P.C., and Rowlen, K.L.: ‘Brilliant optical properties ofnanometric noble metal spheres, rods, and aperture arrays’, Appl.Spectrosc.7, 2002, 56, pp. 124A–135A
20 Haes, A.J., and Van Duyne, R.P.: ‘A Nanoscale Optical Biosensor:Sensitivity and Selectivity of an Approach Based on the LocalizedSurface Plasmon Resonance Spectroscopy of Triangular SilverNanoparticles’, J. Am. Chem. Soc., 2002, 124, pp. 10596–10604
21 Mucic, R.C., Storhoff, J.J., Mirkin, C.A., and Letsinger, R.L.:‘DNA-Directed Synthesis of Binary Nanoparticle Network Materi-als’, J. Am. Chem. Soc., 1998, 120, pp. 12674–12675
22 Hirsch, L.R., Jackson, J.B., Lee, A., Halas, N.J., and West, J.L.: ‘AWhole Blood Immunoassay Using Gold Nanoshells’, Anal. Chem.,2003, 75, pp. 2377–2381
23 Haes, A.J., and Van Duyne, R.P.: ‘A Highly Sensitive and SelectiveSurface-Enhanced Nanobiosensor’, Mater. Res. Soc. Symp. Proc.,2002, 723, pp. O3.1.1–O3.1.6
24 Haes, A.J., and Van Duyne, R.P.: ‘Nanosensors Enable PortableDetectors for Environmental andMedical Applications’, Laser FocusWorld, 2003, 39, pp. 153–156
25 Haes, A.J., and Van Duyne, R.P.: ‘Nanoscale optical biosensorsbased on localized surface plasmon resonance spectroscopy’, Proc.SPIE-Int. Soc. Opt. Eng., 2003, 5221, pp. 47–58
26 Haes, A.J., Zou, S., Schatz, G.C., and Van Duyne, R.P.: ‘NanoscaleOptical Biosensor: Short Range Distance Dependence of theLocalized Surface Plasmon Resonance of Noble Metal Nanoparti-cles’, J. Phys. Chem. B, 2004, 108, pp. 6961–6968
27 Haes, A.J., Zou, S., Schatz, G.C., and Van Duyne, R.P.: ‘ANanoscale Optical Biosensor: The Long Range Distance Depen-dence of the Localized Surface Plasmon Resonance of Noble MetalNanoparticles’, J. Phys. Chem. B, 2004, 108, pp. 109–116
28 Riboh, J.C., Haes, A.J., McFarland, A.D., Yonzon, C.R., and VanDuyne, R.P.: ‘A Nanoscale Optical Biosensor: Real-Time Immu-noassay in Physiological Buffer Enabled by Improved NanoparticleAdhesion’, J. Phys. Chem. B, 2003, 107, pp. 1772–1780
29 Fritzsche, W., and Taton, T.A.: ‘Metal nanoparticles as labels forheterogeneous, chip-based DNA detection’, Nanotechnology, 2003,14, pp. R63–R73
30 Aizpurua, J., Hanarp, P., Sutherland, D.S., Kall, M., Bryant, G.W.,and Garcia de Abajo, F.J.: ‘Optical Properties of Gold Nanorings’,Phys. Rev. Lett., 2003, 90, pp. 057401/1–057401/4
31 Obare, S.O., Hollowell, R.E., and Murphy, C.J.: ‘Sensing Strategyfor Lithium Ion Based on Gold Nanoparticles’, Langmuir, 2002, 18,pp. 10407–10410
32 Nath, N., and Chilkoti, A.: ‘Immobilized gold nanoparticle sensorfor label-free optical detection of biomolecular interactions’, Proc.SPIE-Int. Soc. Opt. Eng., 2002, 4626, pp. 441–448
33 Nam, J.-M., Thaxton, C.S., and Mirkin, C.A.: ‘Nanoparticle-basedbio-bar codes for the ultrasensitive detection of proteins’, Science,2003, 301, pp. 1884–1886
34 Bailey, R.C., Nam, J.-M., Mirkin, C.A., and Hupp, J. T.: ‘Real-timemulticolor DNA detection with chemoresponsive diffraction
IEE Proc.-Nanobiotechnol., Vol. 152, No. 1, February 2005 27

gratings and nanoparticle probes’, J. Am. Chem. Soc., 2003, 125,pp. 13541–13547
35 Kreibig, U., and Vollmer, M.: ‘Cluster Materials’, (Springer-Verlag,Heidelberg, Germany, 1995), Vol. 25
36 Jensen, T.R., Malinsky, M.D., Haynes, C.L., and Van Duyne, R.P.:‘Nanosphere Lithography: Tunable Localized Surface PlasmonResonance Spectra of Silver Nanoparticles’, J. Phys. Chem. B,2000, 104, pp. 10549–10556
37 Michaels, A.M., Nirmal, M., and Brus, L.E.: ‘Surface EnhancedRaman Spectroscopy of Individual Rhodamine 6G Moleculeson Large Ag Nanocrystals’, J. Am. Chem. Soc., 1999, 121, pp.9932–9939
38 Schultz, S., Smith, D.R., Mock, J.J., and Schultz, D.A.: ‘Single-targetmolecule detection with nonbleaching multicolor optical immunola-bels’, Proc. Natl. Acad. Sci., USA, 2000, 97, pp. 996–1001
39 Yguerabide, J., and Yguerabide, E.E.: ‘Light-scattering submicro-scopic particles as highly fluorescent analogs and their use as tracerlabels in clinical and biological applications – II. Experimentalcharacterization’, Anal. Biochem., 1998, 262, pp. 157–176
40 Lee, P.C., and Meisel, D.: ‘Adsorption and surface-enhancedRaman of dyes on silver and gold sols’, J. Phys. Chem., 1982, 86,pp. 3391–3395
41 Frens, G.: Nature (Phys. Sci.), 1973, 241, pp. 20–2242 Jana, N.R., Gearheart, L., and Murphy, C.J.: ‘Wet chemical
synthesis of high aspect ratio cylindrical gold nanorods’, J. Phys.Chem. B, 2001, 105, pp. 4065–4067
43 Murphy, C.J., and Jana, N.R.: ‘Controlling the aspect ratioof inorganic nanorods and nanowires’, Adv. Mater., 2002, 14,pp. 80–82
44 Kim, F., Song, J. H., and Yang, P.D.: ‘Photochemical synthesis ofgold nanorods’, J. Am. Chem. Soc., 2002, 124, pp. 14316–14317
45 Sun, Y., Mayers, B., Herricks, T., and Xia, Y.: ‘Polyol Synthesis ofUniform Silver Nanowires: A Plausible Growth Mechanism and theSupporting Evidence’, Nano Lett., 2003, 3, pp. 955–960
46 Jin, R., Cao, Y.W., Mirkin, C.A., Kelly, K.L., Schatz, G.C., andZheng, J.G.: ‘Photoinduced conversion of silver nanospheres tonanoprisms’, Science, 2001, 294, pp. 1901–1903
47 Jin, R., Cao, Y.C., Hao, E., Metraux, G.S., Schatz, G.C., andMirkin, C.A.: ‘Controlling anisotropic nanoparticle growth throughplasmon excitation’, Nature, 2003, 425, pp. 487–490
48 Maillard, M., Giorgio, S., and Pileni, M.P.: ‘Tuning the size of silvernanodisks with similar aspect ratios: Synthesis and optical proper-ties’, J. Phys. Chem. B, 2003, 107, pp. 2466–2470
49 Maillard, M., Giorgio, S., and Pileni, M.P.: ‘Silver nanodisks’, Adv.Mater., 2002, 14, p. 1084
50 Hao, E.C., Kelly, K.L., Hupp, J.T., and Schatz, G.C.: ‘Synthesis ofsilver nanodisks using polystyrene mesospheres as templates’, J. Am.Chem. Soc., 2002, 124, pp. 15182–15183
51 Sun, Y.G., and Xia, Y.N.: ‘Shape-controlled synthesis of gold andsilver nanoparticles’, Science, 2002, 298, pp. 2176–2179
52 Hao, E., Bailey, R.C., Schatz, G.C., Hupp, J.T., and Li, S.Y.:‘Synthesis and optical properties of ‘‘branched’’ gold nanocrystals’,Nano Lett., 2004, 4, pp. 327–330
53 Yun, M.H., Myung, N.V., Vasquez, R.P., Lee, C.S., Menke, E., andPenner, R.M.: ‘Electrochemically grown wires for individuallyaddressable sensor arrays’, Nano Lett., 2004, 4, pp. 419–422
54 Walter, E.C., Zach, M.P., Favier, F., Murray, B.J., Inazu, K.,Hemminger, J.C., and Penner, R.M.: ‘Metal nanowire arrays byelectrodeposition’, Chemphyschem, 2003, 4, pp. 131–138
55 Penner, R.M.: ‘Special issue - Electrochemistry of nanosized systems- Preface’, J. Electroanal. Chem., 2002, 522, pp. 1–1
56 Kohli, P., Wirtz, M., and Martin, C.R.: ‘Nanotube membrane basedbiosensors’, Electroanalysis, 2004, 16, pp. 9–18
57 Martin, C.R., and Mitchell, D.T.: ‘Template-synthesized nanomater-ials in electrochemistry’, ‘Electroanalytical Chemistry’ (MarcelDekker, New York, 1999), Vol. 21, pp. 1–74
58 McFarland, A.D.: ‘Using Nanoparticle Optics for UltrasensitiveChemical Detection and Surface-Enhanced Spectroscopy’, ‘Chem-istry’ (IL Northwestern University, Evanston, 2004), p. 256
59 Cao, Y.W., Jin, R., andMirkin, C.A.: ‘DNAmodified core-shell Ag/Au nanoparticles’, J. Am. Chem. Soc., 2001, 123, pp. 7961–7962
60 Schierhorn, M., and Liz-Marzan, L.M.: ‘Synthesis of bimetalliccolloids with tailored intermetallic separation’, Nano Lett., 2002, 2,pp. 13–16
61 Ung, T., Liz-Marzan, L.M., and Mulvaney, P.: ‘Controlled methodfor silica coating of silver colloids. Influence of coating on the rate ofchemical reactions’, Langmuir, 1998, 14, pp. 3740–3748
62 Alejandro-Arellano, M., Ung, T., Blanco, A., Mulvaney, P., and Liz-Marzan, L.M.: ‘Silica-coated metals and semiconductors. Stabiliza-tion and nanostructuring’, Pure Appl. Chem., 2000, 72, pp. 257–267
63 Ung, T., Liz-Marzan, L.M., andMulvaney, P.: ‘Optical properties ofthin films of Au@SiO2 particles’, J. Phys. Chem. B, 2001, 105,pp. 3441–3452
64 Yin, Y.D., Lu, Y., Sun, Y.G., and Xia, Y.N.: ‘Silver nanowires canbe directly coated with amorphous silica to generate well-controlledcoaxial nanocables of silver/silica’, Nano Lett., 2002, 2, pp. 427–430
65 Westcott, S.L., Oldenburg, S.J., Lee, T.R., and Halas, N.J.:‘Construction of simple gold nanoparticle aggregates with controlledplasmon-plasmon interactions’, Chem. Phys. Lett., 1999, 300, pp.651–655
66 Jackson, J.B., and Halas, N.J.: ‘Silver nanoshells: Variations inmorphologies and optical properties’, J. Phys. Chem. B, 2001, 105,pp. 2743–2746
67 Kobayashi, Y., Salgueirino-Maceira, V., and Liz-Marzan, L.M.:‘Deposition of sliver nanoparticles on silica spheres by pretreatmentsteps in electroless plating’, Chem. Mater., 2001, 13, pp. 1630–1633
68 Averitt, R.D., Sarkar, D., and Halas, N.J.: ‘Plasmon resonance shiftsof Au-coated Au2S nanoshells: Insight into multicomponentnanoparticle growth’, Phys. Rev. Lett., 1997, 78, pp. 4217–4220
69 West, J.L., Halas, N., and Sershen, S.R.: ‘Optically-responsivenanoshell composites’, Abs. Papers Am. Chem. Soc., 2003, 225,pp. U522–U522
70 Gunnarsson, L., Bjerneld, E.J., Xu, H., Petronis, S., Kasemo, B., andKall, M.: ‘Interparticle Coupling Effects in Nanofabricated Sub-strates for Surface-Enhanced Raman Scattering’, Appl. Phys. Lett.,2001, 78, pp. 802–804
71 Jensen, T.R., Schatz, G.C., and Van Duyne, R.P.: ‘NanosphereLithography: Surface plasmon resonance spectrum of a periodicarray of silver nanoparticles by UV-vis extinction spectroscopyand electrodynamic modeling’, J. Phys. Chem. B, 1999, 103,pp. 2394–2401
72 Felidj, N., Aubard, J., Levi, G., Krenn, J.R., Salerno, M., Schider,G., Lamprecht, B., Leitner, A., and Aussenegg, F.R.: ‘Controllingthe optical response of regular arrays of gold particles for surface-enhanced Raman scattering’, Phys. Rev. B Condens. Matter Mater.Phys., 2002, 65, pp. 075419/1–075419/9
73 Hulteen, J.C., and Van Duyne, R.P.: ‘Nanosphere Lithography: AMaterials General Fabrication Process for Periodic Particle ArraySurfaces’, J. Vac. Sci. Technol. A, Vac. Surf. Films, 1995, 13,pp. 1553–1558
74 Dimitrov, A.S., and Nagayama, K.: ‘Continuous convectiveassembling of fine particles into two-dimensional arrays on solidsurfaces’, Langmuir, 1996, 12, pp. 1303–1311
75 Dimitrov, A.S., Miwa, T., and Nagayama, K.: ‘A comparisonbetween the optical properties of amorphous and crystallinemonolayers of silica particles’, Langmuir, 1999, 15, pp. 5257–5264
76 Taton, T.A., Lu, G., and Mirkin, C.A.: ‘Two-Color Labeling ofOligonucleotide Arrays via Size-Selective Scattering of NanoparticleProbes’, J. Am. Chem. Soc., 2001, 123, pp. 5164–5165
77 Taton, T.A., Mirkin, C.A., and Letsinger, R.L.: ‘Scanometric DNAarray detection with nanoparticle probes’, Science, 2000, 289, pp.1757–1760
78 Sonnichsen, C., Geier, S., Hecker, N.E., von Plessen, G., Feldmann,J., Ditlbacher, H., Lamprecht, B., Krenn, J.R., Aussenegg, F.R.,Chan, V.Z.-H., Spatz, J.P., and Moller, M.: ‘Spectroscopy of singlemetallic nanoparticles using total internal reflection microscopy’,Appl. Phys. Lett., 2000, 77, pp. 2949–2951
79 Sonnichsen, C., Franzl, T., Wilk, T., von Plessen, G., Feldmann, J.,Wilson, O., and Mulvaney, P.: ‘Drastic reduction of plasmondamping in gold nanorods’, Phys. Rev. Lett., 2002, 88, pp. 0774021–0774024
80 Bao, P., Frutos, A.G., Greef, C., Lahiri, J., Muller, U., Peterson,T.C., Wardern, L., and Xie, X.: ‘High-sensitivity detection of DNAhybridization on microarrays using resonance light scattering’, Anal.Chem., 2002, 74, pp. 1792–1797
81 McFarland, A.D., and VanDuyne, R.P.: ‘Single Silver Nanoparticlesas Real-Time Optical Sensors with Zeptomole Sensitivity’, NanoLett., 2003, 3, pp. 1057–1062
82 Van Duyne, R.P., Haes, A.J., and McFarland, A.D.: ‘NanoparticleOptics: Sensing with Nanoparticle Arrays and Single Nanoparticles’,Proc. SPIE-Int. Soc. Opt. Eng., 2003, 5223, pp. 197–207
83 Connolly, S., Cobbe, S., and Fitzmaurice, D.: ‘Effects of ligand-receptor geometry and stoichiometry on protein-induced aggregationof biotin-modified colloidal gold’, J. Phys. Chem. B, 2001, 105, pp.2222–2226
84 Malinsky, M.D., Kelly, K.L., Schatz, G.C., and Van Duyne, R.P.:‘Chain Length Dependence and Sensing Capabilities of the LocalizedSurface Plasmon Resonance of Silver Nanoparticles ChemicallyModified with Alkanethiol Self-Assembled Monolayers’, J. Am.Chem. Soc., 2001, 123, pp. 1471–1482
85 Hilger, A., Cuppers, N., Tenfelde, M., and Kreibig, U.: ‘Surfaceand interface effects in the optical properties of silver nanoparticles’,Eur. Phys. J. D, 2000, 10, pp. 115–118
86 Henglein, A., and Meisel, D.: ‘Spectrophotometric Observations ofthe Adsorption of Organosulfur Compounds on Colloidal SilverNanoparticles’, J. Phys. Chem. B, 1998, 102, pp. 8364–8366
87 Linnert, T., Mulvaney, P., and Henglein, A.: ‘Surface chemistry ofcolloidal silver: surface plasmon damping by chemisorbed iodide,hydrosulfide (SH-), and phenylthiolate’, J. Phys. Chem., 1993, 97,pp. 679–682
88 Kreibig, U., Gartz, M., and Hilger, A.: ‘Mie resonances. Sensors forphysical and chemical cluster interface properties’, Ber. Bunsen-Ges.,1997, 101, pp. 1593–1604
89 Nath, N., and Chilkoti, A.: ‘A colorimetric gold nanoparticle sensorto interrogate biomolecular interactions in real time on a surface’,Anal. Chem., 2002, 74, pp. 504–509
90 Eck, D., Helm, C.A., Wagner, N.J., and Vaynberg, K.A.: ‘PlasmonResonance Measurements of the Adsorption and AdsorptionKinetics of a Biopolymer onto Gold Nanocolloids’, Langmuir,2001, 17, pp. 957–960
91 Okamoto, T., Yamaguchi, I., and Kobayashi, T.: ‘Local plasmonsensor with gold colloid monolayers deposited upon glass substrates’,Opt. Lett., 2000, 25, pp. 372–374
92 Himmelhaus, M., and Takei, H.: ‘Cap-shaped gold nanoparticlesfor an optical biosensor’, Sens. Actuators B, Chem., 2000, B63,pp. 24–30
28 IEE Proc.-Nanobiotechnol., Vol. 152, No. 1, February 2005

93 Takei, H.: ‘Biological sensor based on localized surfaceplasmon associated with surface-bound Au/polystyrene compositemicroparticles’, Proc. SPIE-Int. Soc. Opt. Eng., 1998, 3515, pp.278–283
94 Singer, J.M., and Plotz, C.M.: ‘The latex fixation test. I. Applicationto the serologic diagnosis of rheumatoid arthritis’, Am. J. Med., 1956,21, pp. 888–896
95 Elghanian, R., Storhoff, J.J., Mucic, R.C., Letsinger, R.L., andMirkin, C.A.: ‘Selective colorimetric detection of polynucleotidesbased on the distance-dependent optical properties of goldnanoparticles’, Science, 1997, 227, pp. 1078–1080
96 Mirkin, C.A., Letsinger, R.L., Mucic, R.C., and Storhoff, J.J.:‘A DNA-based method for rationally assembling nanoparticles intomacroscopic materials’, Nature, 1996, 382, pp. 607–609
97 Mock, J.J., Smith, D.R., and Schultz, S.: ‘Local Refractive IndexDependence of Plasmon Resonance Spectra from IndividualNanoparticles’, Nano Lett., 2003, 3, pp. 485–491
98 Mock, J.J., Oldenburg, S.J., Smith, D.R., Schultz, D.A., and Schultz,S.: ‘Composite Plasmon Resonant Nanowires’, Nano Lett., 2002, 2,pp. 465–469
99 Stuart, D.A., Haes, A.J., McFarland, A.D., Nie, S. and Van Duyne,R.P. ‘Refractive index sensitive, plasmon resonant scattering, andsurface enhanced Raman scattering nanoparticles and arrays asbiological sensing platforms,’ Proc. SPIE, Int. Soc. Opt. Eng., 5327,2004, pp. 60–73
100 Nicewarner-Pena, S.R., Griffith Freeman, R., Reiss, B.D., He, L.,Pena, D.J., Walton, I.D., Cromer, R., Keating, C.D., and Natan,M.J.: ‘Submicrometer metallic barcodes’, Science, 2001, 294, pp.137–141
101 Siiman, O., and Burshteyn, A.: ‘Preparation, Microscopy, and FlowCytometry with Excitation into Surface Plasmon Resonance Bandsof Gold or Silver Nanoparticles on Aminodextran-Coated Polystyr-ene Beads’, J. Phys. Chem. B, 2000, 104, pp. 9795–9810
102 Turner, A.P.F.: ‘BiosensorsFSense and Sensitivity’, Science, 2000,290, pp. 1315–1317
103 Klotz, I.M.: ‘Ligand-Receptor Energetics: A Guide for thePerplexed’, (Wiley, New York, N.Y., 1997)
104 Lee, H.J., Goodrich, T.T., and Corn, R.M.: ‘SPR imagingmeasurements of 1-D and 2-D DNA microarrays created frommicrofluidic channels on gold thin films’, Anal. Chem., 2001, 73,pp. 5525–5531
105 Hall, D.: ‘Use of optical biosensors for the study of mechanisticallyconcerted surface adsorption processes’, Anal. Biochem., 2001, 288,pp. 109–125
106 Wang, J., Cai, X., Rivas, G., Shiraishi, H., Farias, P.A.M., andDontha, N.: ‘DNA Electrochemical Biosensor for the Detection ofShort DNA Sequences Related to the Human ImmunodeficiencyVirus’, Anal. Chem., 1996, 68, pp. 2629–2634
107 Walterbeek, H.T., and van der Meer, A.J.G.M.: ‘A sensitive andquantitative biosensing method for the determination of g-rayemitting radionuclides in surface water’, J. Environ. Radioact.,1996, 33, pp. 237–254
108 Thevenot, D.R., Toth, K., Durst, R.A., and Wilson, G.S.:‘Electrochemical biosensors: recommended definitions and classifica-tion’, Biosens. Bioelectron., 2001, 16, pp. 121–131
109 Mascini, M., Palchetti, I., and Marrazza, G.: ‘DNA electrochemicalbiosensors’, Fresenius J. Anal. Chem., 2001, 369, pp. 15–22
110 Horacek, J., and Skladal, P.: ‘Improved direct piezoelectricbiosensors operating in liquid solution for the competitive label-freeimmunoassay of 2,4-dichlorophenoxyacetic acid’, Anal. Chim. Acta,1997, 347, pp. 43–50
111 Ebersole, R.C., Miller, J.A., Moran, J.R., and Ward, M.D.:‘Spontaneously formed functionally active avidin monolayers onmetal surfaces: a strategy for immobilizing biological reagents anddesign of piezoelectric biosensors’, J. Am. Chem. Soc., 1990, 112, pp.3239–3241
112 Miller, M.M., Sheehan, P.E., Edelstein, R.L., Tamanaha, C.R.,Zhong, L., Bounnak, S., Whitman, L.J., and Colton, R.J.: ‘A DNAarray sensor utilizing magnetic microbeads and magnetoelectronicdetection’, J. Magn. Magn. Mater., 2001, 225, pp. 156–160
113 Chemla, Y.R., Grossman, H.L., Poon, Y., McDermott, R., Stevens,R., Alper, M.D., and Clarke, J.: ‘Ultrasensitive magnetic biosensorfor homogeneous immunoassay’, Proc. Natl. Acad. Sci. USA, 2000,97, p. 26
114 Raiteri, R., Grattarola, M., Butt, H.-J., and Skladal, P.: ‘Micro-mechanical cantilever-based biosensors’, Sens. Actuators B, Chem.,2001, 79, pp. 115–126
115 Kasemo, B.: ‘Biological surface science’, Curr. Opin. Solid StateMater. Sci., 1998, 3, pp. 451–459
116 Natsume, T., Nakayama, H., and Isobe, T.: ‘BIA-MS-MS:biomolecular interaction analysis for functional proteomics’, TrendsBiotechnol., 2001, 19, pp. S28–S33
117 Polla, D.L., Erdman, A.G., Robbins, W.P., Markus, D.T., Diaz-Diaz, J., Rizq, R., Nam, Y., Brickner, H.T., Wang, A., andKrulevitch, P.: ‘Microdevices in medicine’, Annu. Rev. Biomed. Eng.,2000, 2, pp. 551–576
118 Liedberg, B., Nylander, C., and Lundstroem, I.: ‘Surface plasmonresonance for gas detection and biosensing’, Sens. Actuators, 1983, 4,pp. 299–304
119 Reather, H.: ‘Surface Polaritons on Smooth and Rough Surfaces andon Gratings’ (Springer-Verlag, Berlin, 1988)
120 Jung, L.S., Campbell, C.T., Chinowsky, T.M., Mar, M.N., and Yee,S.S.: ‘Quantitative Interpretation of the Response of Surface Plasmon
Resonance Sensors to Adsorbed Films’, Langmuir, 1998, 14, pp.5636–5648
121 Jung, L.S., and Campbell, C.T.: ‘Sticking Probabilities in Adsorptionof Alkanethiols from Liquid Ethanol Solution onto Gold’, J. Phys.Chem. B, 2000, 104, pp. 11168–11178
122 Jung, L.S., and Campbell, C.T.: ‘Sticking Probabilities in Adsorptionfrom Liquid Solutions: Alkylthiols on Gold’, Phys. Rev. Lett., 2000,84, pp. 5164–5167
123 Jung, L.S., Nelson, K.E., Stayton, P.S., and Campbell, C.T.: ‘Bindingand Dissociation Kinetics ofWild-Type andMutant Streptavidins onMixed Biotin-Containing Alkylthiolate Monolayers’, Langmuir,2000, 16, pp. 9421–9432
124 Perez-Luna, V.H., O’Brien, M.J., Opperman, K.A., Hampton, P.D.,Lopez, G.P., Klumb, L. A., and Stayton, P.S.: ‘MolecularRecognition between Genetically Engineered Streptavidin andSurface-Bound Biotin’, J. Am. Chem. Soc., 1999, 121, pp. 6469–6478
125 Mann, D.A., Kanai, M., Maly, D.J., and Kiessling, L.L.: ‘ProbingLow Affinity and Multivalent Interactions with Surface PlasmonResonance: Ligands for Concanavalin A’, J. Am. Chem. Soc., 1998,120, pp. 10575–10582
126 Hendrix, M., Priestley, E.S., Joyce, G.F., and Wong, C.-H.: ‘DirectObservation of Aminoglycoside-RNA Interactions by SurfacePlasmon Resonance’, J. Am. Chem. Soc., 1997, 119, pp. 3641–3648
127 Frey, B.L., Jordan, C.E., Kornguth, S., and Corn, R.M.: ‘Control ofthe Specific Adsorption of Proteins onto Gold Surfaces with Poly(L-lysine) Monolayers’, Anal. Chem., 1995, 67, pp. 4482–4457
128 Mrksick, M., Grunwell, J.R., and Whitesides, G.M.: ‘BiospecificAdsorption of Carbonic Anhydrase to Self-Assembled Monolayersof Alkanethiolates That Present Benzenesulfonamide Groups onGold’, J. Am. Chem. Soc., 1995, 117, pp. 12009–12010
129 Rao, J., Yan, L., Xu, B., and Whitesides, G.M.: ‘Using surfaceplasmon resonance to study the binding of vancomycin and its dimerto self-assembled monolayers presenting D-Ala-D-Ala’, J. Am.Chem. Soc., 1999, 121, pp. 2629–2630
130 Berger, C.E.H., Beumer, T.A.M., Kooyman, R.P.H., and Greve, J.:‘Surface Plasmon Resonance Multisensing’, Anal. Chem., 1998, 70,pp. 703–706
131 Heaton, R.J., Peterson, A.W., and Georgiadis, R.M.: ‘Electrostaticsurface plasmon resonance: direct electric field-induced hybridizationand denaturation in monolayer nucleic acid films and label-freediscrimination of base mismatches’, Proc. Natl. Acad. Sci. USA,2001, 98, pp. 3701–3704
132 Georgiadis, R., Peterlinz, K.P., and Peterson, A.W.: ‘QuantitativeMeasurements and Modeling of Kinetics in Nucleic Acid MonolayerFilms Using SPR Spectroscopy’, J. Am. Chem. Soc., 2000, 122, pp.7837–3173
133 Jordan, C.E., Frutos, A.G., Thiel, A.J., and Corn, R.M.: ‘Surfaceplasmon resonance imaging measurements of DNA hybridizationadsorption and streptavidin/DNAmultilayer formation at chemicallymodified gold surfaces’, Anal. Chem., 1997, 69, pp. 4939–4947
134 Nelson, B.P., Grimsrud, T.E., Liles, M.R., and Goodman, R.M.:‘Surface Plasmon Resonance Imaging Measurements of DNA andRNA Hybridization Adsorption onto DNA Microarrays’, Anal.Chem., 2001, 73, pp. 1–7
135 Brockman, J.M., Frutos, A.G., and Corn, R.M.: ‘A MultistepChemical Modification Procedure To Create DNA Arrays on GoldSurfaces for the Study of Protein-DNA Interactions with SurfacePlasmon Resonance Imaging’, J. Am. Chem. Soc., 1999, 121,pp. 8044–8051
136 Haake, H.-M., Schutz, A., and Gauglitz, G.: ‘Label-free detection ofbiomolecular interaction by optical sensors’, Fresenius J. Anal.Chem., 2000, 366, pp. 576–585
137 Brockman, J.M., Nelson, B.P., and Corn, R.M.: ‘Surface PlasmonResonance Imaging Measurements of Ultrathin Organic Films’,Annu. Rev. Phys. Chem., 2000, 51, pp. 41–63
138 Shumaker-Parry, J.S., Zareie, M.H., Aebersold, R., and Campbell,C.T.: ‘Microspotting Streptavidin and Double-Stranded DNAArrays on Gold for High-Throughput Studies of Protein-DNAInteractions by Surface Plasmon Resonance Microscopy’, Anal.Chem., 2004, 76, pp. 918–929
139 Schuck, P.: ‘Use of Surface Plasmon Resonance to Probe theEquilibrium and Dynamic Aspects of Interactions between BilogicalMacromolecules’, Ann. Rev. Biophys. Biomol. Struct., 1997, 26, pp.541–566
140 Garland, P.B.: ‘Optical evanescent wave methods for the study ofbiomolecular interactions’, Q. Rev. Biophys., 1996, 29, pp. 91–117
141 Knoll, W.: ‘Interfaces and thin films as seen by bound electro-magnetic waves’, Annu. Rev. Phys. Chem., 1998, 49, pp. 569–638
142 Shumaker-Parry, J.S., and Campbell, C.T.: ‘Quantitative Methodsfor Spatially Resolved Adsorption/Desorption Measurements inReal Time by Surface Plasmon Resonance Microscopy’, Anal.Chem., 2004, 76, pp. 907–917
143 Karlsson, R., and Stahlberg, R.: ‘Surface Plasmon Resonancedetection and multispot sensing for direct monitoring of interactionsinvolving low-molecular weight analytes and for determination oflow affinities’, Anal. Biochem., 1995, 228, pp. 274–280
144 Sjolander, S., and Urbaniczky, C.: ‘Integrated fluid handling-systemfor biomolecular interaction analysis’, Anal. Chem., 1991, 63,pp. 2338–2345
145 Yonzon, C.R., Zou, S., Jeoung, E., Schatz, G.C., Mrksich, M., VanDuyne, R.P. ‘A Comparative Analysis of Localized and PropagatingSurface Plasmon Resonance Sensors: The Binding of Concanavalin
IEE Proc.-Nanobiotechnol., Vol. 152, No. 1, February 2005 29

A to a Monosaccharide Functionalized Self-Assembled Monolayer,’J. Am. Chem. Soc., 2004, 126, pp. 12667–12676
146 Hardman, K.D., and Ainsworth, C.F.: ‘Structure of concanavalin Aat 2.4-Ang resolution’, Biochemistry, 1972, 11, pp. 4910–4919
147 Smith, E.A., Thomas, W.D., Kiessling, L.L., and Corn, R.M.:‘Surface Plasmon Resonance Imaging Studies of Protein-Carbohy-drate Interactions’, J. Am. Chem. Soc., 2003, 125, pp. 6140–6148
148 Lee, Y., Martin, C.D., Parise, J.B., Hriljac, J.A., and Vogt, T.:‘Formation and manipulation of confined water wires’, Nano Lett.,2004, 4, pp. 619–621
149 Alzheimer, A., Stelzmann, R.A., Schnitzlein, H.N., and Murtagh,F.R.: ‘An English translation of Alzheimer’s 1907 paper, ‘‘Uber eineeigenartige Erkankung der Hirnrinde’’’, Clin Anat, 1995, 8, pp.429–31
150 Hardy, J.A., and Higgins, G.A.: ‘Alzheimer’s disease: the amyloidcascade hypothesis’, Science, 1992, 256, pp. 184–185
151 Klein, W.L., Krafft, G.A., and Finch, C.E.: ‘Targeting small A betaoligomers: the solution to an Alzheimer’s disease conundrum?’,Trends Neurosci., 2001, 24, pp. 219–224
152 Lorenzo, A., and Yankner, B.A.: ‘Beta-amyloid neurotoxicityrequires fibril formation and is inhibited by congo red’, Proc. Natl.Acad. Sci. USA, 1994, 91, pp. 12243–12247
153 Lambert, M.P., Barlow, A.K., Chromy, B.A., Edwards, C., Freed,R., Liosatos, M., Morgan, T.E., Rozovsky, I., Trommer, B., Viola,K.L., Wals, P., Zhang, C., Finch, C.E., Krafft, G.A., and Klein,W.L.: ‘Diffusible, nonfibrillar ligands derived from A beta(1-42) arepotent central nervous system neurotoxins’, Proc. Natl. Acad. Sci.USA, 1998, 95, pp. 6448–6453
154 Gong, Y., Chang, L., Viola, K.L., Lacor, P.N., Lambert, M.P.,Finch, C.E., Krafft, G.A., and Klein, W.L.: ‘Alzheimer’s disease-affected brain: Presence of oligomeric Ab ligands (ADDLs) suggestsa molecular basis for reversible memory loss’, Proc. Natl. Acad. Sci.USA, 2003, 100, pp. 10417–10422
155 Haes, A.J., Chang, L., Klein, W.L., Van Duyne, R.P., and Hall,W.P.: ‘First Steps Toward an Alzheimer’s Disease Assay usingLocalized Surface Plasmon Resonance Spectroscopy’, NorthwesternUniversity Invention Disclosure, 2004, 24017
156 Haes, A.J., Hall, W.P., Chang, L., Klein, W.L., and Van Duyne,R.P.: ‘A localized surface plasmon resonance biosensor: First stepstoward an assay for Alzheimer’s disease’, Nano Lett., 2004, 4, pp.1029–1034
157 Klar, T., Perner, M., Grosse, S., von Plessen, G., Spirkl, W., andFeldmann, J.: ‘Surface-Plasmon Resonances in Single MetallicNanoparticles’, Phys. Rev. Lett., 1998, 80, pp. 4249–4252
158 Raschke, G., Kowarik, S., Franzl, T., Sonnichsen, C., Klar, T.A.,and Feldmann, J.: ‘Biomolecular Recognition Based on SingleGold Nanoparticle Light Scattering’, Nano Lett., 2003, 3, pp.935–938
159 Malinsky, M.D., Kelly, K.L., Schatz, G.C., and Van Duyne, R.P.:‘Nanosphere Lithography: Effect of Substrate on the LocalizedSurface Plasmon Resonance Spectrum of Silver Nanoparticles’,J. Phys. Chem. B, 2001, 105, pp. 2343–2350
160 Draine, B.T., and Flatau, P.J.: ‘Discrete-dipole approximation forscattering calculations’, J. Opt. Soc. Am. A, Opt Image Sci. Vis.,1994, 11, pp. 1491–1499
161 Kelly, K.L., Coronado, E., Zhao, L., and Schatz, G.C.: ‘TheOptical Properties of Metal Nanoparticles: The Influence of Size,Shape, and Dielectric Environment’, J. Phys. Chem. B, 2003, 107,pp. 668–677
162 Lynch, D.W., and Hunter, W.R.: in Palik, E.D. (ed.): ‘Handbook ofOptical Constants of Solids’ (Academic Press, New York, 1985), pp.350–356
163 Jensen, T.R., Kelly, K.L., Lazarides, A., and Schatz, G.C.:‘Electrodynamics of noble metal nanoparticles and nanoparticleclusters’, J. Cluster Sci., 1999, 10, pp. 295–317
164 Raman, C.V., and Krishnan, K.S.: Nature, 1928, 121, p. 501165 McCreery, R.L.: ‘Raman Spectroscopy for Chemical Analysis’, 1st
Edn. (John Wiley & Sons, Inc., New York, , 2000), Vol. 157166 Cotton, T.M., Kim, J.H., and Chumanov, G.D.: ‘Application
of Surface-Enhanced Raman-Spectroscopy to Biological-Systems’,J. Raman Spectrosc., 1991, 22, pp. 729–742
167 Nabiev, I., Chourpa, I., and Manfait, M.: ‘Applications of Ramanand Surface-Enhanced Raman-Scattering Spectroscopy inMedicine’,J. Raman Spectrosc., 1994, 25, pp. 13–23
168 Petry, R., Schmitt, M., and Popp, J.: ‘Raman Spectroscopy -A prospective tool in the life sciences’, Chemphyschem, 2003, 4, pp.14–30
169 Campion, A., and Kambhampati, P.: ‘Surface-enhanced Ramanscattering’, , 1998, 27, pp. 241–250
170 Otto, A.: ‘Surface-Enhanced Raman-Scattering of Adsorbates’, 1991,22, pp. 743–752
171 Jeanmaire, D.L., and Van Duyne, R.P.: ‘Surface Raman spectro-electrochemistry. Part I. Heterocyclic, aromatic, and aliphatic aminesadsorbed on the anodized silver electrode’, J. Electroanal. Chem.Interfacial Electrochem., 1977, 84, pp. 1–20
172 Campion, A., and Kambhampati, P.: ‘Surface-enhanced Ramanscattering’, Chem. Soc. Rev., 1998, 27, pp. 241–250
173 Otto, A., Bruckbauer, A., and Chen, Y.X.: ‘On the chlorideactivation in SERS and single molecule SERS’, J. Mol. Struct.,2003, 661, pp. 501–514
174 Hildebrandt, P., and Stockburger, M.: ‘Surface-Enhanced ResonanceRaman-Spectroscopy of Rhodamine-6g Adsorbed on ColloidalSilver’, J. Phys. Chem., 1984, 88, pp. 5935–5944
175 Doering, W.E., and Nie, S.M.: ‘Single-molecule and single-nanopar-ticle SERS: Examining the roles of surface active sites and chemicalenhancement’, J. Phys. Chem. B, 2002, 106, pp. 311–317
176 Otto, A.: ‘On the electronic contribution to single molecule surfaceenhanced Raman spectroscopy’, Indian J. Phys. B, 2003, 77B, pp.63–73
177 Nie, S.M., and Emory, S.R.: ‘Probing single molecules and singlenanoparticles by surface-enhanced Raman scattering’, Science, 1997,275, pp. 1102–1106
178 Kneipp, K., Wang, Y., Kneipp, H., Perelman, L.T., Itzkan, I.,Dasari, R., and Feld, M.S.: ‘Single molecule detection using surface-enhanced Raman scattering (SERS)’, Phys. Rev. Lett., 1997, 78,pp. 1667–1670
179 Moskovits, M.: ‘Enhanced Raman-Scattering by MoleculesAdsorbed on Electrodes - Theoretical-Model’, Solid State Commun.,1979, 32, pp. 59–62
180 Kennedy, B.J., Spaeth, S., Dickey, M., and Carron, K.T.:‘Determination of the Distance Dependence and ExperimentalEffects for Modified SERS Substrates Based on Self-AssembledMonolayers Formed Using Alkanethiols’, J. Phys. Chem. B, 1999,103, pp. 3640–3646
181 Ye, Q., Fang, J.X., and Sun, L.: ‘Surface-enhanced Raman scatteringfrom functionalized self-assembled monolayers .2. Distance depen-dence of enhanced Raman scattering from an azobenzene terminalgroup’, 1997, 101, pp. 8221–8224
182 Tsen, M., and Sun, L.: ‘Surface-Enhanced Raman-Scattering fromFunctionalized Self-Assembled Monolayers .1. Distance Dependenceof Enhanced Raman-Scattering from a Terminal Phenyl Group’, ,1995, 307, pp. 333–340
183 Keating, C.D., Kovaleski, K.M., and Natan, M.J.: ‘Protein : colloidconjugates for surface enhanced Raman scattering: Stability andcontrol of protein orientation’, J. Phys. Chem. B, 1998, 102,pp. 9404–9413
184 Keating, C.D., Kovaleski, K.K., and Natan, M.J.: ‘Heightenedelectromagnetic fields between metal nanoparticles: Surface enhancedRaman scattering from metal-cytochrome c-metal sandwiches’,J. Phys. Chem. B, 1998, 102, pp. 9414–9425
185 Billman, J., and Otto, A.: ‘Charge-Transfer between AdsorbedCyanide and Silver Probed by SERS’, Surf. Sci., 1984, 138, pp. 1–25
186 Farquharson, S., Gift, A.D., Maksymiuk, P., and Inscore, F.E.:‘Rapid dipicolinic acid extraction from bacillus spores detected bysurface-enhanced Raman spectroscopy’, Appl. Spectrosc., 2004, 58,pp. 351–354
187 Zhang, X., Yonzon, C.R., and VanDuyne, R.P.: ‘An electrochemicalsurface-enhanced Raman spectroscopy approach to anthrax detec-tion’, Proc. SPIE- Int. Soc. Opt. Eng., 2003, 5221, pp. 82–91
188 Mulvaney, S.P., and Keating, C.D.: ‘Raman spectroscopy’, Anal.Chem., 2000, 72, pp. 145R–157R
189 Schrader, B., Dippel, B., Erb, I., Keller, S., Lochte, T., Schulz, H.,Tatsch, E., and Wessel, S.: ‘NIR Raman spectroscopy in medicineand biology: results and aspects’, J. Mol. Struct., 1999, 481, pp. 21–32
190 Carey, P.R.: ‘Raman spectroscopy, the sleeping giant in structuralbiology, awakes’, J. Biol. Chem., 1999, 274, pp. 26625–26628
191 Lyon, L.A., Keating, C.D., Fox, A.P., Baker, B.E., He, L.,Nicewarner, S.R., Mulvaney, S.P., and Natan, M.J.: ‘Ramanspectroscopy’, Anal. Chem., 1998, 70, pp. 341R–361R
192 Kneipp, K., Kneipp, H., Itzkan, I., Dasari, R.R., and Feld, M.S.:‘Surface-enhanced Raman scattering: A new tool for biomedicalspectroscopy’, Curr. Sci., 1999, 77, pp. 915–924
193 Sokolov, K., Aaron, J., Hsu, B., Nida, D., Gillenwater, A., Follen,M., MacAulay, C., Adler-Storthz, K., Korgel, B., Descour, M.,Pasqualini, R., Arap, W., Lam, W., and Richards-Kortum, R.:‘Optical systems for in vivo molecular imaging of cancer’, Technol.Cancer Research Treatment, 2003, 2, pp. 491–504
194 Carey, P.R.: ‘Raman spectroscopy in enzymology: the first 25 years’,J. Raman Spectrosc., 1998, 29, pp. 7–14
195 Ooka, A.A., and Garrell, R.L.: ‘Surface-enhanced Raman spectro-scopy of DOPA-containing peptides related to adhesive protein ofmarine mussel, Mytilus edulis’, Biopolymers, 2000, 57, pp. 92–102
196 Picorel, R., Chumanov, G., Cotton, T.M., Montoya, G., Toon, S.,and Seibert, M.: ‘Surface-Enhanced Resonance Raman-ScatteringSpectroscopy of Photosystem-Ii Pigment-Protein Complexes’,J. Phys. Chem., 1994, 98, pp. 6017–6022
197 Rivas, L., Murza, A., Sanchez-Cortes, S., and Garcia-Ramos, J.V.:‘Adsorption of acridine drugs on silver: surface-enhanced resonanceRaman evidence of the existence of different adsorption sites’,Vib. Spectrosc., 2001, 25, pp. 19–28
198 Shen, H.B., Xia, J.F., Zhang, F., Yang, H.F., and Zhang, Z.R.:‘Surface enhanced Raman scattering (SERS) spectra of AMP andDNA in silver sol’, Spectrosc. Spectral Anal., 2001, 21, pp. 798–800
199 Stanicova, J., Kovalcik, P., Chinsky, L., and Miskovsky, P.: ‘Pre-resonance Raman and surface-enhanced Raman spectroscopy studyof the complex of the antiviral and antiParkinsonian drugamantadine with histidine’, Vib. Spectrosc., 2001, 25, pp. 41–51
200 Stewart, S., and Fredericks, P.M.: ‘Surface-enhanced Ramanspectroscopy of peptides and proteins adsorbed on an electrochemi-cally prepared silver surface’, Spectrochim. Acta A, Mol. Biomol.Spectrosc., 1999, 55, pp. 1615–1640
201 Storey, J., Barber, T., Shelton, B., Wachter, E., Carron, K., andJiang, Y.: ‘Applications of Surface-Enhanced Raman-Scattering(Sers) to Chemical-Detection’, Spectroscopy, 1995, 10, pp. 20–25
202 Wang, L.Y., Ji, X.H., Yuan, H., Ma, L., Kong, X.G., Liu, Y.C.,Yang, W.S., Bai, Y.B., and Li, T.J.: ‘Surface-enhanced Raman
30 IEE Proc.-Nanobiotechnol., Vol. 152, No. 1, February 2005

spectroscopic study on the interaction of hepatitis B virus surfaceantigen and its monoclonal antibody’, Acta Chim. Sin., 2002, 60,pp. 2115–2119
203 Wachter, E.A., Storey, J.M.E., Sharp, S.L., Carron, K.T., and Jiang,Y.: ‘Hybrid Substrates for Real-Time SERS-Based ChemicalSensors’, Appl. Spectrosc., 1995, 49, pp. 193–199
204 Xu, Y.M., and Liang, L.: ‘Surface-Enhanced Resonance Raman-Scattering of R-Phycoerythrin Adsorbed by Silver Hydrosols’, Appl.Spectrosc., 1994, 48, pp. 1147–1149
205 Ye, B.X., Lin, L., Zhang, W.M., and Zhou, X.Y.: ‘A study ofhemoglobin at silver colloid By surface enhanced Raman spectro-scopy’, Chem. J. Chin. Univ.-Chin., 1998, 19, pp. 1239–1241
206 Zeiri, L., Bronk, B.V., Shabtai, Y., Eichler, J., and Efrima, S.:‘Surface-enhanced Raman Spectroscopy as a tool for probing specificbiochemical components in bacteria’, Appl. Spectrosc., 2004, 58,pp. 33–40
207 Dou, X.M., and Ozaki, Y.: ‘Surface-enhanced Raman scattering ofbiological molecules on metal colloids: Basic studies and applicationsto quantitative assay’, Rev. Anal. Chem., 1999, 18, pp. 285–321
208 Maxwell, D.J., Emory, S.R., and Nie, S.M.: ‘Nanostructured thin-film materials with Surface-enhanced optical properties’, Chem.Mater., 2001, 13, pp. 1082–1088
209 Dick, L.A., McFarland, A.D., Haynes, C.L., and Van Duyne, R.P.:‘Metal film over nanosphere (MFON) electrodes for surface-enhanced Raman spectroscopy (SERS): Improvements in surfacenanostructure stability and suppression of irreversible loss’, J. Phys.Chem. B, 2002, 106, pp. 853–860
210 Kneipp, K., Haka, A.S., Kneipp, H., Badizadegan, K., Yoshizawa,N., Boone, C., Shafer-Peltier, K.E., Motz, J.T., Dasari, R.R., andFeld, M.S.: ‘Surface-enhanced Raman Spectroscopy in singleliving cells using gold nanoparticles’, Appl. Spectrosc., 2002, 56,pp. 150–154
211 Jarvis, R.M., and Goodacre, R.: ‘Discrimination of bacteria usingsurface-enhanced Raman spectroscopy’, Anal. Chem., 2004, 76,pp. 40–47
212 Ahern, A.M., and Garrell, R.L.: ‘Protein Metal Interactions inProtein-Colloid Conjugates Probed by Surface-Enhanced Raman-Spectroscopy’, Langmuir, 1991, 7, pp. 254–261
213 Grabbe, E.S., and Buck, R.P.: ‘Evidence for a ConformationalChange with Potential of Adsorbed Anti-Igg Alkaline-PhosphataseConjugate at the Silver Electrode Interface Using SERS’,J. Electroanal. Chem., 1991, 308, pp. 227–237
214 Dick, L.A., Haes, A.J., and Van Duyne, R.P.: ‘Distance andorientation dependence of Heterogeneous electron transfer: Asurface-enhanced resonance Raman scattering study of cytochromec bound to carboxylic acid terminated alkanethiols adsorbed on silverelectrodes’, J. Phys. Chem. B, 2000, 104, pp. 11752–11762
215 Fabriciova, G., Sanchez-Cortes, S., Garcia-Ramos, J.V., andMiskovsky, P.: ‘Surface-enhanced Raman spectroscopy study ofthe interaction of the antitumoral drug emodin with human serumalbumin’, Biopolymers, 2004, 74, pp. 125–130
216 Nabiev, I.R., Morjani, H., and Manfait, M.: ‘Selective Analysis ofAntitumor Drug-Interaction with Living Cancer-Cells as Probed bySurface-Enhanced Raman-Spectroscopy’, Eur. Biophys. J., 1991, 19,pp. 311–316
217 He, L., Natan, M.J., and Keating, C.D.: ‘Surface-enhanced Ramanscattering: A structure specific detection method for capillaryelectrophoresis’, Anal. Chem., 2000, 72, pp. 5348–5355
218 Carron, K.T., and Kennedy, B.J.: ‘Molecular-Specific Chromato-graphic Detector Using Modified SERS Substrates’, Anal. Chem.,1995, 67, pp. 3353–3356
219 Kennedy, B.J., Milofsky, R., and Carron, K.T.: ‘Developmentof a cascade flow cell for dynamic aqueous phase detectionusing modified SERS substrates’, Anal. Chem., 1997, 69, pp.4708–4715
220 Kneipp, K., Kneipp, H., Kartha, V.B., Manoharan, R., Deinum, G.,Itzkan, I., Dasari, R.R., and Feld, M.S.: ‘Detection and identificationof a single DNA base molecule using surface-enhanced Ramanscattering (SERS)’, Phys. Rev. E stat. Nonlinear Soft Matter Phys.,1998, 57, pp. R6281–R6284
221 Kneipp, K., Pohle, W., and Fabian, H.: ‘Surface Enhanced Raman-Spectroscopy on Nucleic-Acids and Related-Compounds Adsorbedon Colloidal Silver Particles’, J. Mol. Struct., 1991, 244, pp. 183–192
222 Kneipp, K., and Flemming, J.: ‘Surface Enhanced Raman-Scattering(SERs) of Nucleic-Acids Adsorbed on Colloidal Silver Particles’,J. Mol. Struct., 1986, 145, pp. 173–179
223 Keller, R.A., Ambrose, W.P., Arias, A.A., Gai, H., Emory, S.R.,Goodwin, P.M., and Jett, J.H.: ‘Analytical applications of single-molecule detection’, Anal. Chem., 2002, 74, pp. 316a–324a
224 Emory, S.R., and Keller, R.A.: ‘Towards efficient and identificationof single biomolecules by surface-enhanced Raman scattering’, Proc.SPIE-Int. Soc. Opt. Eng., 2000, 2922, p. 38
225 Xu, H.X., Bjerneld, E.J., Kall, M., and Borjesson, L.: ‘Spectroscopyof single hemoglobin molecules by surface enhanced Ramanscattering’, Phys. Rev. Lett., 1999, 83, pp. 4357–4360
226 Xu, H.X., Aizpurua, J., Kall, M., and Apell, P.: ‘Electromagneticcontributions to single-molecule sensitivity in surface-enhancedRaman scattering’, Phys. Rev. E, Stat. Nonlinear Soft Matter Phys.,2000, 62, pp. 4318–4324
227 Bjerneld, E.J., Foldes-Papp, Z., Kall, M., and Rigler, R.: ‘Single-molecule surface-enhanced Raman and fluorescence correlationspectroscopy of horseradish peroxidase’, J. Phys. Chem. B, 2002,106, pp. 1213–1218
228 Bizzarri, A.R., and Cannistraro, S.: ‘Surface-enhanced resonanceRaman spectroscopy signals from single myoglobin molecules’, Appl.Spectrosc., 2002, 56, pp. 1531–1537
229 Habuchi, S., Cotlet, M., Gronheid, R., Dirix, G., Michiels, J.,Vanderleyden, J., De Schryver, F.C., and Hofkens, J.: ‘Single-molecule surface enhanced resonance Raman spectroscopy of theenhanced green fluorescent protein’, J. Am. Chem. Soc., 2003, 125,pp. 8446–8447
230 Carey, P.R.: ‘Resonance Raman labels and Raman labels’, J. RamanSpectrosc., 1998, 29, pp. 861–868
231 Docherty, F.T., Clark, M., McNay, G., Graham, D., and Smith,W.E.: ‘Multiple labelled nanoparticles for bio detection’, FaradayDiscuss., 2004, 126, pp. 281–288
232 Dou, X., Takama, T., Yamaguchi, Y., Yamamoto, H., and Ozaki,Y.: ‘Enzyme immunoassay utilizing surface-enhanced Ramanscattering of the enzyme reaction product’, Anal. Chem., 1997, 69,pp. 1492–1495
233 Vodinh, T., Houck, K., and Stokes, D.L.: ‘Surface-Enhanced RamanGene Probes’, Anal. Chem., 1994, 66, pp. 3379–3383
234 Vo-Dinh, T., Allain, L.R., and Stokes, D.L.: ‘Cancer gene detectionusing surface-enhanced Raman scattering (SERS)’, J. RamanSpectrosc., 2002, 33, pp. 511–516
235 Vo-Dinh, T., Stokes, D.L., Griffin, G.D., Volkan, M., Kim, U.J.,and Simon, M.I.: ‘Surface-enhanced Raman scattering (SERS)method and instrumentation for genomics and biomedical analysis’,J. Raman Spectrosc., 1999, 30, pp. 785–793
236 Graham, D., Mallinder, B.J., and Smith, W.E.: ‘Detection andidentification of labeled DNA by surface enhanced resonance Ramanscattering’, Biopolymers, 2000, 57, pp. 85–91
237 Graham, D., Smith, W.E., Linacre, A.M.T., Munro, C.H., Watson,N.D., and White, P.C.: ‘Selective detection of deoxyribonucleic acidat ultralow concentrations by SERRS’, Anal. Chem., 1997, 69,pp. 4703–4707
238 Ni, J., Lipert, R.J., Dawson, G.B., and Porter, M.D.: ‘Immunoassayreadout method using extrinsic Raman labels adsorbed onimmunogold colloids’, Anal. Chem., 1999, 71, pp. 4903–4908
239 Pham, T., Jackson, J.B., Halas, N.J., and Lee, T. R.: ‘Preparationand characterization of gold nanoshells coated with self-assembledmonolayers’, Langmuir, 2002, 18, pp. 4915–4920
240 Stuart, D.A.: ‘Biomolecular Imaging and Spectroscopy with Metaland Semiconductor Nanoparticles’, ‘Analytical Chemistry’ (IndianaUniversity, Bloomington, 2003), p. 256
241 Mulvaney, S.P., Musick, M.D., Keating, C.D., and Natan, M.J.:‘Glass-coated, analyte-tagged nanoparticles: A new tagging systembased on detection with surface-enhanced Raman scattering’,Langmuir, 2003, 19, pp. 4784–4790
242 Cao, Y.W.C., Jin, R.C., and Mirkin, C.A.: ‘Nanoparticles withRaman spectroscopic fingerprints for DNA and RNA detection’,Science, 2002, 297, pp. 1536–1540
243 Cao, Y.C., Jin, R.C., Nam, J.M., Thaxton, C.S., and Mirkin, C.A.:‘Raman dye-labeled nanoparticle probes for proteins’, J. Am. Chem.Soc., 2003, 125, pp. 14676–14677
244 Krug, J.T., Wang, G.D., Emory, S.R., and Nie, S.M.: ‘EfficientRaman enhancement and intermittent light emission observedin single gold nanocrystals’, J. Am. Chem. Soc., 1999, 121, pp.9208–9214
245 Stuart, D.A., Haes, A.J., McFarland, A.D., Nie, S., and Van Duyne,R.P.: ‘Refractive Index Sensitive, Plasmon Resonant Scattering, andSurface Enhanced Raman Scattering Nanoparticles and Arrays asBiological Sensing Platforms’, Proc. SPIE-Int. Soc. Opt. Eng., 2004,5327, pp. 60–73
246 Dansher, G., Hacker, G.W., Grimelius, L., and Norgaard, J.O.R.:‘Autometallographic Silver Amplificatiton of Colloidal Gold’,J. Histochem., 1993, 16, pp. 201–207
247 Freunscht, P., Van Duyne, R.P., and Schneider, S.: ‘Surface-enhanced Raman spectroscopy of trans-stilbene adsorbed onplatinum- or self-assembled monolayer-modified silver film overnanosphere surfaces’, Chem. Phys. Lett., 1997, 281, pp. 372–378
248 Farquharson, S., and Maksymiuk, P.: ‘Simultaneous chemicalseparation and surface-enhanced Raman spectral detection usingsilver-doped sol-gels’, Appl. Spectrosc., 2003, 57, pp. 479–482
249 Stokes, D.L., Pal, A., Narayanan, V.A., and Vo-Dinh, T.:‘Evaluation of a chemical vapor dosimeter using polymer-coatedSERS substrates’, 1999, 399, pp. 265–274
250 Sulk, R.A., Corcoran, R.C., and Carron, K.T.: ‘Surface enhancedRaman scattering detection of amphetamine and methamphetamineby modification with 2-mercaptonicotinic acid’, Appl. Spectrosc.,1999, 53, pp. 954–959
251 Sulk, R., Chan, C., Guicheteau, J., Gomez, C., Heyns, J.B.B.,Corcoran, R., and Carron, K.: ‘Surface-enhanced Raman assays(SERA): Measurement of bilirubin and salicylate’, J. RamanSpectrosc., 1999, 30, pp. 853–859
252 Carron, K., Peitersen, L., and Lewis, M.: ‘Octadecylthiol-ModifiedSurface-Enhanced Raman-Spectroscopy SubstratesFa New Meth-od for the Detection of Aromatic-Compounds’, Environ. Sci.Technol., 1992, 26, pp. 1950–1954
253 Shafer-Peltier, K.E., Haynes, C.L., Glucksberg, M.R., and VanDuyne, R.P.: ‘Toward a glucose biosensor based on surface-enhanced Raman scattering’, J. Am. Chem. Soc., 2003, 125,pp. 588–593
254 Yonzon, C.R., Haynes, C.L., Zhang, X.Y., Walsh, J.T., and VanDuyne, R.P.: ‘A glucose biosensor based on surface-enhancedRaman scattering: Improved partition layer, temporal stability,
IEE Proc.-Nanobiotechnol., Vol. 152, No. 1, February 2005 31

reversibility, and resistance to serum protein interference’, Anal.Chem., 2004, 76, pp. 78–85
255 Beebe, K.R., Pell, R.J., and Seasholtz, M.B.: ‘Chemometrics: APractical Guide’ (John Wiley & Sons, Inc., New York, 1998)
256 Clarke, W.L., Cox, D., Gonder-Frederick, L.A., Carter, W.,and Pohl, S.L.: ‘Evaluating Clinical Accuracy of Systems forSelf-Monitoring of Blood Glucose’, Diabetes Care, 1987, 10,pp. 622–628
32 IEE Proc.-Nanobiotechnol., Vol. 152, No. 1, February 2005
