labour market polarisation as a localised process
TRANSCRIPT
Cambridge Journal of Regions, Economy and Society 2021, 14, 69–91doi:10.1093/cjres/rsaa030Advance Access publication 21 October 2020
This is an Open Access article distributed under the terms of the Creative Commons Attribution License (http://creativecommons.org/licenses/by/4.0/), which permits unrestricted reuse, distribution, and reproduction in any medium, provided the original work is properly cited.
© The Author(s) 2020. Published by Oxford University Press on behalf of the Cambridge Political Economy Society.
Labour market polarisation as a localised process: evidence from Sweden
Martin Henninga and Rikard H. Erikssonb
aDepartment of Business Administration, School of Business, Economics and Law, University of Gothenburg, PO Box 610, S-405 30 Göteborg, Sweden, [email protected] of Geography, Umeå University, S-901 87 Umeå, Sweden, [email protected]
Received on November 1, 2019; editorial decision on July 3, 2020; accepted on August 18, 2020
The present article creates a link between contemporary labour market polarisation and regional divergence and analyses the spatial patterns of labour market polarisation in Swedish municipalities during the period 2002–2012. The results show that the national pattern of labour market polarisation is driven by polarisation in clusters of previously manufacturing-dominated municipalities with low- and medium-skill production, as well as increasing labour market polarisation and spatial selection within the fast-growing top-tier metropolitan regions. Outside these polarising spaces, most municipalities still experience job upgrading. The much-discussed abandonment of the traditional Western European job-upgrading model towards a polarising trajectory is thus not unequivocal. Regional labour market change and metropolitan selection cause great variation in labour market trajec-tories across space.
Keywords: job polarisation, job upgrading, labour market models, regional divergenceJEL Classifications: R11, R23
Introduction
There are widespread concerns that the post-industrial process of economic change comes with increasing labour market polarisa-tion, driven by the changing composition of jobs (Autor et al., 2006; Goos and Manning, 2007; Goos et al., 2009). At the same time, divergence and increasing differences characterise regional development in many developed economies (Iammarino et al., 2019; Storper, 2018; Rosés and Wolf, 2019). These processes strongly
influence the possibility to sustain employment and welfare in many regional economies.
While a sizeable body of literature deals with job polarisation in a range of countries on the national level and for the labour market as a whole, few studies have been concerned with this issue from a geographical point of view, despite the findings indicating that the re-gional division of work also entails a strong spatial sorting of jobs (Wixe and Andersson, 2017). This lack of geographical perspectives
Dow
nloaded from https://academ
ic.oup.com/cjres/article/14/1/69/5934068 by U
mea U
niversity Library user on 18 May 2021

70
Henning and Eriksson
is unfortunate because the explanations for labour market polarisation remain contested in the literature, ranging from the impact of technological change to institutional liberalisa-tion. Going beyond national aggregates, more detailed geographical analyses could offer more precise explanations for labour market changes that influence growing regional in-equalities. Such a perspective needs to go be-yond the arguably reductionist (successful) core/(unsuccessful) periphery dichotomy that is often used to describe regional development patterns (Breau and Saillant, 2016). This is im-portant because recent developments have cre-ated ‘…a finely grained, multi-scale territorial patchwork of diverging real incomes and rates of labour force participation…’ (Iammarino et al., 2019, 274).
The aim of the present article is to address these potential diversities of labour market change by investigating regional patterns of la-bour market polarisation under conditions of regional divergence. By analysing detailed job data for Swedish municipalities for the period 2002–2012, the article decomposes the growing polarisation of the labour market geographic-ally. Sweden is a particularly interesting case in this regard. For a long time, the ‘Swedish labour market model’ was (in)famously known for its focus on job upgrading, partly sacrificing labour market flexibility to successfully achieve this end under conditions of stable growth during the post-Fordist era. Yet recent detailed inves-tigations have found labour market polarisa-tion tendencies in Sweden as well (Åberg, 2013; Asplund et al., 2011; Heyman, 2016; LO, 2014).
At the same time, the Swedish economy has been moving from a period of regional con-vergence, during most of the post-war era, to mounting regional differences and divergence regarding both productivity and job creation (Enflo and Henning, 2016; Eriksson and Hane-Weijman, 2017). As elsewhere in the Western world, these coinciding processes have raised widespread concerns across the political spec-trum, calling for more active regional policies
to prevent the increasingly unequal economic opportunities encountered and experienced first-hand by different groups in society and in different types of regions (Rodríguez-Pose, 2018).
There is little scientific evidence regarding which regions experience labour market po-larisation, and how widespread it is across regional economies. This raises questions con-cerning whether de-industrialising regions or fast-growing and technologically leading ones are more likely to polarise or whether polarisa-tion is a consequence of institutional change on the national or regional level.
The present article finds that the geographies of labour market polarisation are driven by two main tendencies: first, polarisation in pre-viously relatively manufacturing-intense lower- and medium-skilled production municipalities and second, polarisation through spatial sorting in income within the fast-growing metropolitan regions. There are also spatial neighbourhood effects, as the probability of polarisation is af-fected by the type of change that surrounding regions experience. Thus, in regional industrial districts, polarisation is a localised phenomenon that neighbouring municipalities share. Outside these spaces, most municipalities, and in fact a majority of the entire population, are still ex-periencing job upgrading. However, some mu-nicipalities are not experiencing upgrading or polarisation. Downgrading municipalities, where low-wage occupations primarily grow, are instead associated in particular with higher shares of foreign-born residents. This points to the fact that the polarisation discussion not only has important economic implication, but also has social and demographic implications.
The article applies a geographical perspective to the discussion on labour market polarisa-tion in developed economies. As we show that there is widespread geographical heterogen-eity underlying national patterns of polarisa-tion, the article also adds to recent debates on the reasons for regional divergence, spatial pat-terns of economic and social inclusion as well as
Dow
nloaded from https://academ
ic.oup.com/cjres/article/14/1/69/5934068 by U
mea U
niversity Library user on 18 May 2021

71
Labour market polarisation as a localised process
regional variations in productivity. Most import-antly, the main explanations for polarisation seem to differ geographically. No unified, uni-versal explanation can be articulated for all lo-cations, even if outcomes are seemingly similar. For the geographical literature on processes of regional divergence and regional labour market change, this conclusion is instructive in that it adds to the current discussion on whether rising populism is driven by restructuring or inequality (Rodríguez-Pose, 2018). This is because our re-sults indicate that increasing polarisation seems to be strongly connected with restructuring in previously manufacturing-intense regions. The findings thus have implications for regional pol-icies concerning inclusion and growth, which we discuss in our conclusions.
We start with a review of the literature on labour market polarisation and regional di-vergence. After this, the data and methods are accounted for, and this is followed by the em-pirical results. Conclusions and a discussion concerning the theoretical as well as empirical contributions end the article.
Literature overview
Regional divergenceRegional divergence and labour market polar-isation seem to be salient features of many, per-haps even most, developed economies in the post-Fordist era. New empirical evidence shows how regional convergence and a geographically widespread distribution of growth dominated average spatial development in many econ-omies during the long-term post-war growth era of the 1950s–1970s (Rosés and Wolf, 2019). Since the 1980s, however, there is mounting evi-dence for increasing spatial divergence in many developed economies (Rosés and Wolf, 2019; Storper, 2018), as Keynesian regulation sys-tems have increasingly been replaced by more market-oriented versions (Scott, 2019).
In Sweden, for example, regional inequality is now back to the levels of divergence recorded
before the economic boom following the Second World War (Enflo and Henning, 2016). In the literature, explanations for this increasing divergence have ranged from long-term cyclical argument, to those focussing on the shift from manufacturing-based to service-based econ-omies, as well as on the increasing role of know-ledge in contemporary production processes and the spatial consequences of institutional and political change (Eriksson and Hane-Weijman, 2017; Henning, 2020; Lundquist et al., 2008a; Martynovich and Lundquist, 2016).
Labour market polarisationIn parallel with increasing regional divergence, recent evidence suggests a wave of labour market polarisation. Although labour market polarisation tendencies have been recorded in the USA all the way back to the 1950s–1960s (Bárány and Siegel, 2018), the dominating evi-dence is more contemporary. Several studies have analysed the polarisation tendencies in the USA since the early 1990s (Autor et al., 2006; Dwyer, 2013), but similar evidence has also mounted for the UK for the period 1979–1999 (Goos and Manning, 2007) and for the EU as a whole, as well as for a range of individual European countries for the period 1993–2006, including Belgium, Germany, Greece, the Netherlands, Norway, Spain, Sweden (Goos et al., 2009, 2014) and Finland (Asplund et al., 2011). However, despite the prevailing polar-isation discourse, the identification of polar-isation patterns across Europe has not been completely uncontested (Fernández-Macías and Hurley, 2017; Oesch and Piccitto, 2019). Fernández-Macías (2012), for example, iden-tifies three typical patterns among European economies during the period 1995–2007: po-larisation, upgrading and middling upgrading, where Sweden positions itself, although weakly, among the upgrading countries. Oesch and Piccitto (2019) obtain similar results on up-grading, though using a somewhat different em-pirical approach.
Dow
nloaded from https://academ
ic.oup.com/cjres/article/14/1/69/5934068 by U
mea U
niversity Library user on 18 May 2021

72
Henning and Eriksson
Polarisation explanationsDifferent potential explanations for these po-larisation tendencies have been subject to quite considerable academic debate (Goos et al., 2014) and cover supply- and demand-driven factors. Note that it is commonly acknowledged that the different explanations are not neces-sarily mutually exclusive; they may all be rele-vant and contribute to varying degrees.
One potential explanation focuses on glo-balisation of the production chains, offshoring and de-industrialisation (Fernandez-Macıas and Hurley, 2017; Goos et al., 2009). According to this argument, the middle segment of the labour market in developed economies, often traditionally consisting of relatively well-paid manufacturing work, is increasingly being offshored to low-cost countries due to the glo-balisation of production. While offshoring ten-dencies are themselves indisputable and by no means thus far countered by their opposite, growing back-shoring tendencies (Stentoft et al., 2016), the empirical research has ex-pressed doubt about this explanation as a de-terminant underlying polarisation (Goos et al., 2009). On the other hand, it is well documented that manufacturing shares of employment are declining in many advanced economies, leaving primarily high-end advanced func-tions such as R&D, product development, de-sign and after-sales services still located in the traditional manufacturing economies (Dicken, 2015; Svensson Henning, 2009).
In practice, it is difficult to distinguish a glo-balisation explanation for changing labour market patterns from the factors associated with technological change (Iammarino et al., 2019). However, for some, polarisation explanations take on a more general and primary techno-logical guise, cutting across industries. For some time, the model of skill-biased technological change assumed that highly educated workers were able to make use of technological devel-opment in a way that was complementary to their skills, thus explaining their attractiveness
on the labour market and their increasing share of the workforce in Western economies (Autor et al., 2003). Together with regulated labour markets in many Western countries and delib-erate anti-low-wage policies, this would provide a clear explanation for the upgrading patterns of the post-war era.
Even if this approach has been complemented with the insight that the propensity of experi-encing upgrading is not necessarily a matter of education or human capital, but that it is the tasks people perform that determine their com-plementarity with new technology (task-biased technical change, TBTC), more nuanced under-standings combine the explanation of growing attractiveness of high-end workers with related demand effects in the lower segments of the la-bour market spectrum (for example, effects on low-wage services). In this view, polarisation can be seen as a logical consequence of con-temporary patterns of technological change, where demand is created for both the most and the least qualified parts of the workforce, whereas the mid-segment suffers the most from automation and digitalisation (Goos and Manning, 2007). In recent history, this middle group of wage earners has been largely reliant on tasks that are more prone to automation (Autor et al., 2003). In fact, this argument is also largely consistent with the ideas of urban the-orists (Florida, 2002, 2005; Sassen, 1991), who point to the complementary growth of a well-paid ‘creative class’ and a service-oriented class in the lower part of the wage distribution that caters to the preferences of the creative class. Adding to the structural complexity of this de-bate, Bárány and Siegel (2018) argue, based on their finding of labour market polarisation in the USA all the way back to the 1950s–1960s, that the automation of routinised work cannot be the sole explanation for labour market po-larisation. Rather, they stress that structural change not only between jobs, but also between sectors (from manufacturing to services) is a decisive explanation.
Dow
nloaded from https://academ
ic.oup.com/cjres/article/14/1/69/5934068 by U
mea U
niversity Library user on 18 May 2021
73
Labour market polarisation as a localised process
Thus far, we have focussed mainly on the literature primarily emphasising globalisation, technical change and resulting demand effects for low-wage services as the main explanatory factors for labour market polarisation. Other parts of the literature, however, have stressed that institutions and change in socio-political arrangements may influence the degree of po-larisation on the labour market. Fernández-Macías (2012) in fact explains divergent features among European economies—only some of which display polarisation in the meas-urements covering the period 1995–2007—as an outcome of differences in institutional fac-tors. For Scandinavia, this would be the demise of traditional wage compressing policies, the weakening of the traditionally strong labour unions as well as outsourcing of previous public sector jobs. The results of Fernández-Macías and Hurley’s (2017) study suggest that it is not primarily computerisation of routine content in jobs, but rather institutional factors and trade that explain the variation in upgrading and po-larisation in European countries for the period 1995–2007. Moreover, rather than turning to an explanation of labour market polarisation based on technological change, Dwyer (2013) argues that the growth of the ‘care economy’, with an increase in occupations associated with the caring activities (for example, healthcare, teaching, childcare and domestic services), con-tributed significantly to polarisation on the US labour market during the period 1983–2007. Women’s increasing participation on the la-bour market, as well as the professionalisation of care work and an overall ageing population, fuelled this development.
In fact, in a recent study, Oesch and Piccitto (2019) cannot identify polarisation patterns in either Germany, Spain, Sweden or the UK for the period 1992–2015. Instead, they argue that previous income-based accounts are biased due to, for example, different returns on education and gendered wage structures, in which rela-tively high-qualified but low-paid occupations
(for example, female-dominated healthcare) have increased while relatively well-paid but low-qualified occupations (for example, male-dominated manufacturing) have decreased. Hence, rather than an erosion of middle-class occupations, they identify the erosion of (male) working-class occupations combined with increasing job opportunities for the higher-salaried upper-middle class.
This discussion also links to explanations for polarisation patterns that focus on an inter-action between institutional and demographic factors. Recently, the situation of international migrants on the European labour markets has been subject to extensive academic debate, where it is commonly found that, in Western economies, this group underperforms or rather is trapped in underperforming in relation to both wages and employment conditions com-pared to native employees (Bevelander, 1999; Turchick Hakak and Al Kriss, 2013). There is also a strong sectoral bias towards recruitment of immigrants into lower-skill service indus-tries (Daunfeldt et al., 2018). This has led to widespread concerns that international mi-grants increasingly are inhabiting the growing shares of less-qualified, low-paid jobs in the economy (LO, 2003; OECD, 2017; Ottaviano and Peri, 2012), although recent research sug-gests that, among the OECD countries, immi-gration cannot really explain the growth of the low-wage sector. This is rather due to low levels of investments and limits to social mobility (Andersson et al., 2019).
As we discussed initially, one may naturally question the degree to which these different ex-planations are in fact exclusive or just different aspects of the same post-industrial transform-ation of mutually dependent and inseparable institutions, technologies, policies and inter-twined supply and demand effects working towards a polarisation outcome. Still, they do differ in emphasis, and as a result, it is im-portant, for both academic and policy reasons, to investigate which explanation tends to
Dow
nloaded from https://academ
ic.oup.com/cjres/article/14/1/69/5934068 by U
mea U
niversity Library user on 18 May 2021

74
Henning and Eriksson
predominate in different countries, at different points in time.
Regional considerationsNonetheless, the literature on labour market polarisation has largely ignored the fact that, owing to the spatial division of labour in modern economies, the geography of labour market polarisation should also be differen-tiated. In other words, polarisation does not take place just anywhere, and the uneven spa-tial distribution of social and economic factors could even explain some of the inconsistent results obtained in previous studies. In other words, whereas some institutions (but not all) may be geographically invariant in a country, the regional composition of jobs, activities and industries will lead to very different regional la-bour market outcomes as a result of the forces affecting polarisation. This also means that the spatial differentiation and sorting of economic activities and skills between regions could tell us more about the reasons for and extent of polarisation than average comparisons across countries. Consequently, we believe that we can gain a great deal from simultaneously con-sidering regional average economic outcomes and individual income equalities, which are dif-ferent aspects of the same processes (Alonso, 1980; Rey, 2018).
Concerning aspects of this matter, a couple of contributions to the literature have preceded us. Lindley and Machin (2014) investigated different labour market polarisation patterns in the USA and found that polarisation was a persistent feature of the labour market across the states during the period 1980–2010. They related this both to educational spatial sorting (concentration of skilled workers) and to increasing income differences. In states showing a higher increase in demand and wages for the highly educated, a market for less-skilled workers also grew. This is generally in line with the technological ‘hollowing out’ explanation for labour market polarisation, as the adaption
of information technologies mainly reduces levels of low-skilled production jobs and in-creases service and high-skilled production jobs (Autor and Dorn, 2013). Even though the results of Lindley and Machin (2014) under-line the spatial differentiation of labour market polarisation within nations, empirical features may be different in Europe owing to insti-tutional differences. Furthermore, US states are often aggregates of many different labour markets—a more precise geographical scale would be desirable in attempts to pinpoint the spatially diverse mechanisms underlying po-larisation. For example, in an initial analysis, Åberg (2015) also finds that a differentiated geography underlies national polarisation ten-dencies in Sweden when comparing patterns across large-, medium-sized and small regions. Using descriptive indications for Dutch cities, PBL (2019) discloses a substantial heterogen-eity in labour market patterns.
Swedish experiencesGlobalisation pressures and institutional change have also spurred the recent debate on increasing labour market polarisation in Sweden. In the Swedish case, the social-democratic labour market model was long geared towards both upgrading jobs through an increase in higher paid and more qualified jobs and out-phasing low-productive, low-paid and low-skilled jobs (Adermon and Gustavsson, 2015; Asplund et al., 2011). For a long time, this was also the empirical tendency (LO, 2014).
To the surprise of many observers, however, polarisation tendencies have also been con-vincingly documented on the Swedish labour market during recent years (Åberg, 2013, 2015; Adermon and Gustavsson, 2015; Asplund et al., 2011; Henning et al., 2016; Heyman, 2016). Relatively high labour costs promoted early automation in manufacturing, and employment shares in manufacturing have been decreasing since the 1970s, in parallel with shares in manufacturing-related professional services
Dow
nloaded from https://academ
ic.oup.com/cjres/article/14/1/69/5934068 by U
mea U
niversity Library user on 18 May 2021

75
Labour market polarisation as a localised process
drastically increasing (Henning, 2020; Svensson Henning, 2009). This has coincided with an ele-vated qualification structure in these industries. While the shares of workers holding a univer-sity degree have increased, shares with a low or no formal education are now far smaller on the aggregate level. Still, as depicted by Eriksson and Hansen (2013), this varies substantially across regions, because the majority of workers outside the largest urban areas have no tertiary education. This is partly attributed to the spatial division of occupations, and partly due to dem-ography, as small and, in particular, peripheral regions struggle with pressures related to an ageing population. Also, the ‘pecuniarisation’ of much household work that took place in Sweden during the 1960s and 1970s (with an elaborated public childcare and elderly care system) can explain why the differences be-tween men’s and women’s labour participation rates are small, but also why the Swedish labour market is highly gender segmented.
Recent policies have made some household services tax deductible (construction and renov-ations from 2004 and other household services from 2007). In addition, facilitating growth of simple and lower paid (often service) jobs is seen, ‘even’ in social-democratic rhetoric, as a way to increase participation rates for disad-vantaged groups. Finally, increased outsourcing of municipal obligations to the private sector in the form of private contracting may alter wage structures locally.
With the recent wave of immigration from non-European countries and the observed dif-ficulty integrating these immigrants into the es-tablished Swedish labour market, demographic issues have become a major political concern. It is by now a well-established fact that labour market integration of foreign-born residents has worsened since the 1970s. The exact causes are debated, but potential important explan-ations range from business cycle shifts and structural change, labour market policies, and the increased importance of social and cultural
affinity, to implicit stereotyping and discrimin-ation (Bevelander, 1999; Daunfeldt et al., 2018; Tibajev, 2016).
Data and measurement issues
Polarisation patterns and municipality groupsTo investigate the regional variations in po-larisation patterns, we use individual-level data from Statistics Sweden covering the years between 2002 and 2012. These data include the annual wages of individuals active on the Swedish labour market as well as their occu-pations and industry affiliations. We choose the period 2002–2012 for two main reasons. First, previous accounts have not identified po-larisation tendencies in Sweden prior to 2000 (Åberg, 2015), which makes this period particu-larly suitable for our purpose. Second, we select the final year (2012) due to a revision in occu-pation codes from 2013 onwards, which makes comparisons prior to and after 2012 virtually impossible.
In a first step, we define, as do Goos and Manning (2007) and Åberg (2013), a job as a combination of industry and occupation. In other words, a job is a particular occupation in a particular industry. To define an occupa-tion, we use the three-digit level of the Swedish SSYK96 occupation nomenclature (broadly consistent with the international ISCO-88); to define an industry, we use the two-digit level of the SNI2007 industry classification system (consistent with NACE Rev. 2.).
In a second step, we exclude individuals who are not registered as ‘employed’, who have changed workplace (and/or occupation) during the previous two years, and all above defined job categories with fewer than 100 employees. Based on the remaining sample, we then cal-culate wage deciles and remove the first and ninth deciles. All of this is done to reduce the impact of job changers on the income levels (people who change jobs tend to receive higher
Dow
nloaded from https://academ
ic.oup.com/cjres/article/14/1/69/5934068 by U
mea U
niversity Library user on 18 May 2021

76
Henning and Eriksson
incomes) and to exclude potential outliers. We carry out several robustness checks to en-sure that our results were not biased by this procedure.1
In our third step, we classify the jobs into job quality groups (tiers), as defined by the median wage of the jobs in 2002. Our empirical strategy is inspired by the strategy used by Goos et al. (2009) and nearly replicates (but on the single-country level) the classification strategies estab-lished by Fernández-Macías (2012) and Åberg (2013). However, we use an even finer-grained level of industry classification than Fernández-Macías (2012) and, like Oesch and Piccitto (2019), we include all jobs in the economy that reach the size thresholds mentioned above. For 2002, we thus calculate the median wage of each job. To do this, we use the annual wages of the individuals affiliated with each job.2 Following the convention of the polarisation literature, the jobs are then distributed into five bins sep-arated by the quintiles of the distribution of median wages across jobs. This means that indi-viduals with the lowest wages belong to the first bin, while individuals with the highest paid jobs belong to the fifth bin.
Optimally, the bins should be of equal size (20% each of the Swedish workers). This is not quite the case, however, because jobs are of rather unequal size in the economy. In par-ticular, some public sector jobs distort the bin sizes. This is less of a problem, because we are not interested in the wage groups per se, but in changes in their relative size from 2002. If a bin grows, it means that more individuals be-come attached to the jobs in that wage bin over time (and vice versa). In total, we end up with 3,358,119 workers whom we classify into the bins (in 2002). In 2012, the part of the Swedish labour market that we are able to measure grew to 3,560,643 workers (about 78% of active workers in Sweden).
Based on these numbers, we can calculate the strength of the labour market polarisa-tion process on the national level. In essence,
a typical polarisation pattern looks something like the first graph of Figure 1 (upper left), with a relative growth of the jobs in the extreme bins (lowest and highest paid) of the distribution, and a relative decrease in the group of mid-income earners.3
However, regional profiles still need to be constructed. Therefore, as a fourth step, we measure the changes in the regional bin dis-tributions. We are not particularly interested in what the wage bin distribution looks like in the different municipalities, but rather in the compositional changes over time. As a baseline, we construct four different groups based on the nature of the changes in muni-cipalities: polarising municipalities, upgrading municipalities, downgrading municipalities and middling municipalities. Figure 1 displays the stylised patterns of the different groups. All described changes represent changes in percentage units of bins in municipal labour markets.
The idea of classifying countries/regions ac-cording to their patterns of change is analogous to the approach developed by Fernández-Macías (2012). But while Fernández-Macías sorts countries into ‘polarisation’, ‘upgrading’ and ‘mid-upgrading’ categories based on visual inspection of graphs describing country la-bour market change, we need more objective criteria, partly because we are dealing with far more spatial units, and partly to reduce the risk of arbitrary decisions. Therefore, we categorise the empirical municipal patterns using the fol-lowing procedures:
Polarising municipalities: parallel growth of high- and low-wage segments. Conditions are as follows: ((∆Bin1+∆Bin2) > 0) and (∆Bin3 < 0) and ((∆Bin4+∆Bin5) > 0)4
Upgrading municipalities (Swedish model municipalities): better jobs grow, and worse jobs disappear. Conditions are as follows: ((∆Bin1+∆Bin2+∆Bin3) < 0) and ((∆Bin4+∆Bin5) > 0)
Dow
nloaded from https://academ
ic.oup.com/cjres/article/14/1/69/5934068 by U
mea U
niversity Library user on 18 May 2021

77
Labour market polarisation as a localised process
Downgrading municipalities: better jobs disappear, and worse jobs grow. Conditions are as follows: ((∆Bin 1+∆Bin 2) > 0) and ((∆Bin3+∆Bin4+∆Bin5) < 0)
Middling municipalities: growth of jobs in the middle of the distribution. Conditions are as follows: ((∆Bin1+∆Bin2) < 0) and (∆Bin3 > 0) and ((∆Bin4+∆Bin5) < 0)
To create the most precise geographical dis-aggregation of the labour market patterns, we use municipalities as the main geographical unit, and bin shares are calculated using resi-dent population. In Sweden, most of the mu-nicipalities (290) consist of a main city with a surrounding hinterland. We use municipalities because of our interest in spatial variations and because Swedish municipalities have a consid-erable degree of self-governance, especially in issues concerning planning, social policy and infrastructure. Moreover, the local tax base is set at the municipal level (place of residence)
not the regional, which means that any changes in the wage distribution have direct implica-tions for the municipalities’ financial situation. The most obvious problems with this analytical level arise in the three metropolitan regions (Stockholm, Gothenburg and Malmö), which consist of a number of highly interlinked mu-nicipalities. In the empirical analysis, an add-itional analysis of the internal division of labour in these regions takes this into consideration.
Variable selectionThe literature review above centres on four traditions that have different, though not ne-cessarily mutually exclusive, emphases in their primary explanations of labour market polar-isation patterns: globalisation, technological change, institutions and change in socio-political arrangements and demographic factors. Our basic contention is also that the impact of these explanations differs geographically, partly be-cause not all regions experience polarisation
Bin 1 Bin 2 Bin 3 Bin 4 Bin 5
Polarizing municipali�esPe
rcen
tage
uni
t cha
nge
in
bin
size
Bin 1 Bin 2 Bin 3 Bin 4 Bin 5
Upgrading municipali�es
Perc
enta
ge u
nit c
hang
e in
bin
siz
e
Bin 1 Bin 2 Bin 3 Bin 4 Bin 5
Downgrading municipali�es
Perc
enta
ge u
nit c
hang
e in
bi
n si
ze
Bin 1 Bin 2 Bin 3 Bin 4 Bin 5
Middling municipali�es
Perc
enta
ge u
nit
chan
ge in
bi
n si
ze
Figure 1. Stylized municipality labour market patterns.
Dow
nloaded from https://academ
ic.oup.com/cjres/article/14/1/69/5934068 by U
mea U
niversity Library user on 18 May 2021
78
Henning and Eriksson
and partly because regions differ in the com-position of their economies owing to the spatial division of labour.
Compared to cross-nation comparisons, it is not straightforward to identify variables that afford a full-fledged range of municipal-level indicators that operationalise the different ex-planations found in the literature. Drawing on the databases of Statistics Sweden, we calculate a set of variables we believe could provide ini-tial indications of primary relevance of the dif-ferent explanations (all independent variables for 2002 per municipality, resident population).
As an indicator of economic globalisation, we settle for sector employment in extraction/mining industries and manufacturing. While this is of course imperfect as a measure of the total regional effects of globalisation, one of the most important economic effects of globalisation in Sweden has been long-term de-industrialisation, but also servification of the remaining high-productive manufacturing activities (Henning, 2020).
As indicators of the technological change process, we first specify an indicator of share of occupations in construction, manufacturing and transportation that do not require a uni-versity degree. Forward-looking research has found that these occupations have a high probability of experiencing future automation (Henning et al., 2016; Fölster, 2014; Frey and Osborne, 2017). We acknowledge that the latter variable is positioned between the globalisa-tion and technology explanations. However, because Swedish manufacturing has a long history of offshoring due to its high relative wages, we believe it is more reasonable to in-terpret this as an indicator of technological change than pure offshoring. As indicators rep-resenting technical change, we also use pure human capital variables (share of population in a municipality with a bachelor’s degree or above and share of population in occupations requiring a specialised university diploma), as well as share of workers in the municipality
employed in knowledge-intensive business services (KIBS), for which we expect the de-mand to grow with technological change and more advanced applications (Lundquist et al., 2008b). While none of these indicators actually represents the regional impact of technological change per se, we interpret them as indirect measures reflecting the value of having a re-gional labour force readily equipped to deal with technological change or one that is much more susceptible to the substitution effects of automation and computerisation.
We choose two different indicators to signal institutions and socio-political arrangements. The first concerns the presence and extent of public service activities in the municipal-ities, as measured by the share of workers em-ployed in public administration and care and social services. Second, we measure the share of public expenses going to the private sector due to contracting, which we take as an indi-cator of public outsourcing affecting wages in outsourced activities. Demographic effects are operationalised by measurements of the share of foreign-born residents in the municipality population, and the share of the population above retirement age. Lastly, we add a number of geographical controls, among which the most important is perhaps a control for municipal unemployment level. Table 2 summarises all variables.
Findings
Descriptive evidenceFigure 2 displays the national job development pattern in Sweden between 2002 and 2012. The graphs show a, by now, familiar polarisation pattern in the Swedish labour market as meas-ured by an income-based definition (Åberg, 2013, 2015). While the bins in the middle are decreasing in relative terms (left graph), the tail bins experience a relative increase in their re-spective shares of the labour market. Although the changes are not particularly dramatic
Dow
nloaded from https://academ
ic.oup.com/cjres/article/14/1/69/5934068 by U
mea U
niversity Library user on 18 May 2021

79
Labour market polarisation as a localised process
regarding labour market shares, in the ex-treme bins around 1%, the pattern still marks an overall decisive move from the traditional upgrading model. In real terms, however, most bins experience absolute growth, owing to the overall positive development on the Swedish labour market (right graph). For the tail bins (1, 4 and 5), this amounts to an increase of al-most 200,000 employees during the period under study.
In the next step, we decompose the national pattern into the regional patterns of Figure 1, according to the quantitative conditions pre-sented above. Table 1 describes the overall out-come. All four stylised patterns are ‘inhabited’ by a number of municipalities. This demon-strates the wide variety of local patterns that make up both the relative and absolute na-tional polarisation trajectory shown in Figure 2. While a significant number of municipalities
belong to the polarising group (Figure 3 shows their average patterns), most of the munici-palities still experience more conventional job-upgrading patterns. In fact, almost half the total population in Sweden, over 4 million, live in municipalities that are still experiencing job upgrading, which supports the arguments of Oesch and Piccitto (2019). On the other hand, matters are far worse for the 56 municipal-ities that are experiencing downgrading. More than 2.4 million Swedes live in municipalities with such a negative labour market trajectory. Twenty-seven municipalities are placed in the middling category, with a clear increase in the mid-segment of the labour market.
The geographical distribution of these groups is shown in Figure 4. The polarisers are mainly located along the traditional ‘industrial belt’ of Sweden, from western Sweden northwards to Mälardalen, west of Stockholm and the old industrial municipalities of Bergslagen in the middle of the country. Upgraders instead dom-inate, perhaps surprisingly, large parts of the more peripheral regions of Sweden and around Gothenburg and Malmö. The downgraders are located mainly around Stockholm and in very remote locations. The middling munici-palities dominate in the very south, and some are scattered around the country. Indeed, al-though there seem to be some geographical clusters of similar trajectories, heterogeneity rather than homogeneity is what characterises
Table 1. Municipal outcomes after sorting into the labour market patterns.
Patterns Number of municipalities Total population
Polarisers 61 1,942,714Upgraders 146 4,041,761Downgraders 56 2,406,721Middling 27 549,592
Source: Own elaboration of data from Statistics Sweden.
Bin 1 Bin 2 Bin 3 Bin 4 Bin 5
-1.5%
-1.0%
-0.5%
0.0%
0.5%
1.0%
1.5%
Perc
enta
ge u
nit c
hang
e in
bin
si
ze
Bin 1 Bin 2 Bin 3 Bin 4 Bin 5-20 000
-
20 000
40 000
60 000
80 000
100 000
Chan
ge in
bin
siz
e, n
umbe
r of
em
ploy
ees
Figure 2. National job development pattern in Sweden between 2002 and 2012. (Left) Change in bin percentage of the Swedish labour market, 2002–2012. (Right) Change in number of employees in bins, 2002–2012. Source: Own elaboration on data from Statistics Sweden.
Dow
nloaded from https://academ
ic.oup.com/cjres/article/14/1/69/5934068 by U
mea U
niversity Library user on 18 May 2021

80
Henning and Eriksson
Tabl
e 2.
Mea
n of
the
diff
eren
t ind
icat
or v
aria
bles
am
ong
the
mun
icip
aliti
es a
ssig
ned
to a
spe
cific
labo
ur m
arke
t pat
tern
cat
egor
y, 2
002.
Mai
n ex
plan
ator
y fr
amew
ork
Var
iabl
esPo
lari
sers
Upg
rade
rsD
owng
rade
rsM
iddl
ing
All
mun
icip
alit
ies
(non
-wei
ghte
d)
Glo
balis
atio
nSh
are
of w
orke
rs, e
xtra
ctio
n an
d m
inin
g (%
)0.
91.
61.
11.
31.
3
Glo
balis
atio
nSh
are
of w
orke
rs, m
anuf
actu
ring
(%
)29
.221
.823
.221
.723
.6Te
chno
logy
Shar
e of
occ
upat
ion
grou
ps 7
and
8 a
s sh
are
of th
e m
unic
ipal
man
ufac
turi
ng e
mpl
oy-
men
t %
60.4
54.2
51.8
52.8
54.9
Tech
nolo
gySh
are
of w
orke
rs, l
aw m
anag
emen
t and
te
chni
cal (
%)
1.8
2.1
2.6
2.5
2.2
Tech
nolo
gySh
are
of p
opul
atio
n w
ith
a ba
chel
or’s
de-
gree
18.2
2121
2220
.5
Tech
nolo
gySh
are
of p
opul
atio
n in
occ
upat
ions
re-
quir
ing
a sp
ecia
lised
uni
vers
ity
dipl
oma
10.7
12.6
12.9
13.4
12.3
inst
itutio
ns a
nd s
ocio
-eco
nom
ic
arra
ngem
ents
Shar
e of
wor
kers
, pub
lic a
dmin
istr
atio
n (%
)4.
45.
24.
84.
84.
9
Inst
itutio
ns a
nd s
ocio
-eco
nom
ic
arra
ngem
ents
Shar
e of
wor
kers
, car
e an
d so
cial
ser
vice
s (%
)14
.5 1
5.8
14.8
15.5
15.3
Inst
itutio
ns a
nd s
ocio
−ec
onom
ic
arra
ngem
ents
Shar
e of
exp
ense
s go
ing
to th
e pr
ivat
e se
ctor
13.8
14.6
16.7
1715
.1
Dem
ogra
phy
Shar
e of
fore
ign-
born
res
iden
ts9.
57.4
10.7
7.88.
6D
emog
raph
ySh
are
of p
opul
atio
n ab
ove
reti
rem
ent a
ge23
.923
.623
.123
.623
.5C
ontr
olM
unic
ipal
ity
popu
lati
on 2
002
(tho
usan
ds)
31.8
27.7
4320
.430
.9C
ontr
olPo
pula
tion
cha
nge
2002
–201
2 (%
)0.
32.
11.
81.
31.
6C
ontr
olU
nem
ploy
men
t sha
re (
%)
32.
92.
92.
92.
9
Not
e: H
ighe
st n
umbe
rs a
re in
bol
d.So
urce
: Ow
n el
abor
atio
n of
dat
a fr
om S
tati
stic
s Sw
eden
.
Dow
nloaded from https://academ
ic.oup.com/cjres/article/14/1/69/5934068 by U
mea U
niversity Library user on 18 May 2021

81
Labour market polarisation as a localised process
the geographical distribution of labour market trajectories in Sweden during the period 2002–2012.
To make the investigation somewhat more detailed, Table 2 displays the mean of the dif-ferent initial indicator variables among the mu-nicipalities assigned to a specific labour market change pattern: polarising municipalities, up-grading municipalities, downgrading municipal-ities and middling municipalities (top averages are indicated by grey cells). The means are al-ready indicative of some broad characteristics of the municipalities faced with different la-bour market trajectories.
The polarising municipalities are character-ised by higher shares of manufacturing, slightly lower education levels and slightly higher shares of elderly inhabitants than the muni-cipalities of the other groups, even compared
to the downgrading municipalities. In general, it therefore seems that polarisation is closely related to the structural situation of munici-palities. This group is inhabited by the slow-growing, static or even declining municipalities that have a more traditional manufacturing-oriented industrial structure, relying on comparatively low- and mid-level-educated workers.
However, these are by no means the smallest municipalities in the regional hierarchy: Only the downgrading municipalities are larger on average. In addition, polarisation in these mu-nicipalities does not necessarily mean that the tail bins are growing in absolute terms. Our in-dicators are based on relative numbers. Indeed, a municipality could also upgrade during overall decline to produce fewer, but relatively better jobs.
Figure 3. Average percentage unit change in bin size 2002–2012 for the municipalities in the ‘polarising municipalities’ group (upper left), ‘upgrading municipalities’ (bottom left), ‘downgrading municipalities’ (bottom right) and ‘middling municipal-ities’ (upper right). Source: Own elaboration on data from Statistics Sweden.
Dow
nloaded from https://academ
ic.oup.com/cjres/article/14/1/69/5934068 by U
mea U
niversity Library user on 18 May 2021

82
Henning and Eriksson
The evidence presented in Table 2 suggests that geographical features distinctly struc-ture which municipalities belong to the other labour market trajectory groups as well. The downgrading municipalities have substan-tial manufacturing shares, too, but are more strongly characterised by services as well as by the highest shares of foreign-born resi-dents. Perhaps the most striking feature of this
group, however, is the rapid change in popu-lation size, which is comparable to that of the upgraders. When municipalities grow rapidly, it seems that they do so particularly with growth in the tails, compared to the outset.5 The up-graders are characterised by high presence of mining and extraction activities (which were booming during the period investigated), but also of public sector jobs. Finally, the middling municipalities, where the mid-segment of the labour market tends to grow, are on average comparatively affluent, with high general education levels.
The means found in Table 2 suggest that while polarisation in municipalities has a pre-dominant structural component and links to technological change in manufacturing, there are equally relevant indications for the other groups that require consideration when decomposing the national polarisation trajec-tory. National change in occupational struc-tures is, hence, a jigsaw puzzle of regionally distinct polarisation, upgrading, downgrading and middling trajectories. We have already dis-cussed the fact that the different explanations suggested for the different patterns in the data are not mutually exclusive. But how does their explanatory power compare across the dif-ferent groups?
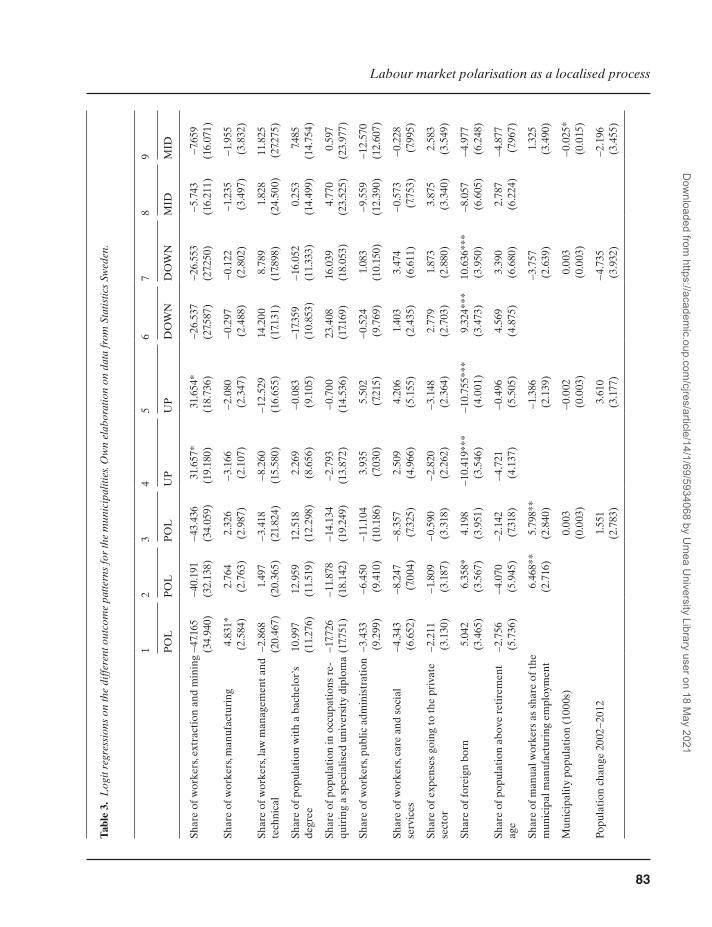
RegressionsIn Table 3, we show the outcomes for four sep-arate outcome variables in nine different logit regressions (=1), according to the different la-bour market trajectories (polarising, upgrading, downgrading, middling). Each outcome is, in other words, compared to all other possible outcomes. To estimate the degree of spatial dependency, especially in commuting regions that may consist of several municipalities, we have tested the residuals of each of our original models for spatial autocorrelation (Moran I). The residuals for the upgrading, downgrading and middling models show no or very weak spatial autocorrelation. For these models, we
Figure 4. Map of municipalities by labour market pattern 2002–2012. Source: Own elaboration on data from Statistics Sweden. Basic map files from Statistics Sweden.
Dow
nloaded from https://academ
ic.oup.com/cjres/article/14/1/69/5934068 by U
mea U
niversity Library user on 18 May 2021
83
Labour market polarisation as a localised process
Tabl
e 3.
Log
it re
gres
sion
s on
the
diff
eren
t out
com
e pa
ttern
s fo
r th
e m
unic
ipal
ities
. Ow
n el
abor
atio
n on
dat
a fr
om S
tatis
tics
Swed
en.
12
34
56
78
9
P
OL
PO
LP
OL
UP
UP
DO
WN
DO
WN
MID
MID
Shar
e of
wor
kers
, ext
ract
ion
and
min
ing
−47
.165
−40
.191
−43
.436
31.6
57*
31.6
54*
−26
.537
−26
.553
−5.
743
−7.6
59
(34.
940)
(32.
138)
(34.
059)
(19.
180)
(18.
736)
(27.5
87)
(27.2
50)
(16.
211)
(16.
071)
Shar
e of
wor
kers
, man
ufac
turi
ng
4.83
1*2.
764
2.32
6−
3.16
6−
2.08
0−
0.29
7−
0.12
2−
1.23
5−
1.95
5
(2.5
84)
(2.7
63)
(2.9
87)
(2.1
07)
(2.3
47)
(2.4
88)
(2.8
02)
(3.4
97)
(3.8
32)
Shar
e of
wor
kers
, law
man
agem
ent a
nd
tech
nica
l −
2.86
81.
497
−3.
418
−8.
260
−12
.529
14.2
008.
789
1.82
811
.825
(20.
467)
(20.
365)
(21.
824)
(15.
580)
(16.
655)
(17.1
31)
(17.8
98)
(24.
500)
(27.2
75)
Shar
e of
pop
ulat
ion
wit
h a
bach
elor
’s
degr
ee
10.9
9712
.959
12.5
182.
269
−0.
083
−17
.359
−16
.052
0.25
37.4
85(1
1.27
6)(1
1.51
9)(1
2.29
8)(8
.656
)(9
.105
)(1
0.85
3)(1
1.33
3)(1
4.49
9)(1
4.75
4)
Shar
e of
pop
ulat
ion
in o
ccup
atio
ns r
e-qu
irin
g a
spec
ialis
ed u
nive
rsit
y di
plom
a −
17.7
26−
11.8
78−
14.1
34−
2.79
3−
0.70
023
.408
16.0
394.
770
0.59
7(1
7.751
)(1
8.14
2)(1
9.24
9)(1
3.87
2)(1
4.53
6)(1
7.169
)(1
8.05
3)(2
3.52
5)(2
3.97
7)
Shar
e of
wor
kers
, pub
lic a
dmin
istr
atio
n −
3.43
3−
6.45
0−
11.1
043.
935
5.50
2−
0.52
41.
083
−9.
559
−12
.570
(9.2
99)
(9.4
10)
(10.
186)
(7.0
30)
(7.2
15)
(9.7
69)
(10.
150)
(12.
390)
(12.
607)
Shar
e of
wor
kers
, car
e an
d so
cial
se
rvic
es
−4.
343
−8.
247
−8.
357
2.50
94.
206
1.40
33.
474
−0.
573
−0.
228
(6.6
52)
(7.0
04)
(7.3
25)
(4.9
66)
(5.1
55)
(2.4
35)
(6.6
11)
(7.7
53)
(7.9
95)
Shar
e of
exp
ense
s go
ing
to th
e pr
ivat
e se
ctor
−
2.21
1−
1.80
9−
0.59
0−
2.82
0−
3.14
82.
779
1.87
33.
875
2.58
3(3
.130
)(3
.187
)(3
.318
)(2
.262
)(2
.364
)(2
.703
)(2
.880
)(3
.340
)(3
.549
)
Shar
e of
fore
ign
born
5.04
26.
358*
4.19
8−
10.4
19**
*−
10.7
55**
*9.
324*
**10
.636
***
−8.
057
−4.
977
(3
.465
)(3
.567
)(3
.951
)(3
.546
)(4
.001
)(3
.473
)(3
.950
)(6
.605
)(6
.248
)
Shar
e of
pop
ulat
ion
abov
e re
tire
men
t ag
e −
2.75
6−
4.07
0−
2.14
2−
4.72
1−
0.49
64.
569
3.39
02.
787
−4.
877
(5.7
36)
(5.9
45)
(7.3
18)
(4.1
37)
(5.5
05)
(4.8
75)
(6.6
80)
(6.2
24)
(7.9
67)
Shar
e of
man
ual w
orke
rs a
s sh
are
of th
e m
unic
ipal
man
ufac
turi
ng e
mpl
oym
ent
6.
468*
*5.
798*
*
−1.
386
−
3.75
7
1.32
5
(2.7
16)
(2.8
40)
(2
.139
)
(2.6
39)
(3
.490
)
Mun
icip
alit
y po
pula
tion
(10
00s)
0.00
3
−0.
002
0.
003
−
0.02
5*
(0.0
03)
(0
.003
)
(0.0
03)
(0
.015
)
Popu
lati
on c
hang
e 20
02−
2012
1.
551
3.
610
−
4.73
5
−2.
196
(2
.783
)
(3.1
77)
(3
.932
)
(3.4
55)
Dow
nloaded from https://academ
ic.oup.com/cjres/article/14/1/69/5934068 by U
mea U
niversity Library user on 18 May 2021

84
Henning and Eriksson
consequently retain our original variable setup. The polarisation models, on the other hand, in-dicated significant and persistent spatial correl-ation patterns when the original variable setup is used. We therefore add a spatial dependency variable, which we call polarisation neighbours. This variable counts the number of neighbour municipalities within a 50 km radius that ex-perience polarisation.6 This variable is added to Model 3 in Table 3.
The municipalities with a higher share of manufacturing have a greater chance of experi-encing polarisation (Model 1). Adding the share of low-skill occupation in manufacturing to the regression (Model 2), we also see that the struc-tural vulnerability from manufacturing comes mainly from municipalities positioned in the middle of the value chain. The manufacturing share variable retains the sign, but turns insig-nificant, while the share of lower-skill occupa-tions within manufacturing is both positive and highly significant, also when regional controls are added (Models 2 and 3). Indeed, municipal-ities that have a high degree of manufacturing—but especially those that have high shares of low- and mid-level qualified workers within manufacturing (but still manufacturing spe-cific)—are particularly vulnerable to polar-isation. Polarising processes in neighbouring municipalities also matter. Municipalities with a high number of polarising neighbours have a significantly higher probability of experiencing polarisation themselves.
As already suggested in Table 2, there are greater complexities associated with these out-comes, which becomes obvious from Models 3 to 9, which focus on the other patterns. Share of extraction industries affects the chance of upgrading positively, while the share of foreign-born residents has a negative association with upgrading. Turning this around, municipalities with higher shares of foreign-born residents are also significantly more likely to experience downgrading trajectories (Models 6 and 7). For the middling outcome, variables give the ex-pected signs reiterating the results of Table 2,
12
34
56
78
9
P
OL
PO
LP
OL
UP
UP
DO
WN
DO
WN
MID
MID
Une
mpl
oym
ent s
hare
20
.617
1.
851
−
26.3
99
18.5
12
(1
7.269
)
(13.
769)
(1
7.204
)
(21.
534)
Pola
risa
tion
nei
ghbo
urs
0.22
1*
(0.1
18)
Con
stan
t−
0.72
2−
4.26
5−
4.50
82.
279
1.79
3−
3.29
40.
098
−2.
694
−2.
492
(2
.460
)(2
.946
)(3
.383
)(1
.827
)(2
.461
)(2
.192
)(2
.898
)(2
.821
)(3
.625
)
N29
029
029
029
029
029
029
029
029
0
Not
e: S
tand
ard
erro
rs in
par
enth
eses
.*p
< 0
.1, *
*p <
0.0
5, *
**p
< 0
.01.
Sour
ce: O
wn
elab
orat
ion
of d
ata
from
Sta
tist
ics
Swed
en.
Tabl
e 3.
Con
tinue
d
Dow
nloaded from https://academ
ic.oup.com/cjres/article/14/1/69/5934068 by U
mea U
niversity Library user on 18 May 2021

85
Labour market polarisation as a localised process
but none of them is significant (Models 8 and 9). In fact, the only significant variable on mid-dling is population size, suggesting that larger regions are less likely to experience growth in the middle of the income distribution.
To further investigate the robustness of the estimations, we run a number of additional tests. First, an obvious potential issue is how sensi-tive the results are to changing the exact defin-itions of the stylised labour market trajectories, for example, if ∆Bin3 is moved to the right side of the AND sign in the definition of upgrading municipalities. The results from these experi-ments are that the main findings all remain and are robust to the details of the classification choices. Second, adding metro dummies does not change interpretation of the results of the regressions. We also include share of women, share of young workers (<25 years) and a range of industrial employment shares (apart from manufacturing share). None of these variables changes the findings presented above, nor are any of them significant. Third, multinomial logit regressions reiterate the main outcomes.
How important, then, are the estimated effects? In Figure 5, we run the same full re-gressions as in Table 3 (Models 3, 5 and 7), but instead of the continuous explanatory vari-ables, we transform the (significant) variables of interest into high/low binary dummies based on their median value, which sorts the municipal-ities into two groups of equal size. Other vari-ables are kept in their original scales. This gives us a very straightforward interpretation of the probability impact of the variable on the par-ticular labour market trajectory probabilities. Effects on the outcomes are sizeable and ranges between 10% and 20%. For example, moving from a low to a high share of manufacturing workers in the local economy increases prob-abilities of the regional economy entering po-larisation by between 13% (with controls) and 21% (without controls), while a high share of low-qualified workers within manufacturing adds another 10–17%, depending on whether or not controls are included.
The metropolitan regionsA particular part of the regional system is the metropolitan regions. They consist of several highly interconnected and integrated munici-palities, which largely share a common labour market. A strong feature of these regions is socio-economic spatial sorting in housing, owing to variation in house prices and accommoda-tion accessibility. Because of such processes, we expect some municipalities in the metropolitan regions to be more likely to experience labour market upgrading, others downgrading. For the total regional labour market of those metropol-itan regions as aggregate, the result may well be labour market polarisation, but with strict underlying internal economic labour market differentiation in the spaces between the mu-nicipalities within the metropolitan area. Even if we have seen above that spatial dependency affects polarisation probabilities in the country as a whole, the metropolitan regions are special cases. Here, we can expect different trajectories that complement each other because the re-gions are integrated and mechanisms of spatial sorting apply (especially in housing, but also for jobs), rather than driving surrounding regions into the same trajectory because of spillovers (as in the industrial district regions).
This is exactly the pattern we find in the Stockholm metropolitan region. Table 4 dis-plays the number of municipalities within the Stockholm, Gothenburg and Malmö regions that fall under the different labour market patterns. While patterns point more towards upgrading in the Gothenburg and Malmö re-gions, Stockholm has a polarisation pattern when upgrading and downgrading municipal-ities are added together. This is in essence a case of spatial selection based on income, as can be seen from Tables 5 and 6. In Stockholm, the upgrading municipalities have significantly higher average incomes (Table 5), and lower shares of foreign-born residents (Table 6), compared with the downgrading municipal-ities. Evidence for Gothenburg is also striking,
Dow
nloaded from https://academ
ic.oup.com/cjres/article/14/1/69/5934068 by U
mea U
niversity Library user on 18 May 2021

86
Henning and Eriksson
22%
13%
18%
10%7%
2%-11% -2%
11%8%
Man
ufac
turin
g sh
are
on p
olar
iza�o
n, w
ith co
nsta
nt
Man
ufac
turin
g sh
are
on p
olar
iza�o
n, w
ith a
ll va
riabl
es
Low
-qua
lified
wor
kers
in m
anuf
actu
ring
on p
olar
iza�o
n, w
ith co
nsta
nt
Low
-qua
lified
wor
kers
in m
anuf
actu
ring
on p
olar
iza�o
n, w
ith a
ll va
riabl
es
Extr
ac�o
n in
dust
ries o
n up
grad
ing,
with
cons
tant
Extr
ac�o
n in
dust
ries o
n up
grad
ing,
with
all
varia
bles
Fore
ign
born
on
upgr
adin
g, w
ith co
nsta
nt
Fore
ign
born
on
upgr
adin
g, w
ith a
ll va
riabl
es
Fore
ign
born
on
dow
ngra
ding
, with
cons
tant
Fore
ign
born
on
dow
ngra
ding
, with
all
varia
bles
-15%
-10%
-5%
0%
5%
10%
15%
20%
25%
Figure 5. Increase in probabilities moving from ‘low’ group of municipalities (=0) to ‘high’ group of municipalities (=1), as defined by the median, of an independent variable, on labour market polarisation, upgrading and downgrading. Other vari-ables held at their means. Source: Own elaboration on data from Statistics Sweden.
Table 4. Municipal outcomes after sorting of the la-bour market patterns, displayed by metropolitan region membership.
Polar-isers
Up-graders
Downgraders Mid-dling
Greater Stockholm 12 13 1Greater Gothenburg
2 9 2
Greater Malmö 9 3
Source: Own elaboration of data from Statistics Sweden.
Table 5. Average annual wages among (1000s SEK) the municipalities assigned to a specific labour market change category, displayed by metropolitan region membership.
Average wage (1000s SEK), unweighted
Polar-isers
Up-graders
Downgraders Mid-dling
Greater Stockholm 281.8 273.3 452.1Greater Gothenburg 259.0 255.7 240.0 Greater Malmö 245.1 263.6
Source: Own elaboration of data from Statistics Sweden.
Dow
nloaded from https://academ
ic.oup.com/cjres/article/14/1/69/5934068 by U
mea U
niversity Library user on 18 May 2021

87
Labour market polarisation as a localised process
where the polarising regions have far higher shares of foreign-born residents in the popu-lation. Overall, however, both Malmö and Gothenburg are dominated much more by in-come upgrading than is the more differentiated Stockholm region.
Conclusions
The present article uses geographical data to add to the literature on the polarising labour market in Western economies (Åberg, 2015; Lindley and Machin, 2014). While there are some geographical studies on the topic, the article shows that there is considerable spatial heterogeneity underlying national polarisation patterns. Based on recent literature, this is of course partly expected. In a long-term analysis of regional and interpersonal income equalities in the USA, Rey (2018) shows how global in-equality measures can obscure very different local patterns. Here, we have been particularly concerned with the geographies of polarisation. The method we have designed to investigate this is easy to apply to other countries and is not particularly data demanding.
In all, local polarisation (on the municipal level) seems to be closely linked to devel-opments in the manufacturing sector rather than primarily attributed to growth in KIBS and/or low-skilled personal services in large urban regions. Municipalities with high shares
of manufacturing activities—but particularly those with high shares of workers in construc-tion, manufacturing and transportation jobs that do not require a university degree—are especially likely to experience polarisation. This could be a result of globalisation and de-industrialisation, but given our regression results and previous waves of offshoring from Sweden, we are more inclined towards a techno-logical explanation. As new technologies and business models transform manufacturing in high-cost countries, firms have less use for rela-tively low-skilled but relatively high-salaried mid-segment manufacturing workers. Echoing Oesch and Piccitto’s (2019) recent findings on a national scale, the current labour market re-alignments seem to negatively affect regions dominated by mid-value chain activities in manufacturing, which leads to erosion of the working class in particular.
Our study develops previous findings by showing that national aggregates are not based on simple upscaling of regionally homogenous developments. Polarisation does not happen everywhere. Quite the contrary, national la-bour market polarisation is a jigsaw puzzle of regionally distinct polarisation, upgrading, downgrading and middling trajectories. Indeed, polarising as well as upgrading, downgrading and municipalities with a growing middle job segment can all be found in the Swedish re-gional system. However, the findings on labour market trajectories are also an issue of geo-graphical scale. First, while neither upgrading, downgrading nor middling trajectories seem to be affected by spatial spillovers, there is some degree of spatial clustering of polarising muni-cipalities. If neighbours are polarising, a munici-pality runs a higher risk of also being a polariser. This interdependency may arise because of commuter effects, or even more likely, because the main affecting variables—manufacturing presence and share of workers in manual oc-cupations—tend to be spatially clustered too. Second, owing to spatial selection patterns, or
Table 6. Mean shares (%) of foreign born among the mu-nicipalities assigned to a specific labour market change cat-egory, displayed by metropolitan region membership.
Share (%) of foreign born
Polar-isers
Up-graders
Downgraders Mid-dling
Greater Stockholm 12.6 18.7 12.8Greater Gothenburg 16 8.1 8.6 Greater Malmö 10 12.9
Source: Own elaboration of data from Statistics Sweden.
Dow
nloaded from https://academ
ic.oup.com/cjres/article/14/1/69/5934068 by U
mea U
niversity Library user on 18 May 2021

88
Henning and Eriksson
even spatial segregation, polarisation in the pri-mary metropolitan region of Stockholm is only visible when the labour market development trajectories of the municipalities in the region are added together.
In fact, many municipalities in Sweden, and a substantial part of the population, are still ex-periencing the traditional upgrading patterns in their immediate regional context, as antici-pated in the traditional Swedish labour market model. In the period we investigate, especially regions that have higher shares of extraction industries show more tendencies towards up-grading. This mirrors a period of relative expan-sion in extraction-rich regions such as Kiruna and Gällivare in the far north. On the other hand, demographic factors (for example, shares of foreign-born residents) as well as structural factors (for example, manufacturing shares) pri-marily affect which municipalities experience labour market downgrading. We do not know the exact reasons for this, and lessons from the labour literature are still inconclusive (Tibajev, 2016). Naturally, the group of ‘foreign-born’ residents is as heterogeneous as the world itself, with different skills, education levels and experi-ences represented. Nevertheless, although the direction of causality cannot be determined in the present analysis, our data show disquieting associations between regional shares of foreign-born residents and labour market downgrading. This might be driven either by supply chocks that put pressure on wages or by spatial sorting of foreign-born residents into less buoyant re-gions, with low-paid service jobs replacing middle-income manufacturing jobs. Regardless, this calls for efforts to improve the absorptive capacity of the labour market in these munici-palities (Hane-Weijman et al., 2018). This is es-pecially relevant, as observers have repeatedly pointed at labour migration into Sweden as a way to overcome projected future skill deficits. As shown on the macro-scale, expanding economies are far more likely to integrate foreign-born individuals without expanding the
low-wage sector (Andersson et al., 2019). It is thus reasonable to expect similar processes on a regional scale.
Our analysis of labour market polarisa-tion focuses on a period when many Western economies experienced spectacular trends of regional divergence. While some degree of la-bour market polarisation may be expected in times of high growth and rapid technological change, the results are nevertheless cause for great concern from a social perspective. Parts of the workforce in municipalities that have ex-perienced rapid manufacturing change—and that have welcomed high shares of immigrants to Sweden—are falling behind on the new job markets, where not everyone can expect job upgrading to predominate. This calls for polit-ical attention and adds yet another aspect to the current debate on the link between indus-trial and economic regional change, on the one hand, and highlights the concern for political polarisation and discontent challenging es-tablished post-war political structures around Europe as well as calls for a new ‘place-sensitive distributed development policy’, on the other hand (Iammarino, 2019; Rodríguez-Pose, 2018; Storper, 2018).
Our results are closely tied to this debate, as polarisation and restructuring of manufacturing seems to go hand in hand. Nevertheless, la-bour market changes look very different in dif-ferent regions, even as the labour market in the country as a whole tends to experience polar-isation, which calls for different types of policy interventions. In job-upgrading municipalities, the labour market policies could, on the one hand, concentrate on optimising already pro-ductive processes. To prevent increasing labour market polarisation in some regions and mu-nicipalities, however, politicians should take a closer look at, and devote policies to, pro-moting more productive structural change in de-industrialising municipalities and facilitating integration of parts of the vulnerable segments of the labour force. In these municipalities,
Dow
nloaded from https://academ
ic.oup.com/cjres/article/14/1/69/5934068 by U
mea U
niversity Library user on 18 May 2021

89
Labour market polarisation as a localised process
inclusive educational efforts and regional training centres are needed to create upgrading mechanisms. The greatest causes for concerns, however, are probably created by the labour markets of the growing metropolitan regions. The growth of Stockholm in particular has re-sulted in polarised segregation—but the extent of this polarisation only becomes apparent when the labour market patterns of intercon-nected municipalities are added together.
We believe that policies aimed at preventing divergence are particularly warranted when spatial segregation and labour market polarisa-tion co-occur. Spatial segregation has long been a fact in most metropolitan areas, and some de-gree of heterogeneity is probably unavoidable. But with increasing labour market polarisation, urban spaces are likely to diverge even further in a globalising post-industrial economy. From this perspective, the national polarisation tra-jectories studied previously tend to obscure re-gional patterns and variations. It is, however, of ever-increasing importance that we understand the regional labour market challenges in a glo-balised, and seemingly more unequal, economy.
Endnotes
1 Alternative specifications excluding only the top and bottom 5%, or using the entire sample did not change the regional results presented in this article.2 We use annual wages because numbers of hours worked are not available in the Swedish individual-level datasets. The drawback of this strategy is the downward bias for occupations where considerable parts of the labour force work part-time (especially in parts of the public sector). On the other hand, the average wages represent what people in the different jobs actually earn. Since we exclude the top and bottom percentiles (step two), those who work very few hours in each job also do not impact the average wage calculated.3 A common critique against this strategy is that it ignores potential relative wage changes between jobs, i.e. that a job can increase (or decrease) its mean wage relative to other jobs, and thus change
position in the distribution. However, in previous work on wage changes between 2008 and 2013, we have found that the correlation between median job wages was 0.93 for the Swedish case (Henning et al., 2016). It is uncommon that a job makes a relative ‘career’ over time, at least in the Swedish case. One reason for this stability could be the strongly struc-tured institutional system surrounding the central wage negotiations in Sweden. These are performed in rounds, where the manufacturing industries set a target level. Even if there is scope for individual wage negotiation components, it could well be the case that this system prevents or hinders occupations overtaking others in terms of wage, at least in the medium run. It also results in the fact that wage cuts in nominal wages, are extremely rare.4 Δ represents change between 2002 and 2012.5 We have also calculated population-weighted means, but these do not change the basics of our findings.6 We select 50 km as a cut-off for the spatial effects of polarisation because according to the Swedish trans-port authority, the average car commuter in Sweden has a commuting distance of 27 km to work (re-ported at https://www.svt.se/nyheter/inrikes/sa-lang-ar-resan-till-jobbet). Hence, a 50 km radius should capture the vast majority of the extra-municipality labour market effects, while still introducing a limited degree of artificially created spatial autocor-relation effects.
Acknowledgements
The authors thank two anonymous reviewers, the editors, participants at the sixth Cambridge Journal of Regions, Economy and Society Conference ‘Rethinking the Political Economy of Place’ (2019) and the Regional Studies Annual Conference 2019 in Santiago de Compostela, as well as participants in seminars at JIBS Jönköping University and CIBS Gothenburg University (2019) for generous and constructive comments. This research was supported by Länsförsäkringar Alliance Research Foundation (Länsförsäkringars forskningsfond) (project: Svensk regionalekonomisk utveckling och omvandling) (MH) and the Marianne and Marcus Wallenberg Foundation (grant number 2017.0042) (RHE).
Dow
nloaded from https://academ
ic.oup.com/cjres/article/14/1/69/5934068 by U
mea U
niversity Library user on 18 May 2021

90
Henning and Eriksson
References
Åberg, R. (2013) Tjugohundratalets arbetsmarknad – Fortsatt uppkvalificering eller jobbpolarisering, Ekonomisk Debatt, 2013(2): 6–15.
Åberg, R. (2015) Svensk arbetsmarknad mot polarisering efter millenieskiftet, Arbetsmarknad och arbetsliv, 21(4): 8–25.
Adermon, A. and Gustavsson, M. (2015) Job polarization and task-biased technological change: Evidence from Sweden, 1975–2005, The Scandinavian Journal of Economics, 117(3): 878–917.
Alonso, W. (1980) Five bell shapes in development, Papers of the Regional Science Association, 45(1): 5–16.
Andersson, L.-F., Eriksson, R. H. and Scocco, S. (2019) Refugee immigration and the growth of low-wage work in the EU15, Comparative Migration Studies, 7(1):39.
Asplund, R., Barth, E., Lundborg, P. and Misje Nilsen, K. (2011) Polarization of the Nordic labour markets, Finnish Economic Papers, 24(2): 87–110.
Autor, D. H. and Dorn, D. (2013) How technology wrecks the middle class, The New York Times, 25 August 2013, New York Edition. Available online at: https://opinionator.blogs.nytimes.com/2013/08/24/how-technology-wrecks-the-middle-class/.
Autor, D. H., Katz, L. F. and Kearney, M. S. (2006) The polarization of the U.S. labour market, American Economic Review, 96(2): 198–194.
Autor, D. H., Levy, F. and Murnane, R. J. (2003) The skill content of recent technological change: An empirical exploration, The Quarterly Journal of Economics, 118(4): 1279–1333.
Bárány, Z. and Siegel, C. (2018) Job polarization and structural change, American Economic Journal: Macroeconomics, 10(1): 57–89.
Bevelander, P. (1999) The employment integration of immigrants in Sweden, Journal of Ethnic and Migration Studies, 25(3): 445–468.
Breau, S. and Saillant, R. (2016) Regional income disparities in Canada: Exploring the geograph-ical dimensions of an old debate, Regional Studies, Regional Science, 3(1): 463–481.
Daunfeldt, S.-O., Johansson, D. and Seerar Westerberg, H. (2018) Which firms provide jobs for unemployed non-Western immigrants? The Service Industries Journal, 39(9-10): 762–778.
Dicken, P. (2015) Global Shift. Mapping the Contours of the World Economy. London: Sage.
Dwyer, R. E. (2013) The care economy? Gender, economic restructuring, and job polarization in
the U.S. labour market, American Sociological Review, 78(3): 390–416.
Enflo, K. and Henning, M. (2016) The develop-ment of economic growth and inequality among the Swedish regions 1860–2010: Evidence from regional national accounts. In J. Ljungberg (ed.) Structural Analysis and the Process of Economic Development. Essays in Memory of Lennart Schön, pp. 126–148. London: Routledge.
Eriksson, R. H. and Hane-Weijman, E. (2017) How do regional economies respond to crises? The geography of job creation and destruction in Sweden (1990–2010), European Urban and Regional Studies, 24(1): 87–103.
Eriksson, R. H. and Hansen, H. K. (2013) Industries, skills, and human capital: How does regional size affect uneven development? Environment and Planning A, 45(3): 593–613.
Fernández-Macías, E. (2012) Job polarization in Europe? Changes in the employment structure and job quality, 1995–2007, Work and Occupations, 39(2): 157–182.
Fernández-Macías, E. and Hurley, J. (2017) Routine-biased technical change and job polarization in Europe, Socio-Economic Review, 15(3): 563–585.
Florida, R. (2002) The Rise of the Creative Class: And How It’s Transforming Work, Leisure, Community and Everyday Life. New York: Basic Books.
Florida, R. (2005) The Flight of the Creative Class: The New Global Competition for Talent. New York: Harper Business.
Fölster, S. (2014) Vartannat Jobb Automatiseras Inom 20 år – Utmaningar för Sverige. Stockholm: Stiftelsen för strategisk forskning.
Frey, C. B. and Osborne, M. A. (2017) The future of employment: How susceptible are jobs to compu-terisation? Technological Forecasting and Social Change, 114: 254–280.
Goos, M. and Manning, A. (2007) Lousy and lovely jobs: The rising polarization of work in Britain, The Review of Economics and Statistics, 89(1): 118–133.
Goos, M., Manning, A. and Salomons, A. (2009) Job polarization in Europe, American Economic Review, 99(2): 58–63.
Goos, M., Manning, A. and Salomons, A. (2014) Explaining job polarization: Routine-biased tachnological change and offshoring, American Economic Review, 104(8): 2509–2526.
Hane-Weijman, E., Eriksson, R. H. and Henning, M. (2018) Returning to work: Regional determin-ants of re-employment after major redundancies, Regional Studies, 52(6): 768–780.
Henning, M. (2020) Regional labour flows between manufacturing and business services: Reciprocal
Dow
nloaded from https://academ
ic.oup.com/cjres/article/14/1/69/5934068 by U
mea U
niversity Library user on 18 May 2021

91
Labour market polarisation as a localised process
integration and uneven geography, European Urban and Regional Studies, 27(3): 290–302.
Henning, M., Borggren, J., Boström Elias, J., Enflo, K. and Lavén, F. (2016) Strukturomvandling och Automatisering. Konsekvenser på Regionala Arbetsmarknader. Göteborg: Västra Götalandsregionen and Malmö: Region Skåne.
Heyman, F. (2016) Job polarization, job tasks and the role of firms, Economics Letters, 145: 246–251.
Iammarino, S., Rodríguez-Pose, A. and Storper, M. (2019) Regional inequality in Europe: Evidence, theory and policy implications, Journal of Economic Geography, 19 (273–298).
Lindley, J. and Machin, S. (2014) Spatial changes in labour market inequality, Journal of Urban Economics, 79: 121–138.
LO (2003) Den nya Underklassen – Utrikes födda på den Svenska Arbetsmarknaden. Stockholm: Landsorganisationen.
LO (2014) Den ‘nya’ Strukturomvandlingen? Jobbpolariseringen och Konkurrensen om Jobben. Stockholm: Landsorganisationen.
Lundquist, K.-J., Olander, L. O. and Henning, M. S. (2008b) Producer services: Growth and roles in long-term economic development, The Service Industries Journal, 28(4): 463–477.
Lundquist, K.-J., Olander, L.-O. and Svensson Henning, M. (2008a) Decomposing the technology shift: Evidence from the Swedish manufacturing sector, Tijdschrift voor economische en sociale geografie, 99(2): 145–159.
Martynovich, M. and Lundquist, K. J. (2016) Technological change and geographical realloca-tion of labour: On the role of leading industries, Regional Studies, 50(10): 1633–1647.
OECD (2017) International Migration Outlook 2017. Paris: OECD Publishing.
Oesch, D. and Piccitto, G. (2019) The polariza-tion myth: Occupational upgrading in Germany, Spain, Sweden and the UK, 1992–2015, Work and Occupations, 46(4): 441–469.
Ottaviano, G. and Peri, G. (2012) Rethinking the effects of immigration on wages, Journal of the European Economic Association, 10(1): 152–197.
PBL (2019) Available online at: https://themasites.pb l .n l / verdee lde - t r iomf -banengroe i -en-economische-ongelijkheid/.
Rey, S. J. (2018) Bells in space: The spatial dynamics of us interpersonal and interregional income in-equality, International Regional Science Review, 41(2): 152–182.
Rodríguez-Pose, A. (2018) The revenge of the places that don’t matter (and what to do about it), Cambridge Journal of Regions, Economy and Society, 11(1): 189–209.
Rosés, J. and Wolf, N. (2019) Regional Economic Development in Europe, 1900–2010: A Description of the Patterns. London: Routledge.
Sassen, S. (1991) The Global City: New York, London, Tokyo. New Jersey: Princeton University Press.
Scott, A. J. (2019) City-regions reconsidered, Environment and Planning A Economy and Space, 51(3): 554–580.
Stentoft, J., Olhager, J., Heikkilä, J. and Thoms, L. (2016) Manufacturing backshoring: A system-atic literature review, Operations Management Research, 9: 53–61.
Storper, M. (2018) Separate Worlds? Explaining the current wave of regional economic polarization, Journal of Economic Geography, 18: 247–270.
Svensson Henning, M. (2009) Industrial Dynamics and Regional Structural Change. Geographical Perspectives on Economic Evolution. Lund: Avhandlingar CLXXXI, Meddelanden Från Lunds Universitets Geografiska Institution.
Tibajev, A. (2016) Utrikes födda på arbetsmarknaden i Sverige: en forskningsöversikt. TheMES. Linköping: REMESA Institute for Research on Migration, Ethnicity and Society, Linköping University.
Turchick Hakak, L. and Al Kriss, A. (2013) Vulnerable work and international migrants: A re-lational human resource management perspective, The International Journal of Human Resource Management, 24(22): 4116–4131.
Wixe, S. and Andersson, M. (2017) Which types of re-latedness matter in regional growth? Industry, occupa-tion and education, Regional Studies, 51(4): 523–536.
Dow
nloaded from https://academ
ic.oup.com/cjres/article/14/1/69/5934068 by U
mea U
niversity Library user on 18 May 2021