biogeochemistry: a lowdown on oxygen
TRANSCRIPT
There are two big questions about theearly history of oxygen-producing —oxygenic — photosynthesis. When did
it start? And why did it apparently then takeso long to push atmospheric concentrationsof oxygen to their present levels? The firstquestion has a specific answer, yet to bepinned down precisely. The second questionprobably has several answers, relating toprocesses rather than to any point in time.And they must be fundamental, to say theleast. On page 159 of this issue1, Bjerrum andCanfield give us something fundamental tothink about. Specifically, they provide newevidence for low concentrations of dissolvedphosphate in Earth’s early oceans. By limit-ing the growth of algae, low phosphate levelswould have significantly weakened the bio-logical source of O2.
Dates nominated for the beginning of oxygenic photosynthesis range from 3.5 billion to 2.75 billion years ago. The earlierlimit is based on an interpretation of micro-fossil forms and the textures of stromatolites— sedimentary structures that have beeninterpreted as cyanobacterial mats dating tothat time (see ref. 2 for review). Cyanobacteriaare microorganisms that are capable of oxy-genic photosynthesis, and are thought to have been the main producers of oxygen for much of Earth’s history. However, the 3.5-billion-year-old deposits are being re-assessed, and the view that they containcyanobacteria is not likely to survive3,4. Thelater date was based originally on an inter-pretation of the carbon-isotope record5 buthas since been buttressed by the identification,in related sediments, of molecular-carbonskeletons that are characteristic of cyanobac-teria and even more complex oxygenic photo-synthetic organisms6. So, although the earlierdate may yet prove to be correct, 2.75 billionyears is probably a reliable minimum age forthe advent of oxygenic photosynthesis.
By most interpretations, it then took wellover two billion years for concentrations ofoxygen in the atmosphere to reach modernlevels. The most profound indicator of whenthese levels were reached is the evolution ofanimals with complicated body plans thatrequire the diffusion of oxygen across severallayers of cells. Such animals appeared onlyaround 600 million years ago, and the factthat they did not evolve earlier is often attrib-uted to low levels of oxygen7. There is alsoplenty of geochemical evidence that oxygen
levels were indeed low before that time. Inother work, Canfield8 has shown that deepocean waters probably contained persistenttraces of hydrogen sulphide between 1.8 billion and 0.6 billion years ago. If this is true, it shows that oxygen concentrations insurface waters (and in the atmosphere) werenot high enough to drive O2 into deeperwaters, where it would spontaneously oxi-dize the hydrogen sulphide.
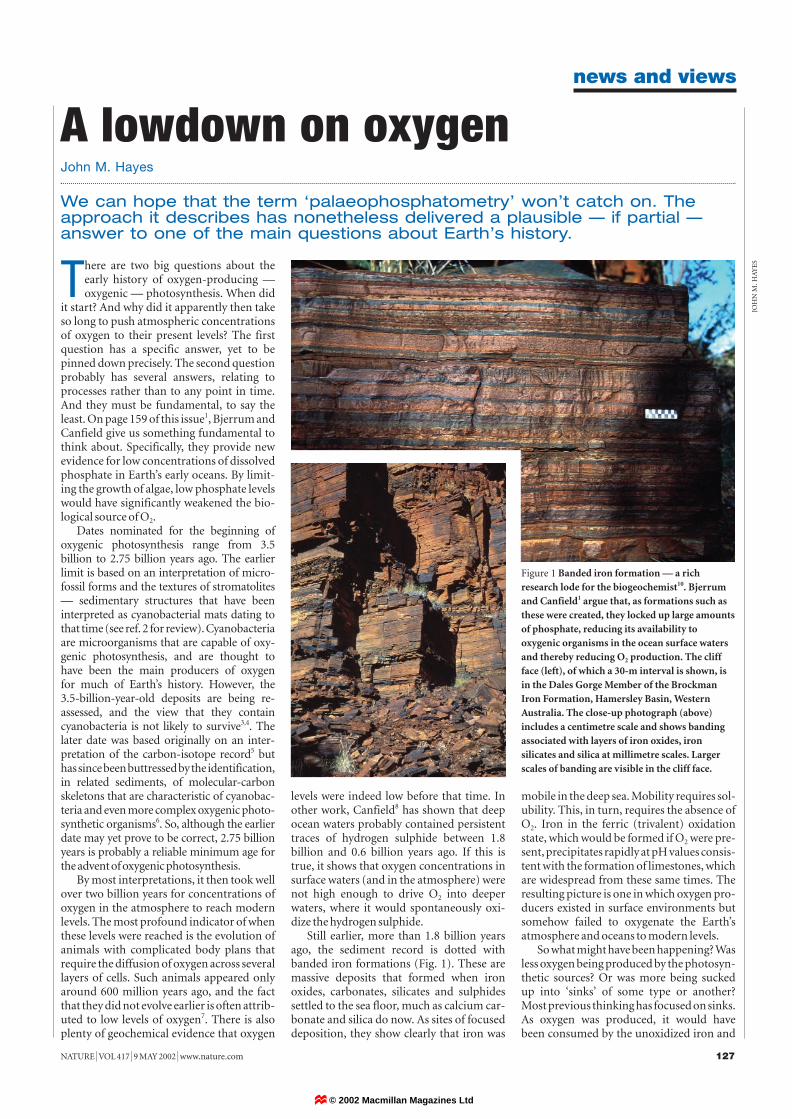
Still earlier, more than 1.8 billion yearsago, the sediment record is dotted withbanded iron formations (Fig. 1). These aremassive deposits that formed when ironoxides, carbonates, silicates and sulphidessettled to the sea floor, much as calcium car-bonate and silica do now. As sites of focuseddeposition, they show clearly that iron was
mobile in the deep sea. Mobility requires sol-ubility. This, in turn, requires the absence ofO2. Iron in the ferric (trivalent) oxidationstate, which would be formed if O2 were pre-sent, precipitates rapidly at pH values consis-tent with the formation of limestones, whichare widespread from these same times. Theresulting picture is one in which oxygen pro-ducers existed in surface environments butsomehow failed to oxygenate the Earth’satmosphere and oceans to modern levels.
So what might have been happening? Wasless oxygen being produced by the photosyn-thetic sources? Or was more being sucked up into ‘sinks’ of some type or another? Most previous thinking has focused on sinks.As oxygen was produced, it would have been consumed by the unoxidized iron and
NATURE | VOL 417 | 9 MAY 2002 | www.nature.com 127
news and views
A lowdown on oxygenJohn M. Hayes
We can hope that the term ‘palaeophosphatometry’ won’t catch on. Theapproach it describes has nonetheless delivered a plausible — if partial —answer to one of the main questions about Earth’s history.
Figure 1 Banded iron formation — a richresearch lode for the biogeochemist10. Bjerrumand Canfield1 argue that, as formations such asthese were created, they locked up large amountsof phosphate, reducing its availability tooxygenic organisms in the ocean surface watersand thereby reducing O2 production. The cliffface (left), of which a 30-m interval is shown, isin the Dales Gorge Member of the BrockmanIron Formation, Hamersley Basin, WesternAustralia. The close-up photograph (above)includes a centimetre scale and shows bandingassociated with layers of iron oxides, ironsilicates and silica at millimetre scales. Largerscales of banding are visible in the cliff face.
JOH
N M
. HA
YE
S
© 2002 Macmillan Magazines Ltd

sulphur being delivered to the ocean byweathering and erosion of the earliest rocks.It would have taken time to saturate thissource of unoxidized material — at least aslong as it takes for several global cycles of erosion and deposition to take place (some-thing like 600 million years). But the recordsare not good enough, either in terms of thetotal inventories or of the rates of delivery ofiron and sulphur, to develop a satisfyinglyquantitative view of the dynamic role of sinks.
In 1984, Holland9 provided the clearestoutline to date of the geochemical dynamicsof oxygen on the early Earth. In doing so, hestressed that levels of O2 would be controlleddynamically by balances between sources andsinks, and he raised the specific possibility thatthe strength of the source might be limited: “Itis instructive to see how the marine geochem-istry of phosphorus might have exercised adominant control on biological productivityand on the oxygen content of the Precambrianatmosphere.” The logic is straightforward: theproduction of O2 requires cells; cells requirenucleic acids and phospholipids; these com-pounds cannot be synthesized, and O2 cannotbe produced, without a supply of phosphate;limiting that supply can therefore limit theproduction of O2.
It is this idea that Bjerrum and Canfield1
have now quite beautifully extended. To esti-mate the abundance of phosphate in ancientoceans, they have taken another look at thebanded iron formations, not only viewingthem as sinks for O2, but also pointing to the concentrations of phosphate that theycontain. The surfaces of iron-rich mineralsadsorb phosphate strongly, and this ad-sorption can be described in terms of a distribution coefficient. Given the value ofthis coefficient (determined from observa-tions of modern iron-rich precipitates),Bjerrum and Canfield have estimated theconcentration of phosphate in ancient seawater. The answer turns out to be 0.15–0.6micromolar, very much lower than the mod-ern value of 2.3 micromolar. By consideringlikely balances, the authors show that thislow concentration could be due to the pre-cipitation of the banded iron formations,which would have created a huge sink forphosphate. As the phosphate was adsorbed,carried to the sea floor and buried underaccumulating sediments, it would not beavailable as a nutrient for cyanobacteria.
To calibrate their ‘phosphatometer’ andobtain a relationship between phosphate insea water and in iron-rich precipitates, Bjer-rum and Canfield have referred to studies ofhydrothermal precipitates forming in themodern ocean. It is not certain that these precipitates accurately represent the particlesthat were present in the ancient oceans, nor isit certain that current concentrations of phos-phate in iron formations faithfully representthose that were initially present. But it isunreasonable to ask for certainty about such
details at a distance of two billion years ormore. The new work makes a strong case thatconcentrations of phosphate in the oceanbetween 3.2 billion and 1.8 billion years agowere distinctly lower than at present.
The authors themselves raise a furtherquestion. Deposition of banded iron forma-tions ceased about 1.8 billion years ago. Whathappened to the balance between oxygensources and sinks then? If phosphate hadbeen the limiting nutrient and its concentra-tions increased, did some other nutrient justhappen to step into the limiting role? Themost obvious candidates are nitrate and,given the possibility that metal ions wereswept from deep ocean waters by precipita-tion as sulphides, iron itself. �
John M. Hayes is in the Department of Geology and
Geophysics, Woods Hole Oceanographic Institution,360 Woods Hole Road, Woods Hole, Massachusetts02543-1539, USA.e-mail: [email protected]
1. Bjerrum, C. J. & Canfield, D. E. Nature 417, 159–162 (2002).
2. Buick, R. in Palaeobiology II (eds Briggs, D. E. G. & Crowther,
P. R.) 13–21 (Blackwell Science, Oxford, 2001).
3. Schopf, J. W. et al. Nature 416, 73–76 (2002).
4. Brasier, M. D. et al. Nature 416, 76–81 (2002).
5. Hayes, J. M. in Early Life on Earth: Nobel Symposium 84 (ed.
Bengston, S.) 220–236 (Columbia Univ. Press, New York, 1994).
6. Brocks, J. J., Logan, G. A., Buick, R. & Summons, R. E. Science
285, 1033–1036 (1999).
7. Runnegar, B. Palaeogeogr. Palaeoclimatol. Palaeoecol.
(Glob. Planet. Change) 97, 97–111 (1991).
8. Canfield, D. E. Nature 396, 450–453 (1998).
9. Holland, H. D. The Chemical Evolution of the Atmosphere and
Oceans 413–420 (Princeton Univ. Press, New Haven,
Connecticut, 1984).
10.Klein, C. & Beukes, N. J. in Proterozoic Crustal Evolution
(ed. Condie, K. C.) 383–418 (Elsevier, Amsterdam, 1993).
news and views
128 NATURE | VOL 417 | 9 MAY 2002 | www.nature.com
The love affair between a left-handed-twisting plant, bindweed, entwiningthe right-handed-twisting honeysuckle
was doomed when a bee told them to consid-er their offspring:
Poor little sucker, how will it learnWhen it is climbing, which way to turn?Right — left — what a disgrace!Or it may go straight up and fall flat on itsface!*
And the honeysuckle and bindweed areengraved in the minds of botanists as well asmusic lovers. There are numerous twisting ortwining plants; the shoots of some turn to theright (clockwise) while others twist to the left(anticlockwise). External conditions such aslight, heat or humidity cannot influence thisasymmetry. As Austrian botanist AntonKerner von Marilaun wrote1, the shoot “con-tinues to twist and twine according to aninnate tendency inherited from generation togeneration, and we can only refer the differ-ent directions of twisting to internal causes,to the peculiar constitution of the living protoplasm in each particular plant”.
On page 193 of this issue, Thitamadeeand colleagues2 put these observations on amolecular footing. The thale cress Arabidop-sis thaliana is usually ‘straight’, but theauthors have identified mutant Arabidopsisplants with shoots and roots that twist to theleft. They have called the mutation lefty, and
found that it compensates for the right-handed twist of the previously known Ara-bidopsis mutation spiral1 — so an anticlock-wise plus a clockwise twist equals a straightplant. The authors tracked down the muta-tion in lefty plants specifically to one of thetwo major proteins that make up subcellularfilaments called microtubules.
In a typical root, files of cells extendingaway from the root tip are produced by thesuccessive division of precursor cells in astructure known as the meristem, near thetip. In normal Arabidopsis plants, cell files inthe root epidermis (the outer layer of cells)are straight, but, as Thitamadee et al.2 show,in the lefty mutants these files are twistedanticlockwise. In normal plants the micro-tubules in the cell periphery form a randompattern in meristem cells; in the elongatedcells further from the root tip microtubulesare arranged at right angles to the long axis ofthe cell. By contrast, in the lefty mutants2 themicrotubules in the elongated epidermalcells are offset at a different angle to the longaxis, and form right-handed helical arrays.
It has long been thought that micro-tubules guide the deposition of the fibres that constitute the plant cell wall, and thatthe fibres lie parallel to the microtubules(although there are exceptions). The cell wallmaintains the cell’s shape, which is deter-mined by the underlying microtubules. Off-setting the angle of the microtubules to formright-handed helices may offset the orienta-tion of the fibres that make up the cell wall,resulting in a twist that is propagated along acell file. This is probably the underlying
Cytoskeleton
Microtubules do the twistPatrick J. Hussey
As plant life diversified during evolution there would have been intensecompetition for light, making the ability to twist and climb advantageous. Asubcellular filamentous network can create the twist seen in climbing plants.
*From Flanders and Swann’s song Misalliance, reproduced by
permission of the Estates of Michael Flanders and Donald Swann
2002.
© 2002 Macmillan Magazines Ltd