biodegradable luminescent porous silicon … porous silicon film was placed in deionized (di) water...
TRANSCRIPT
SUPPLEMENTARY INFORMATIONdoi: 10.1038/nmat2398
nature materials | www.nature.com/naturematerials 1
Manuscript NM08091680A
SUPPLEMENTARY INFORMATION:
Biodegradable luminescent porous silicon nanoparticles for in
vivo applications
Ji-Ho Park, Luo Gu, Geoffrey von Maltzahn, Erkki Ruoslahti, Sangeeta N. Bhatia, &
Michael J. Sailor
2 nature materials | www.nature.com/naturematerials
SUPPLEMENTARY INFORMATION doi: 10.1038/nmat2398Manuscript NM08091680A
SUPPLEMENTARY METHODS
Preparation of luminescent porous silicon nanopartiels (LPSiNP). Porous silicon
samples were prepared by electrochemical etch of a single-crystal, (100)-oriented p-type
silicon wafer (0.8-1.2 m cm, Siltronix) by application of a constant current density of
200 mA/cm2 for 150 s in a 3:1 (v/v) electrolyte of 48 % aqueous HF/ethanol. A
freestanding film of the porous silicon nanostructure was then removed from the
crystalline silicon substrate by application of a current pulse of 4 mA/cm2 for 250 s in a
solution of 3.3% (by volume) 48 % aqueous HF in ethanol. The freestanding hydrogen-
terminated porous silicon film was placed in deionized (DI) water and fractured into
multi-sized particles by sonication overnight. The particles were then filtered through a
0.22 m filtration membrane (Millipore). The nanoparticles were further incubated in DI
water for ~ 2 weeks to activate their luminescence in the near-infrared range. Finally, in
order to remove dissolved silicic acids during the activation and obtain porous silicon
nanoparticles in a size range of 20-200 nm, the activated nanoparticles were spun down
in DI water at 14,000 rpm for 30 min, the supernatant containing silicic acids and smaller
nanoparticles (< 20 nm) was removed.
For LPSiNP with different porous nanostructures, porous Si samples were
prepared by electrochemical etch of a single-crystal, (100)-oriented p-type silicon wafer
(0.8-1.2 m cm, Siltronix) by application of a constant current density of 50 mA/cm2 for
300 s, 200 mA/cm2 for 150 s or 400 mA/cm2 for 150 s in a 3:1 (v/v) electrolyte of 48 %
aqueous HF/ethanol. A freestanding film of the porous silicon nanostructure was then
removed from the crystalline silicon substrate by application of a current pulse of 4
mA/cm2 for 250 s in a solution of 3.3% (by volume) 48 % aqueous HF in ethanol. The
nature materials | www.nature.com/naturematerials 3
SUPPLEMENTARY INFORMATIONdoi: 10.1038/nmat2398Manuscript NM08091680A
SUPPLEMENTARY METHODS
Preparation of luminescent porous silicon nanopartiels (LPSiNP). Porous silicon
samples were prepared by electrochemical etch of a single-crystal, (100)-oriented p-type
silicon wafer (0.8-1.2 m cm, Siltronix) by application of a constant current density of
200 mA/cm2 for 150 s in a 3:1 (v/v) electrolyte of 48 % aqueous HF/ethanol. A
freestanding film of the porous silicon nanostructure was then removed from the
crystalline silicon substrate by application of a current pulse of 4 mA/cm2 for 250 s in a
solution of 3.3% (by volume) 48 % aqueous HF in ethanol. The freestanding hydrogen-
terminated porous silicon film was placed in deionized (DI) water and fractured into
multi-sized particles by sonication overnight. The particles were then filtered through a
0.22 m filtration membrane (Millipore). The nanoparticles were further incubated in DI
water for ~ 2 weeks to activate their luminescence in the near-infrared range. Finally, in
order to remove dissolved silicic acids during the activation and obtain porous silicon
nanoparticles in a size range of 20-200 nm, the activated nanoparticles were spun down
in DI water at 14,000 rpm for 30 min, the supernatant containing silicic acids and smaller
nanoparticles (< 20 nm) was removed.
For LPSiNP with different porous nanostructures, porous Si samples were
prepared by electrochemical etch of a single-crystal, (100)-oriented p-type silicon wafer
(0.8-1.2 m cm, Siltronix) by application of a constant current density of 50 mA/cm2 for
300 s, 200 mA/cm2 for 150 s or 400 mA/cm2 for 150 s in a 3:1 (v/v) electrolyte of 48 %
aqueous HF/ethanol. A freestanding film of the porous silicon nanostructure was then
removed from the crystalline silicon substrate by application of a current pulse of 4
mA/cm2 for 250 s in a solution of 3.3% (by volume) 48 % aqueous HF in ethanol. The
Manuscript NM08091680A
freestanding hydrogen-terminated porous silicon film was placed in deionized (DI) water
and fractured into multi-sized particles by sonication overnight. The particles were then
filtered through a 0.22 m filtration membrane (Millipore). The nanoparticles were
further incubated in DI water for ~ 2 weeks to activate their luminescence in the near-
infrared range. Finally, in order to remove dissolved silicic acid and obtain porous
silicon nanoparticles in a size range of 20-200 nm, the activated nanoparticles in DI water
were spun down at 14,000 rpm for 30 min, the supernatant containing silicic acid and
non-porous smaller nanoparticles (< 20 nm) was removed.
For LPSiNP with different sizes, the particles were then filtered through a 0.45
m filtration membrane (Millipore) after overnight sonication process. The nanoparticles
were further incubated in DI water for ~ 2 weeks to activate their luminescence in the
near-infrared range. First, LPSiNP with larger sizes (hydrodynamic size = ~ 270.3 nm)
were obtained by centrifugation at low speed (at 6,000 rpm for 10 min) and removal of
the supernatant. The nanoparticles were then filtered through a 0.22 m filtration
membrane. Secondly, LPSiNP with medium size (hydrodynamic size = ~ 125.7 nm,
which are the LPSiNP used mainly in this study) were obtained by centrifugation at high
speed (at 14,000 rpm for 30 min) and removal of the supernatant. Lastly, LPSiNP with
smaller size (hydrodynamic size = ~ 14.5 nm) were obtained from the supernatant.
To prepare D-LPSiNP, a dextran coating was applied. A 1 mL aliquot of an
aqueous dispersion of 0.5 mg of LPSiNP was mixed with a 1 mL aliquot of water
containing 100 mg of dextran (MW ~20,000, Sigma). The mixture was stirred overnight,
rinsed three times using a centrifugal filter (100,000 Da molecular weight cut-off,
4 nature materials | www.nature.com/naturematerials
SUPPLEMENTARY INFORMATION doi: 10.1038/nmat2398Manuscript NM08091680A
Millipore, inc.), the particles were resuspended in water and then filtered through a 0.22
m filtration membrane.
Nanoparticle characterization. Scanning electron micrographs (SEM) were obtained
with a Hitachi S-4800 field-emission instrument. A 20 uL drop of ethanol containing
LPSiNP was directly placed onto a polished silicon wafer and the solvent allowed to dry
in air. Dynamic light scattering (Zetasizer Nano ZS90, Malvern Instruments) was used to
determine hydrodynamic size and zeta potential of LPSiNP or D-LPSINP (in DI water).
To analyze porous nanostructure (pore surface area, pore size, and pore volume) of
LPSiNP, N2 adsorption isotherms (interpreted with the BJH and BET models) were
measured on a Micromeritics Accelerated Surface Area and Prosimetry analyzer (ASAP
2020).
The photoluminescence (PL, ex = 370 nm and 460 nm longpass emission filter)
and absorbance spectra of LPSiNP or D-LPSiNP in DI water were obtained using a
Princeton Instruments/Acton spectrometer fitted with a liquid nitrogen-cooled silicon
charge-coupled device detector, and a Hewlett-Packard 8452A UV-vis diode array
spectrophotometer, respectively. Fluorescence images of D-LPSiNP in DI water
subjected to different excitation wavelength bands were obtained using an IVIS 200
imaging system (Xenogen). (GFP: 445-490 nm and 1 s exposure time, DsRed: 500-550
nm, 2 s exposure time, Cy5.5: 615-665 nm, 8 s exposure time, and ICG: 710-760 nm, 20
s exposure time). The emission filter used was ICG (810-875 nm).
The photostability (photobleaching) of LPSiNP was evaluated relative to organic
dyes commonly used in biological imaging (fluorescein, Cy5.5 and Cy7). The LPSiNP
nature materials | www.nature.com/naturematerials 5
SUPPLEMENTARY INFORMATIONdoi: 10.1038/nmat2398Manuscript NM08091680A
Millipore, inc.), the particles were resuspended in water and then filtered through a 0.22
m filtration membrane.
Nanoparticle characterization. Scanning electron micrographs (SEM) were obtained
with a Hitachi S-4800 field-emission instrument. A 20 uL drop of ethanol containing
LPSiNP was directly placed onto a polished silicon wafer and the solvent allowed to dry
in air. Dynamic light scattering (Zetasizer Nano ZS90, Malvern Instruments) was used to
determine hydrodynamic size and zeta potential of LPSiNP or D-LPSINP (in DI water).
To analyze porous nanostructure (pore surface area, pore size, and pore volume) of
LPSiNP, N2 adsorption isotherms (interpreted with the BJH and BET models) were
measured on a Micromeritics Accelerated Surface Area and Prosimetry analyzer (ASAP
2020).
The photoluminescence (PL, ex = 370 nm and 460 nm longpass emission filter)
and absorbance spectra of LPSiNP or D-LPSiNP in DI water were obtained using a
Princeton Instruments/Acton spectrometer fitted with a liquid nitrogen-cooled silicon
charge-coupled device detector, and a Hewlett-Packard 8452A UV-vis diode array
spectrophotometer, respectively. Fluorescence images of D-LPSiNP in DI water
subjected to different excitation wavelength bands were obtained using an IVIS 200
imaging system (Xenogen). (GFP: 445-490 nm and 1 s exposure time, DsRed: 500-550
nm, 2 s exposure time, Cy5.5: 615-665 nm, 8 s exposure time, and ICG: 710-760 nm, 20
s exposure time). The emission filter used was ICG (810-875 nm).
The photostability (photobleaching) of LPSiNP was evaluated relative to organic
dyes commonly used in biological imaging (fluorescein, Cy5.5 and Cy7). The LPSiNP
Manuscript NM08091680A
and dyes (dispersed or dissolved in aqueous solution) were illuminated with a 100 W
mercury lamp, and fluorescence intensities were monitored using a fluorescence
microscope (Nikon Eclipse LV150) equipped with a thermoelectrically cooled CCD
camera (Photometrics CoolSNAP HQ2). Excitation (355 ± 25 nm for LPSiNP, 480 ± 20
nm for Fluorescein, 650 ± 22 nm for Cy5.5, and 710 ± 35 nm for Cy7) and emission (435
nm long pass for LPSiNP, 535 ± 25 nm for Fluorescein, 710 ± 25 nm for Cy5.5, and 800
± 35 nm for Cy7) were used for these experiments. The fluorescence intensities were
monitored at 0.5 or 1 min intervals. The quantum yield (QY) of LPSiNP in ethanol was
measured using the comparative method, using Rhodamine 101 (QY = 100%, Sigma) in
ethanol as the standard. The Fourier-transform infrared (FTIR) spectra of as-etched
porous silicon films and LPSiNP were obtained in the absorption mode using a Thermo
Scientific Nicolet 6700 FTIR spectrometer equipped with a diamond Attenuated Total
Reflectance (ATR) accessory.
In vitro degradation. A series of samples containing 0.05 mg/mL of LPSiNP or D-
LPSiNP in 1 mL of PBS solution were incubated at 37 ºC. An aliquot of 0.5 mL of
solution was removed at different time points and filtered with a centrifugal filter (30,000
Da molecular weight cut-off, Millipore, inc.) to remove undissolved LPSiNP. 0.4 mL of
the filtered solution was diluted with 4.6 mL HNO3 (2 %(v/v)) and subjected to analysis
by inductively coupled plasma optical emission spectroscopy (ICP-OES, Perkin Elmer
Optima 3000DV). The silicon concentration in the original solution was determined by
incubating the solution in PBS at 37 oC for 72 h and measuring the silicon concentration
6 nature materials | www.nature.com/naturematerials
SUPPLEMENTARY INFORMATION doi: 10.1038/nmat2398Manuscript NM08091680A
without filtration. The decrease in PL of the above samples over time was also
monitored.
Drug loading and cytotoxicity. 0.5 mg LPSiNP (0.5 mg/mL) was mixed with 0.05 mg
doxorubicin (DOX, Sigma) in DI water at room temperature overnight and then rinsed
three times using a centrifugal filter (100,000 Da molecular weight cut-off, Millipore,
inc.). The amount of DOX incorporated into LPSiNP was determined by incubating
DOX-loaded LPSiNP (DOX-LPSiNP) in a 0.3 M HCl 70% ethanol solution overnight
and comparing the fluorescence with a standard curve (~ 43.8 μg DOX per 1 mg
LPSiNP). Release kinetics of DOX from DOX-LPSiNP (0.05 mg/mL) in PBS at 37oC
was measured by filtering out DOX-LPSiNP from the solution at each time point using
the centrifugal filter and measuring fluorescence of free DOX left in the solution at 590
nm ( ex = 480 nm).
For drug-mediated cytotoxicity experiments, MDA-MB-435 human carcinoma
cells were incubated with LPSiNP, DOX-LPSiNP or free DOX (at different
DOX/LPSiNP concentrations) for 48 h and rinsed with cell medium three times. The
cytotoxicity of LPSiNP, DOX-LPSiNP or free DOX was evaluated using the MTT assay
(Chemicon). For nanostructure- or size-related cytotoxicity experiments (without DOX),
HeLa cells were incubated with the LPSiNP (at different LPSiNP concentrations) for 48
h and rinsed with cell medium (no phenol red) three times. The cytotoxicity of LPSiNP
was evaluated using the Calcein assay [fluorogenic intracellular esterase sensor Calcein
acetoxymethylester (Calcein AM), Invitrogen]. Cell viability was expressed as the
percentage of viable cells compared with controls (cells treated with PBS). The
nature materials | www.nature.com/naturematerials 7
SUPPLEMENTARY INFORMATIONdoi: 10.1038/nmat2398Manuscript NM08091680A
without filtration. The decrease in PL of the above samples over time was also
monitored.
Drug loading and cytotoxicity. 0.5 mg LPSiNP (0.5 mg/mL) was mixed with 0.05 mg
doxorubicin (DOX, Sigma) in DI water at room temperature overnight and then rinsed
three times using a centrifugal filter (100,000 Da molecular weight cut-off, Millipore,
inc.). The amount of DOX incorporated into LPSiNP was determined by incubating
DOX-loaded LPSiNP (DOX-LPSiNP) in a 0.3 M HCl 70% ethanol solution overnight
and comparing the fluorescence with a standard curve (~ 43.8 μg DOX per 1 mg
LPSiNP). Release kinetics of DOX from DOX-LPSiNP (0.05 mg/mL) in PBS at 37oC
was measured by filtering out DOX-LPSiNP from the solution at each time point using
the centrifugal filter and measuring fluorescence of free DOX left in the solution at 590
nm ( ex = 480 nm).
For drug-mediated cytotoxicity experiments, MDA-MB-435 human carcinoma
cells were incubated with LPSiNP, DOX-LPSiNP or free DOX (at different
DOX/LPSiNP concentrations) for 48 h and rinsed with cell medium three times. The
cytotoxicity of LPSiNP, DOX-LPSiNP or free DOX was evaluated using the MTT assay
(Chemicon). For nanostructure- or size-related cytotoxicity experiments (without DOX),
HeLa cells were incubated with the LPSiNP (at different LPSiNP concentrations) for 48
h and rinsed with cell medium (no phenol red) three times. The cytotoxicity of LPSiNP
was evaluated using the Calcein assay [fluorogenic intracellular esterase sensor Calcein
acetoxymethylester (Calcein AM), Invitrogen]. Cell viability was expressed as the
percentage of viable cells compared with controls (cells treated with PBS). The
Manuscript NM08091680A
cytotoxicity of the LPSiNP was also examined by observing morphology of live cells
using an inverted optical microscope (Nikon).
In vivo toxicity, circulation, and bioditribution for free DOX and DOX-LPSiNP. All
animal work was performed in accordance with the institutional animal protocol
guidelines in place at the Burnham Institute for Medical Research, and it was reviewed
and approved by the Institute’s Animal Research Committee. Free DOX or DOX-
LPSiNP (in 200 μL PBS solution) were intravenously injected into BALB/c mice at a
dose of 2 mg DOX/kg body mass (45.5 mg/kg for LPSiNP of DOX-LPSiNP). To
examine preliminary in vivo toxicity, body mass of the mice was monitored every 3 days
over a period of 3 weeks.
To determine blood half-lives, blood (100 μL) was collected from the periorbital
plexus at several different times after injection using heparinized capillary tubes (Fisher),
and then immediately mixed with 100 μL of 10 mM EDTA (in PBS) to prevent
coagulation. For silicon concentration in the blood (DOX-LPSiNP), the blood samples
were digested and prepared as mentioned for the organs. The total silicon concentration
in the blood was measured using ICP-OES. For DOX concentration in the blood (free
DOX and DOX-LPSiNP), the blood samples were spun down briefly to remove red blood
cells and 100 μL of the supernatants was mixed with 100 μL of 0.3 M HCl 70% ethanol
solution overnight to extract free DOX molecules from the DOX-LPSiNP. The total
DOX concentration in the blood was calculated based on the fluorescence intensity of
DOX in the samples ( ex = 480 nm and em = 590 nm).
8 nature materials | www.nature.com/naturematerials
SUPPLEMENTARY INFORMATION doi: 10.1038/nmat2398Manuscript NM08091680A
To determine biodistribution of free DOX and DOX-LPSiNP in mouse, the
organs (liver, spleen, kidney, lung, heart, and brain) were collected 24 h after injection,
weighed, homogenized in 1.5 mL of 0.3 M HCl 70% ethanol solution, and further
incubated in the same solution overnight to extract DOX molecules from the organs and
DOX-LPSiNP. The homogenized solution was spun down at 10,000 rpm for 10 min and
the supernatant was only used to measure the DOX fluorescence. The DOX fluorescence
( ex = 480nm and em = 590 nm) in each tissue was quantified as % injected dose (%ID)
per gram of wet tissue.
In vitro fluorescence imaging. HeLa cells (3000 cells per well) were seeded into 8-well
chamber glass slides (Lab-Tek) and incubated overnight. A 50 g per well quantity of
LPSiNP was added and the cells incubated for 2 h at 37 oC in the presence of 10% fetal
bovine serum (FBS). The cells were then rinsed three times with cell medium, fixed with
4% paraformaldehyde for 20 min and then observed in the fluorescence microscope (370
nm or 488 nm excitation and 650 nm long pass emission filter) and in the Radiance
2100/AGR-3Q BioRad Multi-photon Laser Point Scanning Confocal Microscope. For
confocal fluorescence microscopy, the cells treated with LPSiNP were imaged using 488
nm Ar ion laser excitation and a 650 nm long pass emission filter. For multi-photon
fluorescence microscopy, the cells treated with LPSiNP were imaged using 750 nm Mai-
Tai laser excitation. The DAPI and LPSiNP signals were separated using 495 dichroic
filter and 560 nm long pass filter.
nature materials | www.nature.com/naturematerials 9
SUPPLEMENTARY INFORMATIONdoi: 10.1038/nmat2398Manuscript NM08091680A
To determine biodistribution of free DOX and DOX-LPSiNP in mouse, the
organs (liver, spleen, kidney, lung, heart, and brain) were collected 24 h after injection,
weighed, homogenized in 1.5 mL of 0.3 M HCl 70% ethanol solution, and further
incubated in the same solution overnight to extract DOX molecules from the organs and
DOX-LPSiNP. The homogenized solution was spun down at 10,000 rpm for 10 min and
the supernatant was only used to measure the DOX fluorescence. The DOX fluorescence
( ex = 480nm and em = 590 nm) in each tissue was quantified as % injected dose (%ID)
per gram of wet tissue.
In vitro fluorescence imaging. HeLa cells (3000 cells per well) were seeded into 8-well
chamber glass slides (Lab-Tek) and incubated overnight. A 50 g per well quantity of
LPSiNP was added and the cells incubated for 2 h at 37 oC in the presence of 10% fetal
bovine serum (FBS). The cells were then rinsed three times with cell medium, fixed with
4% paraformaldehyde for 20 min and then observed in the fluorescence microscope (370
nm or 488 nm excitation and 650 nm long pass emission filter) and in the Radiance
2100/AGR-3Q BioRad Multi-photon Laser Point Scanning Confocal Microscope. For
confocal fluorescence microscopy, the cells treated with LPSiNP were imaged using 488
nm Ar ion laser excitation and a 650 nm long pass emission filter. For multi-photon
fluorescence microscopy, the cells treated with LPSiNP were imaged using 750 nm Mai-
Tai laser excitation. The DAPI and LPSiNP signals were separated using 495 dichroic
filter and 560 nm long pass filter.
Manuscript NM08091680A
In vivo degradation, toxicity, and circulation. All animal work was performed in
accordance with the institutional animal protocol guidelines in place at the Burnham
Institute for Medical Research, and it was reviewed and approved by the Institute’s
Animal Research Committee. LPSiNP or D-LPSiNP (in 200 μL PBS solution) were
intravenously injected into BALB/c mice at a dose of 20 mg/kg body mass. For in vivo
degradation studies, the mice were sacrificed 1 day, 1 week and 4 weeks after injection
by cardiac perfusion with PBS under anesthesia, and the brain, heart, kidney, liver, lung,
and spleen were collected. The tissues were weighed and then digested with a solution of
HNO3 (0.5 mL, ~15.7 M), H2O2 (0.1 mL, 30%) and HF (0.03 mL, 5%) for 2 days. A
solution of H3BO3 (0.235 mL, 0.4 M) was added and the mixture diluted with HNO3
(10.50 mL, 2%). The silicon concentration in the samples was determined using ICP-
OES.
For the in vivo toxicity studies, the mass of each mouse was monitored for 4
weeks after injection and compared with control mice (PBS-injected). The sections of
kidney, liver, and spleen tissues harvested from the mice 1 day and 4 weeks after
injection were stained with haematoxylin and eosin and then examined by a pathologist.
To determine blood half-lives, the blood (100 μL) was collected from the periorbital
plexus at several different times after injection using heparinized capillary tubes (Fisher),
and then immediately mixed with 100 μL of 10 mM EDTA (in PBS) to prevent
coagulation. The blood samples were digested and prepared as mentioned above for the
organs. The total silicon concentration in the blood was measured using ICP-OES.
10 nature materials | www.nature.com/naturematerials
SUPPLEMENTARY INFORMATION doi: 10.1038/nmat2398Manuscript NM08091680A
In vivo fluorescence imaging. Aliquots of LPSiNP (20 μL of 0.1 mg/mL in PBS) were
injected subcutaneously and intramuscularly into the left and right flank, respectively, of
a nude mouse, and imaged immediately with GFP excitation (445-490 nm) and ICG
emission filter (810-875 nm) using the IVIS 200 imaging system.
For systemic administration, LPSiNP or D-LPSiNP (in 200 μL PBS) were
intravenously injected into nude mice at a dose of 20 mg/kg body mass. The mice were
imaged under anesthesia several different times after injection using the IVIS 200
imaging system. The organs (bladder, brain, heart, kidney, lymph nodes, liver, lung,
skin, and spleen), harvested 24 h after injection, were also imaged. For in vivo
fluorescence tumor imaging, the nude mouse bearing an MDA-MB-435 human
carcinoma tumor (~0.5 cm, one side of flank) was used. The tumor area was imaged
under anesthesia several different times after intravenous injection of D-LPSiNP at a dose
of 20 mg/kg body mass using the IVIS 200 imaging system. The tumor and muscle
around the tumor harvested 24 h after injection, were also imaged. The excitation filters
used were GFP (445-490 nm), DsRed (500-550 nm), and Cy5.5 (615-665 nm). The
emission filter used was ICG (810-875 nm). For fluorescent histological analysis,
sections of liver, spleen, and tumor tissues were fixed with 4% paraformaldehyde, stained
with DAPI, and then observed with 370 nm excitation and 650 nm long pass emission
filter using the fluorescence microscope.
Manuscript NM08091680A
SUPPLEMENTARY FIGURES
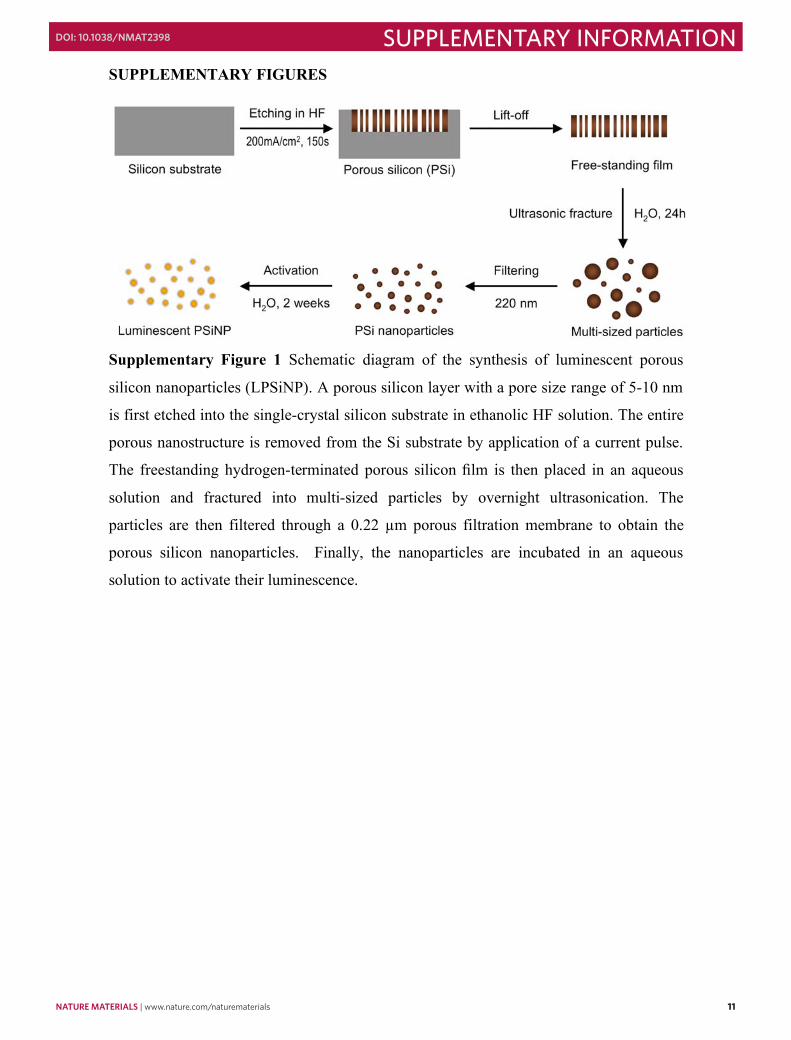
Supplementary Figure 1 Schematic diagram of the synthesis of luminescent porous
silicon nanoparticles (LPSiNP). A porous silicon layer with a pore size range of 5-10 nm
is first etched into the single-crystal silicon substrate in ethanolic HF solution. The entire
porous nanostructure is removed from the Si substrate by application of a current pulse.
The freestanding hydrogen-terminated porous silicon film is then placed in an aqueous
solution and fractured into multi-sized particles by overnight ultrasonication. The
particles are then filtered through a 0.22 m porous filtration membrane to obtain the
porous silicon nanoparticles. Finally, the nanoparticles are incubated in an aqueous
solution to activate their luminescence.
nature materials | www.nature.com/naturematerials 11
SUPPLEMENTARY INFORMATIONdoi: 10.1038/nmat2398Manuscript NM08091680A
In vivo fluorescence imaging. Aliquots of LPSiNP (20 μL of 0.1 mg/mL in PBS) were
injected subcutaneously and intramuscularly into the left and right flank, respectively, of
a nude mouse, and imaged immediately with GFP excitation (445-490 nm) and ICG
emission filter (810-875 nm) using the IVIS 200 imaging system.
For systemic administration, LPSiNP or D-LPSiNP (in 200 μL PBS) were
intravenously injected into nude mice at a dose of 20 mg/kg body mass. The mice were
imaged under anesthesia several different times after injection using the IVIS 200
imaging system. The organs (bladder, brain, heart, kidney, lymph nodes, liver, lung,
skin, and spleen), harvested 24 h after injection, were also imaged. For in vivo
fluorescence tumor imaging, the nude mouse bearing an MDA-MB-435 human
carcinoma tumor (~0.5 cm, one side of flank) was used. The tumor area was imaged
under anesthesia several different times after intravenous injection of D-LPSiNP at a dose
of 20 mg/kg body mass using the IVIS 200 imaging system. The tumor and muscle
around the tumor harvested 24 h after injection, were also imaged. The excitation filters
used were GFP (445-490 nm), DsRed (500-550 nm), and Cy5.5 (615-665 nm). The
emission filter used was ICG (810-875 nm). For fluorescent histological analysis,
sections of liver, spleen, and tumor tissues were fixed with 4% paraformaldehyde, stained
with DAPI, and then observed with 370 nm excitation and 650 nm long pass emission
filter using the fluorescence microscope.
Manuscript NM08091680A
SUPPLEMENTARY FIGURES
Supplementary Figure 1 Schematic diagram of the synthesis of luminescent porous
silicon nanoparticles (LPSiNP). A porous silicon layer with a pore size range of 5-10 nm
is first etched into the single-crystal silicon substrate in ethanolic HF solution. The entire
porous nanostructure is removed from the Si substrate by application of a current pulse.
The freestanding hydrogen-terminated porous silicon film is then placed in an aqueous
solution and fractured into multi-sized particles by overnight ultrasonication. The
particles are then filtered through a 0.22 m porous filtration membrane to obtain the
porous silicon nanoparticles. Finally, the nanoparticles are incubated in an aqueous
solution to activate their luminescence.
12 nature materials | www.nature.com/naturematerials
SUPPLEMENTARY INFORMATION doi: 10.1038/nmat2398Manuscript NM08091680A
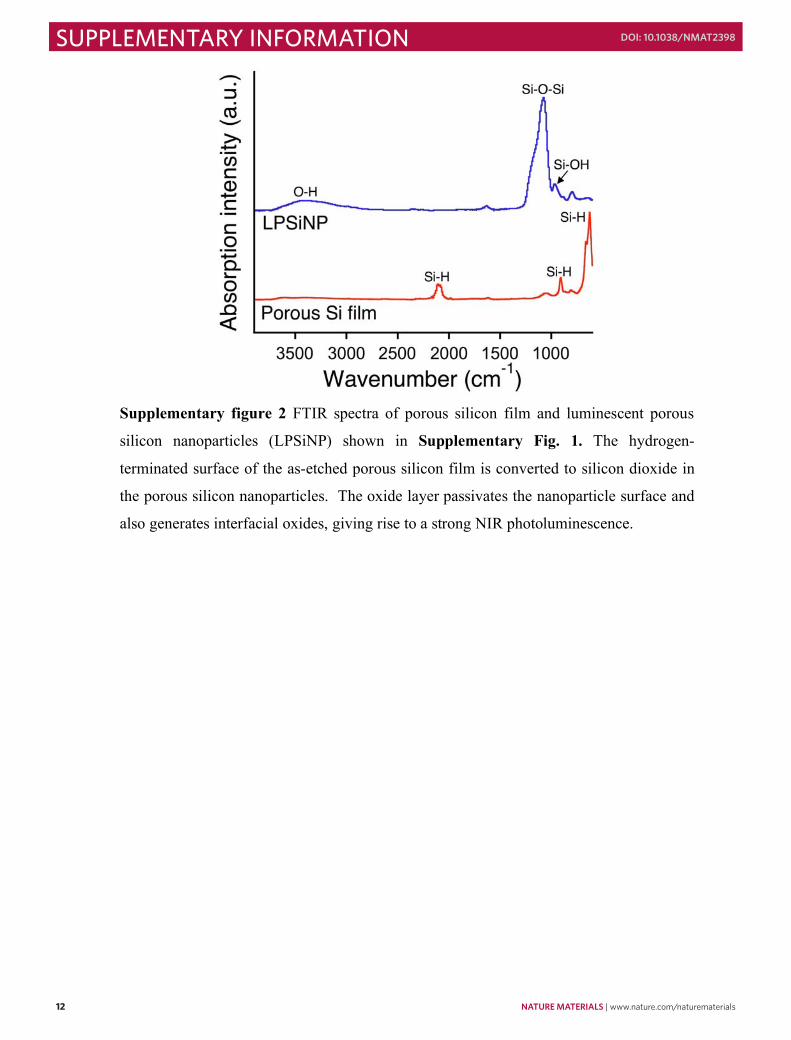
Supplementary figure 2 FTIR spectra of porous silicon film and luminescent porous
silicon nanoparticles (LPSiNP) shown in Supplementary Fig. 1. The hydrogen-
terminated surface of the as-etched porous silicon film is converted to silicon dioxide in
the porous silicon nanoparticles. The oxide layer passivates the nanoparticle surface and
also generates interfacial oxides, giving rise to a strong NIR photoluminescence.
Manuscript NM08091680A
600 700 800 900
1 d
0
5000
1x10⁴
1.5x10⁴
Ph
oto
lum
ine
sce
nce
in
ten
sity (
a.u
.)
Wavelength (nm)
12 d7 d
5 d3 d
17 d
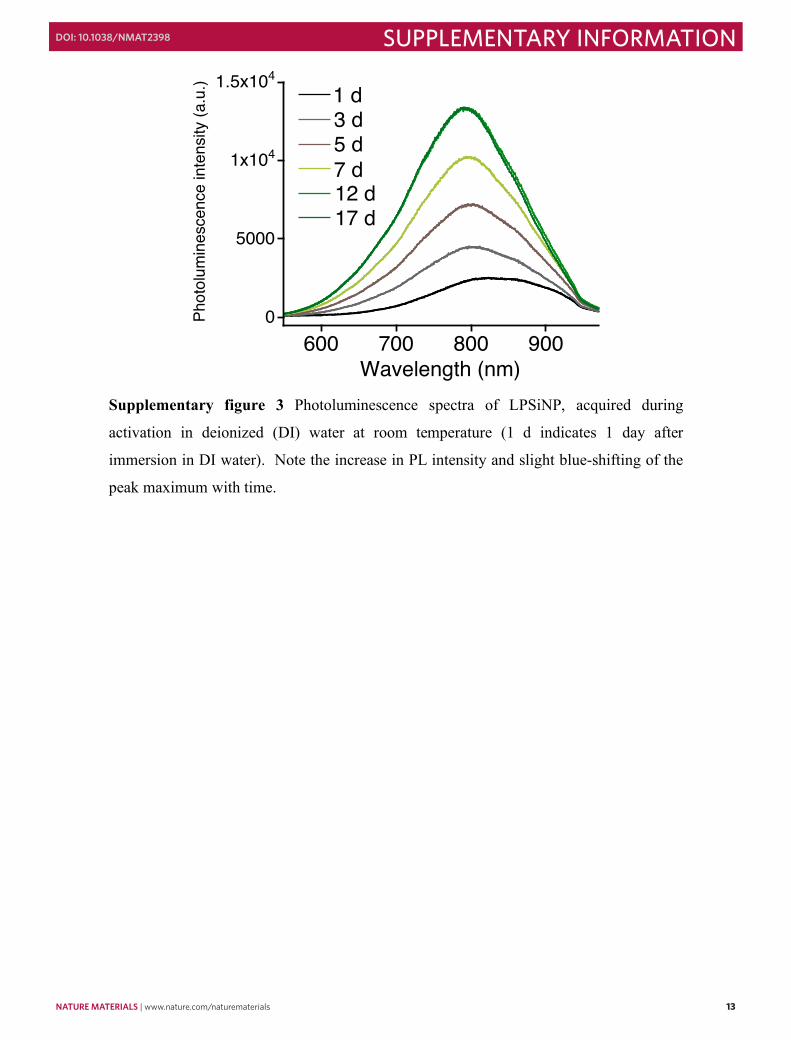
Supplementary figure 3 Photoluminescence spectra of LPSiNP, acquired during
activation in deionized (DI) water at room temperature (1 d indicates 1 day after
immersion in DI water). Note the increase in PL intensity and slight blue-shifting of the
peak maximum with time.
nature materials | www.nature.com/naturematerials 13
SUPPLEMENTARY INFORMATIONdoi: 10.1038/nmat2398Manuscript NM08091680A
Supplementary figure 2 FTIR spectra of porous silicon film and luminescent porous
silicon nanoparticles (LPSiNP) shown in Supplementary Fig. 1. The hydrogen-
terminated surface of the as-etched porous silicon film is converted to silicon dioxide in
the porous silicon nanoparticles. The oxide layer passivates the nanoparticle surface and
also generates interfacial oxides, giving rise to a strong NIR photoluminescence.
Manuscript NM08091680A
600 700 800 900
1 d
0
5000
1x10⁴
1.5x10⁴
Ph
oto
lum
ine
sce
nce
in
ten
sity (
a.u
.)
Wavelength (nm)
12 d7 d
5 d3 d
17 d
Supplementary figure 3 Photoluminescence spectra of LPSiNP, acquired during
activation in deionized (DI) water at room temperature (1 d indicates 1 day after
immersion in DI water). Note the increase in PL intensity and slight blue-shifting of the
peak maximum with time.
14 nature materials | www.nature.com/naturematerials
SUPPLEMENTARY INFORMATION doi: 10.1038/nmat2398Manuscript NM08091680A
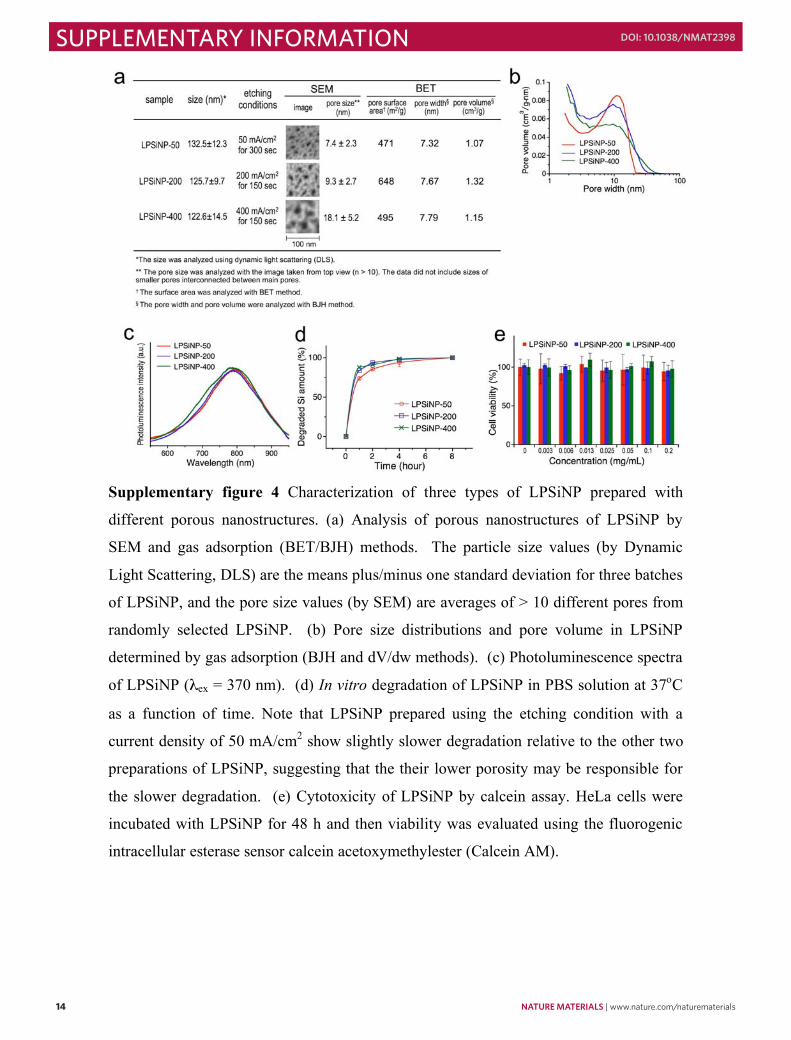
Supplementary figure 4 Characterization of three types of LPSiNP prepared with
different porous nanostructures. (a) Analysis of porous nanostructures of LPSiNP by
SEM and gas adsorption (BET/BJH) methods. The particle size values (by Dynamic
Light Scattering, DLS) are the means plus/minus one standard deviation for three batches
of LPSiNP, and the pore size values (by SEM) are averages of > 10 different pores from
randomly selected LPSiNP. (b) Pore size distributions and pore volume in LPSiNP
determined by gas adsorption (BJH and dV/dw methods). (c) Photoluminescence spectra
of LPSiNP ( ex = 370 nm). (d) In vitro degradation of LPSiNP in PBS solution at 37oC
as a function of time. Note that LPSiNP prepared using the etching condition with a
current density of 50 mA/cm2 show slightly slower degradation relative to the other two
preparations of LPSiNP, suggesting that the their lower porosity may be responsible for
the slower degradation. (e) Cytotoxicity of LPSiNP by calcein assay. HeLa cells were
incubated with LPSiNP for 48 h and then viability was evaluated using the fluorogenic
intracellular esterase sensor calcein acetoxymethylester (Calcein AM).
Manuscript NM08091680A
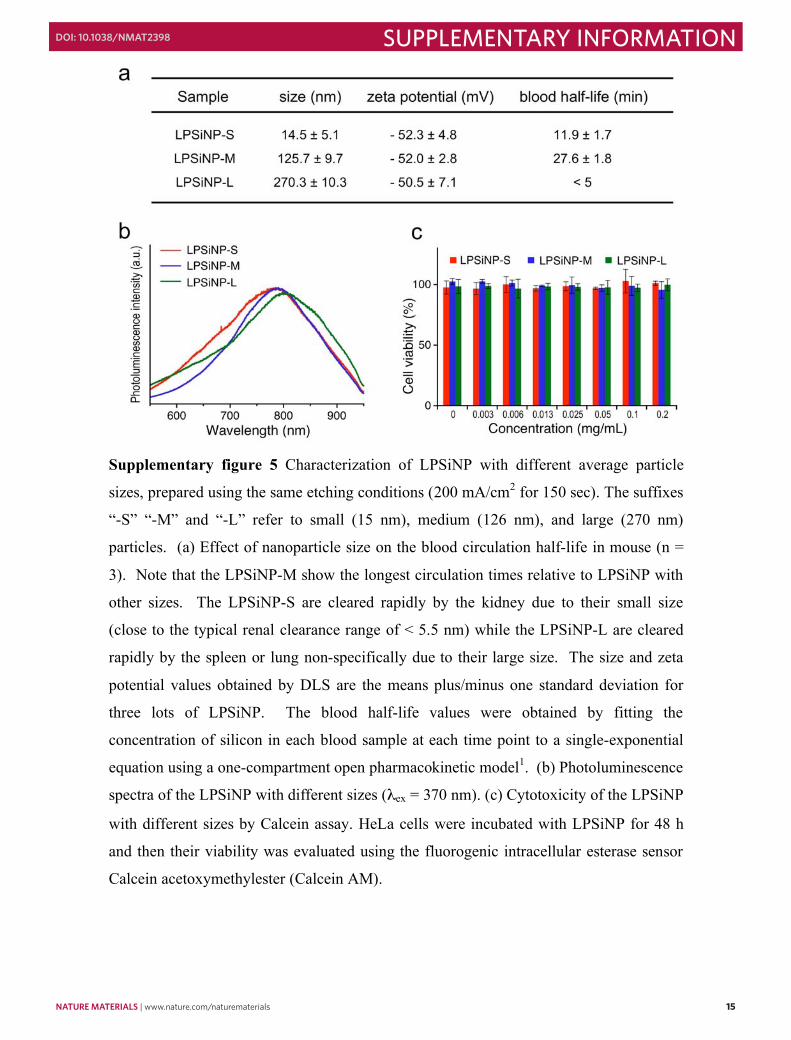
Supplementary figure 5 Characterization of LPSiNP with different average particle
sizes, prepared using the same etching conditions (200 mA/cm2 for 150 sec). The suffixes
“-S” “-M” and “-L” refer to small (15 nm), medium (126 nm), and large (270 nm)
particles. (a) Effect of nanoparticle size on the blood circulation half-life in mouse (n =
3). Note that the LPSiNP-M show the longest circulation times relative to LPSiNP with
other sizes. The LPSiNP-S are cleared rapidly by the kidney due to their small size
(close to the typical renal clearance range of < 5.5 nm) while the LPSiNP-L are cleared
rapidly by the spleen or lung non-specifically due to their large size. The size and zeta
potential values obtained by DLS are the means plus/minus one standard deviation for
three lots of LPSiNP. The blood half-life values were obtained by fitting the
concentration of silicon in each blood sample at each time point to a single-exponential
equation using a one-compartment open pharmacokinetic model1. (b) Photoluminescence
spectra of the LPSiNP with different sizes ( ex = 370 nm). (c) Cytotoxicity of the LPSiNP
with different sizes by Calcein assay. HeLa cells were incubated with LPSiNP for 48 h
and then their viability was evaluated using the fluorogenic intracellular esterase sensor
Calcein acetoxymethylester (Calcein AM).
nature materials | www.nature.com/naturematerials 15
SUPPLEMENTARY INFORMATIONdoi: 10.1038/nmat2398Manuscript NM08091680A
Supplementary figure 4 Characterization of three types of LPSiNP prepared with
different porous nanostructures. (a) Analysis of porous nanostructures of LPSiNP by
SEM and gas adsorption (BET/BJH) methods. The particle size values (by Dynamic
Light Scattering, DLS) are the means plus/minus one standard deviation for three batches
of LPSiNP, and the pore size values (by SEM) are averages of > 10 different pores from
randomly selected LPSiNP. (b) Pore size distributions and pore volume in LPSiNP
determined by gas adsorption (BJH and dV/dw methods). (c) Photoluminescence spectra
of LPSiNP ( ex = 370 nm). (d) In vitro degradation of LPSiNP in PBS solution at 37oC
as a function of time. Note that LPSiNP prepared using the etching condition with a
current density of 50 mA/cm2 show slightly slower degradation relative to the other two
preparations of LPSiNP, suggesting that the their lower porosity may be responsible for
the slower degradation. (e) Cytotoxicity of LPSiNP by calcein assay. HeLa cells were
incubated with LPSiNP for 48 h and then viability was evaluated using the fluorogenic
intracellular esterase sensor calcein acetoxymethylester (Calcein AM).
Manuscript NM08091680A
Supplementary figure 5 Characterization of LPSiNP with different average particle
sizes, prepared using the same etching conditions (200 mA/cm2 for 150 sec). The suffixes
“-S” “-M” and “-L” refer to small (15 nm), medium (126 nm), and large (270 nm)
particles. (a) Effect of nanoparticle size on the blood circulation half-life in mouse (n =
3). Note that the LPSiNP-M show the longest circulation times relative to LPSiNP with
other sizes. The LPSiNP-S are cleared rapidly by the kidney due to their small size
(close to the typical renal clearance range of < 5.5 nm) while the LPSiNP-L are cleared
rapidly by the spleen or lung non-specifically due to their large size. The size and zeta
potential values obtained by DLS are the means plus/minus one standard deviation for
three lots of LPSiNP. The blood half-life values were obtained by fitting the
concentration of silicon in each blood sample at each time point to a single-exponential
equation using a one-compartment open pharmacokinetic model1. (b) Photoluminescence
spectra of the LPSiNP with different sizes ( ex = 370 nm). (c) Cytotoxicity of the LPSiNP
with different sizes by Calcein assay. HeLa cells were incubated with LPSiNP for 48 h
and then their viability was evaluated using the fluorogenic intracellular esterase sensor
Calcein acetoxymethylester (Calcein AM).
16 nature materials | www.nature.com/naturematerials
SUPPLEMENTARY INFORMATION doi: 10.1038/nmat2398
Manuscript NM08091680A
0
50
100
0 2 4 6 8 10
Fluorescein
Rela
tive lum
inescence (
%)
Time (min)
LPSiNP
Cy7
Cy5.5
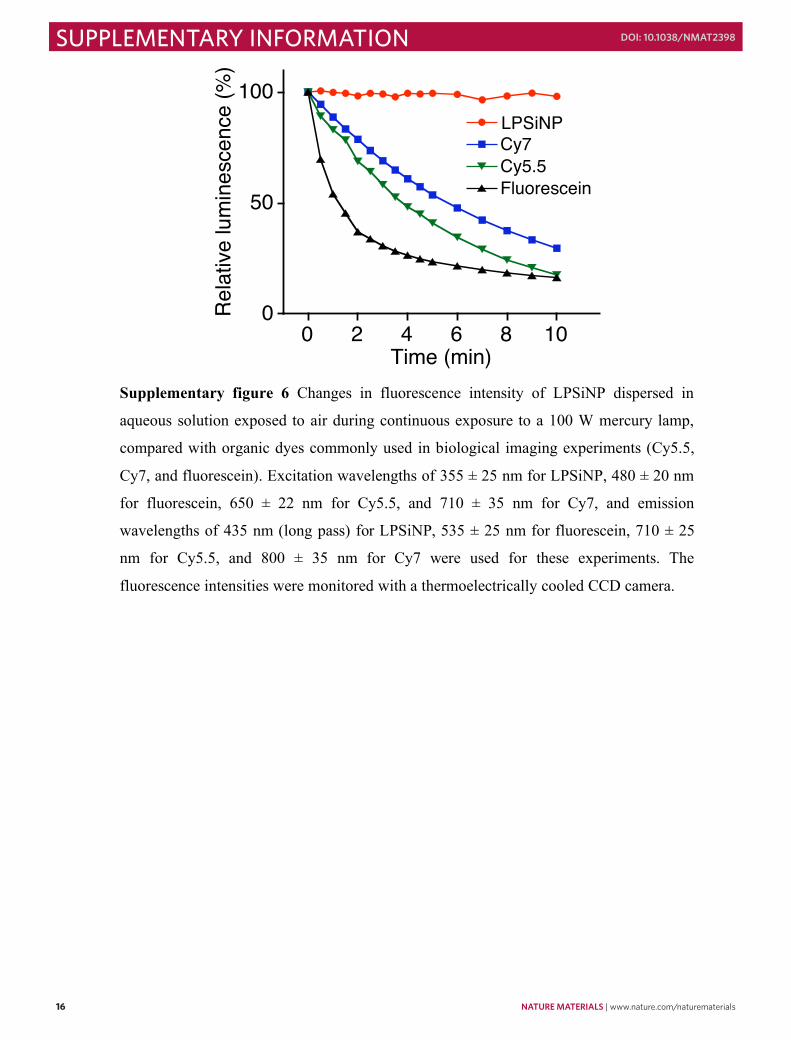
Supplementary figure 6 Changes in fluorescence intensity of LPSiNP dispersed in
aqueous solution exposed to air during continuous exposure to a 100 W mercury lamp,
compared with organic dyes commonly used in biological imaging experiments (Cy5.5,
Cy7, and fluorescein). Excitation wavelengths of 355 ± 25 nm for LPSiNP, 480 ± 20 nm
for fluorescein, 650 ± 22 nm for Cy5.5, and 710 ± 35 nm for Cy7, and emission
wavelengths of 435 nm (long pass) for LPSiNP, 535 ± 25 nm for fluorescein, 710 ± 25
nm for Cy5.5, and 800 ± 35 nm for Cy7 were used for these experiments. The
fluorescence intensities were monitored with a thermoelectrically cooled CCD camera.
Manuscript NM08091680A
0
2
4
0 0.02 0.04 0.06
Inte
gra
ted
flu
ore
sce
nce
(x1
06)
Absorbance
Rhodamine 101 (QY=100%)
LPSiNP (QY=10.2%)
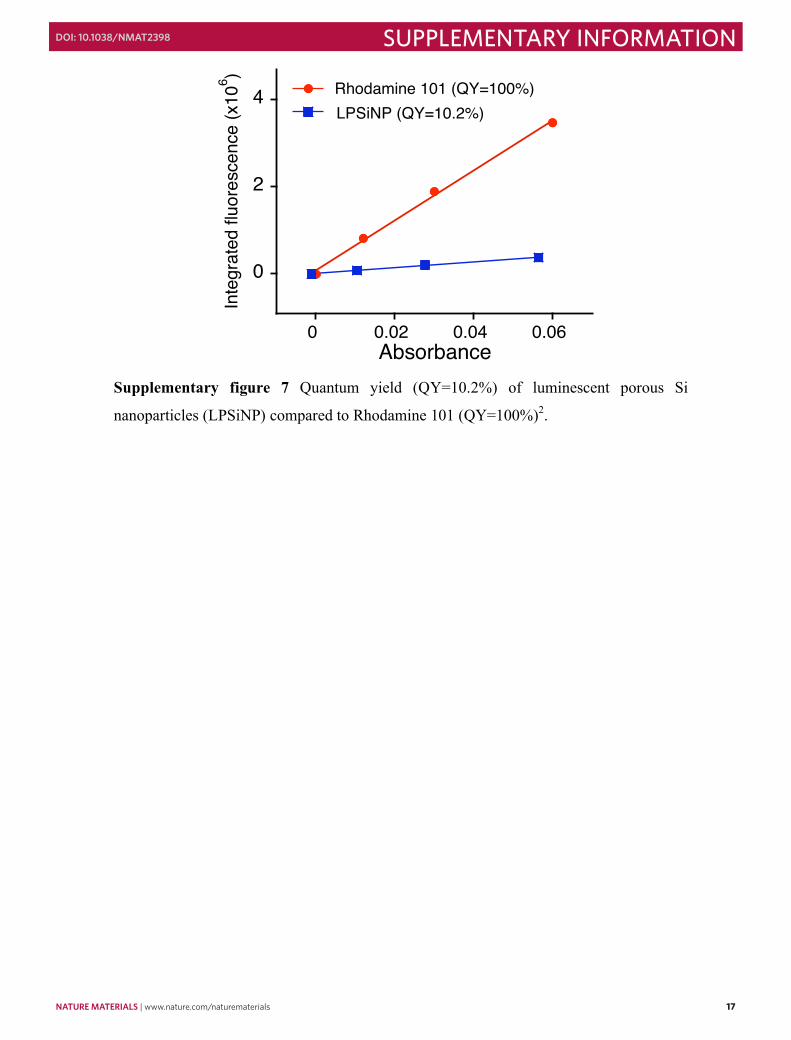
Supplementary figure 7 Quantum yield (QY=10.2%) of luminescent porous Si
nanoparticles (LPSiNP) compared to Rhodamine 101 (QY=100%)2.
nature materials | www.nature.com/naturematerials 17
SUPPLEMENTARY INFORMATIONdoi: 10.1038/nmat2398
Manuscript NM08091680A
0
50
100
0 2 4 6 8 10
Fluorescein
Rela
tive lum
inescence (
%)
Time (min)
LPSiNP
Cy7
Cy5.5
Supplementary figure 6 Changes in fluorescence intensity of LPSiNP dispersed in
aqueous solution exposed to air during continuous exposure to a 100 W mercury lamp,
compared with organic dyes commonly used in biological imaging experiments (Cy5.5,
Cy7, and fluorescein). Excitation wavelengths of 355 ± 25 nm for LPSiNP, 480 ± 20 nm
for fluorescein, 650 ± 22 nm for Cy5.5, and 710 ± 35 nm for Cy7, and emission
wavelengths of 435 nm (long pass) for LPSiNP, 535 ± 25 nm for fluorescein, 710 ± 25
nm for Cy5.5, and 800 ± 35 nm for Cy7 were used for these experiments. The
fluorescence intensities were monitored with a thermoelectrically cooled CCD camera.
Manuscript NM08091680A
0
2
4
0 0.02 0.04 0.06
Inte
gra
ted
flu
ore
sce
nce
(x1
06)
Absorbance
Rhodamine 101 (QY=100%)
LPSiNP (QY=10.2%)
Supplementary figure 7 Quantum yield (QY=10.2%) of luminescent porous Si
nanoparticles (LPSiNP) compared to Rhodamine 101 (QY=100%)2.
18 nature materials | www.nature.com/naturematerials
SUPPLEMENTARY INFORMATION doi: 10.1038/nmat2398Manuscript NM08091680A
600 700 800 900
0 h
0
2000
4000
6000
Ph
oto
lum
ine
sce
nce
in
ten
sity (
a.u
.)
Wavelength (nm)
8 h
4 h
2 h
1 h
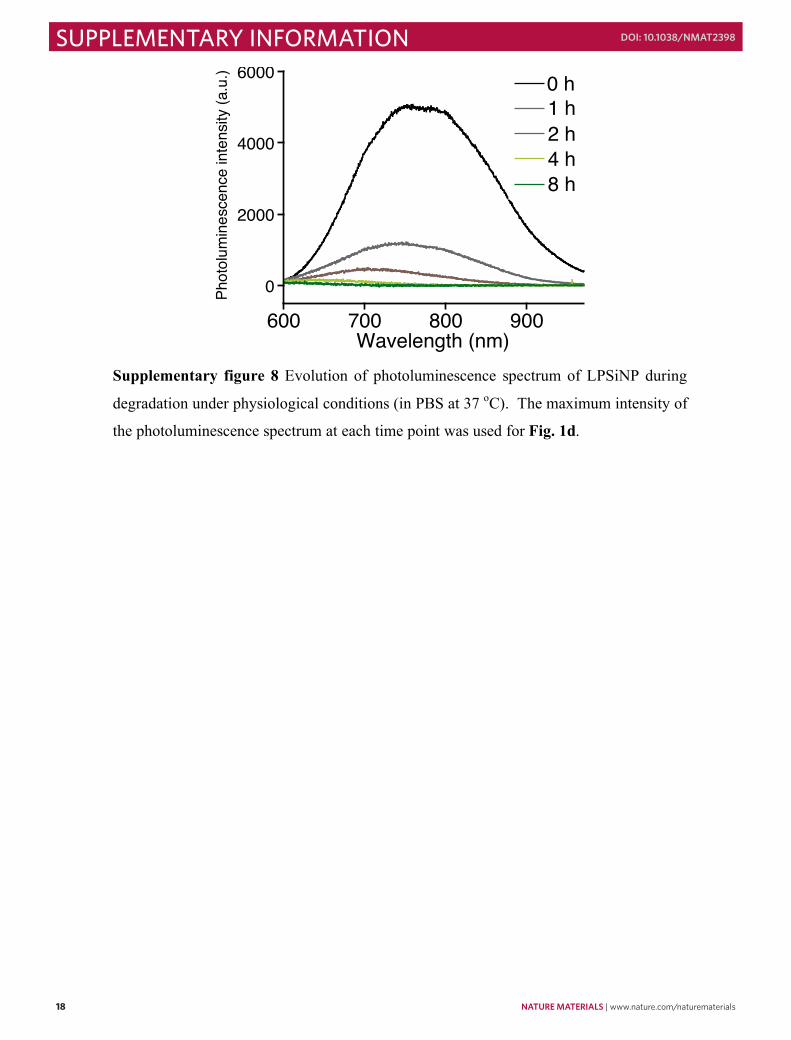
Supplementary figure 8 Evolution of photoluminescence spectrum of LPSiNP during
degradation under physiological conditions (in PBS at 37 oC). The maximum intensity of
the photoluminescence spectrum at each time point was used for Fig. 1d.
nature materials | www.nature.com/naturematerials 19
SUPPLEMENTARY INFORMATIONdoi: 10.1038/nmat2398Manuscript NM08091680A
600 700 800 900
0 h
0
2000
4000
6000
Ph
oto
lum
ine
sce
nce
in
ten
sity (
a.u
.)
Wavelength (nm)
8 h
4 h
2 h
1 h
Supplementary figure 8 Evolution of photoluminescence spectrum of LPSiNP during
degradation under physiological conditions (in PBS at 37 oC). The maximum intensity of
the photoluminescence spectrum at each time point was used for Fig. 1d.
Manuscript NM08091680A
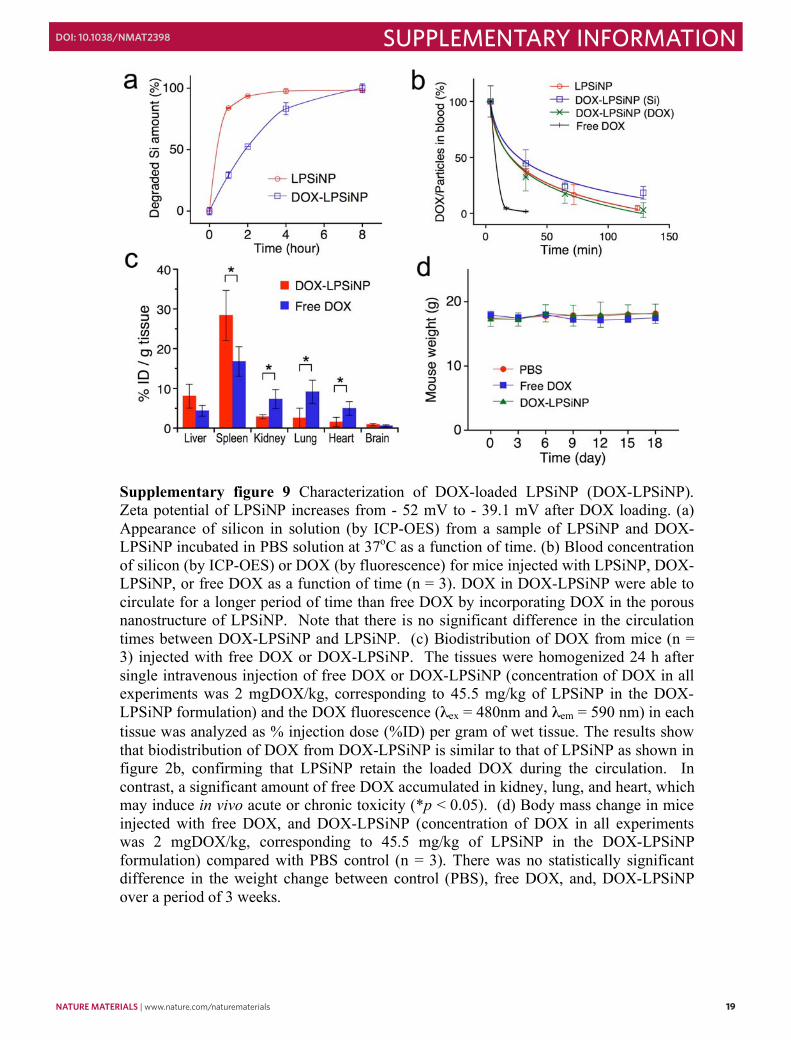
Supplementary figure 9 Characterization of DOX-loaded LPSiNP (DOX-LPSiNP). Zeta potential of LPSiNP increases from - 52 mV to - 39.1 mV after DOX loading. (a) Appearance of silicon in solution (by ICP-OES) from a sample of LPSiNP and DOX-LPSiNP incubated in PBS solution at 37oC as a function of time. (b) Blood concentration of silicon (by ICP-OES) or DOX (by fluorescence) for mice injected with LPSiNP, DOX-LPSiNP, or free DOX as a function of time (n = 3). DOX in DOX-LPSiNP were able to circulate for a longer period of time than free DOX by incorporating DOX in the porous nanostructure of LPSiNP. Note that there is no significant difference in the circulation times between DOX-LPSiNP and LPSiNP. (c) Biodistribution of DOX from mice (n = 3) injected with free DOX or DOX-LPSiNP. The tissues were homogenized 24 h after single intravenous injection of free DOX or DOX-LPSiNP (concentration of DOX in all experiments was 2 mgDOX/kg, corresponding to 45.5 mg/kg of LPSiNP in the DOX-LPSiNP formulation) and the DOX fluorescence ( ex = 480nm and em = 590 nm) in each tissue was analyzed as % injection dose (%ID) per gram of wet tissue. The results show that biodistribution of DOX from DOX-LPSiNP is similar to that of LPSiNP as shown in figure 2b, confirming that LPSiNP retain the loaded DOX during the circulation. In contrast, a significant amount of free DOX accumulated in kidney, lung, and heart, which may induce in vivo acute or chronic toxicity (*p < 0.05). (d) Body mass change in mice injected with free DOX, and DOX-LPSiNP (concentration of DOX in all experiments was 2 mgDOX/kg, corresponding to 45.5 mg/kg of LPSiNP in the DOX-LPSiNP formulation) compared with PBS control (n = 3). There was no statistically significant difference in the weight change between control (PBS), free DOX, and, DOX-LPSiNP over a period of 3 weeks.
20 nature materials | www.nature.com/naturematerials
SUPPLEMENTARY INFORMATION doi: 10.1038/nmat2398Manuscript NM08091680A
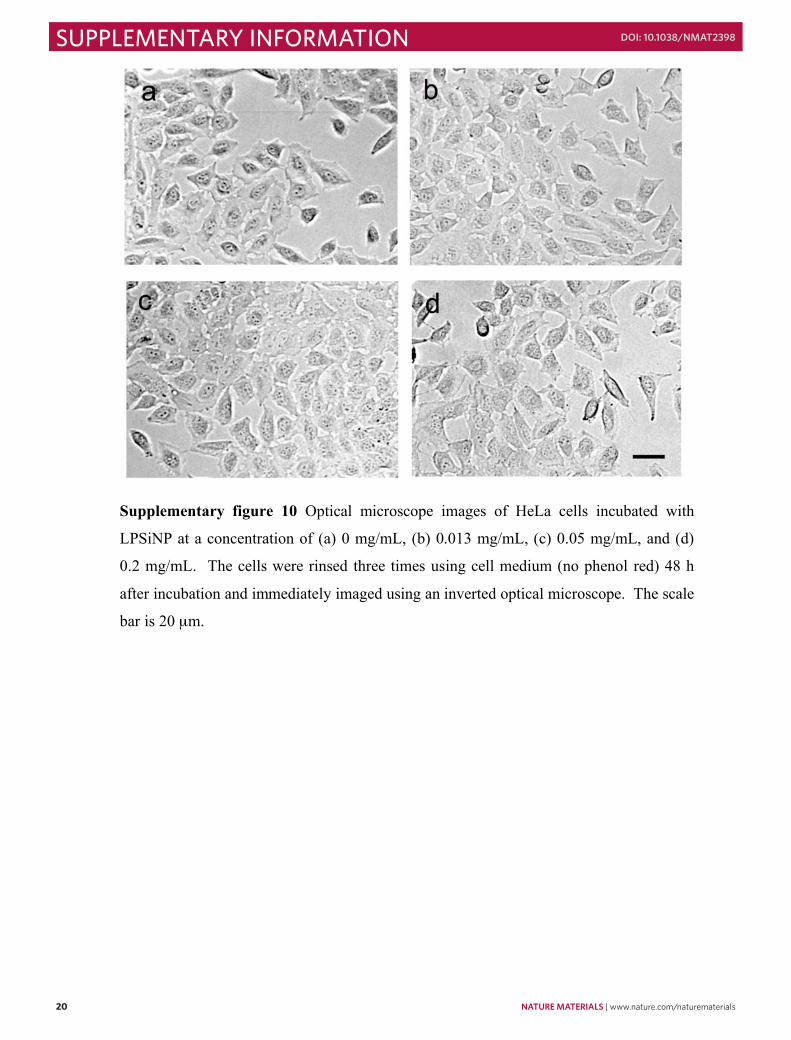
Supplementary figure 10 Optical microscope images of HeLa cells incubated with
LPSiNP at a concentration of (a) 0 mg/mL, (b) 0.013 mg/mL, (c) 0.05 mg/mL, and (d)
0.2 mg/mL. The cells were rinsed three times using cell medium (no phenol red) 48 h
after incubation and immediately imaged using an inverted optical microscope. The scale
bar is 20 μm.
nature materials | www.nature.com/naturematerials 21
SUPPLEMENTARY INFORMATIONdoi: 10.1038/nmat2398Manuscript NM08091680A
Supplementary figure 10 Optical microscope images of HeLa cells incubated with
LPSiNP at a concentration of (a) 0 mg/mL, (b) 0.013 mg/mL, (c) 0.05 mg/mL, and (d)
0.2 mg/mL. The cells were rinsed three times using cell medium (no phenol red) 48 h
after incubation and immediately imaged using an inverted optical microscope. The scale
bar is 20 μm.
Manuscript NM08091680A
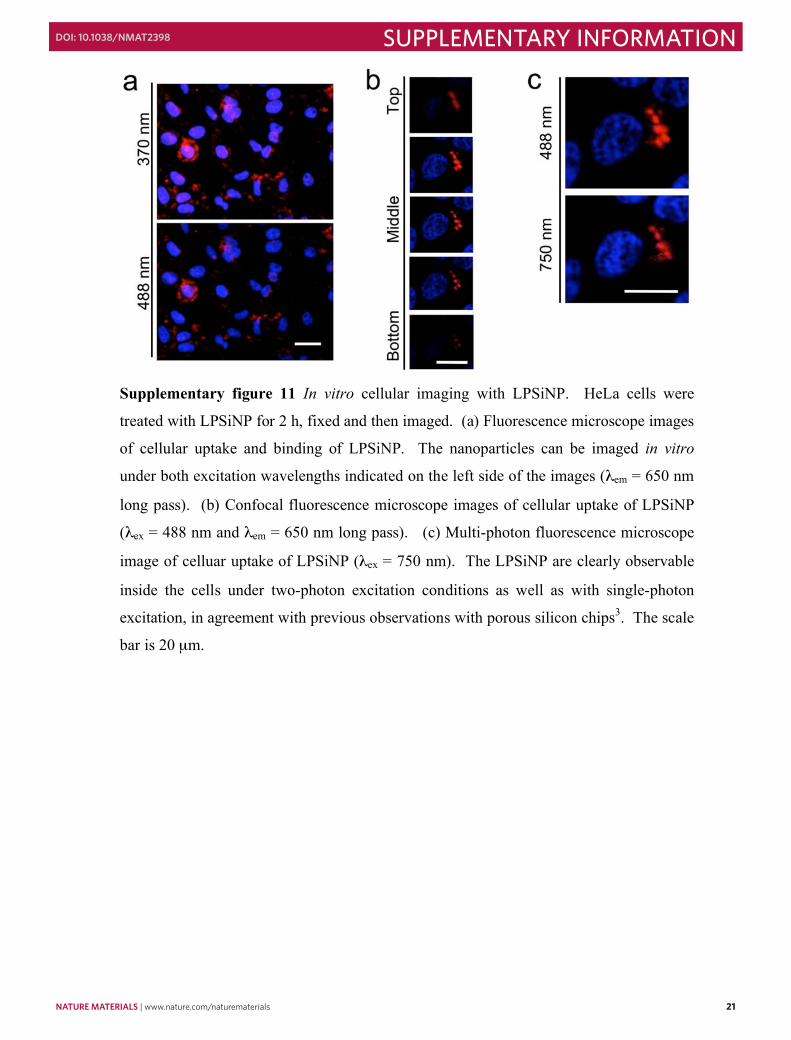
Supplementary figure 11 In vitro cellular imaging with LPSiNP. HeLa cells were
treated with LPSiNP for 2 h, fixed and then imaged. (a) Fluorescence microscope images
of cellular uptake and binding of LPSiNP. The nanoparticles can be imaged in vitro
under both excitation wavelengths indicated on the left side of the images ( em = 650 nm
long pass). (b) Confocal fluorescence microscope images of cellular uptake of LPSiNP
( ex = 488 nm and em = 650 nm long pass). (c) Multi-photon fluorescence microscope
image of celluar uptake of LPSiNP ( ex = 750 nm). The LPSiNP are clearly observable
inside the cells under two-photon excitation conditions as well as with single-photon
excitation, in agreement with previous observations with porous silicon chips3. The scale
bar is 20 μm.
22 nature materials | www.nature.com/naturematerials
SUPPLEMENTARY INFORMATION doi: 10.1038/nmat2398
Manuscript NM08091680A
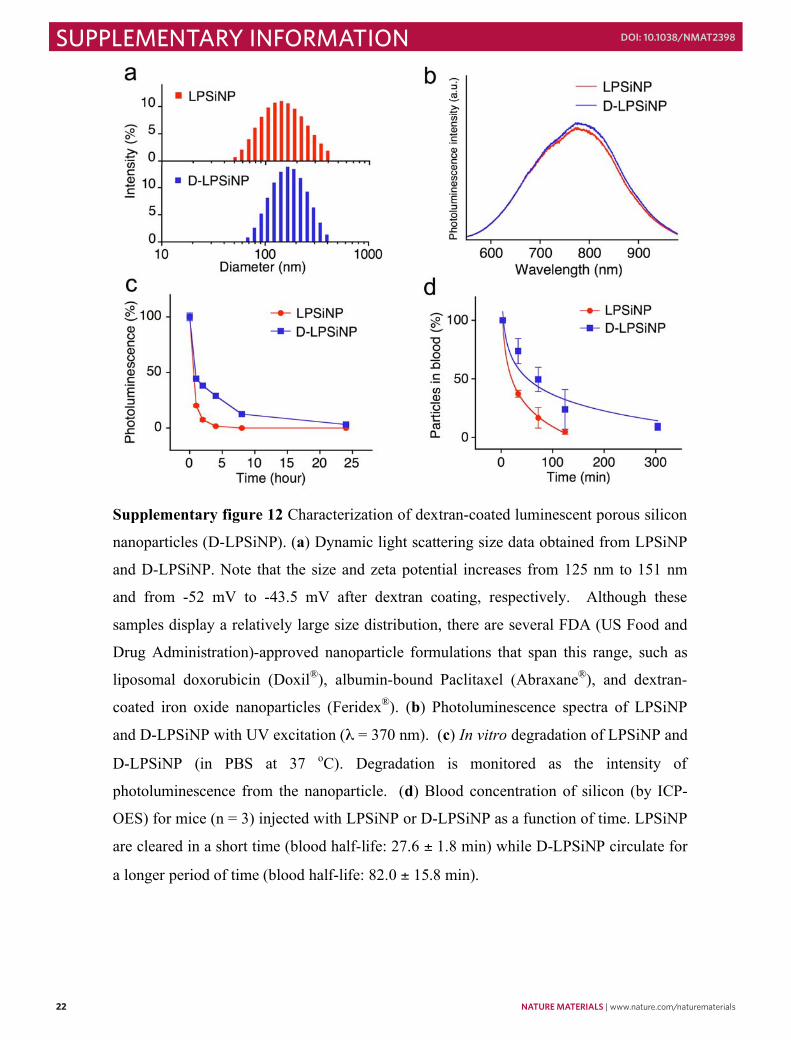
Supplementary figure 12 Characterization of dextran-coated luminescent porous silicon
nanoparticles (D-LPSiNP). (a) Dynamic light scattering size data obtained from LPSiNP
and D-LPSiNP. Note that the size and zeta potential increases from 125 nm to 151 nm
and from -52 mV to -43.5 mV after dextran coating, respectively. Although these
samples display a relatively large size distribution, there are several FDA (US Food and
Drug Administration)-approved nanoparticle formulations that span this range, such as
liposomal doxorubicin (Doxil®), albumin-bound Paclitaxel (Abraxane®), and dextran-
coated iron oxide nanoparticles (Feridex®). (b) Photoluminescence spectra of LPSiNP
and D-LPSiNP with UV excitation ( = 370 nm). (c) In vitro degradation of LPSiNP and
D-LPSiNP (in PBS at 37 oC). Degradation is monitored as the intensity of
photoluminescence from the nanoparticle. (d) Blood concentration of silicon (by ICP-
OES) for mice (n = 3) injected with LPSiNP or D-LPSiNP as a function of time. LPSiNP
are cleared in a short time (blood half-life: 27.6 ± 1.8 min) while D-LPSiNP circulate for
a longer period of time (blood half-life: 82.0 ± 15.8 min).
nature materials | www.nature.com/naturematerials 23
SUPPLEMENTARY INFORMATIONdoi: 10.1038/nmat2398
Manuscript NM08091680A
Supplementary figure 12 Characterization of dextran-coated luminescent porous silicon
nanoparticles (D-LPSiNP). (a) Dynamic light scattering size data obtained from LPSiNP
and D-LPSiNP. Note that the size and zeta potential increases from 125 nm to 151 nm
and from -52 mV to -43.5 mV after dextran coating, respectively. Although these
samples display a relatively large size distribution, there are several FDA (US Food and
Drug Administration)-approved nanoparticle formulations that span this range, such as
liposomal doxorubicin (Doxil®), albumin-bound Paclitaxel (Abraxane®), and dextran-
coated iron oxide nanoparticles (Feridex®). (b) Photoluminescence spectra of LPSiNP
and D-LPSiNP with UV excitation ( = 370 nm). (c) In vitro degradation of LPSiNP and
D-LPSiNP (in PBS at 37 oC). Degradation is monitored as the intensity of
photoluminescence from the nanoparticle. (d) Blood concentration of silicon (by ICP-
OES) for mice (n = 3) injected with LPSiNP or D-LPSiNP as a function of time. LPSiNP
are cleared in a short time (blood half-life: 27.6 ± 1.8 min) while D-LPSiNP circulate for
a longer period of time (blood half-life: 82.0 ± 15.8 min).
Manuscript NM08091680A
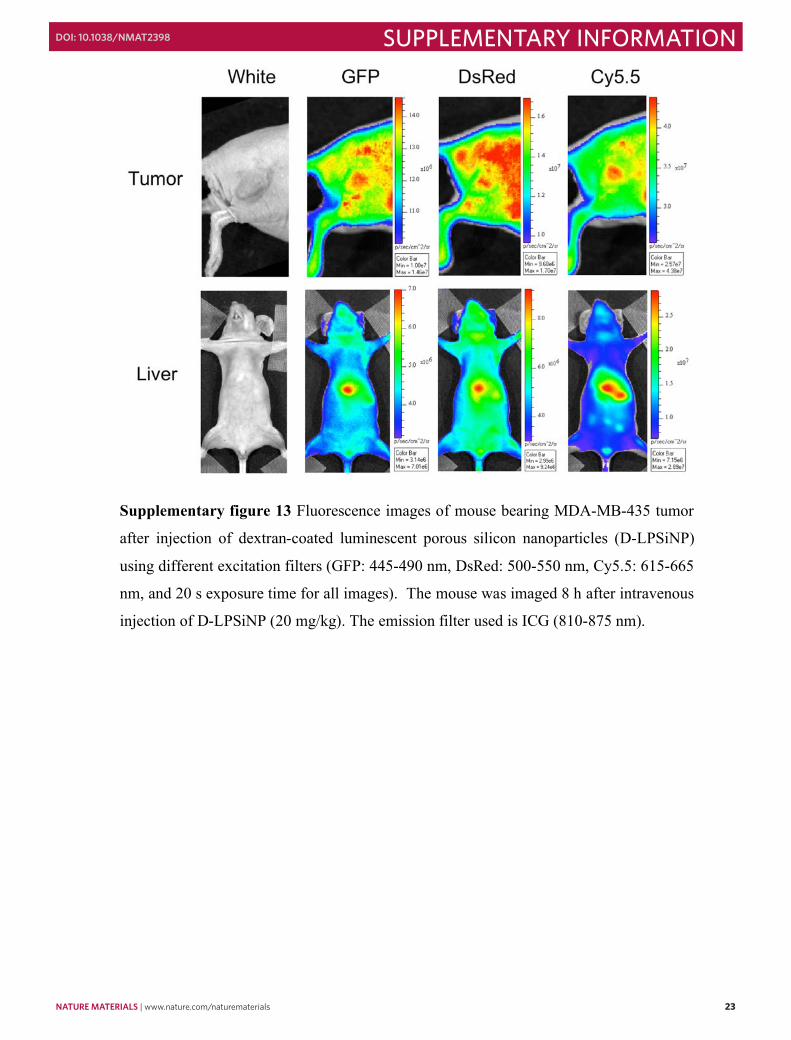
Supplementary figure 13 Fluorescence images of mouse bearing MDA-MB-435 tumor
after injection of dextran-coated luminescent porous silicon nanoparticles (D-LPSiNP)
using different excitation filters (GFP: 445-490 nm, DsRed: 500-550 nm, Cy5.5: 615-665
nm, and 20 s exposure time for all images). The mouse was imaged 8 h after intravenous
injection of D-LPSiNP (20 mg/kg). The emission filter used is ICG (810-875 nm).
24 nature materials | www.nature.com/naturematerials
SUPPLEMENTARY INFORMATION doi: 10.1038/nmat2398Manuscript NM08091680A
References Cited
1. Wunderbaldinger, P., Josephson, L. & Weissleder, R. Tat peptide directs
enhanced clearance and hepatic permeability of magnetic nanoparticles.
Bioconjugate Chem. 13, 264-268 (2002).
2. Williams, A.T.R., Winfield, S.A. & Miller, J.N. Relative fluorescence quantum
yields using a computer controlled luminescence spectrometer. Analyst 108,
1067-1071 (1983).
3. Chin, R.P., Shen, Y.R. & Petrova-Koch, V. Photoluminescence from porous
silicon by infrared multiphoton excitation. Science 270, 776-778 (1995).