biochemistry 324 - sun
TRANSCRIPT
Biochemistry 324Bioinformatics
Pairwise sequence alignment
• When we have sequenced a genome, we try and identify the function of “unknown” genes by finding a similar gene of known function
• To do this we need to find “similar” genes• The similarity of genes is defined by the similarity of sequences• Sequence similarities are obtained by aligning sequences• Homologous sequences share an evolutionary history
• Homology is qualitative, i.e. sequences are either homologous or they are not, they are not 25% homologous, for instance
• Homologous sequences have identities, degree of conservation and similarities, which are quantitative
• Identities describe the percentage of residues that are identical at corresponding positions after alignment of the sequences
• Conservation described the percentage of residues at corresponding positions that have similar physicochemical properties (i.e., polar, acidic, etc.)
• Similarity describes the conserved + identical residues at corresponding positions in the aligned sequences
How do we compare genes/proteins?
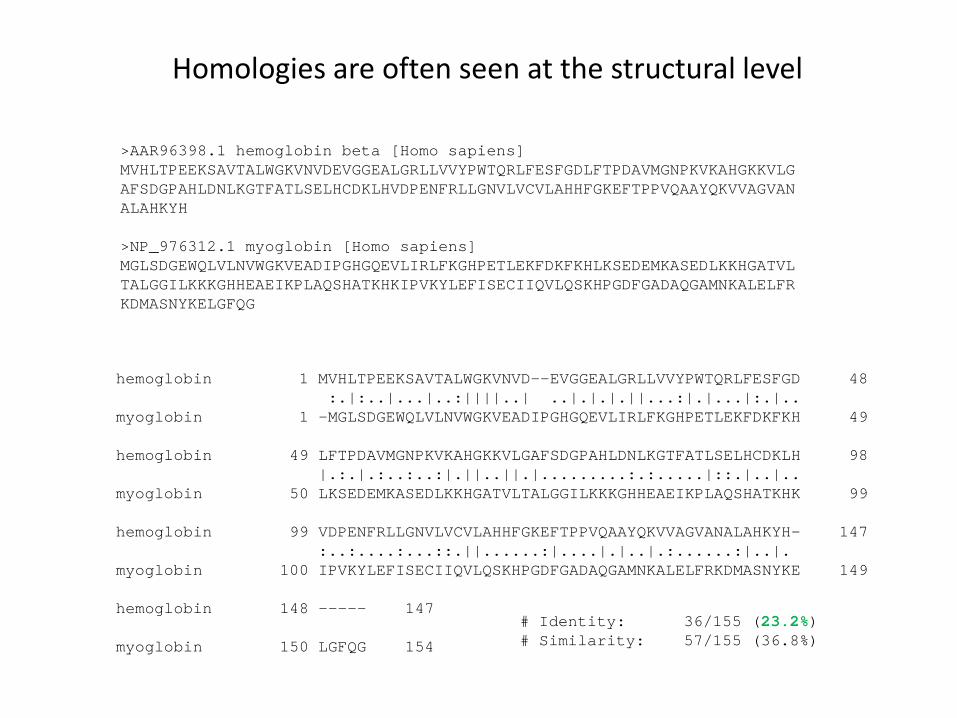
Homologies are often seen at the structural level
>AAR96398.1 hemoglobin beta [Homo sapiens]MVHLTPEEKSAVTALWGKVNVDEVGGEALGRLLVVYPWTQRLFESFGDLFTPDAVMGNPKVKAHGKKVLGAFSDGPAHLDNLKGTFATLSELHCDKLHVDPENFRLLGNVLVCVLAHHFGKEFTPPVQAAYQKVVAGVANALAHKYH
>NP_976312.1 myoglobin [Homo sapiens]MGLSDGEWQLVLNVWGKVEADIPGHGQEVLIRLFKGHPETLEKFDKFKHLKSEDEMKASEDLKKHGATVLTALGGILKKKGHHEAEIKPLAQSHATKHKIPVKYLEFISECIIQVLQSKHPGDFGADAQGAMNKALELFRKDMASNYKELGFQG
hemoglobin 1 MVHLTPEEKSAVTALWGKVNVD--EVGGEALGRLLVVYPWTQRLFESFGD 48:.|:..|...|..:||||..| ..|.|.|.||...:|.|...|:.|..
myoglobin 1 -MGLSDGEWQLVLNVWGKVEADIPGHGQEVLIRLFKGHPETLEKFDKFKH 49
hemoglobin 49 LFTPDAVMGNPKVKAHGKKVLGAFSDGPAHLDNLKGTFATLSELHCDKLH 98|.:.|.:..:..:|.||..||.|.........:.:.....|::.|..|..
myoglobin 50 LKSEDEMKASEDLKKHGATVLTALGGILKKKGHHEAEIKPLAQSHATKHK 99
hemoglobin 99 VDPENFRLLGNVLVCVLAHHFGKEFTPPVQAAYQKVVAGVANALAHKYH- 147:..:....:...::.||......:|....|.|..|.:......:|..|.
myoglobin 100 IPVKYLEFISECIIQVLQSKHPGDFGADAQGAMNKALELFRKDMASNYKE 149
hemoglobin 148 ----- 147
myoglobin 150 LGFQG 154
# Identity: 36/155 (23.2%)# Similarity: 57/155 (36.8%)
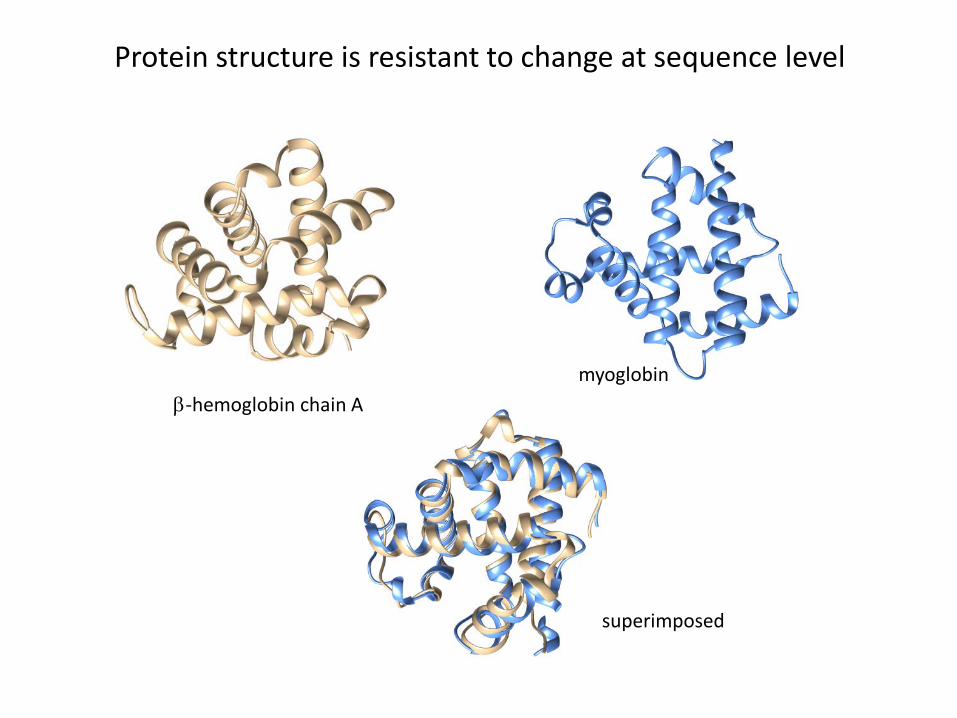
β-hemoglobin chain Amyoglobin
superimposed
Protein structure is resistant to change at sequence level
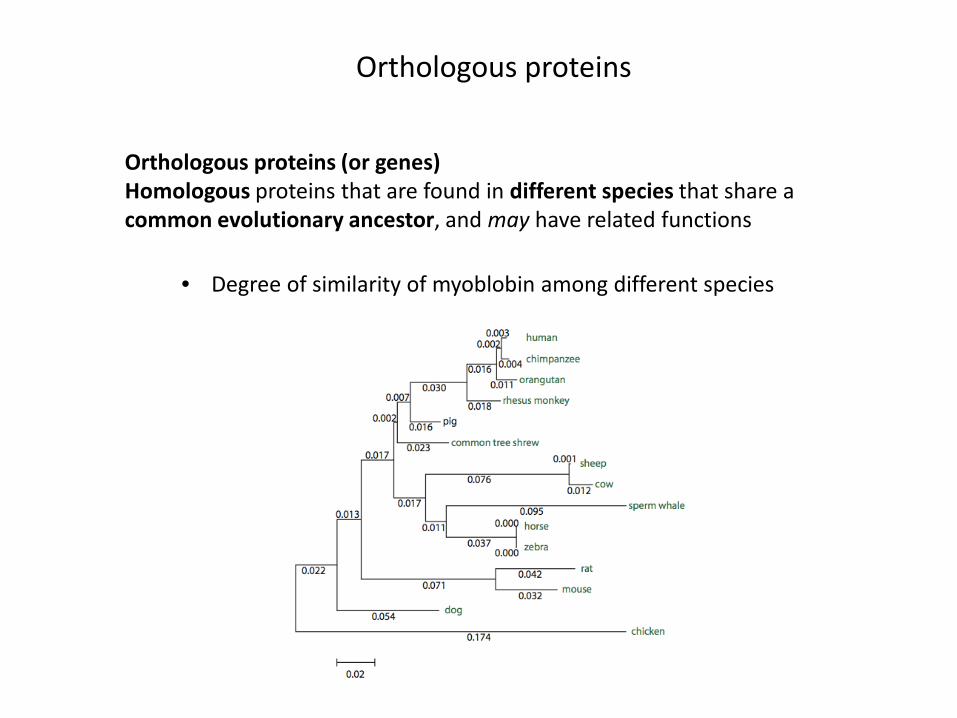
Orthologous proteins
Orthologous proteins (or genes)Homologous proteins that are found in different species that share a common evolutionary ancestor, and may have related functions
• Degree of similarity of myoblobin among different species

Paralogous proteins
Paralogous proteins (or genes)Homologous proteins that are coded by two genes in a single genome that arose by gene duplication, followed by gene drift
• The globin gene family in humans
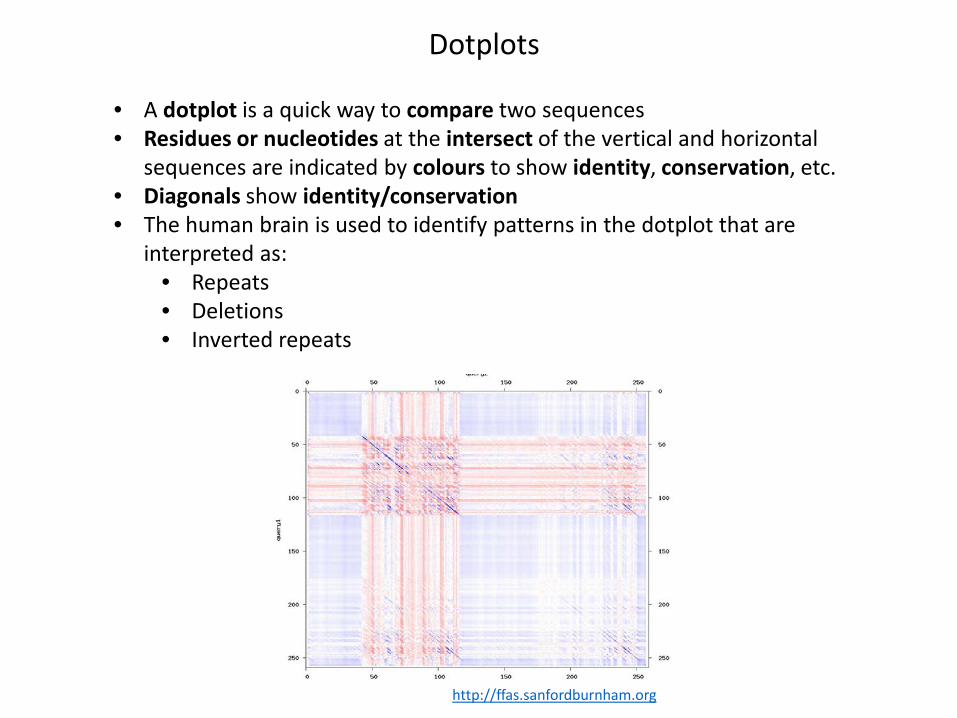
Dotplots
• A dotplot is a quick way to compare two sequences• Residues or nucleotides at the intersect of the vertical and horizontal
sequences are indicated by colours to show identity, conservation, etc.• Diagonals show identity/conservation• The human brain is used to identify patterns in the dotplot that are
interpreted as:• Repeats• Deletions• Inverted repeats
http://ffas.sanfordburnham.org
• Global alignment is the optimal alignment of two or more sequences over the full length of all sequences, introducing gaps as needed to compensate for sequence length differences
• The Needleman-Wunsch (“needle”) algorithm performs global alignment
• Local alignment is the optimal alignment of short, local sequence lengths without any regard for the position of the aligned sequence within the large, full sequence
• The Smith-Waterman (“water”) algorithm performs local alignments
• Try the tools at http://www.ebi.ac.uk/Tools/emboss/
Global and local sequence alignments

Beta-globin 1 MVHLTPEEKSAVTALWGKVNVD--EVGGEALGRLLVVYPWTQRFFESFGD 48:.|:..|...|..:||||..| ..|.|.|.||...:|.|...|:.|..
Myoglobin 1 -MGLSDGEWQLVLNVWGKVEADIPGHGQEVLIRLFKGHPETLEKFDKFKH 49
Beta-globin 49 LSTPDAVMGNPKVKAHGKKVLGAFSDGLAHLDNLKGTFATLSELHCDKLH 98|.:.|.:..:..:|.||..||.|....|....:.:.....|::.|..|..
Myoglobin 50 LKSEDEMKASEDLKKHGATVLTALGGILKKKGHHEAEIKPLAQSHATKHK 99
Beta-globin 99 VDPENFRLLGNVLVCVLAHHFGKEFTPPVQAAYQKVVAGVANALAHKYH- 147:..:....:...::.||......:|....|.|..|.:......:|..|.
Myoglobin 100 IPVKYLEFISECIIQVLQSKHPGDFGADAQGAMNKALELFRKDMASNYKE 149
Beta-globin 148 ----- 147
Myoglobin 150 LGFQG 154
beta-globin 4 LTPEEKSAVTALWGKVNVD--EVGGEALGRLLVVYPWTQRFFESFGDLST 51|:..|...|..:||||..| ..|.|.|.||...:|.|...|:.|..|.:
myoglobin 3 LSDGEWQLVLNVWGKVEADIPGHGQEVLIRLFKGHPETLEKFDKFKHLKS 52
beta-globin 52 PDAVMGNPKVKAHGKKVLGAFSDGLAHLDNLKGTFATLSELHCDKLHVDP 101.|.:..:..:|.||..||.|....|....:.:.....|::.|..|..:..
myoglobin 53 EDEMKASEDLKKHGATVLTALGGILKKKGHHEAEIKPLAQSHATKHKIPV 102
beta-globin 102 ENFRLLGNVLVCVLAHHFGKEFTPPVQAAYQKVVAGVANALAHKY 146:....:...::.||......:|....|.|..|.:......:|..|
myoglobin 103 KYLEFISECIIQVLQSKHPGDFGADAQGAMNKALELFRKDMASNY 147
“Needle”
“Water”

How do we generate a sequence alignment?
• Make a matrix of size m+1 × n+1 for sequence 1 and 2 of lengths m and n• When comparing 2 sequences, trace a path through the matrix with one
sequence along the horizontal axis, and the other sequence along the vertical axis
• At every comparison, one of 4 results are possible:• Identical (stay on diagonal)• Mismatch (stay on diagonal)• Insert gap in sequence 1 (move along vertical)• Insert gap in sequence 2 (move along horizontal)
1
2
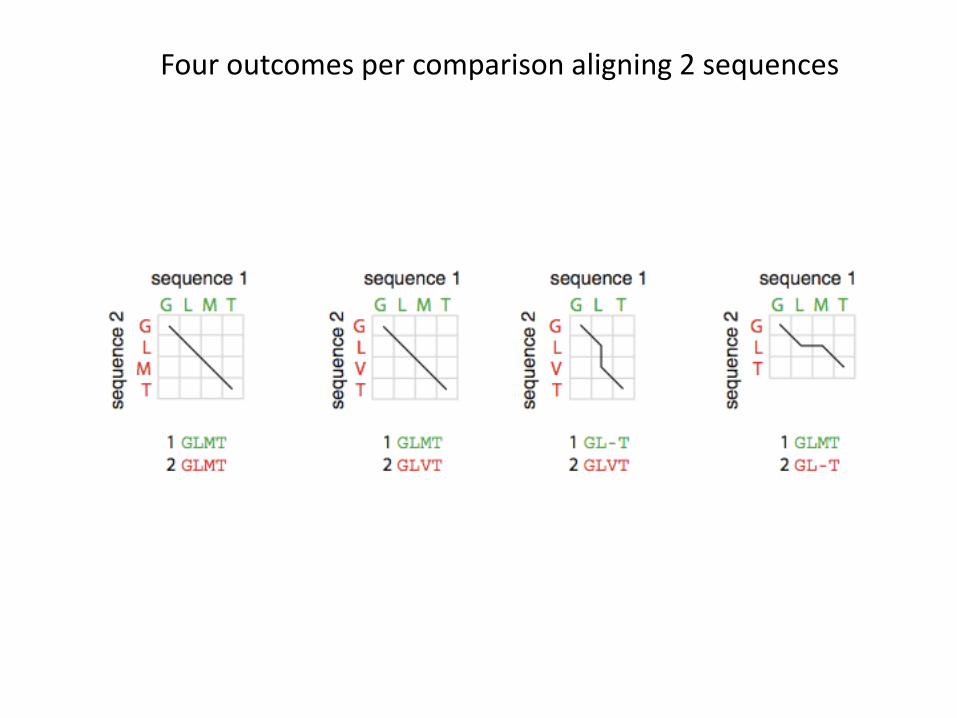
Four outcomes per comparison aligning 2 sequences
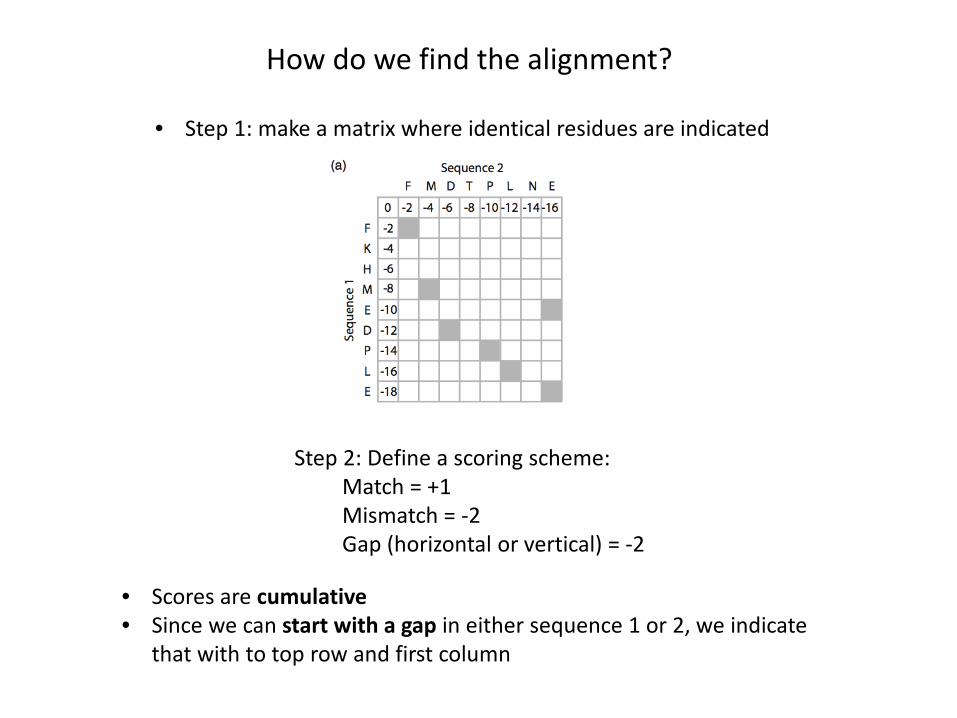
How do we find the alignment?
• Step 1: make a matrix where identical residues are indicated
Step 2: Define a scoring scheme:Match = +1Mismatch = -2Gap (horizontal or vertical) = -2
• Scores are cumulative• Since we can start with a gap in either sequence 1 or 2, we indicate
that with to top row and first column
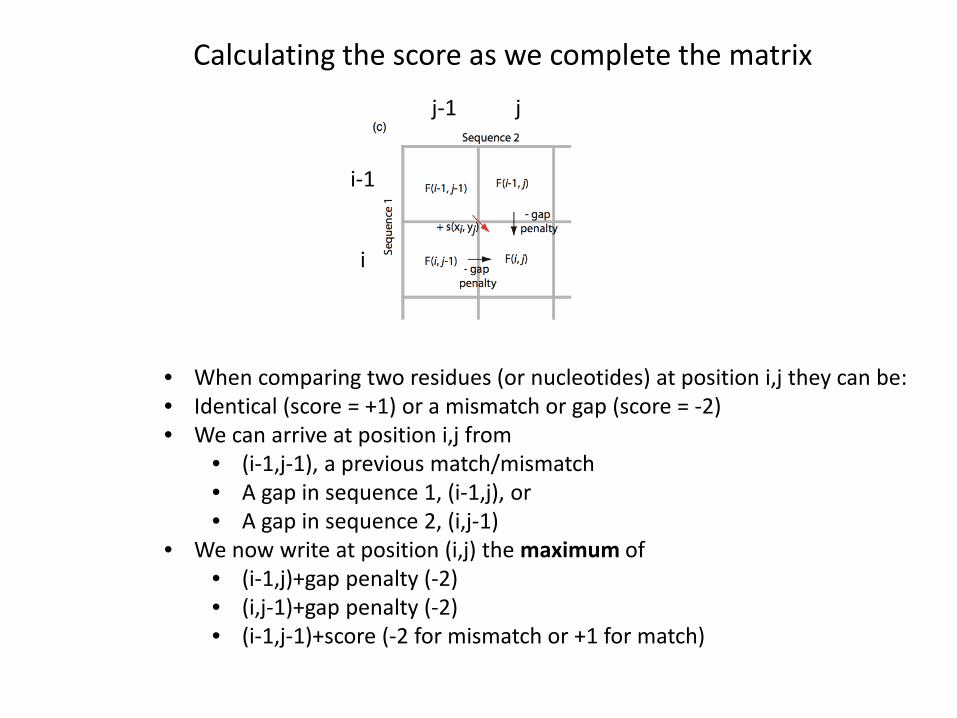
Calculating the score as we complete the matrix
i
jj-1
i-1
• When comparing two residues (or nucleotides) at position i,j they can be:• Identical (score = +1) or a mismatch or gap (score = -2)• We can arrive at position i,j from
• (i-1,j-1), a previous match/mismatch• A gap in sequence 1, (i-1,j), or• A gap in sequence 2, (i,j-1)
• We now write at position (i,j) the maximum of• (i-1,j)+gap penalty (-2)• (i,j-1)+gap penalty (-2)• (i-1,j-1)+score (-2 for mismatch or +1 for match)
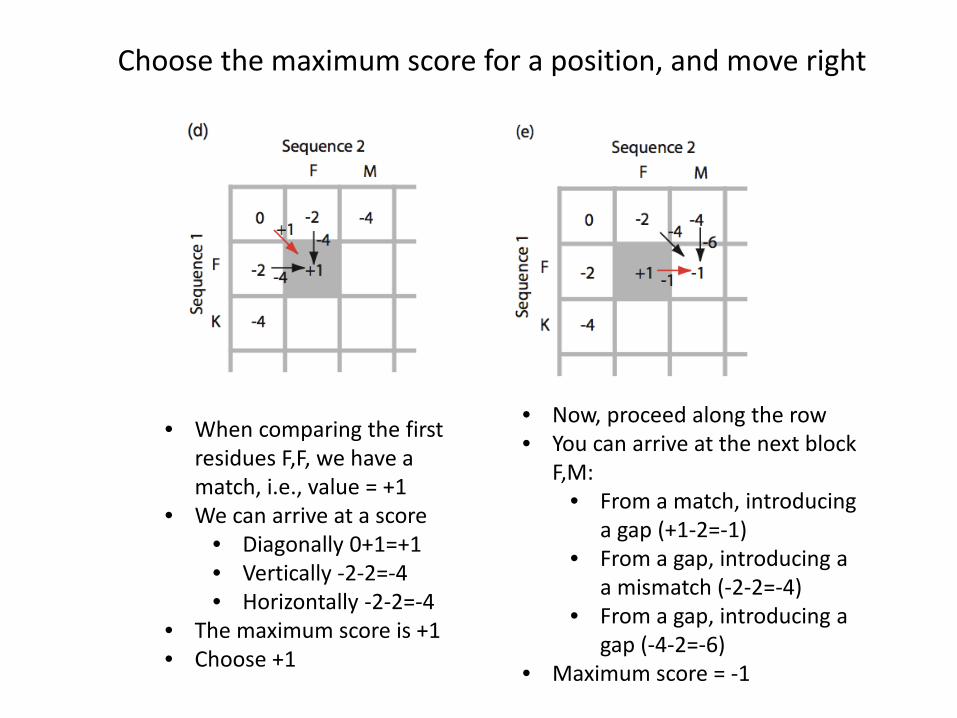
Choose the maximum score for a position, and move right
• When comparing the first residues F,F, we have a match, i.e., value = +1
• We can arrive at a score• Diagonally 0+1=+1• Vertically -2-2=-4• Horizontally -2-2=-4
• The maximum score is +1• Choose +1
• Now, proceed along the row• You can arrive at the next block
F,M:• From a match, introducing
a gap (+1-2=-1)• From a gap, introducing a
a mismatch (-2-2=-4)• From a gap, introducing a
gap (-4-2=-6)• Maximum score = -1
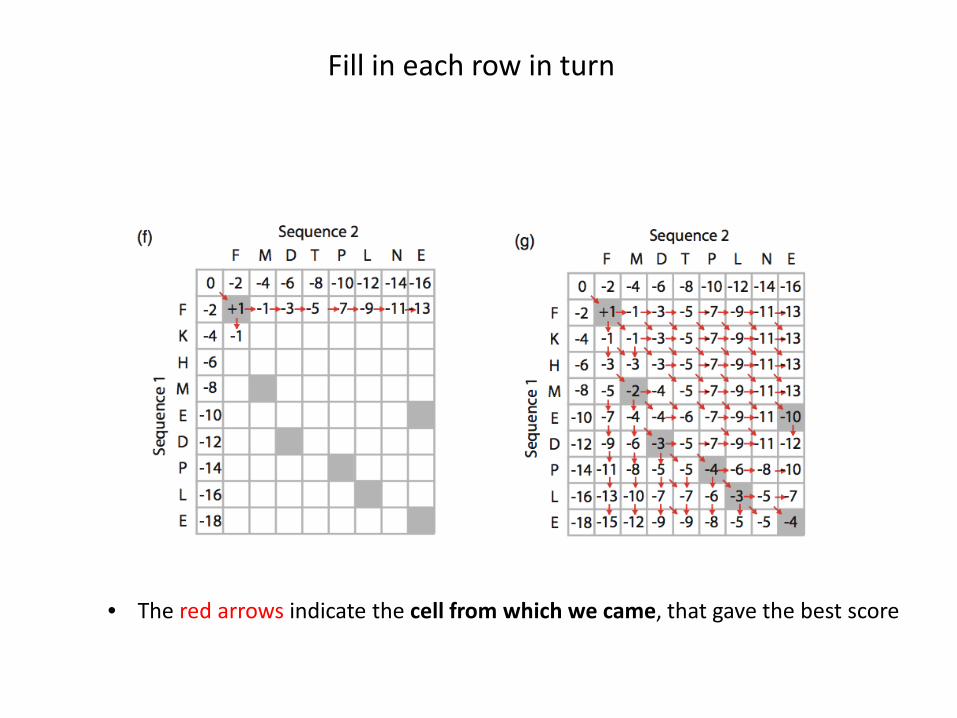
Fill in each row in turn
• The red arrows indicate the cell from which we came, that gave the best score
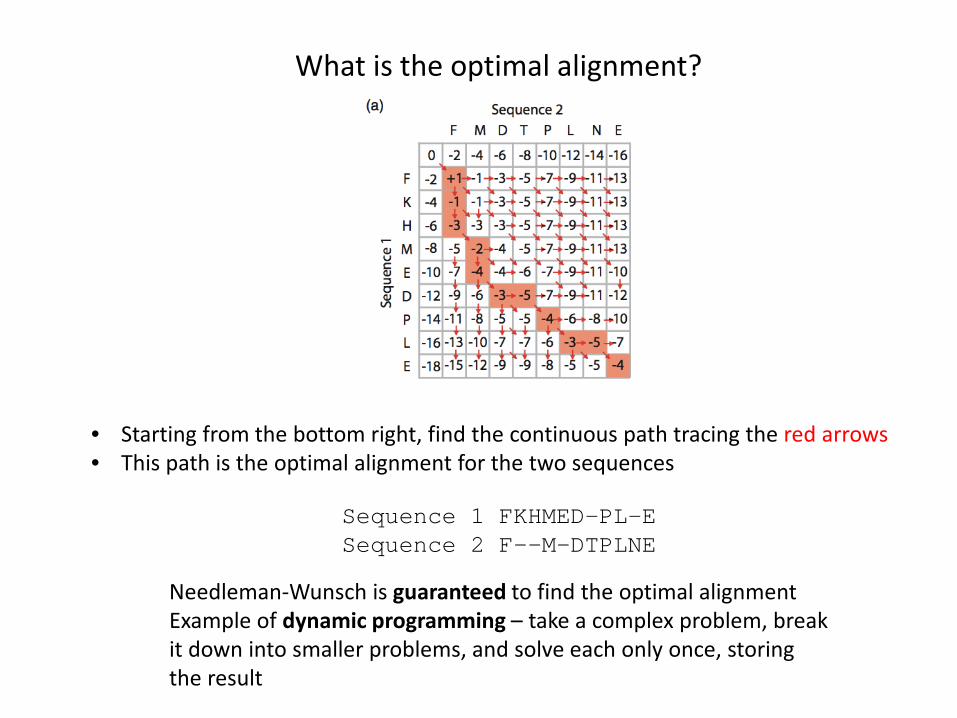
What is the optimal alignment?
• Starting from the bottom right, find the continuous path tracing the red arrows• This path is the optimal alignment for the two sequences
Sequence 1 FKHMED-PL-ESequence 2 F--M-DTPLNE
Needleman-Wunsch is guaranteed to find the optimal alignmentExample of dynamic programming – take a complex problem, break it down into smaller problems, and solve each only once, storing the result

Smith-Waterman Algorithm (Local Alignment)
• Use RNA sequence as example here• Construct matrix m+1,n+1 for m,n sequences• Method is also with dynamic programming, like “needle”, but in
“water” the scoring scheme is different:• The maximum of:
• Diagonal movement: score of (i-1,j-1) + value of match/mismatch• Horizontal movement: score of (i-1,j) + gap penalty• Vertical movement: score of (i,j-1) + gap penalty• If all the above < 0, then insert the score 0
0.0 0.0 0.0
0.0
0.0
Match = +3Mismatch = -2Gap = -1
Sequence 1
Sequ
ence
2

A A U G C C A U U G A C G G0 0 0 0 0 0 0 0 0 0 0 0 0 0 0
C 0 0 0 0 0 3 3 2 1 0 0 0 3 2 1A 0 3 3 2 1 2 2 6 5 4 3 3 2 1 0G 0 2 2 1 5 4 3 5 4 3 7 6 5 5 4C 0 1 1 0 4 8 7 6 5 4 6 5 9 8 7C 0 0 0 0 3 7 11 10 9 8 7 6 8 7 6U 0 0 0 3 2 6 10 9 13 12 11 10 9 8 7C 0 0 0 2 1 5 9 8 12 11 10 9 13 12 11G 0 0 0 1 5 4 8 7 11 10 14 13 12 16 15C 0 0 0 0 4 8 7 6 10 9 13 12 16 15 14U 0 0 0 3 3 7 6 5 9 13 12 11 15 14 13U 0 0 0 3 2 6 5 4 8 12 11 10 14 13 12A 0 3 3 2 1 5 4 8 7 11 10 14 13 12 11G 0 2 2 1 5 4 3 7 6 10 14 13 12 16 15
• Calculate the maximum score for each cell, keeping track of the path
• Find the maximum score in the matrix
• Trace the path back until you hit 0
AAUGCCAUUGACGGCA-GC-CUCG-CUUAG
Smith-Waterman Algorithm (Local Alignment)
• Generate your own “water” matrices with your own scores:http://fridolin-linder.com/2016/03/30/local-alignment.html

Scoring matrices
• Once we have an alignment (global or local), how do we calculate similarity?• Margaret Dayhoff developed a scheme to score alignments in proteins based
on the frequency of substitutions observed in aligned, homologous proteins• Mutations accepted by natural selection were referred to as point accepted
mutations (PAM)• Dayhoff looked at 1572 mutations in 71 groups of closely related proteins
Original amino acid
Subs
titut
ions
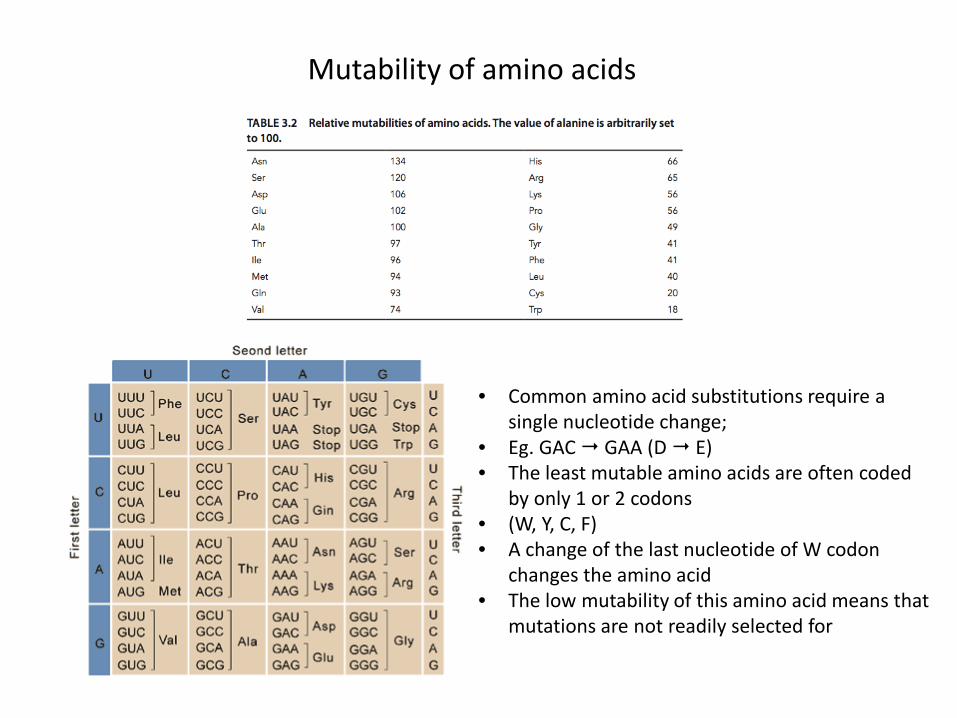
Mutability of amino acids
• Common amino acid substitutions require a single nucleotide change;
• Eg. GAC GAA (D E)• The least mutable amino acids are often coded
by only 1 or 2 codons• (W, Y, C, F)• A change of the last nucleotide of W codon
changes the amino acid• The low mutability of this amino acid means that
mutations are not readily selected for
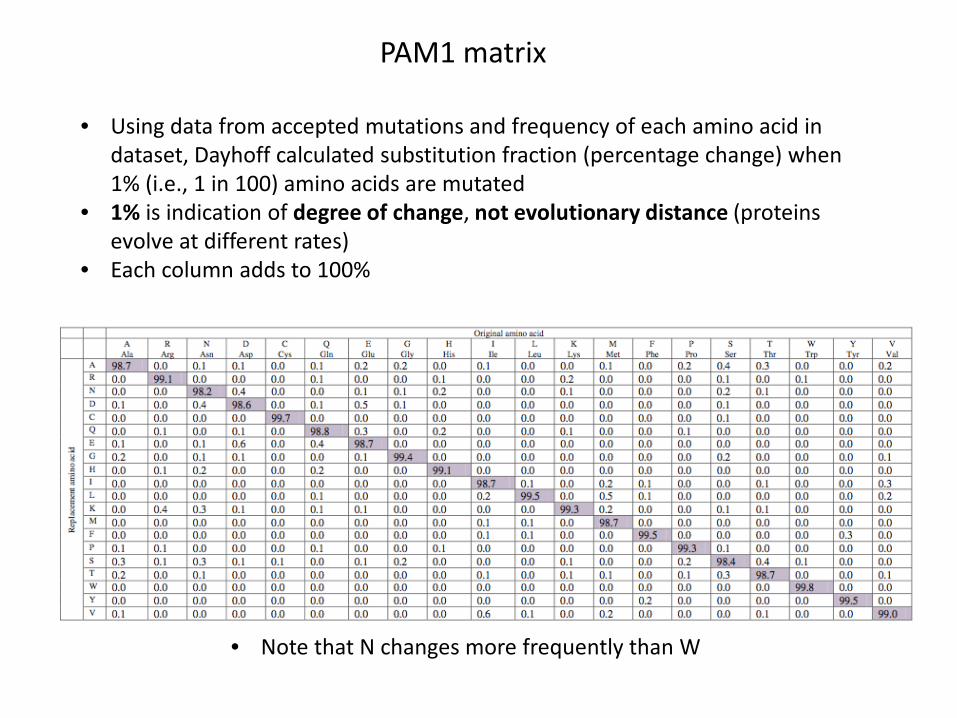
PAM1 matrix
• Using data from accepted mutations and frequency of each amino acid in dataset, Dayhoff calculated substitution fraction (percentage change) when 1% (i.e., 1 in 100) amino acids are mutated
• 1% is indication of degree of change, not evolutionary distance (proteins evolve at different rates)
• Each column adds to 100%
• Note that N changes more frequently than W

Different families of proteins evolve at different rates
• Change in κ-caseins is more than 1 in every 100 amino acids• Thus, using the PAM1 matrix will not give substitution scores that match
the dataset, and we may miss some related proteins because the calculated similarity is incorrect
• The PAM250 matrix represents a dataset where 250 changes have occurred over a 100 amino acid region
• The PAM250 matrix is derived by successive matrix multiplication of the PAM1 matrix with itself, 250 times
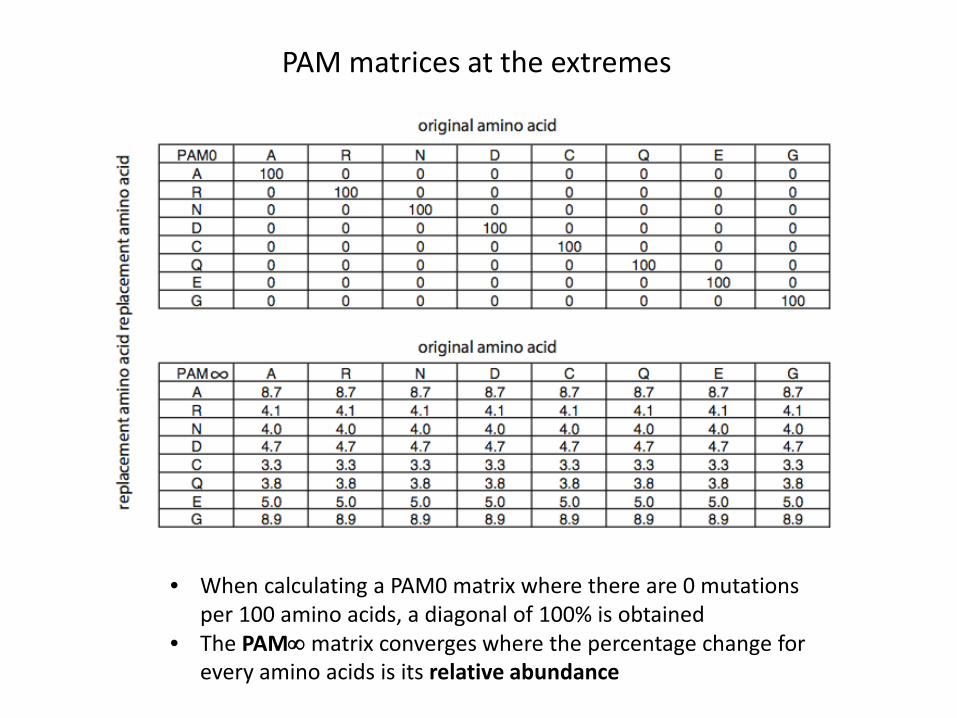
PAM matrices at the extremes
• When calculating a PAM0 matrix where there are 0 mutations per 100 amino acids, a diagonal of 100% is obtained
• The PAM∞ matrix converges where the percentage change for every amino acids is its relative abundance
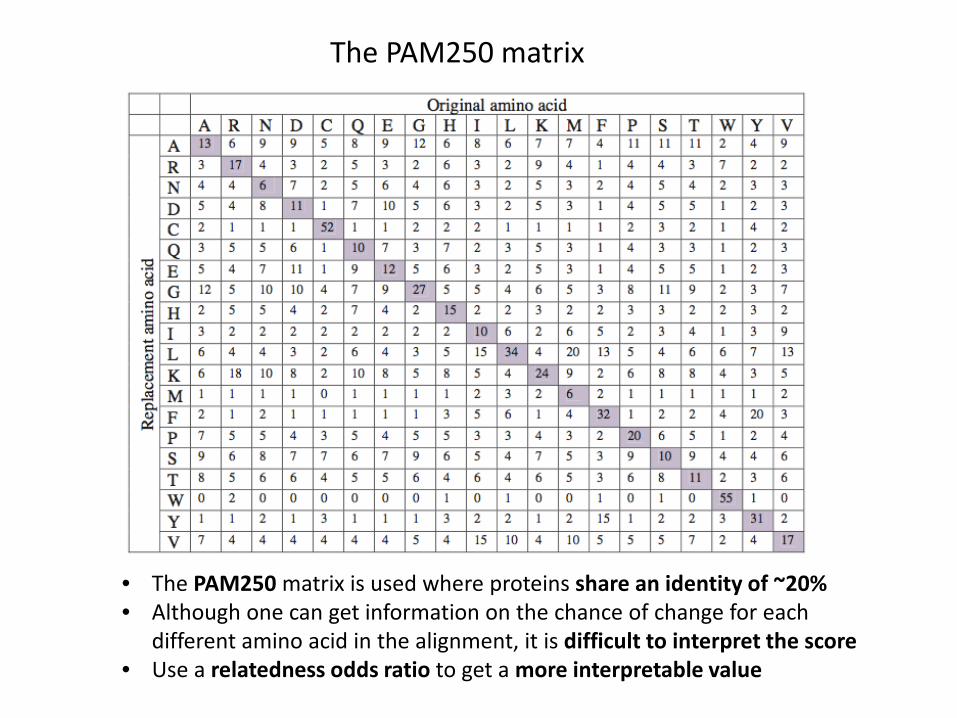
The PAM250 matrix
• The PAM250 matrix is used where proteins share an identity of ~20%• Although one can get information on the chance of change for each
different amino acid in the alignment, it is difficult to interpret the score• Use a relatedness odds ratio to get a more interpretable value
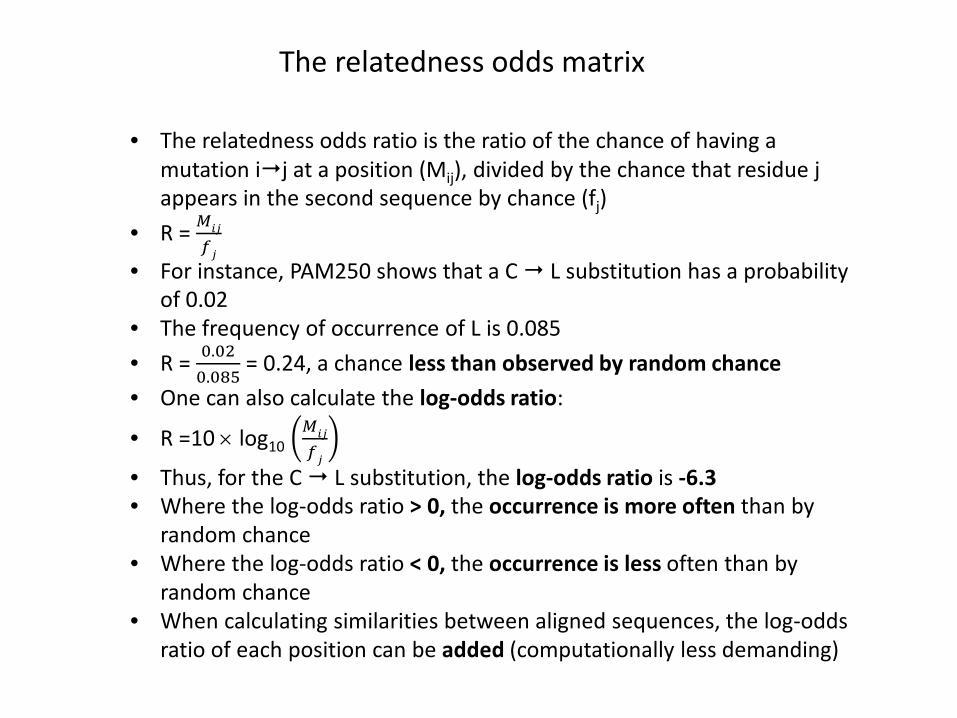
The relatedness odds matrix
• The relatedness odds ratio is the ratio of the chance of having a mutation ij at a position (Mij), divided by the chance that residue j appears in the second sequence by chance (fj)
• R = 𝑀𝑀𝑖𝑖𝑖𝑖
𝑓𝑓𝑖𝑖• For instance, PAM250 shows that a C L substitution has a probability
of 0.02• The frequency of occurrence of L is 0.085• R = 0.02
0.085= 0.24, a chance less than observed by random chance
• One can also calculate the log-odds ratio:
• R =10 × log10𝑀𝑀𝑖𝑖𝑖𝑖
𝑓𝑓𝑖𝑖• Thus, for the C L substitution, the log-odds ratio is -6.3• Where the log-odds ratio > 0, the occurrence is more often than by
random chance• Where the log-odds ratio < 0, the occurrence is less often than by
random chance• When calculating similarities between aligned sequences, the log-odds
ratio of each position can be added (computationally less demanding)
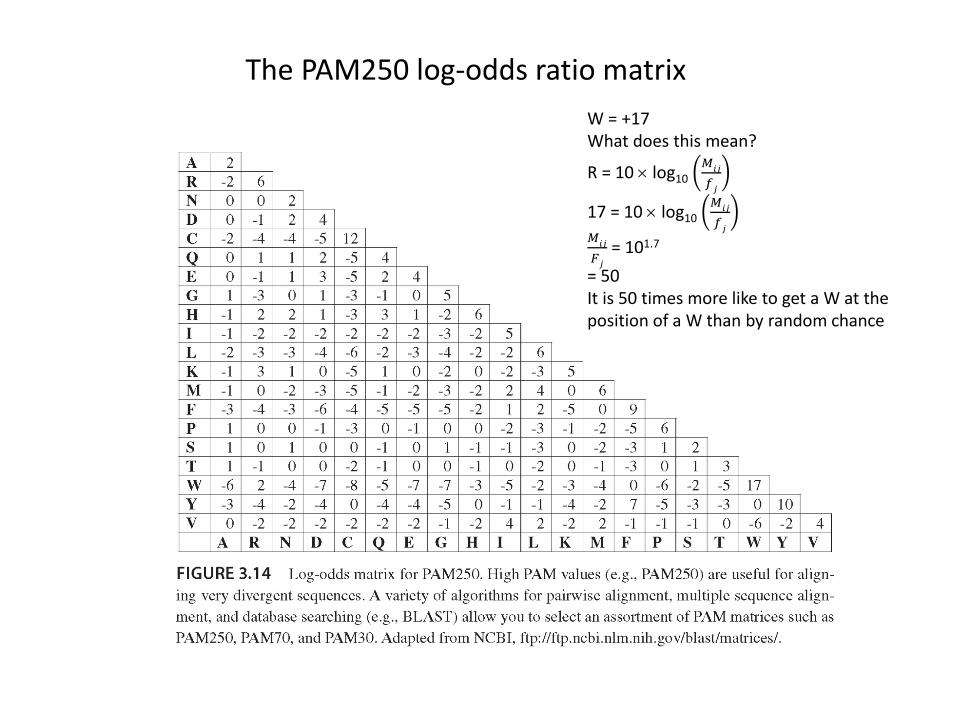
The PAM250 log-odds ratio matrixW = +17What does this mean?
R = 10 × log10𝑀𝑀𝑖𝑖𝑖𝑖
𝑓𝑓𝑖𝑖
17 = 10 × log10𝑀𝑀𝑖𝑖𝑖𝑖
𝑓𝑓𝑖𝑖𝑀𝑀𝑖𝑖𝑖𝑖
𝐹𝐹𝑖𝑖= 101.7
= 50It is 50 times more like to get a W at the position of a W than by random chance

The BLOSUM matrices
• Henikoff and Henikoff used the BLOCK database of conserved regions of proteins that are distantly related
• The BLOSUM matrices use a log2 scoring scheme• BLOSUM62 used alignments of proteins that had at least 62% sequence identity• There are also other BLOSUM matrices, eg. BLOSUM 50, BLOSUM70,
BLOSUM90, based on 50%, 70% and 90% sequence identity• The BLOSUM matrices are more successful at identifying more distantly related
proteins• The scores in the BLOSUM matrices are calculated from empirical, aligned
protein sequences• The scores in the PAM matrices are derived from the PAM1 matrix, with the
assumption that substitution probabilities can be extrapolated

BLOSUM62 matrix
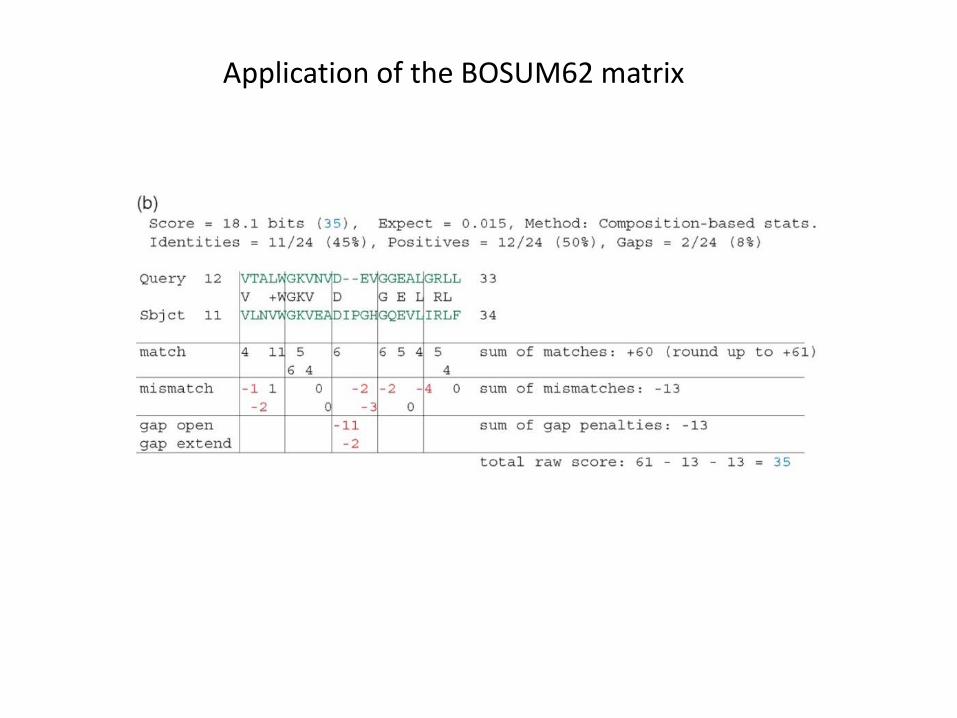
Application of the BOSUM62 matrix