bioavailability of fluoride in drinking water – a …wmaf.org.uk/userfiles/newcastle study on...
TRANSCRIPT
Bioavailability of fluoride in drinking-water – a human experimental study
REPORT for the
UK Department of Health
June 2004
Dr Anne Maguire Senior Lecturer in Child Dental Health, University of Newcastle Dr Paula J Moynihan Senior Lecturer in Nutrition, University of Newcastle Dr Vida Zohouri Research Associate, University of Newcastle
School of Dental Sciences University of Newcastle
Framlington Place Newcastle upon Tyne
NE2 4BW
Research Associates who have contributed to the study: Mr Paul Hindmarch, Research Nurse Ms Elaine Jackson, Research Associate (Nutritionist). Additional members of the Project Steering Committee: Professor John C Mathers Director, Human Nutrition Research Centre, University of
Newcastle. Dr Nick Steen Statistician, University of Newcastle. Mr Leo Petch Production Manager, Northumbrian Water. Mr Aleck Bruce Water Quality Scientist, Northumbrian Water. Mr David J Evans Consultant in Dental Public Health, Newcastle & North Tyneside
Primary Care Trust. Advisor on study design: Emeritus Professor Andrew J Rugg-Gunn Acknowledgement: This work was undertaken by the University of Newcastle who received funding from the Department of Health. The views expressed in this publication are those of the authors and not necessarily those of the Department of Health.

2
Contents
page Executive summary 3
Section 1: Background and policy relevance 7
Section 2: Aims and Objectives 9
Section 3: Methods 10
Section 4: Results 19
Section 5: Discussion 40
Section 6: Conclusions 49
Section 7: Further Research 50 References 51
Figures
List of Appendices

3
Executive Summary Aims and objectives
The aims of the study were to compare the bioavailability of fluoride in naturally
fluoridated water with artificially fluoridated water and to investigate the effect of water hardness
on bioavailability of fluoride in drinking-water. ‘Bioavailability’ is the amount of an ingested
quantity that reaches the bloodstream and the amount that is excreted in the urine.
All four drinking-waters studied contained fluoride at approximately 1 part per million
(1mgF/Litre).
The objectives of the study were to measure blood fluoride concentrations against time
following the ingestion of 4 waters (naturally fluoridated soft water, artificially fluoridated soft
water, naturally fluoridated hard water, artificially fluoridated hard water) and compare these
concentrations with a reference water, using a measure of Relative Bioavailability. Relative
Bioavailability of fluoride (Fp%) in drinking-water is the amount of an ingested quantity of
fluoride from the drinking-water which reaches the bloodstream compared to the amount of an
ingested quantity of fluoride from a “standard reference” water given by the same route of
administration as the drinking-water.
A secondary objective was to measure urinary excretion of fluoride following ingestion of
the different waters as the amount of fluoride recovered in urine reflects the absorption of fluoride
and its elimination from the body.
Background and policy relevance
In order to reduce the prevalence of dental caries, low fluoride concentrations in drinking-
water in selected areas of the United Kingdom (UK) are increased to a target concentration of 1
milligram per litre by the addition of hexafluorosilicic acid or its sodium salt. Fluoride also occurs
naturally in tapwater supplies in the UK, at concentrations up to 1.5 milligrams per litre. Much of
the evidence on the safety of such fluoridation consists of epidemiological studies in populations
exposed to fluoride occurring naturally in water supplies, evidence from populations receiving
artificially fluoridated water supplies being limited. A recent systematic review on the health
effects of fluoride, by the University of York Centre for Reviews and Dissemination concluded
that ‘the assessment of natural versus artificial water fluoridation effects is greatly limited due to
lack of studies making a comparison’. A subsequent Medical Research Council Working Group
established to determine what further research was required to improve knowledge on fluoride and
health, identified bioavailability of fluoride from naturally fluoridated water versus artificially
fluoridated water, and of hard versus soft water, as important areas of uncertainty. There are
currently no data from studies in humans on the bioavailability of fluoride from tap water supplies.
4
Fluoride is present in water as fluoride ions due to the almost complete dissociation of the
parent fluoride compounds, occurring either naturally (predominantly from minerals such as
fluorspar [calcium fluoride]) or added as hexafluorosilicic acid or its sodium salt. Most of the
fluoride ingested in drinking-water will enter the bloodstream. It has been suggested that
absorption of ingested fluoride may be lower when the water is hard (because calcium is a major
determinant of water hardness, and calcium in large amounts is known to reduce absorption of
fluoride). It has also been suggested that fluoride may be more readily absorbed when it arises
from hexafluorosilicic acid or the sodium salt than when it arises naturally.
Study methods
The study was carried out in the School of Dental Sciences, University of Newcastle.
Twenty healthy adults (11 male and 9 female), with a mean age of 25.5 years were recruited to
take part in the study. Each subject attended 5 experimental sessions, testing a different drinking-
water on each occasion (i.e a cross-over design study). One week prior to the experiment and
throughout the experimental period, subjects were provided with fluoride-free toothpaste and low
fluoride bottled water for drinking and cooking. Subjects were also asked to avoid tea and
seafoods which contain appreciable amounts of fluoride. Waters were tested ‘blind’ in that neither
the volunteer nor researchers knew which water was being drunk on which occasion. The 5
waters were:-
Hard artificially fluoridated water: Campion Hills, Leamington Spa (Severn Trent Water)
with a fluoride content of 0.97mg/Litre.
Soft artificially fluoridated water: Gunnerton, Northumberland (Northumbrian Water) with
a fluoride content of 1.01mg/Litre.
Hard naturally fluoridated water: Braintree and Bocking, (Anglian Water Services) with a
fluoride content of 0.91 mg/Litre.
Soft naturally fluoridated water: Acqua Panna, Tione Spring, Italy (Panna SpA, Italy) with
a fluoride content of 1.06 mg/Litre.
Reference water. Water for irrigation BP (British Pharmacopeia) with an added fluoride
content of 1.02 mg/litre. (Pharmacy Dept, Royal Victoria Infirmary, Newcastle upon Tyne
Hospitals NHS Trust)
Blood samples were taken at baseline and at regular intervals up to 8 hours following water
consumption. Urine samples were collected from midnight before each experimental period to
midnight following each experimental period to give 24 hour samples. During the experimental
period, subjects only consumed specified low fluoride drinks meals and snacks at set time points.

5
The calcium and fluoride content of the waters were tested independently and by the
investigators. The concentration of fluoride in plasma and urine samples was measured using
standard laboratory procedures based on the fluoride-ion selective electrode technique, as
specified in the appendices of this report.
Summary of findings
Regarding the pharmacokinetics of fluoride in plasma following ingestion of 500ml of the
test water or reference water, a number of parameters are important when considering the
dynamics of fluoride absorption into the bloodstream. These parameters include the time to reach
maximum plasma concentration of fluoride (Tmax), the peak plasma concentration of fluoride
(cmax) and the Area Under the Curve (AUC). AUC is the area under the curve of the plasma
concentration as a function of time after exposure to a substance. It is frequently used in clinical
pharmacology to estimate bioavailability. In the present study, it has been used to compare the
bioavailability of naturally-occurring and added fluoride in hard and soft drinking-waters.
In this study:
• The Time to reach Maximum Plasma Concentration of fluoride (Tmax) ranged from 48
minutes for naturally fluoridated hard and soft water and artificially fluoridated hard water
to 51 minutes for artificially fluoridated soft water. Differences between type of fluoride
and level of hardness were not statistically significant.
• The dose-corrected (to 1mg/Litre F) and baseline-corrected Peak Plasma Concentration of
fluoride (cmax) ranged from 12.48 ng.ml-1 for naturally fluoridated soft water (Italian
bottled mineral water) to 15.32 ng.ml-1 for artificially fluoridated soft water. Differences
between type of fluoride and level of hardness were not statistically significant.
• The dose-corrected (to 1mg/Litre F) and baseline-corrected Area Under the Curve for 0 to
3 hours (AUC1(0-3)) following ingestion of the water ranged from 973 ng.min.ml-1 for
naturally fluoridated soft water (Italian bottled mineral water) to 1217 ng.min.ml-1 for
artificially fluoridated hard water. Differences between type of fluoride and level of
hardness were not statistically significant.
• The dose-corrected (to 1mg/Litre F) and baseline-corrected Area Under the Curve (AUC)
for 0 to 8 hours (AUC1(0-8)) following ingestion of the water ranged from 1328
ng.min.ml-1 for the reference water to 1679 ng.min.ml-1 for artificially fluoridated soft
water. Differences between type of fluoride and level of hardness were not statistically
significant.
• For bioavailability relative to the reference water over 0-3 hours following ingestion of the
water, the waters showed values ranging from 106% (95% CI= 88, 125) for the naturally

6
fluoridated soft water (bottled Italian mineral water) to 141% (95% CI = 100, 181) for
artificially fluoridated hard water. The difference between hard and soft waters was not
statistically significant. Relative bioavailability was significantly greater for artificially
fluoridated water than naturally fluoridated water; the difference was not statistically
significant when one subject with an anomalous value of bioavailability for reference
water was removed from the analysis.
• When bioavailability relative to the reference water over 0 to 8 hours was considered, the
artificially fluoridated waters showed similar values at 150% (95% CI= 98, 202) and 155%
(95% CI= 94, 217) for hard water and soft water respectively, while the naturally
fluoridated waters had a bioavailability relative to the reference water of 124% (95% CI=
95, 153) and 111% (95% CI= 88, 135) for hard water and soft water (Italian bottled
mineral water) respectively. The difference between hard and soft waters was not
statistically significant. Relative bioavailability was significantly greater for artificially
fluoridated water than naturally fluoridated water; the difference was not statistically
significant when one subject with an anomalous value of bioavailability for reference
water was removed from the analysis.
• The volume of urine produced during the experimental period was statistically
significantly higher for soft water compared with hard water, but there were no statistically
significant differences between waters for urine volume produced before or after the
experimental period.
• The amount of fluoride excreted in urine over the 8 hour experimental period as a
percentage of ingested fluoride was similar for all waters, ranging from 74% for naturally
fluoridated hard water to 82% for artificially fluoridated soft water.
• There were no statistically significant differences in total urinary excretion of fluoride
between either test and reference waters, naturally or artificially fluoridated waters or hard
and soft waters before during or after the experimental period.
Conclusions
There was no statistically significant difference between artificially fluoridated and
naturally fluoridated water, or between hard and soft water for Tmax, Cmax, or Area under the Curve
for plasma fluoride concentration following water ingestion in healthy young adults.
Thus, within the limits imposed by the small number of subjects, this study found no
evidence for any differences between the absorption of fluoride ingested in artificially fluoridated
drinking-water, and in drinking-water in which the fluoride is present naturally, or between the
absorption of fluoride from hard and soft waters, at fluoride concentrations close to 1 part per
million.

7
Section 1: Background and policy relevance Fluoride occurs naturally in tap drinking-water supplies in the United Kingdom (UK), at
concentrations up to 1.5 milligrams per litre. In order to reduce the prevalence of dental caries,
low fluoride concentrations in drinking-water in selected areas of the UK may be increased to a
target concentration of 1 milligram per litre by the addition of hexafluorosilicic acid or its sodium
salt. Much of the evidence on the safety of such fluoridation consists of epidemiological studies
in populations exposed to fluoride occurring naturally in water supplies.
Studies regarding safety and efficacy of water fluoridation were recently systematically
reviewed by the University of York Centre for Reviews and Dissemination (McDonagh et al
2000). Objective 5 of the review was to identify whether there were any differences in the effects
of natural and artificial water fluoridation and the reviewers concluded that “the assessment of
natural versus artificial water fluoridation effects is greatly limited due to the lack of studies
making this comparison. Very few studies included both natural and artificially fluoridated areas,
and direct comparisons were not possible for most outcomes. No major differences were apparent
in this review, however, the evidence is not adequate to make a conclusion regarding this
objective”.
High natural levels of fluoride occur typically (but not exclusively) in hard water, while
artificial fluoridation usually involves softer water sources. Water hardness is principally
determined by the concentrations of calcium and magnesium ions in water, and may be expressed
as the equivalent concentration of calcium carbonate. The hardness of water supplies in the UK
ranges from very soft (approximately 20 mg calcium carbonate /litre) in Glasgow, to very hard
(approximately 450 mg calcium carbonate /litre) in Hartlepool.
It is thought that the absorption of fluoride from the gut into the bloodstream is essentially
complete at approximately 95%. It has been postulated that this may be influenced by the type of
fluoride compound in the water and also the water hardness. Calcium may decrease uptake of
fluoride from the gut into the bloodstream perhaps through ion-pairing, but the importance of any
such effect is unclear (Whitford 1996, Medical Research Council 2002).
Fluoride is present in water supplies as fluoride ions, due to the almost complete
dissociation of the parent fluoride compounds, occurring either naturally (predominantly from
minerals such as fluorspar [calcium fluoride]) or added as hexafluorosilicic acid or its sodium salt
(Department of the Environment 1987, Her Majesty's Government 1991). The undissociated
proportion is between 10-18 and 10-30 of the dissociated fluoride ions over the pH range of 6-9 that
is usually found in water supplies, with the proportion of free fluoride ion ranging from 91% for
water with a very high hardness level of 450 mg calcium carbonate/litre, to more than 99% for soft
water (<50 mg/l CaCO3) (Jackson et al 2002).

8
The recent review of the chemistry and bioavailability aspects of fluoride in drinking-water
by Jackson and co-workers (Jackson et al 2002. Also available at
http://www.liv.ac.uk/bfs/wrcreport.pdf ) concluded that:
“ In terms of chemistry and bioavailability there is absolutely no difference between added and
‘natural’ fluoride”,
and that;
“The effect of major cations – calcium and magnesium (hardness) and sodium – on the chemical
speciation and hence bioavailability of fluoride is very small”.
Subsequently, however, the Department of Health was advised by the Medical Research Council’s
Working Group on Water Fluoridation and Health (Medical Research Council 2002. Also
available at http://www.mrc.ac.uk/pdf-publications-water_fluoridation_report.pdf ), that:
“New studies are needed to investigate the bioavailability and absorption of fluoride from
naturally fluoridated and artificially fluoridated drinking-water, looking also at the influence of
water hardness. This is particularly important because if the bioavailability is the same, many of
the findings relating to natural fluoride can also be related to artificial fluoridation.”
No studies have tested the effect of water hardness and source of fluoride ion on fluoride
bioavailability.
The present study was commissioned by the Department of Health in response to the
Medical Research Council recommendation.
The Food and Drug Administration in the United States defines bioavailability as the rate and
extent to which the active drug ingredient or therapeutic moiety is absorbed from the drug product
and becomes available at the site of drug action (http://www.fda.gov/cder/guidance/4964dft.pdf)
and practically all bioavailability studies are based on blood level or urinary excretion data. The
term “Relative Bioavailability” has been defined (Ritschel 1984) as “the comparison of the rate
and extent of absorption of a test preparation to the rate and extent of a so-called «standard»
given by the same route of administration as the test preparation”. Ritschel (1984) recommended
that an in vitro method was not substituted for an in-vivo study to measure bioavailability. As
different factors might affect the bioavailability, he suggested a formula to measure Relative
Bioavailability based on the extent of absorption:
“Relative Bioavailability = AUC test x D reference/ AUC reference x D test”
Where AUC is area under the blood concentration-time curve and D is dose of the test or
reference product. This equation has been widely used to measure Relative Bioavailability.
Plasma concentrations and renal excretions of fluoride have been studied extensively.
However, in spite of the importance of fluoride in drinking tap water, no in vivo data have been
reported on the bioavailability of fluoride from drinking tap water.

9
Section 2: Aims and Objectives
Aims
The aims of the study were to investigate the effect of water hardness and source of fluoride
ion on bioavailability of fluoride in drinking-water by:
1. Comparing the Relative Bioavailability of fluoride in artificially fluoridated hard and
naturally fluoridated hard drinking-water.
2. Comparing the Relative Bioavailability of fluoride in artificially fluoridated soft and
naturally fluoridated soft drinking-water.
3. Comparing the Relative Bioavailability of fluoride in artificially fluoridated hard and
artificially fluoridated soft drinking-water.
4. Comparing the Relative Bioavailability of fluoride in naturally fluoridated hard and naturally
fluoridated soft drinking-water.
The study used drinking-waters containing fluoride ion at approximately 1mg F/litre (1
ppm F), range 0.7- 1.3 mg F/litre (0.7 –1.3 ppmF).
Objectives
To measure peak plasma concentration, time of recorded peak plasma concentration and
Area Under the Curve (AUC) for plasma concentrations of F against time, following ingestion of
4 drinking-waters and 1 reference drinking-water.
To measure 24 hour urine excretion of F, as well as the amount of F in a urine sample
taken before, and 2 urine samples taken following ingestion of 4 drinking-waters and 1 reference
drinking-water.

10
Section 3: Methods Ethical approval
Ethical approval was obtained from Newcastle Joint Ethics Committee (Appendix 1).
Study design, location and research team
This human experimental double blind cross-over trial was managed and directed by Drs
Maguire and Moynihan from the School of Dental Sciences, University of Newcastle upon Tyne
and was conducted in the Clinical Trials Unit and Fluoride Research Laboratory of the School of
Dental Sciences. Dr. Vida Zohouri was responsible for project coordination and the everyday
running of the project. The project steering group membership included: Drs Maguire, Moynihan
and Zohouri (Applicants), Professor John C. Mathers, Director of the Human Nutrition Research
Centre, University of Newcastle, Dr Nick Steen, Senior Research Associate (Medical Statistician),
Health Services Research, University of Newcastle upon Tyne, Mr Leo Petch and Mr Aleck Bruce,
Production Manager and Water Quality Scientist respectively at Northumbrian Water and Mr
David Evans, Consultant in Dental Public Health. Emeritus Professor Andrew Rugg-Gunn advised
on the design of the study. Purpose-employed staff were: Mr Paul Hindmarch, Research Nurse
and Ms Elaine Jackson, Research Associate (Nutritionist).
Sample size
The study had a crossover design, comparing observations within individuals. It was
assumed that the correlation between pairs of observations from each subject was 0.5. Power
calculations based on AUC data for plasma F from studies which have investigated bioavailability
of F following ingestion of F solutions with a difference in F content of 1.9ppm (Liote et al 1992),
have shown that a sample size of 20 will provide a 80% power to detect an effect size of 0.63
assuming a significance level of 5%. An effect size of 0.63 corresponds to a change in outcome of
0.63 standard deviations.
Subjects
Twenty healthy adult volunteers aged 20-35 years were recruited from employees of the
University of Newcastle. The study aimed to include an equal number of male and females. The
age range was chosen to ensure the inclusion of individuals whose skeletal bone density was still
increasing with a net positive flow of fluoride ions from plasma to bone. The relatively narrow age
range was also chosen to minimise variability in order to increase the possibility of detecting
treatment-related differences. All individuals interested in taking part were provided with a Study
11
Information Document to read and were invited to request further information before written valid
consent was obtained (Appendix 2).
Inclusion criteria
• Healthy adult volunteers aged between 20 and 35 years with no history of metabolic
disease or acid-base disturbance and not receiving a therapeutic diet.
• Volunteers resident in the same area for at least 3 months prior to the study, not planning
to move residence during the 2 month period of data collection. This was to avoid a change
in their chronic fluoride exposure levels if they moved from a fluoridated to a non-
fluoridated area or vice versa.
Exclusion criteria
• Adult volunteers not aged between 20 and 35 years.
• Adult volunteers with metabolic disease or acid-base disturbance or receiving a therapeutic
diet.
• Adult volunteers who had moved area of residence in the 3 months prior to study or were
due to move area during the 2 month period of data collection.
Experimental sessions
The study was carried out in 5 sessions in which the plasma concentration of ionic fluoride
was recorded after ingestion of 500ml of a test or reference water at room temperature. As
described earlier, the study aimed to use drinking-waters containing fluoride at approximately
1mg F/litre with an expected range of 0.7 – 1.3mg F/litre.
Sourcing the test waters required extensive information gathering, initially with the help of
the Drinking-water Inspectorate (http://www.dwi.gov.uk), the Department for Environment, Food
and Rural Affairs http://www.defra.gov.uk/environment/statistics/inlwater/iwfg06.htm, national
water bodies eg. http://www.water.org.uk, and a number of water companies
(http://www.eswater.co.uk, http://www.nwl.co.uk, http://www.anglianwater.co.uk). Once areas of
domestic water supply, potentially with the required levels of fluoride content and hardness, had
been identified, the relevant water companies (Northumbrian Water, Anglia Water and Severn
Trent Water) were contacted individually to gain more detailed information regarding a source of
supply of suitable test drinking-waters with respect to fluoride content and water hardness.
In view of the geological features of the UK, a naturally fluoridated soft water could not be
sourced in the UK, and a bottled natural mineral water from an Italian spring source was used as
an alternative.
12
The 4 test waters were:
1. Hard drinking-water, artificially fluoridated with hexafluorosilicic acid at approximately
1mgF /litre.
2. Soft drinking-water, artificially fluoridated with hexafluorosilicic acid at approximately
1mgF /litre.
3. Naturally fluoridated hard drinking-water containing fluoride at approximately 1mgF /litre.
4. Naturally fluoridated soft drinking-water containing fluoride at approximately 1mgF /litre.
The reference water was:
Water for Irrigation BP containing fluoride at 1 mgF/litre (added as sodium fluoride; see
Appendix 3).
With regard to water hardness, the two test drinking-waters described as hard contained
>380mg CaCO3/litre, while the two test drinking-waters described as soft contained <64 mg
CaCO3/litre (Appendix 4)
Following initial testing of samples of potential sources of supply by AES (Analytical and
Environmental Services, Horsley, Newcastle upon Tyne, NE15 0PA), all 4 test waters and the
Reference water used were independently tested by Stockton Quality Control Laboratory for
fluoride and calcium carbonate content.
The sources of the test waters were:
Hard artificially fluoridated water: Campion Hills, Leamington Spa (Severn Trent Water,
Campion Hills Water Treatment Works, Black Lane, Leamington Spa,CV32 7UA)
Soft artificially fluoridated water: Gunnerton, Northumberland (Northumbrian Water)
Hard naturally fluoridated water: Braintree and Bocking, Essex (Colchester Treatment
Works, Anglian Water Services, Peartree Road, Stanway, Essex, CO3 0JZ)
Soft naturally fluoridated water: Acqua Panna, Tione Spring, Italy (Panna SpA, Italy)
The standard reference water was produced by the Pharmacy Department at the Royal Victoria
Infirmary, Newcastle (Appendix 3).
Fifteen litres of each of the three UK- sourced drinking-waters were drawn into plastic
polyethylene storage bottles using the following standard procedure. Each one litre plastic bottle,
provided by AES (Analytical and Environmental Services, Newcastle upon Tyne), was:
1. unpacked;

13
2. rinsed out twice with the water with which they would be filled;
3. filled to about 2 inches from the top (to the rim on the vertical part of the bottle);
4. replaced and sealed in the packaging ready to be collected as soon as possible for return
to the School of Dental Sciences, Newcastle by TNT for storage in a freezer at -20oC.
The soft naturally fluoridated water was purchased in 500ml plastic polyethylene bottles
from a local retail outlet.
Three bottles of each of the 4 test waters and 1 reference water were sent to the Stockton
Pharmaceutical Quality Control Laboratories (163 Durham Road, Stockton on Tees TS19 0EA)
for testing for fluoride and calcium carbonate content (Appendix 4).Two bottles of each water
were used for fluoride testing and one for hardness testing.
The drinking-waters were colour- and letter-coded A to E by a Senior Technician in Oral
Biology, School of Dental Sciences who singly held the code until analysis of the results was
complete. Waters were identified in this way throughout the experimental periods to ensure double
blind procedures.
Experimental procedure
The study and samples analysis were carried out in the Clinical Trials Unit and the
Fluoride Research Laboratory at the School of Dental Sciences. The study was conducted at the
same time of day for each experiment for each subject, to control for circadian rhythms and for
practical reasons regarding fasting of individuals. The experimental conditions were controlled to
be consistent on each experimental period, using the same clinical trial rooms, equipment and staff
and encouraging a similar level of low level activity (eg. reading, watching television, listening to
the radio, using a laptop) between subjects and within subjects over the 5 experimental periods for
all subjects. This was to minimise any intra-subject variability and provide valid comparative
data.
The volunteers were provided with a fluoride-free toothpaste to use during a 1 week wash-
out period prior to the first experimental session and were asked not to use any toothpaste,
mouthwash containing fluoride or any other significant fluoride products such as fluoride tablets
one week before, as well as during, the whole experimental period. The subjects were also asked
to avoid drinking tea, which has a mean fluoride concentration of 1.5 mg F/litre (Duckworth &
Duckworth 1978), and beer and avoid eating seafood during the whole of the washout and
experimental period. All volunteers were provided with low-fluoride bottled waters (Asda – Eden
Falls, <0.02mgF/L) for drinking and cooking at home, at work or away from home for the 3 days
before each of the 5 experimental periods.

14
Each subject attended 5 experimental sessions with a wash-out period of at least one week
between each experiment. The order in which each subject underwent the 5 experimental periods
was randomized using a set of random number tables. The study was double blind and the 4 test
drinking-waters and reference drinking-water were allocated randomly for testing in the 20
individuals over 5 sessions by the project statistician (see Appendix 5). Following fasting from
the previous midnight, 500ml of drinking-water was drunk by each subject following baseline (T0)
blood collection at the beginning of each session. Five ml blood samples were then collected at
timed intervals up to 8 hours following ingestion of the water. The schedule for sample collection
is provided in Appendix 6. Urine was collected for 24 hours from midnight before each
experimental period to the following midnight.
After collecting the T6 sample (2 hours after ingesting the water), a 250ml glass of 5%
glucose (Ekstrand, 1994), prepared with low-fluoride bottled water (Asda – Eden Falls,
<0.02mgF/L), and flavoured with 10 ml non-fluoride squash was consumed by the subjects. The
same low fluoride meal was prepared for all subjects to be eaten as lunch and as an afternoon
snack. The same menu was provided for all subjects at all experimental sessions. Details of menu,
drinks and snacks are provided below:
Glucose Drink: -fluoride free glucose powder was purchased from the RVI
pharmacy, Newcastle.
Lunch: - Jacket potato with ratatouille (provided by Scolarest Catering,
University of Newcastle)
- Cherry nougat royal (purchased from Marks & Spencer, Newcastle
upon Tyne)
Snack: - Fresh fruit salad (provided by Scolarest Catering, University of
Newcastle)
Testing of the F content of foods and snacks
To confirm the low fluoride concentration and low calcium content of the selected lunch
and snack, the fluoride content of all food and drink items was measured in the Fluoride Research
Laboratory, School of Dental Sciences. The calcium content was calculated using McCance and
Widdowson’s, The Composition of Foods (Holland et al 1992).
Sample collection and preparation
Urine samples
Urine was collected by spontaneous voiding during the following time intervals:

15
1. One pooled urine sample from midnight before the experimental period up until 8.30 am
just before the experimental period.
2. Individual urine samples during the experimental period (during which the time of each
spontaneous voiding was recorded) and,
3. One pooled sample from the end of the experimental period up until midnight.
These samples together represented a 24 hour period of collection. The volume and pH of
each sample was recorded immediately following the voiding and a 5 ml aliquot was stored in a
freezer at –20°C until fluoride measurement.
Blood samples
An intravenous catheter was inserted into an ante-cubital vein to draw blood samples under
fasting conditions (T0) and at 15, 30, 45, 60, 90, 120, 150, 180, 240, 360 and 480 minutes after
ingestion of each drinking-water giving samples T1 to T11 respectively. Each 5ml blood sample
was withdrawn into sodium heparinate-sprayed F-free plastic tubes and centrifuged at 1300 rpm
for 5 minutes. Samples were stored in a freezer at –20°C until fluoride measurement.
Coding of samples
Collected blood and urine samples were coded as following:
- Subject ID (1A to 6D) 2 Characters
- Time of collection (T0 to T11) 2-3 Characters
- Session (1 to 5) 1 Character
For instance, the code “1A-T0-3” represents: Plasma sample from Subject 1A at baseline (time
zero) on session three.
Analytical procedure
Fluoride concentrations in plasma (in ng/ml) were measured using the “Known Addition –
Slope Determination Technique” (Ekstrand, 1977) (See Appendices 7 and 8).
Urine fluoride concentration (in mgF/litre) was measured directly by use of a F-ion-
selective electrode (Orion Research). Fluoride concentrations in food were measured using a F-
ion-selective electrode after diffusion with hexamethyldisiloxane (HMDS) as described by
Venkateswarlu (1992) and modified by Zohouri and Rugg-Gunn (1999).

16
Data collection, collation and analysis
Plasma Samples
The mV reading for each plasma sample (See Standard Laboratory Operating Procedure
for plasma analysis in Appendix 7) was entered into data sheet “D” and then transferred to Excel
worksheet “E” to calculate the plasma concentration (Appendix 8).
All the plasma samples were analysed in duplicate and the mean value for plasma fluoride
concentration reported as the absolute plasma F concentration [C (Sample)] for each sample. From
the individual plasma F concentrations, the following pharmacokinetic parameters were
calculated:
a) To determine the increase in plasma fluoride concentration following consumption of the
drinking-water, a “baseline-corrected” plasma fluoride concentration “c” was derived by
subtracting the baseline (T0) plasma fluoride concentration from the concentration of
fluoride ion found in each sample obtained following ingestion of a test drinking-water or
reference water. This value represented the concentration of fluoride in plasma arising
from the fluoride content of the test or reference water.
b) “c(0)” was then calculated by changing any negative values of “c” to zero.
c) AUC1(0-8): the values of “c(0)” were used to calculate the area under the plasma fluoride
concentration versus time curve (AUC) from 0 to 8 hours by the trapezoidal rule for all
waters tested.
d) AUC1(0-3): since plasma F concentrations returned to baseline values after 3 hours for
most subjects, the Area Under the Curve using “c(0)” was also calculated from 0 to 3
hours.
e) AUC1(0-8) and AUC1(0-3): These were AUC1 values for 0-8 and 0-3 hours respectively,
“dose-corrected” for the F concentration in each test or reference water. The dose-
corrected calculation was made by dividing the AUC1 value by the concentration of
fluoride (mg/Litre) in the test or reference water (ie 1.02, 0.97, 1.01, 0.91 or 1.06mg/Litre
for Reference, Artificial Hard, Artificial Soft, Natural Hard and Natural Soft waters
respectively). This value was then multiplied by 1mg/litre to relate it to water with a
fluoride content of 1mg/Litre.
f) AUC2(0-8): the AUC from 0 to 8 hours, was calculated using “c”.
g) AUC2(0-3): the AUC from 0 to 3 hours, was calculated using “c”.
h) Maximum F concentration (cmax): this concentration was corrected for baseline F
concentration as well as F dose.
i) Tmax: which was the lag time of maximum F concentration.

17
j) Relative Bioavailability (FP%): was calculated using Equation 1 below:
FP%=[(AUC1Test/ConTest)/(AUC1Ref/ConRef)] x 100 [Equation 1]
Where Con was the concentration of fluoride in the drinking-water under test (Test) or in
the reference NaF solution (Ref).
Urine Samples
Following voiding, the volume and pH of each urine sample was recorded in a laboratory
book, after which a 5 ml aliquot of the sample was stored in a freezer at –20°C until fluoride
measurement.
At the end of each day the data were entered into worksheet “A”(Appendix 8), which had
been created in Excel for each individual subject.
The mV readings from the F ion selective electrode (See Standard Laboratory Operating
Procedure for urine analysis in Appendix 9) were recorded in the Fluoride Research laboratory
into a data sheet “B” (Appendix 8) by a trained research associate. To calculate fluoride
concentration of urine samples, data were then transferred into a data-analysis sheet “C”
(Appendix 8) in Excel to calculate the concentration of fluoride. These data were then added to the
subject worksheet “A”.
The following parameters were calculated for each individual subject:
a) Fluoride concentration (µg/ml) of 2 pooled urine and other individual urine samples.
b) The mass (µg) of fluoride excreted in each urine sample, calculated by multiplying the
concentration of fluoride (µg/ml) in urine by the volume of each individual urine sample
(ml).
c) 24-h urinary excretion of fluoride was calculated by summing the mass of fluoride
excreted in urine for the periods before, during and after the experimental period for each
subject for each session.
d) Since urinary excretion of fluoride returns to baseline values in less than 8 hours after
consumption of a fluoride supplement (Ekstrand et al 1994), the mass (mg) of excreted
fluoride in the urine sample taken during the 8 hour experimental period following
ingestion of each water was calculated by summing the mass of fluoride excreted in
individual urine samples collected during the experimental period.
e) Following this, the mean quantity of fluoride (mg) excreted from T0 to 8 hours was
calculated.
f) Relative Bioavailability (FU%) was calculated using Equation 2:

18
FU%=[(UTest/ConTest)/(URef/ConRef)] x 100 [Equation 2]
Where Utest and Ust were the total fluoride excreted in the urine during the period T0 to 8
hours after ingestion of the test water and the reference water (standard), respectively.
g) The “dose-corrected” mean quantity of fluoride (mg) excreted from T0 to 8 hours was then
calculated to allow comparison between waters. The dose-correction was made by dividing
the quantity by the concentration of fluoride (mg/Litre) in the test or reference water (ie
1.02, 0.97, 1.01, 0.91 or 1.06mg/Litre for Reference, Artificial Hard, Artificial Soft,
Natural Hard and Natural Soft waters respectively). This value was then multiplied by
1mg/litre to relate all values to water with a fluoride content of 1mg/Litre.
Statistical analysis
Following descriptive analysis, the plasma data were analysed using analysis of covariance
with fixed and random effects. The study was treated as a 2 by 2 by 20 factorial design (two types
of fluoridation, two levels of hardness and 20 subjects). Variation between subjects was included
as random effect. Type of fluoridation and level of water hardness were fitted as fixed effects.
The value of the dependent variable corresponding to the reference water was included as a
covariate. Estimates of the effect of type of fluoridation and level of water hardness were based
on a model incorporating just main effects. The analytic strategy was to consider the interaction
between type of fluoridation and water hardness if one or more of the main effects was significant.
The models were estimated using maximum likelihood estimation procedures in Stata version 8.
Relative Bioavailability took the form of a ratio with the value 100 for the reference water. No
covariate was included in the analysis of this variable.

19
Section 4: Results Details of subjects
Thirty six people expressed an interest in the study, of whom 26 completed consent forms.
Twenty subjects completed all aspects of the study. Six people who signed consent forms acted as
a reserve, in case of drop out during the experimental phase. The demographic details of the
subjects are shown in the Table 1 below. The mean age of the 20 subjects was 25.5 years (SDev
+3.46 years), an age when skeletal bone density will still be increasing, while the mean Body
Mass Index was 23.98 (SDev +2.38) which is within the normal range of 19 to 25 kg/m2 for 19 to
34 year olds (Mahan and Escott-Stump 1996).
Table 1. Demographical information for the 20 study subjects
Subject No.
Subject ID Gender
Mass (kg)
Height (cm)
Body Mass Index
(kg/m2)Age (y)
1 1A Female 57.7 158 23.11 25
2 1B Male 86.5 172 29.24 27
3 1C Male 75.6 179 23.59 25
4 1D Female 58.8 162 22.41 29
5 2B Female 62.6 158 25.08 23
6 2C Male 72.4 170 25.05 25
7 2D Female 85.1 175 27.79 26
8 3A Female 78.0 180 24.07 21
9 3B Male 83.5 187 23.88 23
10 3D Male 76.2 180 23.52 28
11 4A Male 82.1 169 28.75 29
12 4B Female 59.1 162 22.52 28
13 4C Male 73.0 180 22.53 23
14 4D Male 69.2 168 24.52 22
15 5A Male 75.5 181 23.05 25
16 5B Female 65.1 164 24.20 23
17 5C Female 49.4 152 21.38 35
18 6A Male 68.2 178 21.53 23
19 6B Male 68.5 170 23.70 29
20 6D Female 48.4 157 19.64 21 Mean 69.75 170.10 23.98 25.50 SDev 11.19 9.82 2.38 3.46

20
Experimental period and collection of urine and plasma data
Subjects were allocated to experimental period sessions randomly, according to a sampling
strategy drawn up by the project’s statistician (Appendix 5). This strategy was adhered to on 97 of
the 100 experimental sessions. On each of the other 3 sessions, one study subject additional to
those scheduled to attend that day, turned up having fasted from the previous evening and having
completed their usual 3 day wash-out period. In these 3 instances, the 3 subjects involved were
allowed to attend the experimental session that day and the sampling schedule adjusted
accordingly.
Plasma
With regard to plasma collection and analysis, a total of 1200 plasma samples were
expected. In 46 instances (3.8% of the total) it was not possible to obtain enough blood from the
cannulation site to provide sufficient plasma volume to complete the fluoride analysis (Appendix
10).
To determine the increase in plasma fluoride concentration following consumption of the
test or reference water, the baseline value for plasma fluoride concentration, determined at T0 just
before drinking the water, was subtracted from the recorded plasma fluoride concentration to
produce a value arising from the fluoride content of the test or reference water.
When the datum for 3 hours was missing, it was assumed that the recorded plasma F
concentration, C(Sample), changed at a constant rate between the preceding and succeeding datum
points, and an estimate made for C (Sample) at 3 hours. Values for Area Under the Curve between
0 and 3 hours were then made, based on this estimate. This applied to 4 datum points for T8 (3
hours). When the datum for 8 hours was missing, it was assumed that the recorded plasma F
concentration [C (Sample)] had returned to baseline values at 8 hours and that C (Sample)
changed at a constant rate from the preceding datum point. Based on this estimated value for C
(Sample) at 8 hours, a value for Area Under the Curve between 0 and 8 hours was then derived.
This applied to 8 datum points for T11 (8 hours).
Since the Area under the Curve (AUC) was calculated using the trapezoidal rule, and in
this method the area under the curve was divided into 11 strips, losing a plasma sample did not
make a large effect on the final area under the curve. If a sample was near or at the peak time
concentration, a missing sample might affect the accuracy of the individual calculation of the peak
plasma time and peak plasma concentration, although in this study this only happened on one
session for one subject.

21
In 101 instances (8.4% of the 1200 plasma samples expected), a negative value was
obtained for baseline-corrected plasma fluoride concentration. Negative values were obtained
when the concentration of fluoride detected following the ingestion of the water was less than the
fasting baseline value for plasma fluoride concentration recorded at T0. In 65 instances (5.4%),
these values were obtained beyond 3 hours when plasma fluoride concentrations were very close
to baseline values.
Urine
Overall, 541 separate urine samples were obtained and analysed. Since every separate
voiding of urine during the experimental periods was collected as a separate sample, the number
of samples obtained during each 8 hour period ranged from 1 per subject to 10 per subject.
Validation of methods for fluoride analysis of plasma and urine
The validity and reliability of the methods employed in this study have been tested and
published elsewhere (Martinez-Mier et al 2003, Zohouri et al 2003).
For this study, the reliability of the four F-Ion Selective Electrodes and methods for their
use was tested. With regard to measurement of reproducibility and reliability of the fluoride
electrodes used, good reproducibility with a Coefficient of Variation (CV%) of < 5.7% was
obtained for samples with fluoride concentrations of 0.2 µg/ml and a CV% of <10% for samples
with fluoride concentrations of 0.02 µg/ml (Appendix 11). No statistically significant differences
were found between the 4 electrodes used.
To measure the accuracy of the methods used to analyse the fluoride content of plasma
samples, 40 samples of 0.02µg/ml fluoride standards were analysed using the “Known addition
technique” (Ekstrand, 1977). The CV% for this method was satisfactory at 9.7%. Due to the small
volumes of plasma available from a number of the 5ml blood samples taken, re-analysis was only
possible for 40 plasma samples. The results of re-analysis were within 0.64ng F/ml (Appendix
11).
Regarding analysis of the fluoride content of urine, results of re-analysis of 64 urine
samples (approximately 12% of the total number of urine samples analysed) were within 0.03 µg
F/ml, with a correlation between first and second sets of duplicates of 99.5%.
Fluoride content of meals and snacks
The fluoride content of the drinks and foods provided during the experimental period are
presented in Table 2, below. The fluoride content of both the glucose drink and the lunch and
afternoon snack was very low, although ingestion of the glucose drink at 11am did result in a

22
small increase in plasma fluoride concentration between 30 –60 minutes later in some individuals’
plasma profiles .
Fluoride content and hardness of waters
The fluoride and calcium carbonate content of the test and reference waters is given in
Table 3.
Table 2. Fluoride content of the drinks and foods provided during the experimental period Fluoride content
(per serving) Calcium content
(per serving) Glucose drink (at 11.00 am): 250 ml of 5% glucose drink made up with non-fluoride water
10 µg
13 mg
Lunch (at 12.00 pm): Jacket potato with ratatouille Cherry nougat royal
<5 µg <5 µg
60 mg 28 mg
Snack (at 3.00 pm): Fresh fruit salad
<1 µg
50 mg
Table 3. Fluoride and calcium carbonate content of the test and reference waters
Fluoride content (mg/l) of water samples tested
Water Final code
of water Sample
1 Sample
2
Fluoride content (mg/l) Mean
Fluoride content in
500ml (mg)
Water hardness: calcium
carbonate (mg/l)
Reference water
E 1.02 1.01 1.02 0.510 3
Artificially fluoridated hard water
C 0.96 0.97 0.97 0.485 382
Artificially fluoridated soft water
A 1.01 1.01 1.01 0.505 50
Naturally fluoridated hard water
B 0.89 0.92 0.91 0.455 381
Naturally fluoridated soft water
D 1.05 1.06 1.06 0.530 63
Plasma Analysis
The complete plasma data for each of the 20 subjects during the 5 experimental periods are
given in Appendix 12.

23
Summary data (n=20) are given below for:
• Baseline fasting plasma fluoride concentration;
• Time of recorded peak plasma concentration of fluoride (Tmax);
• Peak plasma concentration of fluoride (cmax);
• Area under the curve (AUC) for plasma concentration of fluoride and;
• Relative Bioavailability in plasma of each test water when compared with the reference
water.
Baseline (fasting) plasma fluoride concentration
The mean baseline plasma fluoride concentration for all T0 samples was 20 ng/ml with a
range from 13 to 31ng F/ml. The range of the baseline concentrations in different individuals,
calculated as the average for all five ingestions of water, was from 15.59 to 24.44ng F/ml. The
accuracy of fluoride determination in plasma samples was investigated by measuring the recovery
of 20 ngF/ml added to plasma samples. As can be seen in Appendix 11, the recovery of added
fluoride was 104%, with a Coefficient of Variation of 9.6% (Standard Error was ± 0.36 ng/ml).
Since the fluoride assay gave a precision of 9.6%, values within 1.92 ng/ml of the baseline values
could not be detected as different from the baseline values with a suitable degree of accuracy.
However, the peak plasma concentrations of fluoride and the majority of plasma fluoride levels
measured over the period 0-3 hours were well above the baseline values and clearly measurable
with a suitable degree of accuracy. The plasma concentrations of fluoride returned to close to
baseline levels by 3 hours in the majority of profiles.
The post-treatment plasma fluoride concentrations were less than the pre-treatment control
samples (ie negative values) in 101 (8.4%) of the plasma samples. These negative values were
determined either during the first 30 minutes of the experimental period (prior to absorption) or in
the last 2-3 samples after the plasma fluoride levels had returned to baseline.
Time of recorded peak plasma concentration of fluoride (Tmax)
The mean time of recorded peak plasma concentration of fluoride was similar for all
waters, ranging from 48 minutes (95% CI = 43, 53) for naturally fluoridated hard water to 51
minutes (95% CI = 47, 57) for artificially fluoridated soft water (Table 4). Although the
measurement of Tmax is constrained by the choice of sampling times, it does reinforce the need for
the study method to include frequent plasma sampling during the first 75 minutes of the
experimental period following fluoride ingestion.

24
For statistical analysis, Tmax was treated as a continuous variable (Table 5). The difference
between artificially and naturally fluoridated waters for mean Time of recorded peak plasma
concentration of fluoride (Tmax), was 1.88 minutes (95% CI: -0.76, 4.51) which was not
statistically significant (p=0.163). The difference between hard and soft waters in mean Tmax was
-1.88 minutes (95% CI: - 4.51, 0.76) which was also not significant (p=0.163).
Peak plasma concentration of fluoride (cmax)
The range of recorded peak plasma fluoride concentrations was 22 to 58 ng/ml with a
mean of 34 ng/ml, indicating a 70% increase in the plasma fluoride concentration after treatment
compared with baseline. These peaks were well above the baseline and have been shown to be
measurable to a suitable degree of accuracy using the techniques employed in the study.
The overall profile of plasma fluoride concentration over the experimental period probably
arose from two phases of gastric emptying of the test water, with most emptied soon after
ingestion, but some retained and emptied later after the glucose drink. The second minor peak
illustrated in some profiles demonstrated a gastric response after consumption of the glucose drink
two hours following consumption of the water with a resultant small increase in plasma fluoride
concentration. The low-fluoride food and snack consumption three and six hours after
consumption of the water was hardly detectable in most profiles.
cmax represented the maximum plasma concentration of fluoride following ingestion of the
test or reference water, corrected for the baseline plasma fluoride recorded at T0 and the dose of
fluoride in the test or reference water. The highest mean value for cmax was found in the artificially
fluoridated soft water (Mean cmax = 15.32 ng.ml-1, 95% CI= 11.68, 18.97), while the lowest mean
value was 12.48 ng.ml-1 (95% CI = 9.24, 15.72), found following the ingestion of the naturally
fluoridated soft water (Table 4).
Analysis of covariance showed no statistically significant difference in peak plasma
concentration of fluoride (cmax) between artificially and naturally fluoridated waters (p= 0.132) or
between hard and soft waters (p= 0.591).
Area under the curve (AUC) for plasma concentration of fluoride
Area Under the Curve is a statistical method of summarising information from a series of
measurements on one individual and routinely used in pharmacology to describe total uptake of a
substance or drug into plasma following administration. As estimated from a plot of the
concentration of fluoride in plasma against time, after a single drink of water containing fluoride,
AUC can be used to gauge the bioavailability of fluoride. The AUC, derived from a series of
25
plasma concentrations of fluoride, is an index of the total amount of fluoride taken into the plasma
during the experimental period described.
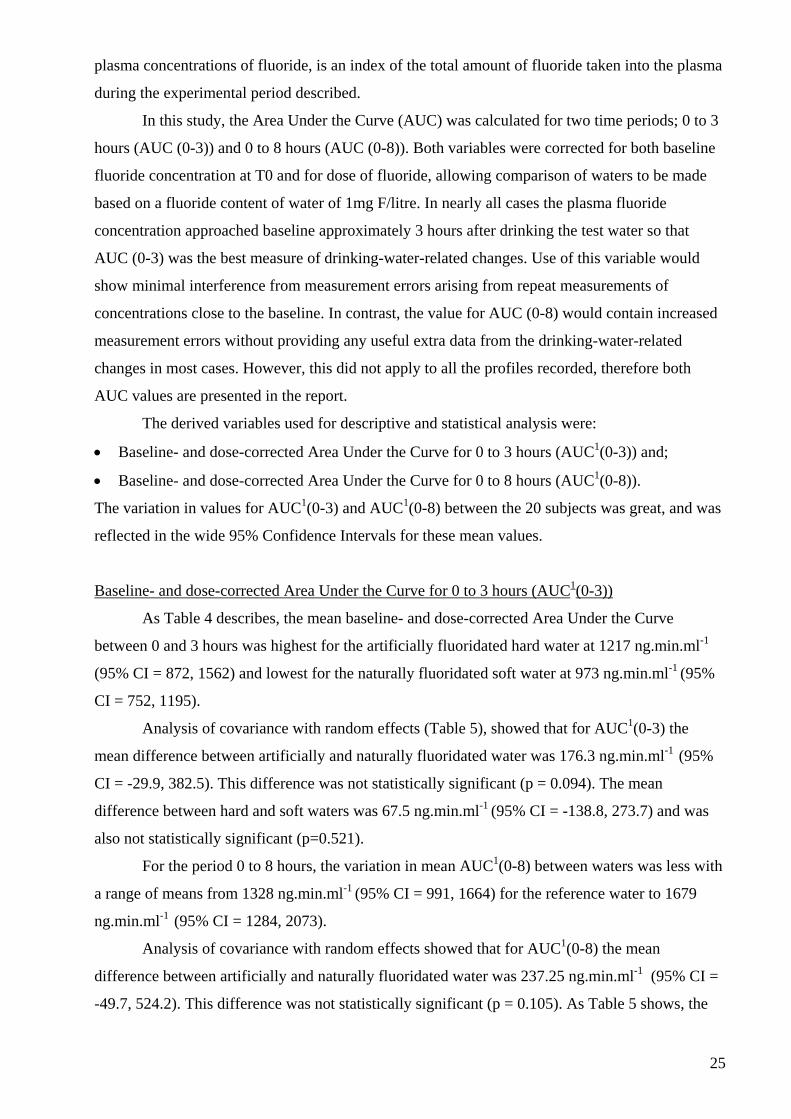
In this study, the Area Under the Curve (AUC) was calculated for two time periods; 0 to 3
hours (AUC (0-3)) and 0 to 8 hours (AUC (0-8)). Both variables were corrected for both baseline
fluoride concentration at T0 and for dose of fluoride, allowing comparison of waters to be made
based on a fluoride content of water of 1mg F/litre. In nearly all cases the plasma fluoride
concentration approached baseline approximately 3 hours after drinking the test water so that
AUC (0-3) was the best measure of drinking-water-related changes. Use of this variable would
show minimal interference from measurement errors arising from repeat measurements of
concentrations close to the baseline. In contrast, the value for AUC (0-8) would contain increased
measurement errors without providing any useful extra data from the drinking-water-related
changes in most cases. However, this did not apply to all the profiles recorded, therefore both
AUC values are presented in the report.
The derived variables used for descriptive and statistical analysis were:
• Baseline- and dose-corrected Area Under the Curve for 0 to 3 hours (AUC1(0-3)) and;
• Baseline- and dose-corrected Area Under the Curve for 0 to 8 hours (AUC1(0-8)).
The variation in values for AUC1(0-3) and AUC1(0-8) between the 20 subjects was great, and was
reflected in the wide 95% Confidence Intervals for these mean values.
Baseline- and dose-corrected Area Under the Curve for 0 to 3 hours (AUC1(0-3))
As Table 4 describes, the mean baseline- and dose-corrected Area Under the Curve
between 0 and 3 hours was highest for the artificially fluoridated hard water at 1217 ng.min.ml-1
(95% CI = 872, 1562) and lowest for the naturally fluoridated soft water at 973 ng.min.ml-1 (95%
CI = 752, 1195).
Analysis of covariance with random effects (Table 5), showed that for AUC1(0-3) the
mean difference between artificially and naturally fluoridated water was 176.3 ng.min.ml-1 (95%
CI = -29.9, 382.5). This difference was not statistically significant (p = 0.094). The mean
difference between hard and soft waters was 67.5 ng.min.ml-1 (95% CI = -138.8, 273.7) and was
also not statistically significant (p=0.521).
For the period 0 to 8 hours, the variation in mean AUC1(0-8) between waters was less with
a range of means from 1328 ng.min.ml-1 (95% CI = 991, 1664) for the reference water to 1679
ng.min.ml-1 (95% CI = 1284, 2073).
Analysis of covariance with random effects showed that for AUC1(0-8) the mean
difference between artificially and naturally fluoridated water was 237.25 ng.min.ml-1 (95% CI =
-49.7, 524.2). This difference was not statistically significant (p = 0.105). As Table 5 shows, the

26
mean difference between hard and soft waters was -1.04 ng.min.ml-1 (95% CI = -288.0, 285.9),
which was also not statistically significant (p= 0.994).
The data were also analysed using a fixed effects approach which gave p values very
similar to those obtained using a random effects approach.

Table 4. Pharmacokinetics of F following ingestion of 500 ml of test water or reference water.
Type of Water Tmax
(Minutes)
cmax
(ng.ml-1)
AUC1(0-3)
(ng.min.ml-1)
AUC1(0-8)
(ng.min.ml-1)
Fp%(0-3)
(%)
Fp% (0-8)
(%)
Naturally fluoridated soft water
Mean (95% CI)
48 (44, 52)
12.48 (9.24, 15.72)
973 (752,1195)
1330 (1005, 1655)
106 (88, 125)
111 (88, 135)
Naturally fluoridated hard water
Mean (95% CI)
48 (43, 53)
14.22 (10.65, 17.78)
1058 (793,1322)
1440 (1071, 1810)
116 (93, 138)
124 (95, 153)
Artificially fluoridated soft water
Mean (95% CI)
51 (47, 57)
15.32 (11.68, 18.97)
1167 (918, 1415)
1679 (1284, 2073)
135 (95, 175)
155 (94, 217)
Artificially fluoridated hard water
Mean (95% CI)
48 (44, 52)
14.81 (11.55, 18.07)
1217 (872, 1562)
1566 (1175, 1958)
141 (100, 181)
150 (98, 202)
Reference water Mean (95% CI)
49 (44, 53)
14.20 (11.12, 17.28)
1017 (768, 1266)
1328 (991, 1664)
100 (Reference)
100 (Reference)
cmax: Maximum plasma F concentrations corrected for baseline plasma F and dose (ie. F concentration of individual waters).
Tmax: Time of cmax AUC1(0-3): Dose- and baseline-corrected Area Under the Curve based on positive values of plasma fluoride concentration (c), assuming negative values as zero for the first 3 hours of experimental period following ingestion of test waters. AUC1(0-8): Dose- and baseline- corrected Area Under the Curve based on positive values of plasma fluoride concentration (c), assuming negative values as zero for 8 hours of experimental period following ingestion of test waters. Fp% (0-3) = [(AUC1(0-3)test/Contest)/ (AUC1(0-3)Ref/ConRef)] x100 = [AUC1(0-3)test /(AUC1(0-3)Ref] x100 Fp% (0-8) = [(AUC1(0-8)test/Contest)/ (AUC1(0-8)Ref/ConRef)] x100 = [AUC1(0-8)test /(AUC1(0-8)Ref] x100
27

Table 5. Analysis of covariance with random effects using pharmacokinetic parameters in plasma to compare Artificially fluoridated water, Naturally fluoridated water, Hard water and Soft water. Parameters Water comparison Mean
difference SE of mean difference
p value 95% Confidence Intervals
(Artificially fluoridated –Naturally fluoridated)
1.88
1.34
0.163 -0.76 4.51
Tmax (Hard – Soft) -1.88 1.34 0.163 -4.51 0.76
(Artificially fluoridated –Naturally fluoridated)
1.72
1.14
0.132
-0.52 3.96 cmax
(Hard – Soft)
0.61 1.14 0.591 -1.62 2.85
(Artificially fluoridated –Naturally fluoridated)
176.29
105.22
0.094 -29.94 382.52
AUC1(0-3)
(Hard – Soft)
67.48 105.22 0.521 -138.75 273.70
(Artificially fluoridated –Naturally fluoridated)
237.25
146.39
0.105 -49.67 524.18
AUC1(0-8)
(Hard – Soft)
-1.04 146.39 0.994 -287.96 285.89
(Artificially fluoridated –Naturally fluoridated)
26.90
11.43
0.019 4.50 49.30
Fp%(0-3)
(Hard – Soft)
7.29 11.43 0.523 -15.11 29.69
(Artificially fluoridated –Naturally fluoridated)
35.22
14.96
0.019 5.90 64.54
Fp% (0-8)
(Hard – Soft)
3.54 14.96 0.813 -25.78 32.87
28

29
Figure 1 shows the mean plasma fluoride concentration (adjusted for baseline and dose) for all 20
subjects against time for each water. A full description of the results of the statistical analysis of
the plasma data is given in Appendix 13.
Relative Bioavailability of fluoride in plasma
Relative to reference water
The 4 test waters were compared with the reference water to derive Relative
Bioavailability for fluoride in plasma over 3 and 8 hours following ingestion of these waters. As
Table 4 shows, for 0-3 hours, 3 waters showed similar values ranging from 116% (95% CI= 93,
138) for naturally fluoridated hard water to 141% (95% CI = 100, 181) for artificially fluoridated
hard water, while the Relative Bioavailability for the naturally fluoridated soft water was lower, at
106% (95% CI= 88, 125).
When Relative Bioavailability over 0 to 8 hours was considered, the artificially fluoridated
waters showed similar values at 150% (95% CI= 98, 202) and 155% (95% CI= 94, 217) for hard
water and soft water respectively, while the naturally fluoridated hard water had a bioavailability
relative to the reference water of 124% (95% CI= 95, 153). In contrast, the Relative
Bioavailability for naturally fluoridated soft water was lower at 111% (95% CI = 88, 135).
Previous authors have used the ratio Fp% as a measure of bioavailability. To allow direct
comparison with their results, this ratio was also analysed as a variable in this study. As Table 5
shows, there was a statistically significant difference shown for Fp(0-3) and Fp(0-8) when all 20
subjects were included. However, there were some extreme values in the plots of values for Fp(0-
3) and Fp(0-8) . In particular, the values for subject 2C appeared to be very high (Appendix 13).
This may have been due to subject 2C having very low values of Fp(0-3) and Fp(0-8) for the
reference water. Once the Subject 2C outlier was removed, no statistically significant difference
was seen.
Relative to other test waters
Tables 6 and 7 provide a between waters comparison of Area under the Curve for 0 to 3
and 0 to 8 hours (AUC1 (0-3) and AUC1 (0-8) respectively) following ingestion of the test waters.
There were no statistically significant differences between waters with added fluoride and
naturally-occurring fluoride, or between soft and hard waters.

30
Table 6: Between waters comparison of observed baseline- and dose-corrected Area under the Curve for 0 to 3 hours (AUC1 (0-3)).
Naturally
Fluoridated Soft
Water
Artificially
Fluoridated Soft
Water
Naturally
Fluoridated
Hard Water
Artificially
Fluoridated
Hard Water
Naturally
Fluoridated Soft
Water
-
0.83
0.92
0.80
Artificially
Fluoridated Soft
Water
1.202
-
1.10
0.96
Naturally
Fluoridated
Hard Water
1.094
0.91
-
0.87
Artificially
Fluoridated
Hard Water
1.25
1.043
1.151
-
Notes: 1Artificially fluoridated hard water had a 15% greater mean AUC1 (0-3) than naturally fluoridated
hard water.
2 Artificially fluoridated soft water had a 20% greater mean AUC1 (0-3) than naturally fluoridated
soft water.
3 Artificially fluoridated hard water had a 4% greater mean AUC1 (0-3) than artificially fluoridated
soft water.
4 Naturally fluoridated hard water had a 9% greater mean AUC1 (0-3) than naturally fluoridated
soft water.

31
Table 7: Between waters comparison of observed baseline- and dose-corrected Area under the Curve for 0 to 8 hours (AUC1 (0-8)).
Naturally
Fluoridated
Soft Water
Artificially
Fluoridated
Soft Water
Naturally
Fluoridated
Hard Water
Artificially
Fluoridated
Hard Water
Naturally
Fluoridated
Soft Water
-
0.79
0.92
0.85
Artificially
Fluoridated
Soft Water
1.262
-
1.17
1.07
Naturally
Fluoridated
Hard Water
1.084
0.86
-
0.92
Artificially
Fluoridated
Hard Water
1.18
0.933
1.091
-
Notes: 1 Artificially fluoridated hard water had a 9% higher mean AUC1 (0-8) than naturally fluoridated
hard water.
2 Artificially fluoridated soft water had a 26% higher mean AUC1 (0-8) than naturally fluoridated
soft water.
3 Artificially fluoridated hard water had a 7% lower mean AUC1 (0-8) than artificially fluoridated
soft water.
4 Naturally fluoridated hard water had an 8% higher mean AUC1 (0-8) than naturally fluoridated
soft water.
32
Urinary fluoride excretion
To measure urinary excretion of fluoride following ingestion of the different waters, it was
necessary to record volumes of urine excreted before during and after the experimental periods as
well as the amounts of fluoride recovered in urine samples. The urine data for all 20 subjects are
given in Appendix 14 and the statistical analysis of the urine data in Appendix 15.
Summary data (n=20) are given below for urine volume and mass of urinary fluoride
excreted over 24 hours as well as before, during and after the experimental period.
24 hour urine
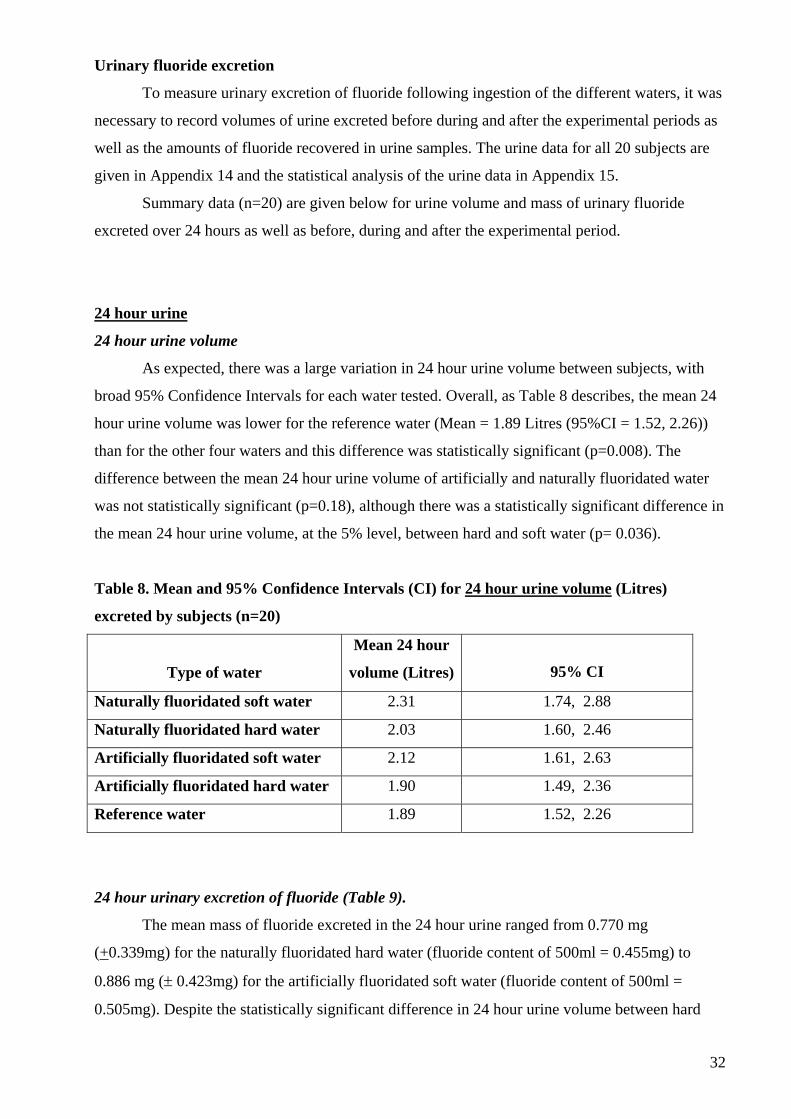
24 hour urine volume
As expected, there was a large variation in 24 hour urine volume between subjects, with
broad 95% Confidence Intervals for each water tested. Overall, as Table 8 describes, the mean 24
hour urine volume was lower for the reference water (Mean = 1.89 Litres (95%CI = 1.52, 2.26))
than for the other four waters and this difference was statistically significant (p=0.008). The
difference between the mean 24 hour urine volume of artificially and naturally fluoridated water
was not statistically significant (p=0.18), although there was a statistically significant difference in
the mean 24 hour urine volume, at the 5% level, between hard and soft water (p= 0.036).
Table 8. Mean and 95% Confidence Intervals (CI) for 24 hour urine volume (Litres)
excreted by subjects (n=20)
Type of water
Mean 24 hour
volume (Litres)
95% CI
Naturally fluoridated soft water 2.31 1.74, 2.88
Naturally fluoridated hard water 2.03 1.60, 2.46
Artificially fluoridated soft water 2.12 1.61, 2.63
Artificially fluoridated hard water 1.90 1.49, 2.36
Reference water 1.89 1.52, 2.26
24 hour urinary excretion of fluoride (Table 9).
The mean mass of fluoride excreted in the 24 hour urine ranged from 0.770 mg
(+0.339mg) for the naturally fluoridated hard water (fluoride content of 500ml = 0.455mg) to
0.886 mg (± 0.423mg) for the artificially fluoridated soft water (fluoride content of 500ml =
0.505mg). Despite the statistically significant difference in 24 hour urine volume between hard

33
and soft water, there was no statistically significant difference in the 24 hour urinary excretion of
fluoride between the five waters (four test waters and 1 reference water).
The rate of fluoride excretion over 24 hours according to ingestion of test water or
reference water is described in Figure 2.
Table 9. Between water comparisons of mass (mg) of urinary fluoride excreted in 24 hours
(n=20).
Type of Water Naturally fluoridated water
Mean mass excreted in 24 hours
(mg)
± SDev
Artificially fluoridated water
Mean mass excreted in 24 hours
(mg)
± SDev
Soft water 0.880
(± 0.357)
0.886
(± 0.423)
Hard water 0.770
(± 0.339)
0.831
(± 0.414)
Pre-experimental period (pre-dose)
Urine volume during pre-experimental period (pre-dose).
As shown in Table 10, the mean pre-dose volumes of urine were fairly similar for all 5
waters ranging from 0.37 Litres (95% CI = 0.29, 0.50) for the naturally fluoridated water to 0.45
Litres (95% CI = 0.34, 0.56) for the naturally fluoridated soft water. No statistically significant
differences between different types of water were found for the pre-dose volumes of urine.
Urinary excretion of fluoride during pre-experimental period (pre-dose)
As Table 11 describes, the mean mass of fluoride excreted during the period before the
start of the experiment showed a slight variation, ranging from 0.194 mg (95% CI = 0.117, 0.271)
for the naturally fluoridated hard water to 0.238 mg (95% CI = 0.152, 0.323) for the reference
water. However these observed differences between waters were not statistically significant.

34
Table 10. Mean and 95% Confidence Intervals (CI) for pre-dose, 0-8h post-dose and 8-16h
post-dose volume of urine (Litres) excreted by subjects (n=20)
Mean urine volume (Litres)
(95% CI) Type of water
Pre-dose 0-8 h post-dose 8-16 h post-dose
Naturally fluoridated soft
water
0.45
(0.34, 0.56)
1.31
(0.93, 1.68)
0.55
(0.39, 0.71)
Naturally fluoridated hard
water
0.37
(0.27, 0.48)
1.13
(0.88, 1.37)
0.53
(0.35, 0.72)
Artificially fluoridated soft
water
0.39
(0.29, 0.50)
1.23
(0.93, 1.53)
0.50
(0.35, 0.65)
Artificially fluoridated
hard water
0.38
(0.28, 0.49)
1.00
(0.74, 1.26)
0.52
(0.34, 0.71)
Reference water 0.42
(0.30, 0.54)
1.03
(0.78, 1.29)
0.44
(0.34, 0.54)
Experimental period (0-8h post-dose)
Urine volume during experimental period (0-8h post-dose)
Table 10 shows the data for volume of urine during the 8-h post-experimental period.
There was no statistically significant difference between the mean urine volume of subjects after
drinking artificially and naturally fluoridated waters during 8-h post-experimental period.
However, the difference between the mean 8-h post-dose urine volume of hard and soft water was
statistically significant (p=0.01).
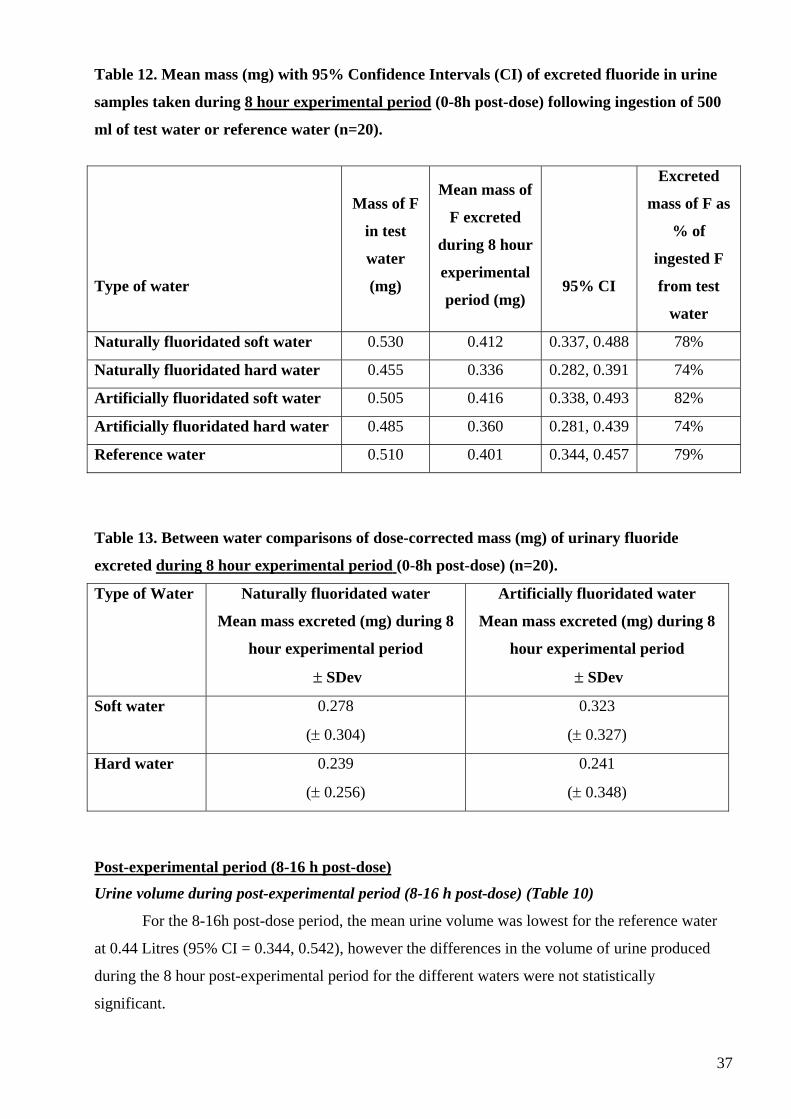
Urinary excretion of fluoride during the experimental period (0-8h post-dose)
As Table 12 shows, the mean mass of fluoride excreted during the 8h experimental period
for the naturally fluoridated hard water was 0.336 mg (95% CI = 0.282, 0.391 mg). This mass
represented 74% of the mass of fluoride ingested (0.455mg) for this water. Urinary excretion for
the artificially fluoridated hard water showed similar results with the proportion of ingested
fluoride excreted also being 74%.
The proportion of ingested fluoride excreted in the urine collected during the 8h
experimental period for the artificially fluoridated soft water was 82% while for naturally
fluoridated soft water it was 78%.

35
For the reference water, which contained 0.510mg of fluoride (as sodium fluoride), the
proportion of ingested fluoride excreted in the 8 hour urine was 79%.
The mean masses of fluoride excreted in the urine during the experimental period (0-8h
post-dose), corrected for dose, are presented in Table 13. These values ranged from 0.239 ± 0.256
mg for naturally fluoridated hard water to 0.323 ±0.327 mg for the artificially fluoridated soft
water but the differences were not statistically significant for different types of water.
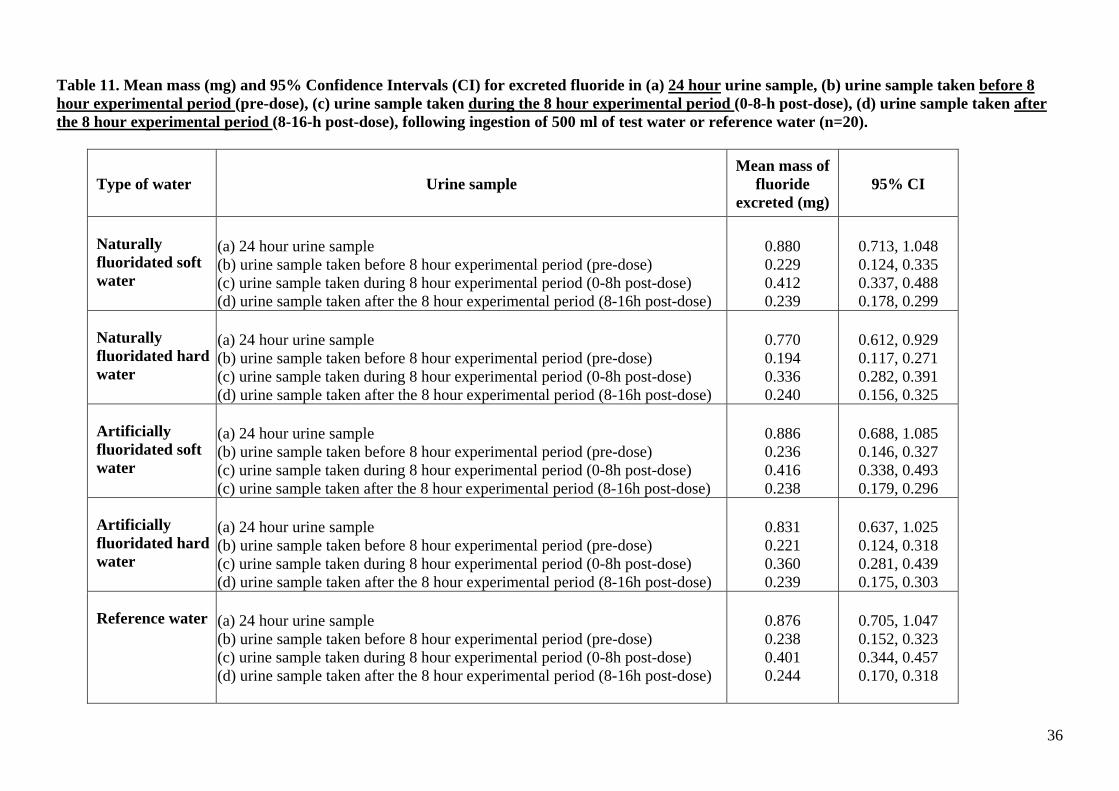
Table 11. Mean mass (mg) and 95% Confidence Intervals (CI) for excreted fluoride in (a) 24 hour urine sample, (b) urine sample taken before 8 hour experimental period (pre-dose), (c) urine sample taken during the 8 hour experimental period (0-8-h post-dose), (d) urine sample taken after the 8 hour experimental period (8-16-h post-dose), following ingestion of 500 ml of test water or reference water (n=20).
Type of water Urine sample Mean mass of
fluoride excreted (mg)
95% CI
Naturally fluoridated soft water
(a) 24 hour urine sample (b) urine sample taken before 8 hour experimental period (pre-dose) (c) urine sample taken during 8 hour experimental period (0-8h post-dose) (d) urine sample taken after the 8 hour experimental period (8-16h post-dose)
0.880 0.229 0.412 0.239
0.713, 1.048 0.124, 0.335 0.337, 0.488 0.178, 0.299
Naturally fluoridated hard water
(a) 24 hour urine sample (b) urine sample taken before 8 hour experimental period (pre-dose) (c) urine sample taken during 8 hour experimental period (0-8h post-dose) (d) urine sample taken after the 8 hour experimental period (8-16h post-dose)
0.770 0.194 0.336 0.240
0.612, 0.929 0.117, 0.271 0.282, 0.391 0.156, 0.325
Artificially fluoridated soft water
(a) 24 hour urine sample (b) urine sample taken before 8 hour experimental period (pre-dose) (c) urine sample taken during 8 hour experimental period (0-8h post-dose) (c) urine sample taken after the 8 hour experimental period (8-16h post-dose)
0.886 0.236 0.416 0.238
0.688, 1.085 0.146, 0.327 0.338, 0.493 0.179, 0.296
Artificially fluoridated hard water
(a) 24 hour urine sample (b) urine sample taken before 8 hour experimental period (pre-dose) (c) urine sample taken during 8 hour experimental period (0-8h post-dose) (d) urine sample taken after the 8 hour experimental period (8-16h post-dose)
0.831 0.221 0.360 0.239
0.637, 1.025 0.124, 0.318 0.281, 0.439 0.175, 0.303
Reference water (a) 24 hour urine sample (b) urine sample taken before 8 hour experimental period (pre-dose) (c) urine sample taken during 8 hour experimental period (0-8h post-dose) (d) urine sample taken after the 8 hour experimental period (8-16h post-dose)
0.876 0.238 0.401 0.244
0.705, 1.047 0.152, 0.323 0.344, 0.457 0.170, 0.318
36
37
Table 12. Mean mass (mg) with 95% Confidence Intervals (CI) of excreted fluoride in urine
samples taken during 8 hour experimental period (0-8h post-dose) following ingestion of 500
ml of test water or reference water (n=20).
Type of water
Mass of F
in test
water
(mg)
Mean mass of
F excreted
during 8 hour
experimental
period (mg)
95% CI
Excreted
mass of F as
% of
ingested F
from test
water
Naturally fluoridated soft water 0.530 0.412 0.337, 0.488 78%
Naturally fluoridated hard water 0.455 0.336 0.282, 0.391 74%
Artificially fluoridated soft water 0.505 0.416 0.338, 0.493 82%
Artificially fluoridated hard water 0.485 0.360 0.281, 0.439 74%
Reference water 0.510 0.401 0.344, 0.457 79%
Table 13. Between water comparisons of dose-corrected mass (mg) of urinary fluoride
excreted during 8 hour experimental period (0-8h post-dose) (n=20).
Type of Water Naturally fluoridated water
Mean mass excreted (mg) during 8
hour experimental period
± SDev
Artificially fluoridated water
Mean mass excreted (mg) during 8
hour experimental period
± SDev
Soft water 0.278
(± 0.304)
0.323
(± 0.327)
Hard water 0.239
(± 0.256)
0.241
(± 0.348)
Post-experimental period (8-16 h post-dose)
Urine volume during post-experimental period (8-16 h post-dose) (Table 10)
For the 8-16h post-dose period, the mean urine volume was lowest for the reference water
at 0.44 Litres (95% CI = 0.344, 0.542), however the differences in the volume of urine produced
during the 8 hour post-experimental period for the different waters were not statistically
significant.

38
Urinary excretion of fluoride in post-experimental period (8-16 h post-dose)
As described in Table 11, the mean mass of fluoride excreted during the 8-16 h period
following the experiment was very similar, ranging from 0.238 mg (95% CI = 0.179, 0.296) for
artificially fluoridated soft water to 0.244 mg (95% CI= 0.170, 0.318) for the reference water.
Relative Bioavailability of fluoride in urine
Table 14 shows the Relative Bioavailability of fluoride in terms of urinary excretion when
the 4 test waters were each compared with the reference water as a standard at 100%. Based on
urine collection during the 8 hour experimental period, the mean Relative Bioavailability of
fluoride in urine ranged from 95% (95% CI = 82%, 108%) and 96% (95% CI = 78%, 114%) for
the two hard waters (naturally fluoridated and artificially fluoridated respectively) to 104% (95%
CI= 85%, 122%) and 111% ( 95% CI = 90%, 132%) for the two soft waters (naturally fluoridated
and artificially fluoridated respectively).
The Relative Bioavailabilities in urine of the 4 test waters compared with the reference
water based on 24 hour urinary fluoride excretion were very similar, ranging from 95% (95% CI =
79%, 110%) for the artificially fluoridated hard water to 98% (95% CI = 82%, 114%) for the
artificially fluoridated soft water.

Table 14. Mean Relative1 Bioavailability (FU%) and 95% Confidence Intervals (CI) for different types of water based on urinary fluoride excretion
data.
FU% based on 8 hour experimental
period of urine collection
FU% based on 24 hour urine
collection
95% CI 95% CI
Type of water
Fluoride
content of
water
(mg)
Mean Lower Upper
Mean Lower Upper
Naturally fluoridated soft water 0.530 104% 85% 122% 95% 80% 109%
Naturally fluoridated hard water 0.455 95% 82% 108% 96% 81% 110%
Artificially fluoridated soft water 0.505 111% 90% 132% 98% 82% 114%
Artificially fluoridated hard water 0.485 96% 78% 114% 95% 79% 110%
1 Relative to Standard Reference Water (Relative Bioavailability =100%)
Relative Bioavailability Fu% = [(Utest / Contest) /(URef /ConRef)] x 100 where Utest and URef were the total fluoride excreted in the urine during the period T0 to 8 hours after ingestion of the test water and the standard reference water respectively.
39
40
Section 5: Discussion
Introduction
Only one human bioavailability study relating to drinking-water appears in the literature
(Trautner and Einwag 1986). These researchers measured the relative fluoride bioavailability of
some foodstuffs including mineral water containing 5 mgF/kg in 4 healthy subjects but did not
report AUC values for the water. However, there are several studies on plasma (or serum)
fluoride concentration in healthy or hospitalised patients living in different communities with
different fluoride concentrations in their water supplies (Husdan et al. 1976; Ekstrand 1978;
Cowell and Taylor 1981; Hanhijarvi 1981, 1982; Hanhijarvi et al. 1981, 1989).
This present study was the first to provide information on the bioavailability of fluoride
from drinking-water supplies as consumed in vivo.
Design of the study
The design of the study was based on the scientific method of pharmacokinetic analysis of
the plasma F concentration curve after intake of a single dose of fluoride which will quantitatively
describe the cumulative influence of the various metabolic processes and give important
information about the kinetics of fluoride in the human body (Ekstrand 1988).
Since fluoride is already is circulating in the human body it was necessary to take this into
account and minimise variability in order to increase the possibility of detecting “treatment-
related” differences. This was done in a number of ways. Firstly, by selecting a relatively narrow
age range of 20-35 years for subjects (see below). Secondly, as fasting plasma fluoride is in
equilibrium with bone, the fasting level of plasma fluoride concentration was subtracted from the
post-dose values to eliminate the background effect of fluoride in plasma.
It has been reported that plasma fluoride levels vary during the day. However, variations
are related to pattern of fluoride exposure. A diurnal variation has not been found for fasting
subjects (Husdan, 1976) or those persons who residing in low-fluoride communities (Ekstrand,
1978). In this study the subjects were on a low fluoride diet and also provided with the same low
fluoride food and drinks during all 5 experimental periods to further minimise variability. A
control experimental session may have been useful, but with no diurnal variation in plasma
fluoride concentration in low fluoride areas or in fasting subjects and also considering ethical,
time and financial aspects it was decided that the first plasma sample (T0) for each session (5 in
total per subject) could be appropriately used as the baseline value. The subjects acted as their
own internal controls as the study compared bioavailability using a cross-over design.
With regard to the conduct of the study in a fluoridated area, the mean baseline plasma F
concentration of 20 ng/ml with a range from 13 to 31ng F/ml was consistent with those found in a

41
fluoridated community (Ekstrand 1978). However, Cowell and Taylor (1981) have reported an
average plasma fluoride concentration of fasting subjects residing in communities without water
fluoridation (0.05- 0.2 ppm) of 20 ng/ml, while in a study of 20 subjects aged 23-71 years by
Fuchs et al (1975), also in a low fluoride area, the normal range was reported as 6-20ng F/ml .
Subjects
Overall, the drop-out rate for the study was low and occurred in the first experimental
session for all 3 instances of drop-out. Deliberate over-recruitment in the first instance meant that
subject withdrawal did not reduce the power of the study. Reasons for withdrawal included low
blood pressure and fainting and poor venous access. No subject withdrew from the study due to
inconvenience imposed, pain or discomfort. The excellent interpersonal skills of the research
nurse helped to maintain subject enthusiasm in a study that required considerable subject
compliance.
Although the age range chosen for the study was 20-35 years, the actual mean age of the
11 males and 9 female subjects in the study was 25.5 years (SD +3.46 years), with a range of 21 –
35 years. This lower mean age made increasing skeletal bone density more of a certainty since
long bones stop growing in length around the age of 20y, but peak bone mass is reached around
the age of 25 to 35 years (Mahan and Escott-Stump 1996). The choice of this age group avoided
the practical difficulties of other age groups such as children in whom bones are increasing in
density at a higher rate with a much greater net movement of fluoride into bone from plasma, and
older people in whom there will be an overall equilibrium between the net movement of fluoride
between bone and plasma. Overall, this age group gave a more typical picture of the majority of
the population, while having the advantage of a group in which the net flow of fluoride ions from
plasma to bone is still positive. Plasma fluoride levels are influenced by the relative rate of bone
accretion and dissolution, so the choice of this age range minimised variability in order to increase
the possibility of detecting “treatment-related” differences. Unfortunately, the size of the study did
not allow a comparison between genders to be made. The relatively invasive nature of the study,
requiring cannulation and plasma sampling also restricted the size of the study and the age group
which could be studied. The development and validation of suitable biomarkers as a substitute for
plasma sampling would facilitate the study of larger populations as well as younger and older age
groups than those studied here.
Staffing
Considerable problems were encountered in recruiting a research nurse with the necessary
cannulation skills. Locum lists and nurse banks were unable to provide a nurse with the skills
required for the present study. To overcome this, nurses from the Dental Hospital Sedation Unit

42
(who are trained in cannulation) were seconded to insert the cannulae into subjects at the
beginning of each session and to be ‘on call’ should any problems with cannulation arise during
the day. This enabled a Grade F nurse without cannulation skills to be recruited to oversee the rest
of the nursing duties. Sedation nurses were paid a fee per cannulation, funded from monies saved
by employing a Grade F rather than a Grade G nurse.
Provision of meals and low fluoride water
Due to the hot weather, subjects consumed almost twice as much low fluoride bottled
water during the washout period as anticipated – a factor that emphasized the importance of
having unlimited water supplies available for a study of this nature. The portion size of meals and
snacks was largely adequate for most subjects.
The subjects varied in mass between 48.4 kg and 86.5 kg with a variation in Body Mass
Index between 19.64 and 29.24. In addition, the subjects represented a wide range of ethnicities
and some were vegetarian. This wide variation between subjects and their diets as well as possible
differing degrees of hydration during the hot weather when the study took place may account for
some of the variation between subjects in volumes of urine produced. In addition, the plasma
volumes may have been affected by a subject’s degree of hydration.
Any future study of this nature would benefit from collection of dietary information for at
least one day prior to the experimental period. This would allow measurement of fluoride intake
and ingestion during this period and provide additional valuable information.
Test and reference waters
Not all the test waters required could be found locally and an extensive search of the UK
water supplies was required. Northumbrian Water, Severn Trent and Anglia Water Companies
were most helpful in sourcing suitable water supplies. It was not possible to source a naturally
fluoridated soft water in the UK and therefore an Italian bottled mineral water ‘Acqua Panna’ was
selected and its content and authenticity tested and confirmed.
The dose of water for consumption was chosen to be representative of real-life intake, in
terms of fluoride content, to allow extrapolation of the results to the wider community. In addition,
the volume of test water consumed had to be practical and capable of producing clearly
measurable changes, but at the same time not introduce other physiological responses such as
increasing gastric emptying which might impact on the validity of the results.
With regard to the use of a 0.5mg fluoride dose for a bioavailability study, this represented
the consumption of 500 ml of drinking-water containing fluoride at 1 ppm F; a realistic situation
which was being compared across types and hardness of waters. The consumption of more than
500 ml of water at any one time, is practically quite difficult, unrealistic and a volume of more

43
than 500ml is likely to stimulate pressure receptors in the stomach, affecting gastric emptying,
which would have detracted from the aims of the study. In designing a study of this nature, there is
a conflict between providing a dose of fluoride that is relevant to real-life intake and a dose that
will produce clearly measurable changes in plasma concentration. In this study, adding fluoride to
water samples was not really an option as one of the prime considerations in the study was to
investigate fluoride bioavailability from existing UK water supplies containing fluoride at
approximately 1ppm F. In the event, the plasma fluoride concentrations achieved following water
consumption were clearly measurable with satisfactory levels of reliability and reproducibility.
The results also confirm reports by others (Ekstrand, 1977) that the method used to determine
plasma fluoride concentration is a suitable method for small volumes of plasma.
Analysis of fluoride and calcium carbonate content of the test waters and reference water
was carried out, but the waters were not analysed for other cations and anions. In addition, the
three tap waters had been phosphate-dosed (artificially fluoridated soft water at 1.75mg/Litre,
natural and artificially fluoridated hard waters at a target level of approximately1 mg/litre). This
process will soon be a requirement in UK water zones when appropriate to reduce the impact of
old lead-lined pipes on water quality until the pipes can eventually be replaced. Some of the
observed differences between these three tap waters and the naturally fluoridated soft water and
the reference water may be due to differences in their mineral content, other than their fluoride and
calcium carbonate content. Clarification of the possible impact of these factors would require
further study.
Plasma Data
With regard to the pharmacokinetic parameters used to investigate fluoride bioavailability
in plasma, the Area Under the Curve values were the most important and these were reported in
Appendix 12, based only on positive values for plasma fluoride concentration “c(0)”, and
assuming negative values as zero when calculating AUC1, as well as considering the sign (+ or - )
of the plasma fluoride concentration “c” when calculating AUC2. All derived data in the study
have been based on AUC1 values, omission of negative values being justified in that, if anything,
there will be a small error in the reported value for AUC which will apply to all waters, so any
bias is unlikely.
With regard to plasma concentration of fluoride and the wide variations in AUCs, the fact
that subjects were not prevented from moving around during their 8 hour experimental period
once the cannula was in place, may have affected gastric emptying, with a resultant impact on
fluoride absorption from the stomach. Fluoride absorption from the stomach occurs by simple
diffusion of HF, the rate of absorption being dependent only upon the concentration gradient of
HF and inversely related to the pH of the stomach contents (Whitford 1990). Absorption from the
44
stomach may account for up to 50% of the amount ingested, with the remainder being absorbed
from the upper small intestine (Whitford 1996). Although the observed AUC for hard water was
slightly higher than that for soft water, the calcium content of the test waters did not significantly
affect the bioavailability of fluoride in plasma. This is consistent with results from a study by
Arnold (1989) involving administration of fluoride simultaneously with a calcium-rich breakfast
and calcium-poor lunch.
In young or middle aged adults, once fluoride is absorbed from the gastro-intestinal tract,
approximately 50% of it is excreted in the urine (WHO 1994), although this can vary considerably
depending on a number of variables including fluoride intake, acid-base balance and urinary pH
(Whitford 1996). Some of the wide variation in AUCs between subjects might also be explained
by individual differences in some physiological parameters such as volume and pH of gastric
secretions, GI motility, plasma volume and urinary pH.
The fluctuation in plasma fluoride concentration with a second minor peak detected in
some subjects profiles following consumption of the glucose drink 2 hours after the test water,
does illustrate the real nature of plasma fluoride concentrations reflecting fluoride uptake and
metabolism. However, these plasma responses to food and drink intake in terms of fluoride
concentration do support the need to report the 0-8 hour as well as the 0-3 hour plasma profiles in
a study of this nature.
The statistical analysis of Area Under the Curve (AUC) and Relative Bioavailability (Fp)
made similar comparisons. In the analysis of AUC, the AUC of the reference water was included
as a covariate so the analysis of variance model being fitted was:
AUC[f,h] = beta1 * AUC[ref] + beta2 * fluoride_type + beta3 * water_hardness + constant term
+ subject term + error terms
where AUC[f,h] was the AUC for test water with fluoride indicator = f and hardness indicator = h;
AUC[ref] was the AUC for the reference water; and the beta's were "regression coefficients" that
were estimated.
In the analysis of the variable Fp, the dependent variable was AUC[f,h]/AUC[ref].
Effectively the value of beta1 in the above model was constrained to 1, instead of being estimated.
The two analyses were similar, being alternative ways of analysing bioavailability. However, the
use of AUC in the first method is to be preferred. Analysing a variable that is a ratio of two other
variables should be avoided since the ratio of two normally distributed variables will not have a
normal distribution and outliers such as those observed in the results are not unusual. In general, it
is preferable to analyse the numerator and include the denominator as a covariate. In this way

45
unusually large or small values of the AUC corresponding to the reference water will have much
less influence on the results.
By and large both analyses gave consistent results (Appendix 13). As the results showed,
for the analysis of the ratio variable (Fp) there was a statistically significant difference between
types of fluoride. Examination of residuals indicated that one subject appeared to have much
larger values of the ratio variable than other subjects - probably due to a particularly low value of
the denominator - the AUC of the reference water. When this subject was omitted from the
analysis there was no difference between types of fluoride. The analysis of covariance is much
less influenced by abnormal observations corresponding to the test water and this too indicated
that the difference between the types of fluoride was not statistically significant. Conclusions are
made after considering all the analyses.
Urine data
Obtaining plasma concentration curves and urinary excretion data after a single dose of
fluoride has been suggested as an appropriate way of studying fluoride bioavailability (Ekstrand et
al. 1978) and the amount of fluoride recovered in urine has been used extensively to estimate
bioavailability of fluoride (Spak et al. 1982; Trautner & Einwag 1987).
In this study, subjects were not asked to void urine just before the start of the first 8 hours
prior to fluoride intake (ie. At 0030 hours), nor at the ends of the other two collection periods
(0830 and 1700 hours), although this was encouraged. In retrospect, inclusion of voiding at these
times may have been a preferable method to ensure consistency in urine collection periods. The
urine data collected gave some information about the background excretion rate of fluoride and
was used to compare with fluoride excretion in the period following the experimental period to
identify any after dose change in fluoride excretion. The pre-experimental urine sample was also a
useful marker to confirm whether the volunteers had maintained their low fluoride dietary intake
for at least the day before the experimental period. The results show that fluoride excretion
returned to pre-dose levels in the 8 hours following the experimental period and that any changes
in fluoride excretion during the 8-h experimental period were as a result of F in water with a minor
but controlled contribution from the food and glucose drink consumed at 2, 3 and 6 hours.
The 24 hour urine collection from midnight the previous day allowed calculation and
comparison of fluoride excretion immediately before and after the experimental period. However,
it would have been useful to extend the period of urine collection to 8.30 am the following day so
that a full 24 hour period following test water ingestion could have been monitored and fluoride
excretion compared. In addition, in retrospect, it may also have been preferable to have collected

46
urine over set periods during the experimental period. This would have allowed collection of data
in parallel with the plasma data.
This present study was one of young adults. Although mechanism of fluoride excretion by
the kidney is a process of simple passive diffusion, urinary pH is one of a number of other
influences on urinary fluoride excretion including age and past and present fluoride intake.
Fluoride metabolism appears to differ between infants and adults in that generally, in an adult,
between 40 and 60% of an ingested dose is found in the urine, while for infants where there is a
much higher skeletal uptake, fluoride retention will be much higher and consequently fluoride
excretion lower. In this study we controlled for age, and past and present fluoride intake.
However, a number of other factors may influence fluoride intake and excretion including diet (eg.
vegetarian), urinary pH, altitude, air temperature and gastric emptying. A number of the study
subjects were vegetarian and they also varied in their levels of activity outwith the study which
may have accounted for some of the inter-individual variation in urine volumes due to degrees of
hydration in the high temperatures experienced during the study. The hot weather during the study
occurred throughout the 6 week study period and the subjects were randomly assigned to their
schedule of experiments so that there was unlikely to be any significant bias based on temperature.
However, we did not test a subject’s degree of hydration during the experimental period and any
differences in this between individuals and between sessions may have contributed to some of the
observed differences in urine volumes. The urine data contribute to the study, albeit secondary to
the plasma data. The only statistically significant difference found when comparing the waters for
24 hour urine volume and fluoride excretion before, during and after the experimental period was
in the volume of urine produced during the experimental period. There were statistically
significantly higher mean 8-h post-dose urine volumes (p=0.01) and mean 24 hour urine volumes
(p= 0.036) for soft compared with hard waters. This difference may have been due to lower
tonicity of the soft waters due to their mineral content as well as the lack of added phosphate in
the naturally fluoridated soft water which was a bottled water. Consumption of a relatively large
amount of a hypotonic fluid leads to a water diuresis about 15 minutes after ingestion and reaches
its maximum in about 40 minutes.
The direct relationship of fluoride clearance to urine flow rate has been reported by several
studies (Chen et al. 1956; Carlson et al. 1960; Ekstrand 1978; Ekstrand et al. 1994). However, this
relationship has been inconsistently observed. No correlation between those two parameters was
obtained for healthy subjects who were given 3 mg fluoride as sodium fluoride tablets (Ekstrand et
al, 1980). Ekstrand et al (1982), in another study, could not also find a statistically significant
correlation between renal fluoride clearance and urinary flow rate in healthy adults with acidic
urine. This aspect of fluoride metabolism was investigated in a study by Whitford et al (1976) on
rats which strongly suggested that urinary flow rate is not the primary determinant of fluoride

47
clearance. They concluded that when a positive association was observed between renal clearance
of fluoride and urine flow rate, there was also a concurrent increase in urine pH.
Retrospective Power Calculation
There is a paucity of data available in the literature regarding the pharmacokinetics of
fluoride in water. The study of the relationship between fluoride in drinking-water and plasma
fluoride concentration in humans by Ekstrand (1978) only measured plasma F at 4 hourly intervals
and did not use the standard technique employed in pharmacokinetic studies of bioavailability.
Trautner & Siebert measured the Relative Bioavailability of mineral water containing 5.0 mg F/kg
on 4 healthy adults, with a very wide age range from 21 to 50 y (Trautner & Siebert 1986),
however they did not report the AUC values, only reporting a Relative Bioavailability of 85%.
Studies that have employed a standardised pharmacokinetic technique relate to animal studies or
ingestion of fluoride in forms other than in water. The power calculation for this study therefore
had to be based on the best available data for Area under the Curve for plasma fluoride following
ingestion of a single dose of fluoride in solid dose form (Liote et al 1992).
The sample size was calculated assuming changes in a continuous variable. For such
variables all standard calculations are based on detecting an absolute difference in that variable
rather than a particular percentage change. For this study it was considered that an appropriate
difference was a change of 0.63 standard deviations in each outcome measure. Using data
collected during the study, for each outcome measure it is possible to determine the percentage
difference that corresponds to an effect size of 0.63. This will be different for each variable. For
example, the standard deviation of the dose- and baseline-corrected 8 hour Area Under the Curve
was 775 units. Thus an effect size of 0.63 represented an absolute difference of approximately 490
units. Since the mean dose- and baseline-corrected 8 hour AUC was approximately 1469, a
difference of 490 in percentage terms is approximately 33%.
Using AUC1(0-8) as a primary outcome variable, for differences between the types of
fluoridated water (ie natural or artificially fluoridated) the standard deviation was approximately
680 ng.min.ml-1. Assuming a type 1 error rate of 5%, with 20 paired observations we would have
80% power to detect a difference of 430 ng.min.ml-1in the Area Under the Curve. We would have
62% power to detect a difference of 350 ng.min.ml-1. We would have 74% power to detect a
difference of 400 ng.min.ml-1 and 90% power to detect a difference of 500 ng.min.ml-1 (Appendix
16). Using the same primary outcome variable, for differences between water types (hard v soft)
the standard deviation was approximately 630 ng.min.ml-1. With 20 paired observations we would
have 80% power to detect a difference of 400 ng.min.ml-1in the area under the curve assuming a
type 1 error rate of 5%. We would have 70% power to detect a difference of 350 ng.min.ml-1 and
94% power to detect a difference of 500 ng.min.ml-1.

48
Assuming a standard deviation of 680 ng.min.ml-1, if we wished to carry out a further study to
detect a difference of 350 ng.min.ml-1 (a 25% difference), we would need a sample size of 30
(power = 80%; significance level = 5%). For 90% power and a significance level of 2.5% (to
allow for multiple testing) we would need a sample size of 47 (Appendix 16).
49
Section 6: Conclusions There was no statistically significant difference between artificially fluoridated and
naturally fluoridated water, or between hard and soft water for Tmax, Cmax, or Area under the Curve
for plasma fluoride concentration following water ingestion in healthy young adults.
Based on the power of the study to detect differences, some caution is necessary when
interpreting the results, but within the limits imposed by the small number of subjects, this study
found no evidence for any differences between the absorption of fluoride ingested in artificially
fluoridated drinking-water, and in drinking-water in which the fluoride is present naturally, or
between the absorption of fluoride from hard and soft waters, at fluoride concentrations close to 1
part per million.
50
Section 7: Further Research If further research into fluoride bioavailability were to be carried out, there would be
benefits in using larger sample sizes, other age groups, and a range of communities with and
without artificially fluoridated water supplies. The drinking-waters in this study were selected and
tested for hardness and fluoride content only; there would be benefits in controlling for other
substances in drinking-water if they are thought to have important effects on the bioavailability of
fluoride. The use of other validated biomarkers of fluoride should be considered if any further
study is proposed.

51
References
Arnold P, Wermeille M, Chapuy MC, Biollaz J, Grandjean EM, Schelling JL and Meunier PJ.
(1989). "Influence of food and antacid administration on fluoride bioavailability from enteric-
coated sodium fluoride tablets." Bone; 10(6): 401-7.
Carlsson CH, Armstrong WD and Singer L. (1960). Distribution and excretion of radiofluoride in
the human. Proc Soc Exp Biol Med; 104: 235-239.
Chen PS jr, Smith FA, Gardner DE, O’Brien JA and Hodge HC. (1956).Renal clearance of
fluoride. Proc Soc Exp Biol Med; 92: 879-883.
Cowell DC and Taylor WH (1981). “Ionic fluoride: a study of its physiological variation in man.”
Ann Clin Biochem;. 18(Pt 2): 76-83.
Department of the Environment (1987). Code of Practice on Technical Aspects of Fluoridation of
Water Supplies. London. HMSO.
Department of Health and Children, Government of Ireland (2002). Irish Forum on Fluoridation,
Dublin, Government Publications. www.doh.ie/publications/fluoridation, accessed November
2002.
Drinking-water Directorate (2002). UK drinking-water inspectorate information for England and
Wales.http://www.dwi.gov.uk/ Accessed Nov 21st 2002.
Duckworth SC and Duckworth R (1978). The ingestion of fluoride in tea. Br Dent J; 145: 368-70
Ekstrand J (1977). A micromethod for the determination of fluoride in blood plasma and saliva.
Calcif Tiss Res; 23, 225-228.
Ekstrand J (1978). “Relationship between fluoride in the drinking-water and the
plasma fluoride concentration in man.” Caries Res; 12(3): 123-7.
Ekstrand J, Spak C.J., and Ehrnebo M. (1982).Renal clearance of fluoride in a steady state
condition in man: influence of urinary flow and pH changes by diet. Acta Pharmacol Toxicol;
50(5): p. 321-5.
52
Ekstrand J, Ehrnebo M, and Boreus LO (1978). “Fluoride bioavailability after intravenous and
oral administration: importance of renal clearance and urine flow.” Clin Pharmacol Ther; 23(3):
329-37.
Ekstrand J (1988). Fluoride in Dentistry, Chp 7 Fluoride metabolism, Munksgaard, Copenhagen.
Ekstrand J, Fomon SJ, Ziegler EE and Nelson SE (1994). Fluoride pharmacokinetics in infancy.
Pediatr Res; 35: 157-163.
Ekstrand J, Ehrnebo M., Whitford G M and Jarnberg PO. (1980). "Fluoride pharmacokinetics
during acid-base balance changes in man." Eur J Clin Pharmacol; 18(2): 189-94.
Fuchs, C., D. Dorn, Fuchs CA, Henning HV, McIntosh C, Scheler F and Stennart M. (1975).
Fluoride determination in plasma by ion selective electrodes: a simplified method for the clinical
laboratory. Clin Chim Acta; 60: 157.
Hanhijarvi H. (1981). “Ionic serum fluoride concentrations and age in a low-fluoride community.”
Proc Finn Dent Soc; 77(4): 222-7.
Hanhijarvi H. (1982). “Serum fluoride concentrations and urinary excretion of fluoride in patients
hospitalized in a low-fluoride community.” Proc Finn Dent Soc; 78(1): 5-12.
Hanhijarvi H., Elomaa I, Karlsson M and Lauren L. (1989). “Pharmacokinetics of disodium
clodronate after daily intravenous infusions during five consecutive days.” Int J Clin Pharma
Therapy Toxi; 27(12): 602-6.
Hanhijarvi H, Penttila I and Pekkarinen A. (1981). “Human ionic plasma fluoride concentrations
and age in a fluoridated community.” Proc Finn Dent Soc; 77(4): 211-21.
Her Majesty's Government (1991). Water Industry Act 1991. London: HMSO
Holland B, Welch AA, Unwin ID, Buss DH, Paul AA, Southgate DAT. McCance and
Widdowson’s; The Composition of Foods, 5th Edn. London: The Royal Society of Chemistry and
Ministry of Agriculture, Fisheries and Food, 1992.

53
Husdan H., Vogl R, Oreopoulos D, Gryfe C and Rapoport A. (1976). “Serum ionic fluoride:
normal range and relationship to age and sex.” Clin Chem; 22(11): 1884-8.
Jackson PJ, Harvey PW and Young WF (2002). Chemistry and bioavailability aspects of fluoride
in drinking-water. Report No. CO5037. WRc-NSF Ltd, Henley Road, Medenham, Marlow,
Bucks, SL7 2HD.
Liote F, Bardin C, Liou A, Brouard A, Terrier J-L and Kuntz D (1992). Bioavailability of fluoride
in postmenopausal women; comparative study between sodium fluoride and disodium
monofluorophosphate-calcium carbonate. Calcif.Tiss Inter; 50: 209-13
Mahan L and Escott-Stump S. (1996). Food, Nutrition and Diet Therapy. Philadelphia,
Pennsylvania, W.B. Saunders Company.
Martinez-Mier EA, Cury JA, Dunipace AJ, Heilman J, Levy SM, Maguire A, O’Mullane D,
Phantumvanit P, Stookey GK, Wefel JS, Whitford GM, Zero DT and Zohouri FV. (2003)
Development of standard fluoride analytical methods: pilot study. Caries Res; 37: 291.
McDonagh M, Whiting P, Bradley M, Cooper J, Sutton A, Chestnutt I, Misso K, Wilson P,
Treasure E and Kleijnen J (2000). A systematic review of public water fluoridation. NHS Centre
for Reviews and Dissemination, University of York.
Medical Research Council (2002). MRC Working Group report on: Water Fluoridation and
Health. Working Group Report: Water fluoridation and health. MRC, London.
Ritschel WA. (1984). What is bioavailability? Philosophy of bioavailability testing. Meth and
Find Exptl Clin Pharmacol; 6(12): 777-786.
Spak CJ, Ekstrand J and Zylberstein D (1982). “Bioavailability of fluoride added by baby formula
and milk.” Caries Res; 16(3): 249-56.
Trautner K and Einwag J. (1986). “Bioavailability of fluoride from some health food products in
man.” Caries Res; 20(6): 518-24.
Trautner K and Einwag J. (1987). “Factors influencing the bioavailability of fluoride from
calcium-rich, health-food products and CaF2 in man.” Arch Oral Biol; 32(6): 401-6.
54
Trautner K and Siebert G. (1986). “An experimental study of bio-availability of fluoride from
dietary sources in man.” Arch Oral Biol; 31: 223-228
Venkateswarlu P (1992). Separation of fluoride from fluoroelastomers by diffusion in test tubes.
Analy Chem; 64: 346-9.
Walker A, Gregory J, Bradnock G, Nunn JH and White D (2000) National Diet and Nutrition
Survey: young people aged 4 to 18 years. Volume 2: Report of the Oral Health Survey. Office for
National Statistics, TSO, London.
Whitford GM (1996). The metabolism and toxicity of fluoride. Monographs in Oral Science (Ed.
HM Meyers) 16: 10-29; Karger, Basel.
Whitford GM, Pashley DH and Stringer GL (1976). Fluoride renal clearance: a pH dependent
event. Amer J Physiol; 230: 527-532.
World Health Organisation (1994). Fluorides and Oral Health. WHO Technical Report Series, no.
846, WHO, Geneva.
Zohouri F and Rugg-Gunn AJ (1999). Fluoride concentration in foods from Iran. Inter J Food Sci
Nutr; 50: 265-274.
Zohouri F, Maguire A and Moynihan PJ (2003). An evaluation of three analytical methods for
fluoride analysis of urine samples. Caries Res; 37: 291

Figure 1. Estimated dose- and baseline-corrected mean plasma F concentration against time following ingestion of 500ml of test or reference water (n=20)
Key: Ref: reference water NS: Naturally fluoridated soft water NH: Naturally fluoridated hard water AS: Artificially fluoridated soft water AH: Artificially fluoridated hard water
0
2
4
6
8
10
12
14
9:00 10:00 11:00 12:00 13:00 14:00 15:00 16:00 17:00
Time of Day (Hour)
Estim
ated
bas
elin
e-co
rrec
ted
Plas
ma
F Co
ncen
trat
ion
(ng/
ml)
Ref
NS
AS
NH
AH
55
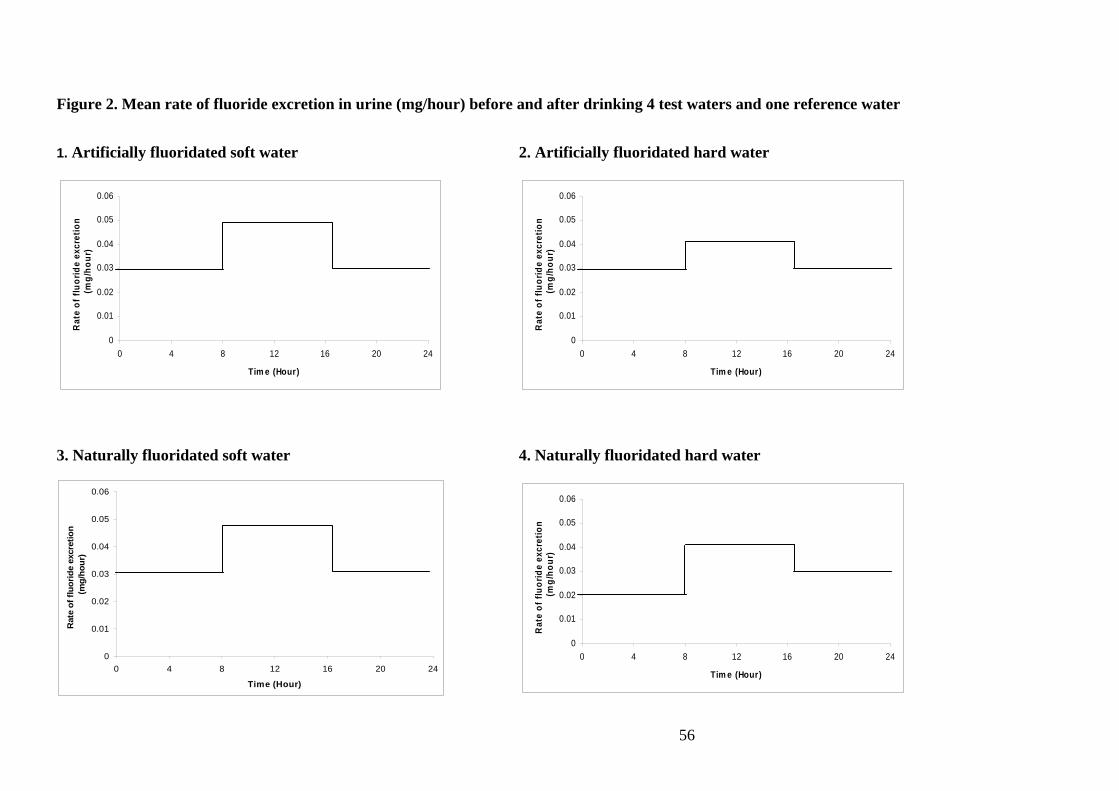
Figure 2. Mean rate of fluoride excretion in urine (mg/hour) before and after drinking 4 test waters and one reference water
1. Artificially fluoridated soft water 2. Artificially fluoridated hard water
3. Naturally fluoridated soft water 4. Naturally fluoridated hard water
0
0.01
0.02
0.03
0.04
0.05
0.06
0 4 8 12 16 20 24
Tim e (Hour)
Rat
e of
fluo
ride
excr
etio
n (m
g/ho
ur)
0
0.01
0.02
0.03
0.04
0.05
0.06
0 4 8 12 16 20 24
Tim e (Hour)
Rat
e of
fluo
ride
excr
etio
n (m
g/ho
ur)
0
0.01
0.02
0.03
0.04
0.05
0.06
0 4 8 12 16 20 24
Time (Hour)
Rat
e of
fluo
ride
excr
etio
n (m
g/ho
ur)
0
0.01
0.02
0.03
0.04
0.05
0.06
0 4 8 12 16 20 24
Tim e (Hour)
Rat
e of
fluo
ride
excr
etio
n (m
g/ho
ur)
56
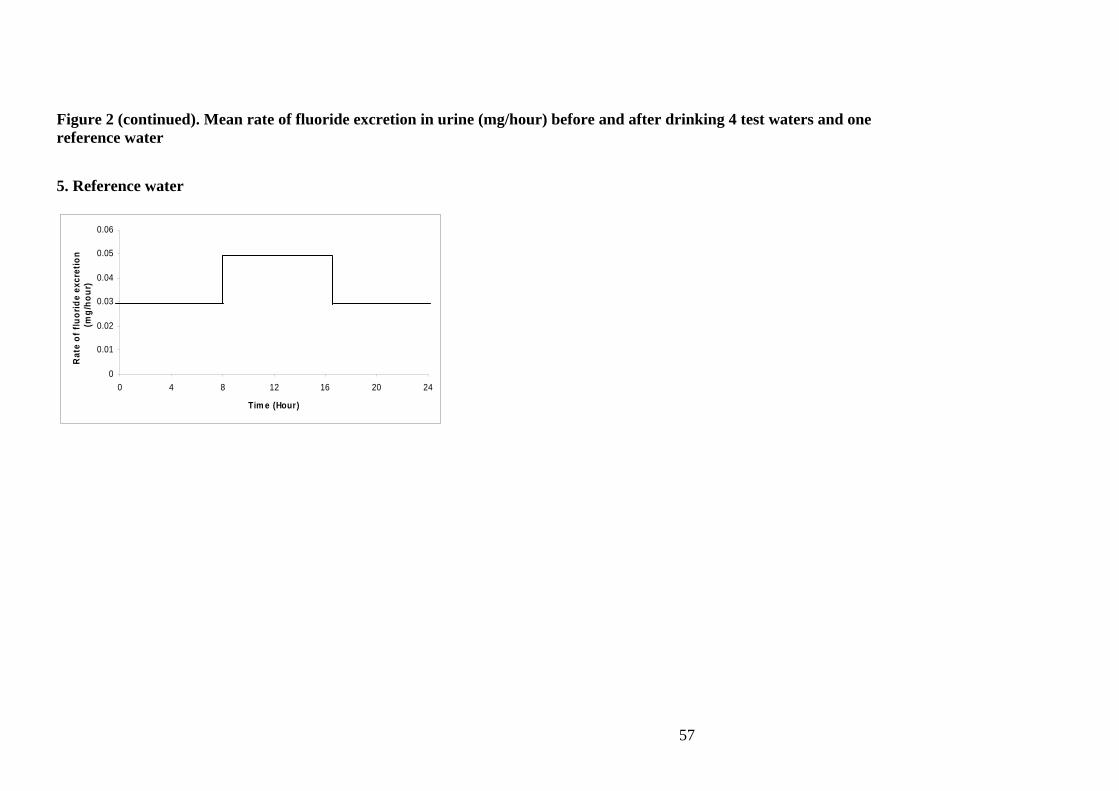
Figure 2 (continued). Mean rate of fluoride excretion in urine (mg/hour) before and after drinking 4 test waters and one reference water
5. Reference water
0
0.01
0.02
0.03
0.04
0.05
0.06
0 4 8 12 16 20 24
Tim e (Hour)
Rat
e of
fluo
ride
excr
etio
n (m
g/ho
ur)
57

58
LIST OF APPENDICES Appendix 1: Letters of Ethical Approval. Appendix 2: Subject information sheets and consent form. Appendix 3: Manufacturing worksheet for production of standard reference water. Appendix 4: Report of independent fluoride and hardness testing of test and reference waters. Appendix 5: Statistician’s randomisation of order of waters to be tested by each subject. Appendix 6: Schedule for sample collection. Appendix 7: Standard Laboratory Operating Procedure for fluoride analyses of plasma samples. Appendix 8: Worksheets for data collection, collation and analysis. Appendix 9: Standard Laboratory Operating Procedure for fluoride analyses of urine samples. Appendix 10: Unavailable plasma samples and negative values for plasma fluoride concentration. Appendix 11: Validation of methods used for fluoride analysis of plasma and urine. Appendix 12: Raw data for plasma fluoride analysis for 20 subjects. Appendix 13: Statistical analysis of plasma data. Appendix 14: Raw data for urinary fluoride excretion for 20 subjects. Appendix 15: Statistical analysis of urine data Appendix 16: Retrospective power calculation