fluoride contamination in drinking water and its impact on ... · fluoride contamination in...
TRANSCRIPT

Research Journal of Chemical Sciences ______________________________________________ ISSN 2231-606X
Vol. 5(2), 76-84, February (2015) Res. J. Chem. Sci.
International Science Congress Association 76
Fluoride Contamination in Drinking Water and its Impact on Human Health
of Kishanganj, Bihar, India
Kumar A1 *
and Kumar V2
1*P.G. Department of Chemistry, D.S. College, Katihar [BNMU], Bihar, INDIA
2Department of Chemistry, Kishanganj College of Engineering and Technology, Veriadangi, Kishanganj, [BNMU], Bihar, INDIA
Available online at: www.isca.in, www.isca.me Received 1st February 2015, revised 16th February 2015, accepted 18th February 2015
Abstract
This paper is aimed to analyze the fluoride concentration in groundwater, their resources and monitoring of the impact of
fluoride on human health in kishanganj district, Bihar, India. In the present study the fluoride concentration varied from
0.61-3.74 mg/l in different groundwater resources of various villages. Among 150 hand pump/tap water samples of all 5
blocks of Kishanganj district 110 (73.33%) sites (villages and town areas) are safe, 28(18.67%) villages are under dental
fluorosis and 12(8.0%) villages are under skeletal fluorosis, whereas among 150 open/ring water samples, 121 (81%) sites
are safe, 14(14%) villages are under dental fluorosis and 8(5.0%) villages are under skeletal fluorosis. The results were on
the basis of the questionnaire survey conducted in five blocks of Kishanganj district. During the study, 2500 people were
examined, of which 53.6% people were affected by dental fluorosis and 11.2% people were suffering from skeletal fluorosis.
Fluorosis was found to be high in males compared to females. High pH, low calcium concentrations and high temperatures
of the study area may contribute to high fluoride concentrations in groundwater. Questionnaire survey results generally
indicate that majority of residents of rural area were suffering from dental and skeletal fluorosis due to unawareness and
lack of precautionary measures against fluoride. If people become aware of impact of fluoride and use pure and fluoride free
water then the probability of dental and skeletal problems may be minimized.
Keywords: Fluoride, Drinking water, impacts, human health, fluorosis, Kishanganj district.
Introduction
India has two major public-health problems induced by use of
groundwater as a source of drinking water having excess
fluoride and arsenic. Due to a variety of natural and human
influences groundwater resources are under threat in few parts
of the country1- 5
. Small quantity of fluoride is an essential
component for normal mineralization of bones and formation of
dental enamel. However, excess concentration may result in
slow, progressive scourge known as fluorosis. More than 20
developed and developing nations are suffering from fluorosis6.
In India, fluoride in drinking water was first reported at Nellore
district of Andhra Pradesh in 1937 and then considerable works
have been done in different parts of India7. At present, it has
been estimated that fluorosis is widespread in seventeen states
of India indicating that endemic fluorosis is one of the most
acute public health problems of the country. More than 66
million people are estimated to suffering from fluorosis, among
which 6 million children are below 14 years of age in
India
alone8. Dipankar et al. reported that 20 out of 28 Indian states
have some degree of groundwater fluoride contamination;
impacting 85-97% of districts in some states9.
Fluorine is widely distributed in earth’s crust and exists in the
form of fluorides. The natural concentration of fluoride in
groundwater depends on the geological, chemical and physical
characteristics of resources, types of the soil and rocks,
temperature and the action of other chemical substances10
.
Fluoride is completely absorbed by the gastrointestinal tract and
the absorbed fluoride is rapidly distributed throughout the body.
Since fluorine is highly electronegative element, it has a strong
tendency to get attracted by positively charged calcium ions in
teeth and bones and excessive intake result in pathological
changes in teeth and bones, such as mottling of teeth or dental
fluorosis followed by skeletal fluorosis11
. Thus, a large amount
of fluoride gets bound in these tissues and only a small amount
is excreted via urine, faeces and sweat. Low concentration of
fluoride causes dental caries, both in children and adults12
.
Skeletal fluorisis is observed when drinking water contains 3-6
mg of fluoride per liter and developed as crippling skeletal
fluorosis when drinking water contains over 10 mg of fluoride
per liter. Other sources of fluoride poisoning are food, industrial
exposure, drugs, cosmetics, etc13
. WHO, has stated that India
and China are the most affected countries to fluoride exposure.
BIS (Bureau of Indian Standards) permissible limit for fluoride
is 0.6-01.2 mg/l and WHO (International Standards for Drinking
Water) is 1.5 mg/lit.
Material and Methods
Study area: Kishanganj district is situated at latitude of 250 20’
to 260 30’ north and longitude of 87
0 7’ to 88
0 19’ east. The
climate of the district is humid with maximum temperature of

Research Journal of Chemical Sciences ___________________________________________________________ ISSN 2231-606X
Vol. 5(2), 76-84, February (2015) Res. J. Chem. Sci.
International Science Congress Association 77
410C in May and minimum of 5
0C in January. The main rivers
of the district are Mahananda, Kankai, Mechi, Ratwa, Ram
Chandra, Donk and Kaul. In Kishanganj, two types of minerals
are found; silica and iron. The forest area of the district is
mainly situated in the two blocks of Thakurganj and
Terhagachh. In the past, Kishanganj had recorded the highest
rainfall in Bihar. The average rainfall is 2250 mm, of which 80
percent occurs during the monsoon.
Water samples were collected during summer (Mar-June), rainy
(July-Oct) and winter (Nov-Feb) in the year 2011 and 2013
from 30 locations of municipal area of Kishanganj block, 30
villages from 10 Panchayats (3 villages from each panchayat),
each of four blocks namely Bahadurganj, Kochadhaman,
Teragachh and Thakurganj, covering entire Kishanganj district.
The sampling points were confined to hand pumps, tap water,
open wells, ring wells and PHE supply for drinking purposes.
The research work was carried out in laboratory of P.G.
Department of Chemistry, D.S. College, Katihar (Bihar), Shiva
Test House, Bailey Road, Patna, Recognized as Environmental
Laboratory by Central Govt. and laboratory of Kishanganj
College of Engineering andTechnology Veriadangi, Kishanganj,
Bihar.
Methodology: Temperature and pH were measured
immediately at the spot after the collection of samples with the
help of Celsius mercury thermometer graduated up to 1100C and
pH meter (Model digital pH Hmeter 335) respectively. Ion
Selective Electrode (ISE) method described by Rong et al.,
recommended by APHA (1991)14.15
. Calcium was estimated by
EDTA Titration method as described by UNEP GEMS/Water
Program (1985), and earlier referred by Environmental Canada
197416
. It was important to measure temperature, pH and
calcium as they influence the concentration of fluorides in
groundwater. The mean fluoride concentration for each
sampling site was compared with the DWAF, BIS and
WHO
guidelines for domestic use to assess compliance17- 18, 21
.
Results and Discussion
Fluoride Distribution: All the sampling stations (the hand
pump/tap, open/ring well wise concentration of fluoride) were
categorized as follows19
: Category I- Fluoride Concentration
below 1.0 mg/l, Category II- Fluoride Concentration between
1.0-1.5 mg/l, Category III-Fluoride Concentration between 1.5-
3.0 mg/l, Category IV- Fluoride Concentration between 3.0-4.0
mg/l.
The abstract of fluoride distribution in hand pump/tap and
open/ring well water samples are shown in table-1 and 2
respectively. The colored comparative charts and pie charts are
also prepared as shown figure- 2 to 5. Fluoride concentration in
hand pump/tap water samples in the five blocks of Kishanganj
district ranges from 0.65-3.74 mg/l. The minimum concentration
(0.65 mg/l) was recorded from 2 sites [at S4 (K.L.Das) in
Subhashpally and S10 (at B.K.Thakur) in Railway Colony] of
Kishanganj municipal area while maximum concentration (3.74
mg/l) was recorded at S5 Haat Tola in Pawakhali village of
Thakurganj block.
The present survey reveals that out of 150 hand pump/tap water
samples in 63 villages (42%) have fluoride concentration ≤1.0
mg/l and fall in category-I. The concentration of fluoride is
beneficial up to 1.0 mg/l, therefore there is no possibility of
fluorosis in these habitations. Once fluoride is deposited into
teeth, it reduces the solubility of the enamel and thereby
provides protection against dental caries20
.
47 locations (31.3%) have fluoride concentration above 1.0 mg/l
and ≤ 1.5 mg/l and fall in category-II, which is the maximum
desirable limit of standards for drinking water (WHO). More
than 4 mg per day fluoride is taken by the people of these
habitations. Therefore, possibility of the first and second degree
dental fluorosis is possible22
.
28 villages (18.7%) have groundwater with fluoride
concentration above 1.5 mg/l and ≤ 3 mg/l and fall in category-
III, which is above the maximum permissible limit of standards
for drinking water (BIS,WHO). At this concentration, mottled
enamel and in some cases, the pre stage of skeletal fluorosis has
been observed23, 24
. In 12 villages (8%) fluoride concentration in
groundwater is above 3.0 mg/l and ≤ 4 mg/l and fall in category-
IV. The intake of fluoride per day by the population in this
habitation is very high and cause dental as well as skeletal
fluorosis20, 22
.
Table-1
Abstract of Fluoride Distribution in Hand Pump/Tap Water Samples (Summer)
Block/Town Fluoride
content
No. of Water Samples with Percentage Total no.
of samples 0-1.0 mg/l 1-1.50 mg/l 1.5-3.0 mg/l 3.0-4.0 mg/l
Kishanganj 0.65-1.55 18 (60.0%) 10 (33.3%) 02 (8.7%) ----------- 30
Bahadurganj 0.66-3.16 14 (46.7%) 12 (40.0%) 03 (10%) 01 (3.33%) 30
Kochadhaman 0.68-3.26 11 (36.7%) 13 (43.3%) 04 (13.3%) 02 (6.7%) 30
Teragachh 0.67-3.35 10 (33.3%) 08 (26.7%) 08 (26.7%) 04 (13.3%) 30
Thakurganj 0.74-3.74 10 (33.3%) 04 (13.3%) 11 (36.7%) 05 (16.7%) 30
----------- ---------- 63 (42.0%) 47 (31.3%) 28 (18.7%) 12 (8.0%) 150
------------ ----------- 63+47=110 (73.3%)safe --------------- ------------- -----------

Research Journal of Chemical Sciences ___________________________________________________________ ISSN 2231-606X
Vol. 5(2), 76-84, February (2015) Res. J. Chem. Sci.
International Science Congress Association 78
Figure-1
Sketch map of Kishanganj district showing five sampling blocks
Figure-2
Graph showing seasonal variations of fluoride in hand pump/tap water samples at different locations
Research Journal of Chemical Sciences ___________________________________________________________ ISSN 2231-606X
Vol. 5(2), 76-84, February (2015) Res. J. Chem. Sci.
International Science Congress Association 79
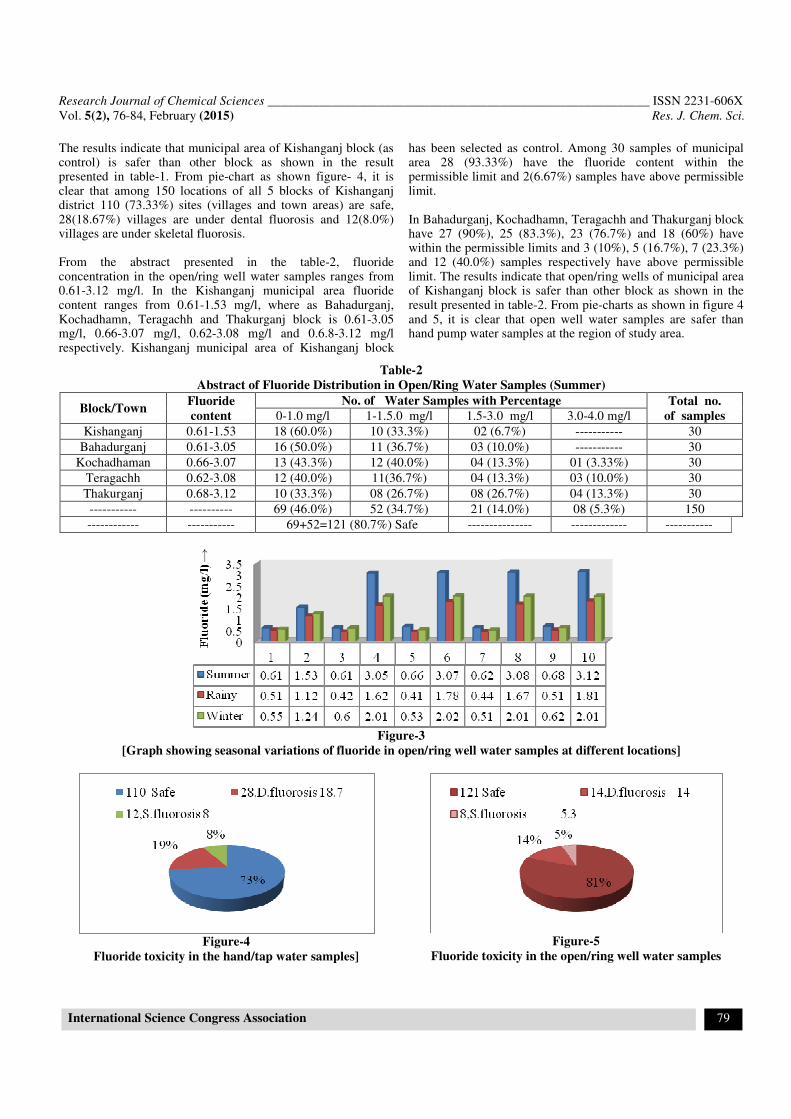
The results indicate that municipal area of Kishanganj block (as control) is safer than other block as shown in the result presented in table-1. From pie-chart as shown figure- 4, it is clear that among 150 locations of all 5 blocks of Kishanganj district 110 (73.33%) sites (villages and town areas) are safe, 28(18.67%) villages are under dental fluorosis and 12(8.0%) villages are under skeletal fluorosis. From the abstract presented in the table-2, fluoride concentration in the open/ring well water samples ranges from 0.61-3.12 mg/l. In the Kishanganj municipal area fluoride content ranges from 0.61-1.53 mg/l, where as Bahadurganj, Kochadhamn, Teragachh and Thakurganj block is 0.61-3.05 mg/l, 0.66-3.07 mg/l, 0.62-3.08 mg/l and 0.6.8-3.12 mg/l respectively. Kishanganj municipal area of Kishanganj block
has been selected as control. Among 30 samples of municipal area 28 (93.33%) have the fluoride content within the permissible limit and 2(6.67%) samples have above permissible limit. In Bahadurganj, Kochadhamn, Teragachh and Thakurganj block have 27 (90%), 25 (83.3%), 23 (76.7%) and 18 (60%) have within the permissible limits and 3 (10%), 5 (16.7%), 7 (23.3%) and 12 (40.0%) samples respectively have above permissible limit. The results indicate that open/ring wells of municipal area of Kishanganj block is safer than other block as shown in the result presented in table-2. From pie-charts as shown in figure 4 and 5, it is clear that open well water samples are safer than hand pump water samples at the region of study area.
Table-2
Abstract of Fluoride Distribution in Open/Ring Water Samples (Summer)
Block/Town Fluoride
content
No. of Water Samples with Percentage Total no.
of samples 0-1.0 mg/l 1-1.5.0 mg/l 1.5-3.0 mg/l 3.0-4.0 mg/l
Kishanganj 0.61-1.53 18 (60.0%) 10 (33.3%) 02 (6.7%) ----------- 30
Bahadurganj 0.61-3.05 16 (50.0%) 11 (36.7%) 03 (10.0%) ----------- 30
Kochadhaman 0.66-3.07 13 (43.3%) 12 (40.0%) 04 (13.3%) 01 (3.33%) 30
Teragachh 0.62-3.08 12 (40.0%) 11(36.7%) 04 (13.3%) 03 (10.0%) 30
Thakurganj 0.68-3.12 10 (33.3%) 08 (26.7%) 08 (26.7%) 04 (13.3%) 30
----------- ---------- 69 (46.0%) 52 (34.7%) 21 (14.0%) 08 (5.3%) 150
------------ ----------- 69+52=121 (80.7%) Safe --------------- ------------- -----------
Figure-3
[Graph showing seasonal variations of fluoride in open/ring well water samples at different locations]
Figure-4
Fluoride toxicity in the hand/tap water samples]
Figure-5
Fluoride toxicity in the open/ring well water samples

Research Journal of Chemical Sciences ___________________________________________________________ ISSN 2231-606X
Vol. 5(2), 76-84, February (2015) Res. J. Chem. Sci.
International Science Congress Association 80
The comparative charts and figures show that fluoride
concentration at all sampling sites (hands/tap, open/ring wells,)
decreased during rainy season (July- Oct) and levels increased
during winter season (Nov-Feb) and summer (March-June). The
results show the effect of dilution and concentration associated
with wet and dry season respectively
Chemical and Physical Controls: Correlation between
calcium and fluoride concentration: The concentration of
calcium is lower in summer season for mostly sampling stations
as shown in figure- 6 and 7. The lower concentration of calcium
increases the solubility of CaF2, with increase in the
concentration of fluorides in groundwater. The reaction between
Ca++
and F- ions indicates the fluoride concentration is
controlled by equilibrium of fluorite25
. When the water is
saturated with respect to fluorite, low calcium concentration
leads to higher fluoride concentration26
. Higher fluoride
concentration is therefore expected in ground water from
aquifers with low calcium concentrations. The results generally
show that increase in calcium is associated with decrease in
fluoride and vice versa.
Correlation between pH and fluoride concentrations: From
comparative study as shown in figure-8 and 9, pH values are
higher in summer and lower in rainy.
Figure- 6
Graph showing seasonal variations of Ca
Figure-7
Graph showing seasonal variations of Ca
Figure-8
Graph showing seasonal variations of pH
Figure-9
Graph showing seasonal variations of pH
When pH >8, fluoride concentrations commonly exceed 1.0
mg/l. Main rivers flowing through the Kishanganj district are
Mahananda, Kanki, Mechi, Ritwa, Ramzan, Donk and Kaul.
Due to weathering and leaching of fluoride minerals in rock
formation under alkaline environments lead to the increase of
fluorite in ground water27
. Saxena and Ahmed reported that an
alkaline pH ranging from 7.4-8.8 resulted in high fluoride
concentrations (1.7-6.1 mg/l) in groundwater sources in India28
.
Alkaline pHs which increased the solubility of fluoride-bearing
formations likely contributed to increased fluoride
concentrations at hand pumps in this study.
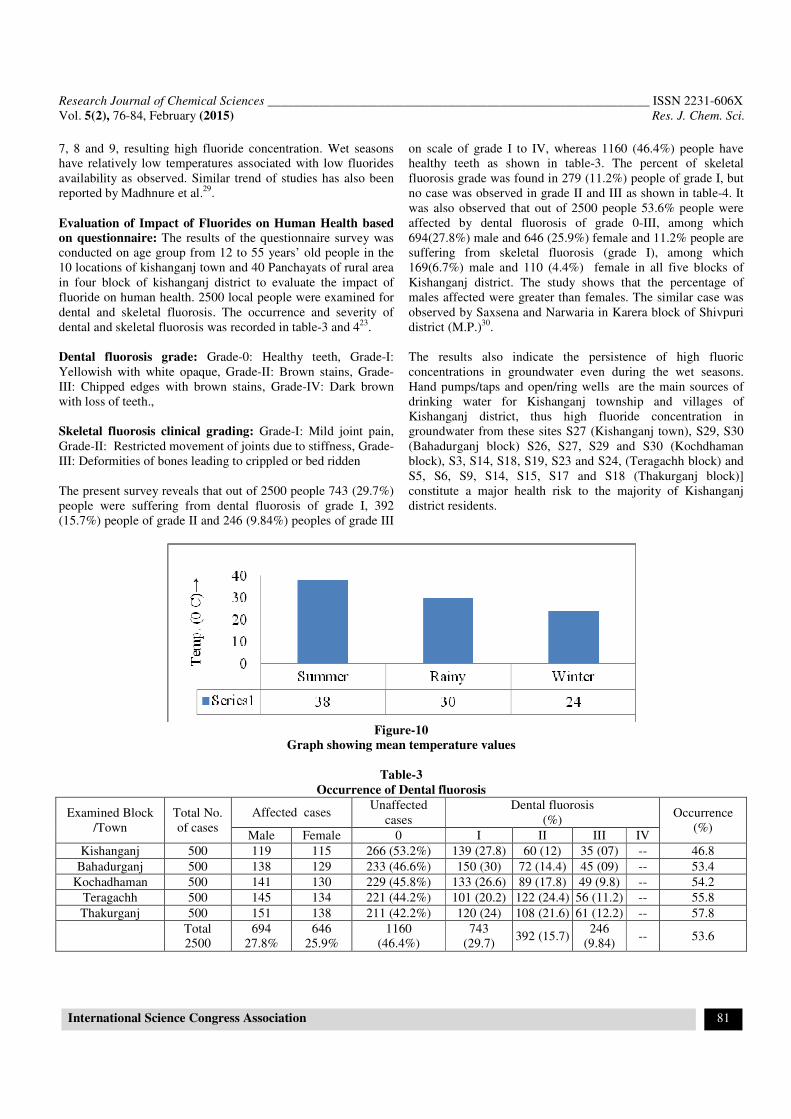
Fluoride in Area of Intense Evaporation: The maximum
average temperature in Kishanganj district during summer, rainy
and winter for March-June, July-Oct, Nov-Feb were 380C, 30
0C
and 240C respectively. Thermal waters especially those of high
pH are rich in fluoride. Though the temperature values in
summer are higher than those in rainy and winter season, their
fluoride concentrations throughout the sampling period are
generally high and comparable as shown in figure-2 (hand
pumps) and figure-3 (open wells). This is likely to be due to the
fact that their calcium concentration and pHs are also generally
low and high respectively and comparable as shown in figure-6,
Research Journal of Chemical Sciences ___________________________________________________________ ISSN 2231-606X
Vol. 5(2), 76-84, February (2015) Res. J. Chem. Sci.
International Science Congress Association 81
7, 8 and 9, resulting high fluoride concentration. Wet seasons
have relatively low temperatures associated with low fluorides
availability as observed. Similar trend of studies has also been
reported by Madhnure et al.29
.
Evaluation of Impact of Fluorides on Human Health based
on questionnaire: The results of the questionnaire survey was
conducted on age group from 12 to 55 years’ old people in the
10 locations of kishanganj town and 40 Panchayats of rural area
in four block of kishanganj district to evaluate the impact of
fluoride on human health. 2500 local people were examined for
dental and skeletal fluorosis. The occurrence and severity of
dental and skeletal fluorosis was recorded in table-3 and 423
.
Dental fluorosis grade: Grade-0: Healthy teeth, Grade-I:
Yellowish with white opaque, Grade-II: Brown stains, Grade-
III: Chipped edges with brown stains, Grade-IV: Dark brown
with loss of teeth.,
Skeletal fluorosis clinical grading: Grade-I: Mild joint pain,
Grade-II: Restricted movement of joints due to stiffness, Grade-
III: Deformities of bones leading to crippled or bed ridden
The present survey reveals that out of 2500 people 743 (29.7%)
people were suffering from dental fluorosis of grade I, 392
(15.7%) people of grade II and 246 (9.84%) peoples of grade III
on scale of grade I to IV, whereas 1160 (46.4%) people have
healthy teeth as shown in table-3. The percent of skeletal
fluorosis grade was found in 279 (11.2%) people of grade I, but
no case was observed in grade II and III as shown in table-4. It
was also observed that out of 2500 people 53.6% people were
affected by dental fluorosis of grade 0-III, among which
694(27.8%) male and 646 (25.9%) female and 11.2% people are
suffering from skeletal fluorosis (grade I), among which
169(6.7%) male and 110 (4.4%) female in all five blocks of
Kishanganj district. The study shows that the percentage of
males affected were greater than females. The similar case was
observed by Saxsena and Narwaria in Karera block of Shivpuri
district (M.P.)30
.
The results also indicate the persistence of high fluoric
concentrations in groundwater even during the wet seasons.
Hand pumps/taps and open/ring wells are the main sources of
drinking water for Kishanganj township and villages of
Kishanganj district, thus high fluoride concentration in
groundwater from these sites S27 (Kishanganj town), S29, S30
(Bahadurganj block) S26, S27, S29 and S30 (Kochdhaman
block), S3, S14, S18, S19, S23 and S24, (Teragachh block) and
S5, S6, S9, S14, S15, S17 and S18 (Thakurganj block)]
constitute a major health risk to the majority of Kishanganj
district residents.
Figure-10
Graph showing mean temperature values
Table-3
Occurrence of Dental fluorosis
Examined Block
/Town
Total No.
of cases
Affected cases Unaffected
cases
Dental fluorosis
(%) Occurrence
(%) Male Female 0 I II III IV
Kishanganj 500 119 115 266 (53.2%) 139 (27.8) 60 (12) 35 (07) -- 46.8
Bahadurganj 500 138 129 233 (46.6%) 150 (30) 72 (14.4) 45 (09) -- 53.4
Kochadhaman 500 141 130 229 (45.8%) 133 (26.6) 89 (17.8) 49 (9.8) -- 54.2
Teragachh 500 145 134 221 (44.2%) 101 (20.2) 122 (24.4) 56 (11.2) -- 55.8
Thakurganj 500 151 138 211 (42.2%) 120 (24) 108 (21.6) 61 (12.2) -- 57.8
Total
2500
694
27.8%
646
25.9%
1160
(46.4%)
743
(29.7) 392 (15.7)
246
(9.84) -- 53.6

Research Journal of Chemical Sciences ___________________________________________________________ ISSN 2231-606X
Vol. 5(2), 76-84, February (2015) Res. J. Chem. Sci.
International Science Congress Association 82
Figure-A
Istaruh Nisha, Chakla panchayat
Figure-B
Rubina, kochadhaman Block
Figure-C
Amela Khatoon, near Engg. College
Figure-D
Jumatan Nisha, Jahangir Tola
Figure-E
K. L. Das, Subhashpally (Father), Residents in Kishanganj
District, since 8 years
Figure-F
Bittu Das, Subhashpally (Son), Residents in Kishanganj
District, since 8 years
Figure-G
Gauri, Thakurganj
Figure-H
Pankaj at Pachimpali, Kishanganj
Figure-I
Arun Chowdhary at Keltax, Kishanganj
Figure-11
Showing dental fluorosis of different grads among villager of
Kishanganj district
Conclusion
Finally it is concluded that in the present study the fluoride
concentration varied from 0.61-3.74 mg/l in different
groundwater resources of various villages in five blocks of
Kishanganj district. The study also reveals that open well water
samples are safer than hand pump water samples at the region of
study area. High pH, low calcium concentrations and high

Research Journal of Chemical Sciences ___________________________________________________________ ISSN 2231-606X
Vol. 5(2), 76-84, February (2015) Res. J. Chem. Sci.
International Science Congress Association 83
temperatures of the study area may contribute to high fluoride
concentrations in groundwater. Questionnaire survey results
generally indicate that majority of residents of rural area were
suffering from dental and skeletal fluorosis due to unawareness
and lack of precautionary measures against fluoride. If people
become aware of impact of fluoride and use pure and fluoride
free water then the probability of dental and skeletal problems
may be minimized
Table-4
Occurrence of Skeletal fluorosis
Examined
Block
/Town
Total No.
of
cases
Affected cases Unaffected cases Skeletal fluorosis
(%)
Occurrence
(%)
Male Female 0 I II III -------------
Kishanganj 500 15 12 473 (94.6%) 27 (5.4) ---- ---- 5.4
Bahadurganj 500 27 17 456 (91.2%) 44 (8.8) ---- ---- 8.8
Kochadhaman 500 33 21 446 (89.2%) 54 (10.8) ---- --- 10.8
Teragachh 500 41 29 430 (86.1%) 70 (14.0) ---- --- 14.0
Thakurganj 500 53 31 416 (83.2%) 84 (16.8) ---- --- 16.8
--------------- Total
2500
169
(6.76%)
110
(4.4%) 2221 (88.8%)
279
(11.2%) ---- --- 11.2
References
1. Khan A. Arbab and Khan Mohd Nawaz, International
Science Congress Association Physico-Chemical Study
of Groundwater at Shahjahanpur city, Uttar Pradesh,
India, Res. J. Chem. Sci., 5(1), 55-59 (2015)
2. Devanand D. C., Jain A. D., Bhattacherjee S. S., Liny
P. and Krishna Murthy T. P., Adsorption of Fluoride
from water using Spirulina platensis and its Measurement
using Fluoride Ion Selective E lectrode, Res. J. Chem.
Sci., 4(6), 41-44 (2014)
3. Parihar S.S., Kumar A., Kumar A., Gupta R.N., Pathak
M., Shrivastav A. and Pandey A.C., Physico- Chemical
and Microbiological Analysis of Underground Water in
and Around Gwalior City, MP, India, Res. J. Recent Sci.,
1(6), 62-65 (2012)
4. Haribhau M.G., Trace metals contamination of surface
water samples in and around Akot city in Mahrashtra,
India, Res. J. Recent Sci., 1(7), 5-9 (2012)
5. Antony Ravindran A., Azimuthal Square Array
Resistivity Method and Goundwater Exploration in
Sanganoor, Coimbatore District, Tamilnadu, India, Res.
J. Recent Sci., 1(4), 41-45 (2012)
6. Mameri N., Yeddou A.R., Lounici H., Grib H., Belhocine
D. and Bariou B., Defluoridation of septentrional
Sahara water of North Africa by electro-coagulation
process using bipolar aluminum electrodes, Water Res.,
32 (5) 1604–1610 (1998)
7. Shortt W. E., Endemic fluorosis in Nellore District,
South India, Ind. Med.Gazette,72, 396 (1937)
8. Ayoob S. and Gupta A. K., Fluoride drinking water: A
review on the status and stress effects, Critical Rev.
Environ. Sci. Technol., 36, 433-487 (2006)
9. Chakarbort D., Das B. and Murrill M.T., Examining
India’s Groundwater Quality Management, Environ. Sci.
Technol., 45, 27-33 (2011)
10. Fluorine and fluorides, Environmental Health Criteria,
36, IPCS International Programme on Chemical Safety,
(1984)
11. Susheela A.K., Fluorosis management program in India,
Curr. Sci., 77, 1250-1256 (1999)
12. Frazao P., Peres M. A. and Cury J.A., Drinking water
quality and fluoride concentration, Rev Saude Publica, 45
(5), 1-10 (2011)
13. Meenakshi Garg V. K., Kavita Renuka, and Malik A.,
Ground water quality insome villages of Haryana, India:
focus on fluoride and fluorosis, J. Haz. Mater, B 106,
85–97 (2004)
14. Rong, L., Srinivasan K., Khalil D. and Chris P.,
Analysis of Fluoride in Drinking Water in the Presence
of Interfering Metal Ions such as Iron and Aluminum;
Dionex Corporation CA, USA.
15. APHA Standard method for the examination of water and
waste water (17th
ed.), Washington, DC : American
Public Health Association, (1991)
16. UNEP GEMS/Water Program, Analytical Method for
Environment Water Quality; code-20101, 77 (1985)
17. DWAF (Department of Water Afffairs and Forestry)
South African Water Quality Guidelines, 1: Domestic
Water Use (2nd edn.), Department of Water Affairs and
Forestry, Pretoria, (1996)
18. Bureau of Indian Standards (BIS). Specification for
drinking water IS 10500, New Delhi (2–4), (1991)
19. Arif M., Husain I., Hussain J. and Kumar S.,
Assessment of fluoride level in groundwater and
prevalence of dental fluorosis in Didwana block of
Nagaur district, central Rajasthan, India, Int J. Occup

Research Journal of Chemical Sciences ___________________________________________________________ ISSN 2231-606X
Vol. 5(2), 76-84, February (2015) Res. J. Chem. Sci.
International Science Congress Association 84
Environ Med., 4, 178-184 (2013)
20. Hussain I., Arif M. and Hussain J., Fluoride
Contamination in drinking water in rural habitations of
Central Rajasthan, India, Environ. Monit Assess., 184,
5151-5158 (2012)
21. World Health Organization (WHO) Guidelines for
Drinking-water Quality (3rd edn. Incorporating the first
addendum). Volume1, Recommendations, World Health
Organization, Geneva, (2006)
22. Arif M., Hussain J., Hussain I. and Kumar S., An
Assessment of Fluoride Concentration in Groundwater
and Risk on Health of North Part of Naguur District,
Rajasthan, India, World Applied Sciences Journal, 24(2),
146-153 (2013)
23. Dean H. T., The investigation of physiological effects by
the epidemiological method. In: Moulton F, editor
fluoride and dental health. Washington DC: American
association for the advancement of science, Publication
No, 19, 23-31 (1942)
24. Odiyo J. O. and Makungo R., Fluoride concentrations in
groundwater and impact on human health in Siloam
Village, Limpopo Province, South Africa, Water SA,
38(5), 731-736 (2012)
25. Chate G.T., Yun S.T., Mayer B., Kim K.H., Kim S.Y.,
Kwon J.S., Kim K. and Koh Y.K., Fluorine geochemistry
in bedrock groundwater of South Korea, Sci. Total
Environ., 385, 272–283 (2007)
26. Nezli I. E., Achour S., Djidel M. and Attalah S.,
Presence and origin of fluoride in the complex terminal
water of Ouargla Basin (Northern Sahara of Algeria),
Am. J. Appl. Sci., 6(5), 876–881 (2009)
27. Raju N.J., Dey S. and Das K., Fluoride contamination in
ground waters of Sonbhadra District, Uttar Pradesh,
India. Curr. Sci., 96(7), 975–985 (2009)
28. Saxena V. K. and Ahmed S., Inferring the chemical
parameters for the dissolution of fluoride in groundwater,
Environ. Geol., 43, 731–736 (2003)
29. Madhnure P., Sirsikar D. Y., Tiwari A. N., Ranjan B. and
Malpe D. B., Occurrence of fluoride in the groundwater
of Pandharkawada area, Yavatmal district, Maharashtra,
India, Curr. Sci., 92(5), 675-679 (2007)
30. Saxsen D.N. and Narwaria Y.S., Incidence of fluoride in
groundwater and its potential health effects in ten
villages of Karera block in Shivpuri district, M.P., India,
International J. Environ. Sciences, 3(3), (2012)