bighorn herd performance and disease in nevada · blood sample . blood - looks for antibodies that...
TRANSCRIPT

Bighorn herd Performance and disease in Nevada

Polymicrobial pneumonia cause disease events
that are initiated by infection with the bacteria
Mycoplasma ovipneumoniae
or M. ovi

M. ovi causes dysfunction of
the cilia in the throat

Bacteria that live in the back of the throat can then move down to the
lungs causing pneumonia

Worst case scenario following M. ovi infection
All age die-off 5-20 % of survivors - chronic shedder of M. ovi Chronic shedder ewe expose lambs in nursery groups Significant annual lamb loss (> 5 yrs)

How we test for Mycoplasma ovipneumoniae
Nasal swab
Blood sample
Blood - looks for antibodies that animal produces if previously exposed to M. ovi
Persistent Antibodies = a few sheep in herd are shedding
Nasal Swab: Looks for presence of the bacterial DNA if the bighorn is shedding M. ovi from nose

Disease Transmission to Bighorn Herds and Variable Herd Reponses
• 47% of Nevada’s bighorn herds have experienced a disease event involving lamb only or lamb and adult mortalities due to pneumonia
Variable Herd Responses • All age disease event with 1 to multiple years of poor or
variable lamb recruitment and no recovery to pre-disease event population level
• All age die-off with complete loss of herd • All age disease event with 1-2 years of poor lamb recruitment
with herd recovery near pre-disease event population level • Few mortalities with little or no impact to herd performance

Why Variable Outcomes?
Pathogen related: • Chronic Carriers • Strain type Animal or Habitat Related: • Herd Density • Subhherd Dynamics • Nutrition • Genetics • Environmental Factors

Parameter 2013 2014 2015
Herds Sampled 7 19 23
Total Animals 80 190 236 GPS Collars Deployed 13 35 62
Disease Surveillance of Bighorn Herds 2013 - 2015


DNA Strain Type of Mycoplasma ovipneumoniae detected as of January 2016


0 10 20 30 40 50
Sheep Creek
Snowstorm
Santa Rosa
Jackson
Black Rock
Sheldon
Pine Forest
Montana/Double Hs
Virginia
Granites
High Rock/Calicos
Hays/Coleman
Lambs /100 Ewes
California Bighorn Herd Lamb Ratios 2015 or 2014
M. ovi YES M. ovi UNK M. ovi NO
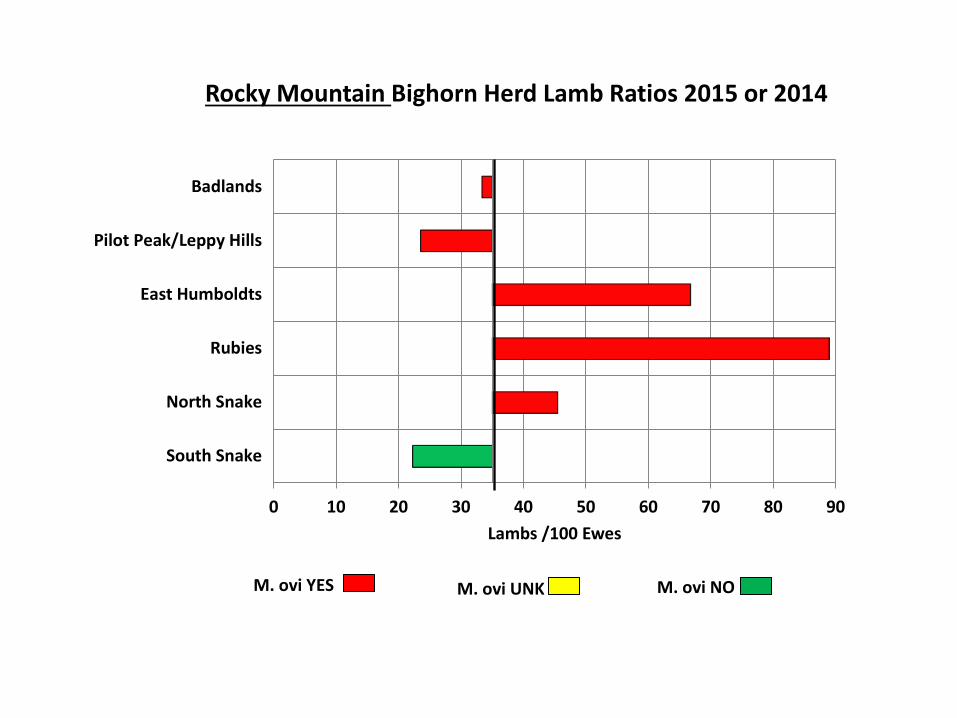
0 10 20 30 40 50 60 70 80 90
South Snake
North Snake
Rubies
East Humboldts
Pilot Peak/Leppy Hills
Badlands
Lambs /100 Ewes
Rocky Mountain Bighorn Herd Lamb Ratios 2015 or 2014
M. ovi YES M. ovi UNK M. ovi NO

0 10 20 30 40 50 60 70
Virginia
Desatoya
Clan Alpine
Stillwater/East
Fairview/Slate/Sand Sprgs
Toiyabe
Hot Creek
Monitor
Toquima
Pancake
Grant
White Pine/DW/N Pancakes
Tobin
Lambs /100 Ewes
Central Nevada Desert Bighorn Lamb Ratios 2015 or 2014
M. ovi YES M. ovi UNK M. ovi NO

0 10 20 30 40 50 60
Mt Grant/Wassuk
East Walker River
Gabbs Valley & Gillis
Excelsior/Candelaria/Miller
Silver Peak
Lone Mountain
Monte Cristo
Stonewall
NTTR
Bare
Specter
Lambs /100 Ewes
West Central Desert Bighorn Lamb Ratios 2015 or 2014
M. ovi YES M. ovi UNK M. ovi NO

0 10 20 30 40 50 60 70
Las VegasSheepDesert
PintwaterSpotted
Gold Buttes/VirginMormon
RiverMuddys
BlacksN EldoradosMcCullough
SpringPahranagat & Mt Irish
Arrow CanyonMeadow Valley
DelamarSouth Pahroc/South Hikos
North Hiko
Lambs /100 Ewes
Southern Desert Bighorn Lamb Ratios 2015 or 2014
M. ovi YES M. ovi UNK M. ovi NO

Age Class 2014 2015
Adults 40 280
Lambs 370 430
Total 410 620
Estimated Statewide Bighorn Losses due to Polymicrobial Pneumonia
2014 - 2015

0.0
10.0
20.0
30.0
40.0
50.0
60.0
70.0
80.0
0
50
100
150
200
250
300
350
400
450
500
1981 1984 1987 1990 1993 1996 1999 2002 2005 2008 2011 2014
Lam
b Ra
tio
Herd
Pop
ulat
ion
Estim
ate
McCullough Range, Unit 263
Lamb Ratios Population Estimate
0.0
10.0
20.0
30.0
40.0
50.0
60.0
0
50
100
150
200
250
300
350
400
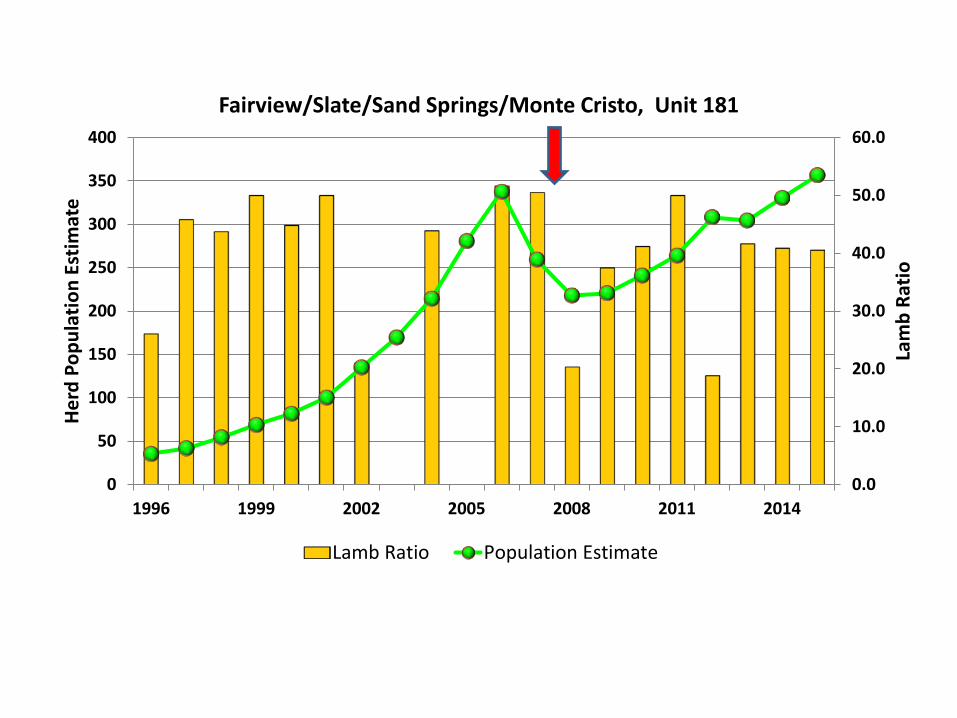
1996 1999 2002 2005 2008 2011 2014
Lam
b Ra
tio
Herd
Pop
ulat
ion
Estim
ate
Fairview/Slate/Sand Springs/Monte Cristo, Unit 181
Lamb Ratio Population Estimate

0.0
10.0
20.0
30.0
40.0
50.0
60.0
70.0
0
50
100
150
200
250
300
350
400
450
500
1975 1978 1981 1984 1987 1990 1993 1996 1999 2002 2005 2008 2011 2014
Lam
b Ra
tio
Her
d Po
pula
tion
Estim
ate
Mormon Mountains, Unit 271
Lamb Ratios Population Estimate

0.0
10.0
20.0
30.0
40.0
50.0
60.0
70.0
0
50
100
150
200
250
300
350
400
1986 1989 1992 1995 1998 2001 2004 2007 2010 2013
Lam
b Ra
tio
Herd
Pop
ulat
ion
Estim
ate
River Mountains, Unit 269
Lamb Ratios Population Estimate Survey Total
0.0
10.0
20.0
30.0
40.0
50.0
60.0
70.0
0
100
200
300
400
500
600
700
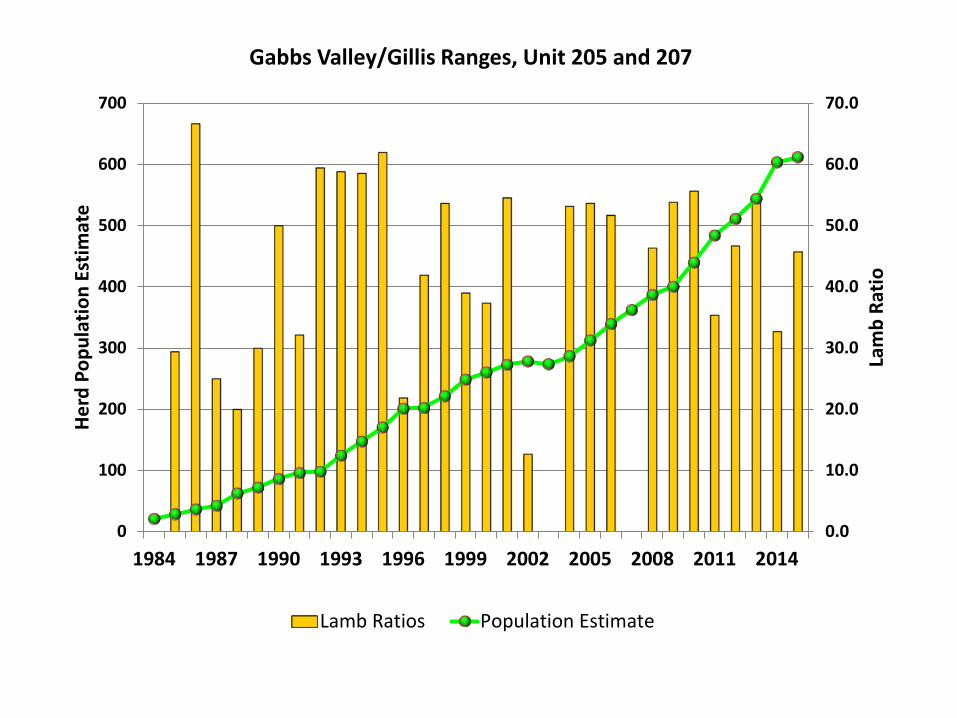
1984 1987 1990 1993 1996 1999 2002 2005 2008 2011 2014
Lam
b Ra
tio
Herd
Pop
ulat
ion
Estim
ate
Gabbs Valley/Gillis Ranges, Unit 205 and 207
Lamb Ratios Population Estimate

0.0
10.0
20.0
30.0
40.0
50.0
60.0
70.0
80.0
90.0
0
100
200
300
400
500
600
700
1980 1983 1986 1989 1992 1995 1998 2001 2004 2007 2010 2013
Lam
b Ra
tio
Herd
Pop
ulat
ion
Estim
ate
Monte Cristo Range, Unit 213
Lamb Ratios Population Estimate