big data for measuring the information society … · 2019-02-27 · for some proposed big data...
TRANSCRIPT

BIG DATA FOR MEASURING THE
INFORMATION SOCIETY
METHODOLOGY
International Telecommunication Union
Geneva 2017
1 / 58
TABLE OF CONTENTS
1. Introduction .............................................................................................................................................. 2
2. Definitions ................................................................................................................................................. 2
3. Processing tiers ......................................................................................................................................... 3
4. Description of the Required Source Data ................................................................................................. 5
5. List of proposed indicators ...................................................................................................................... 12
BD01: Percentage of the Land Area Covered by Mobile‐Cellular Network, by Technology ................... 16
BD02: Percentage of the Population Covered by a Mobile‐Cellular Network, by Technology .............. 18
BD03: Usage of Mobile‐Cellular Networks for non‐IP Related Activities, by Technology ...................... 20
BD04: Usage of Mobile‐Cellular Networks for Internet Access, by Technology ..................................... 23
BD05: Active Subscriptions with Access to Technology .......................................................................... 25
BD06: Active Mobile Voice and Broadband Subscriptions, by Contract Type ........................................ 28
BD07: Average Number of Active Mobile Subscriptions per Day, by Contract Type.............................. 30
BD08: Active Mobile Devices .................................................................................................................. 32
BD09: IMEI Conversion Rate ................................................................................................................... 34
BD10: Fixed‐Broadband Traffic, by Speed, Contract Type ...................................................................... 35
BD11: Domestic mobile‐Broadband Traffic, by Contract Type, Technology .......................................... 37
BD12: International mobile‐Broadband Traffic, by Contract Type ......................................................... 39
BD13: Inbound Roaming Subscriptions per Foreign Tourist ................................................................... 41
BD14: Fixed‐Broadband Subscriptions, by Technology .......................................................................... 42
BD15: Fixed‐Broadband Subscriptions, by Speed ................................................................................... 44
BD16+: Proposed New Indicators from Pilot Countries .......................................................................... 46
Annex 1. Relevant Existing Indicators ......................................................................................................... 47
Indicators Based on Household Surveys ................................................................................................. 47
Indicators from Administrative Data sources ......................................................................................... 51
Mobile‐broadband Internet traffic (outside the country, roaming out) (i136mwo) .............................. 56
References .................................................................................................................................................. 56
2 / 58
1. INTRODUCTION
ITU is the United Nations specialized agency for information and communication technologies. One of
ITU’s roles is to collect and publish global ICT statistics. There are two main sources of official ICT
statistics:
Indicators collected through household surveys – whose methodologies are described in the ITU
Manual for Measuring ICT Access and Use by Households and Individuals, 2014
http://www.itu.int/en/ITU‐D/Statistics/Pages/publications/manual2014.aspx (ITU, 2014a).
Indicators collected through administrative data – whose methodologies are described in the
ITU Handbook for the Collection of Administrative Data on Telecommunications/ICT, 2011
http://www.itu.int/en/ITU‐D/Statistics/Pages/publications/handbook.aspx (ITU, 2011).
The objective of the ITU’s project “Big Data for Measuring the Information Society” is to demonstrate
how Big Data can be used for ICT measurement, that is, how big data can be used to produce new
indicators, and replace or complement existing ICT indicators to enhance data collections, benchmarks
and methodologies for measuring the information society. In practical terms the project seeks to: a)
replace or improve disaggregation of current indicators, b) propose new indicators that would increase
the measurement opportunities for ICT, and c) fill in data gaps.
The current document presents the list of indicators calculated using big data along with the data source
description and the calculation methodology.
Although in most cases the existing indicators cannot be fully and comprehensively replaced by
indicators from new data sources, the proposed indicators are referenced to existing indicators to
indicate how they can complement or replace them.
The possibility of calculating the proposed indicators depends on the availability of the source data, as
well as the capacity of the data providers in each pilot country (resources, legal restrictions, technical
limitations). As a result of these limitations, there might be different sets of indicators calculated in
different countries. However, the methodology for producing each individual indicator should be the
same in each country to allow comparison at the international level.
For some proposed Big Data indicators, reference data are required and these are mentioned in Section
4, together with the data sources for the corresponding indicator.
2. DEFINITIONS
MNO – mobile network operator. This refers to mobile‐cellular operators providing mobile services in
the country. Together with ISPs (see below), they are one of the two data sources for this project.
ISP – Internet service provider.
NSI – national statistical institute (a country’s official statistics agency).
CDR – call detail record. A CDR is produced by a telephone exchange or other telecommunication
equipment that documents the details of each communication transaction that passes through that
3 / 58
facility or device and can be stored centrally by communication providers (e.g. calls, text messages, data
connections).
IPDR – Internet protocol detail record. This is the log record of each transaction to connect to the
Internet via a mobile‐cellular network. It can also be referred to as DDR or xCDR.
CGI – cell global identity. Global unique ID for a mobile‐network antenna.
CI – cell identity. ID to identify a mobile‐network antenna within a given area.
IMSI – international mobile subscriber identity. A unique ID identifying each SIM card.
Subscription – in this document, the term refers to a mobile‐cellular network or fixed Internet
subscription. A subscription does not always correspond to a unique individual, as one person may (for
example) have more than one subscription. For MNOs, a subscription is identified on the basis of the
IMSI, i.e. one unique IMSI code refers to one subscription. For ISPs, a subscription refers to a single
location and the access point of the customer’s connection to the Internet.
IMEI – international mobile station equipment identity. A unique device ID identifying each end‐user
device. Device models can be identified by extracting the initial eight digits from the IMEI code
representing the type allocation code (TAC).
MCC – mobile country code. The initial three digits of the IMSI identifying the country of the SIM card.
LAU (1‐3) – local administrative unit (LAU) levels. These represent the different levels of administrative
division in a country. The maximum level of spatial disaggregation should allow the classification of the
administrative unit as an urban or rural area:
LAU1 – first administrative level (next after the entire country);
LAU2 – second administrative level;
LAU3 – third administrative level. In most cases, this level should allow the classification of the
administrative unit as an urban or rural area.
CRM – customer relationship management database.
SHP – the shapefile format. A geospatial vector data format used in geographic information systems
(GIS).
3. PROCESSING TIERS
For privacy protection reasons, and because the initial raw data can in some contexts be considered to
include confidential business information, there are three tiers or phases of the data that are mentioned
in the calculation methodology. Different processing schemes are proposed on the basis of these tiers.
Tier I – initial, raw, non‐aggregated data extracted by the data providers from their databases
and registries; these are the basis for calculation and could include private and confidential
business information. They can also be referred to as “microdata”. These data will not leave the
premises of the data provider in case where the initial calculation and aggregation are done

4 / 58
within the infrastructure of the data provider. In cases where the initial calculation is done
outside the premises of individual data providers by ITU staff, the local ICT ministry or local NSI,
these data are kept strictly confidential, protected, and not shared with other data providers or
with third parties. Because data providers may often not possess the exact format of the data
required, and/or the data may originate from several different databases, each with their
specific data structures, Tier I can be divided into two phases:
o Tier Ia: Extracted, unformatted and unprocessed raw data native to the structure of the
specific database(s) from which the data were extracted, and which do not correspond
to the specification of initial raw data needed for calculating the specific indicator;
o Tier Ib: Extracted data are cleansed, formatted, merged where necessary, and prepared
in accordance with the specification of the required initial raw data formats, for further
processing;
Tier II – initially aggregated or otherwise processed data, which include no private information
and little or no confidential business information, but which are still considered sensitive and
not to be shared with third parties. They can also be referred to as macrodata. Tier II is the
phase in which data from different data providers are combined. Tier II is always located outside
the premises of the individual data providers, and in most cases within the premises of ITU, and
managed by ITU data specialists.
Tier III – aggregated resulting indicators (macrodata) that can be publicly shared and do not
include any private or confidential business information. Tier III can be divided into two phases:
o Tier IIIa – the basis for the aggregated indicators, the so‐called “data cube” or “data
matrix” from which the individual indicators and breakdowns are calculated;
o Tier IIIb – the actual resulting and publishable indicators.
During the processing of the data, several iterations may be required to move from Tier I to Tier III
because of the differences in Tier I data from different providers and/or errors, biases or other data
issues which may be detected during the processing. It is therefore important that the preparation of
Tier I data follows the description of the initial raw data (microdata) presented in this document.
There are two main options for processing data from different providers (Figure 1 and Figure 2):
1. Extraction of data (Tier I) and processing data up to Tier II is done within the premises of the
data providers and then transmitted to the telecommunication regulator, the ICT ministry, the
NSI or ITU for the purpose of combining the data from several data providers and producing the
final indicators. The initial (raw) data never leave the premises of the data providers in the
country.

5 / 58
Figure 1. Option 1: data are processed up to Tier II within the infrastructure of the data providers before being transmitted to the
telecommunication regulator, ICT ministry, NSI or ITU for further processing.
2. Data are only extracted (Tier I) within the premises of the data providers before being
transmitted to the telecommunication regulator, ICT ministry, NSI or ITU, where they are
processed and combined to produce the final indicators. The initial (raw) data never leave the
country.
Figure 2. Option 2: data are only extracted within the infrastructure of the data providers before being transmitted to the
telecommunication regulator, ICT ministry, NSI or ITU for all data processing.
The processing option depends on the pilot country’s specific situation and is decided together with all
stakeholders. The choice between the two options for processing the data depends on which institution
has suitable infrastructure and expertise for processing Big Data, as well as data protection protocols
specific to each country.
4. DESCRIPTION OF THE REQUIRED SOURCE DATA
The following list describes the source data used in Tier I. This list describes the initial raw data which
data providers have to extract from their internal databases and some minor initial processing for
preparation and formatting of the data required. The initial raw data should not include:
Duplicate records
Empty records or records with NULL values

6 / 58
Incorrect values (e.g. incorrect geographic coordinates of an antenna)
Records outside the pilot data observation period.
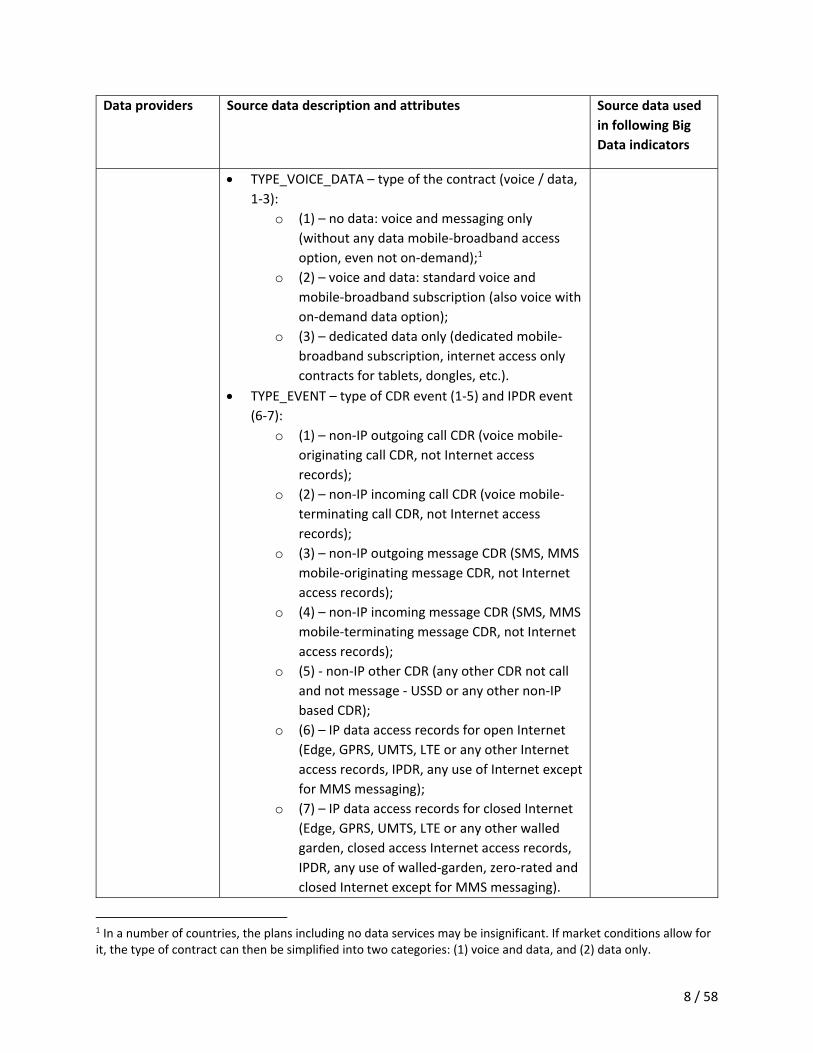
Table 1 lists all the necessary attributes for the Big Data indicators proposed in this document. If some
attributes are not stored by the data providers, are too difficult to obtain, or require a disproportionate
amount of work compared to the value of the indicator, then these attributes can be omitted and the
specific indicator will then not be calculated. If some indicators are considered not important, then the
corresponding source data can also be omitted. Ideally, all indicators should be calculated, but given the
constraints on resources and time, priority should be given to the most important indicators that are
deemed necessary by the country stakeholders.
The names of the source data and attributes are provided in capital letters (e.g. CELL_ID) and used later
as such in the description and methodology of the specific indicators (Table 1).
Table 1. Source data (from MNOs and ISPs) and reference data required in the project.
Data providers Source data description and attributes Source data used
in following Big
Data indicators
MNO NETWORK
DATA
Network antennas geographical coverage:
CELL_ID – unique ID of the antenna (cell) in mobile
networks. This can refer to CGI (Cell Global Identity) or
another unique ID up to and including the precision of
CI (Cell Identity).
TECH_GEN – technology generation, options:
o 2G;
o 3G;
o LTE/WiMAX and above.
LAT – latitude coordinate of the antenna.
LON – longitude coordinate of the antenna.
CELL_GEOM – coverage area of the mobile network
antenna / cell. This should be a vector polygon. For
every CELL_ID there must be a geographic coverage
area, so best server maps (for example) are not suitable
(they exclude some cells that are overshadowed by
more powerful antennas).
Such data can usually be retrieved from the operations
support system (OSS) database.
BD01
BD02
BD03
BD04
BD05
BD06
BD07
BD08
BD11
MNO CDR/IPDR
DATA
Mobile‐cellular network usage log records of:
domestic subscriptions (CDRs, IPDRs) for domestic
service;
BD03
BD04

7 / 58
Data providers Source data description and attributes Source data used
in following Big
Data indicators
domestic subscriptions (CDRs, IPDRs) for outbound
roaming service;
inbound roaming subscriptions (CDRs, IPDRs) for
inbound roaming service.
These data should be combined with available CRM
(Customer Relationship Management) data (contract types,
demographics) and include all records individually for
incoming and outgoing voice CDRs, incoming and outgoing
messaging CDRs (SMS, MMS), and Internet traffic detail
records (IPDR). Each event (usage log) should be a separate
individual record (e.g. one outgoing call is one record with
attributes). Concerning the IPDR – the access to Internet
should include access to broader public Internet (open
Internet) and walled garden (closed Internet, limited access
to walled‐garden or zero‐rated content) and distinguished
by this type if possible. The observation period should be
that of the project.
ID – unique subscription ID (unidentifiable hashed code
based on IMSI).
SOC_DEM – known and available socio‐demographic
attributes for the subscriber such as:
o GENDER:
(M) – male;
(F) – female;
(0) – unknown.
o AGE (age in years, 0 – unknown);
o LANG – preferred language (EN, etc.; 0 –
unknown).
IMEI – International Mobile Station Equipment Identity
of the device.
TYPE_COMMERCIAL_PRIVATE – type of the contract
(residential / non‐residential, 1‐2):
o (1) – residential;
o (2) – non‐ residential.
TYPE_PRE_PST – type of SIM card (1‐2):
o (1) – prepaid;
o (2) – postpaid.
BD05
BD06
BD07
BD08
BD09
BD11
BD12
BD13
8 / 58
Data providers Source data description and attributes Source data used
in following Big
Data indicators
TYPE_VOICE_DATA – type of the contract (voice / data,
1‐3):
o (1) – no data: voice and messaging only
(without any data mobile‐broadband access
option, even not on‐demand);1
o (2) – voice and data: standard voice and
mobile‐broadband subscription (also voice with
on‐demand data option);
o (3) – dedicated data only (dedicated mobile‐
broadband subscription, internet access only
contracts for tablets, dongles, etc.).
TYPE_EVENT – type of CDR event (1‐5) and IPDR event
(6‐7):
o (1) – non‐IP outgoing call CDR (voice mobile‐
originating call CDR, not Internet access
records);
o (2) – non‐IP incoming call CDR (voice mobile‐
terminating call CDR, not Internet access
records);
o (3) – non‐IP outgoing message CDR (SMS, MMS
mobile‐originating message CDR, not Internet
access records);
o (4) – non‐IP incoming message CDR (SMS, MMS
mobile‐terminating message CDR, not Internet
access records);
o (5) ‐ non‐IP other CDR (any other CDR not call
and not message ‐ USSD or any other non‐IP
based CDR);
o (6) – IP data access records for open Internet
(Edge, GPRS, UMTS, LTE or any other Internet
access records, IPDR, any use of Internet except
for MMS messaging);
o (7) – IP data access records for closed Internet
(Edge, GPRS, UMTS, LTE or any other walled
garden, closed access Internet access records,
IPDR, any use of walled‐garden, zero‐rated and
closed Internet except for MMS messaging).
1 In a number of countries, the plans including no data services may be insignificant. If market conditions allow for it, the type of contract can then be simplified into two categories: (1) voice and data, and (2) data only.

9 / 58
Data providers Source data description and attributes Source data used
in following Big
Data indicators
DATETIME – start date and time of CDR/IPDR
(timestamp in UTC).
DURATION – duration of the event (in seconds from the
initiation to termination).
TYPE_DOMESTIC_OUTBOUND_INBOUND – form of the
data record (domestic, inbound roaming, outbound
roaming, 1‐3):
o (1) – domestic;
o (2) – inbound roaming;
o (3) – outbound roaming.
MCC – Mobile Country Code, country of origin of the
SIM card. MCC is based on the IMSI code and has to be
extracted prior to anonymization of the IMSI to ID.
CELL_ID – reference to initialisation antenna ID (only
for domestic and inbound roaming records).
DATA_VOLUME – traffic volume in bytes transmitted
during the connection (for data only – upload +
download).
ISP DATA Fixed‐broadband Internet access log records along with
CRM data. Access to the Internet should include access to
the broader public Internet (open Internet) and walled
garden (closed Internet, limited access to walled‐garden or
zero‐rated content) and distinguish by this type if possible.
The observation period of the data should be that of the
project.
ID – unique subscription / customer ID. This ID refers to
a single location where the customer has broadband
Internet connection. If one customer has contracted
several locations, then each location is a separate ID
(mostly applicable for non‐residential contracts). This
code can be based on the address of the access point;
TYPE_COMMERCIAL_PRIVATE – type of the contract
(private / commercial, 1‐2):
o (1) – residential;
o (2) – non‐residential.
TYPE_TECHNOLOGY – type of the broadband
technology:
o (1) – cable modem Internet subscriptions;
BD10
BD14
BD15
10 / 58
Data providers Source data description and attributes Source data used
in following Big
Data indicators
o (2) – DSL Internet subscriptions;
o (3) – fibre‐to‐the‐home/building Internet
subscriptions;
o (4) – other fixed (wired)‐broadband
subscriptions;
o (5) – satellite broadband subscriptions;
o (6) – fixed wireless broadband subscriptions.
TYPE_SPEED – type of the contract – maximum
(advertised) download speed:
o (1) – 256 Kbps to less than 2 Mbps
subscriptions;
o (2) – 2 Mbps to less than 10 Mbps
subscriptions;
o (3) – 10 Mbps to less than 100 Mbps
subscriptions;
o (4) – 100 Mbps to less than 1 Gbps
subscriptions;
o (5) – above 1 Gbps subscriptions.
TYPE_IP_ACCESS – access to open or closed Internet:
o (1) – IP data access records for open Internet;
o (2) – IP data access records for closed Internet
(walled garden, zero rated, closed access).
LAU3_CODE – geographical location of the customer /
service.
DATETIME – start date and time of the Internet access
session (timestamp in UTC).
DURATION – duration of Internet access session (in
seconds from the initiation to termination).
DATA_VOLUME – traffic volume in bytes transmitted
during the connection (upload + download).
NSI REF DATA
ADMIN
Land area maps in vector format where the land area
topography for each LAU level and area (in km2) can be
derived. The number of LAU levels is defined by what is the
highest LAU level that includes distinction of the
administrative unit by urban and rural type. If urban and
rural distinction is stated in level 3 (LAU3), then three
different shapefiles (SHP) should be provided. If the
distinction is on level 4, then four SHP files should be
BD01
BD02
BD03
BD04
BD05
11 / 58
Data providers Source data description and attributes Source data used
in following Big
Data indicators
provided, etc. The files should have the following attributes
(including the geometry feature):
LAU1.SHP – full geographic level 1 administrative units
as (multi‐)polygons with following feature attributes:
o LAU1_CODE – administrative unit code; o NAME – administrative unit name; o POP_CNT – population count;
o LAU_GEOM – geometry polygon of the
administrative unit (feature, not an attribute).
LAU2.SHP – full geographic level 2 administrative units
as (multi‐)polygons with following feature attributes:
o LAU2_CODE – administrative unit code; o NAME – administrative unit name; o PARENT_CODE – parent administrative unit
code; o POP_CNT – population count; o LAU_GEOM – geometry polygon of the
administrative unit (feature, not an attribute).
Any additional level follows the same structure as
LAU2.SHP. LAU3.SHP (or the lowest level where urban/rural
distinction is defined): o LAU3_CODE – administrative unit code; o NAME – administrative unit name; o PARENT_CODE – parent administrative unit
code; o TYPE_URBAN_RURAL (1‐2):
(1) – urban; (2) – rural.
o POP_CNT – population count; o AREA – area of the administrative unit in km2. o LAU_GEOM – geometry polygon of the
administrative unit (feature, not an attribute).
BD06
BD07
BD10
BD11
BD14
BD15
NSI REF DATA SQ
KM POP
1 square kilometre grid of population. This SHP format file
should include following attributes (besides geometry):
GRID_ID – Unique ID code of the grid;
POP_CNT – population count;
BD02
12 / 58
Data providers Source data description and attributes Source data used
in following Big
Data indicators
GRID_GEOM – geometry polygon of the grid cell
(feature, not an attribute).
If the NSI does not have the 1 km grid layer with
population data, ITU can provide an “empty” grid with
geometry features that can be used to combine with
population census address (point) based data or other
population database using geometry functions.
NSI REF DATA
ACCOMMODATED
TOURISTS
A quarterly number of foreign tourists visiting /
accommodated in the country. For the pilot project, this is
simply one number indicating the total number of
foreigners visiting the country. For the pilot project, this
number should indicate the total number of foreigners in
the period covered:
MONTH;
FOR_ACCOM – the total number of accommodated
tourists in a country.
BD13
TAC DATA – Other
sources (GSMA)
Type allocation code (TAC) code list associated with the
device manufacturers and models:
TAC –can be extracted from the IMEI code;
MANUFACTURER – Device manufacturer (e.g. Apple);
MODEL – Device model (e.g. iPhone6);
DEVICE_TYPE – Device class (e.g. Smartphone, feature
phone, modem, etc.).
The TAC database is managed and updated by GSMA and is
available at
https://www.gsma.com/managedservices/device‐model‐
characteristics/about‐gsma‐tac‐check/.
BD08
5. LIST OF PROPOSED INDICATORS
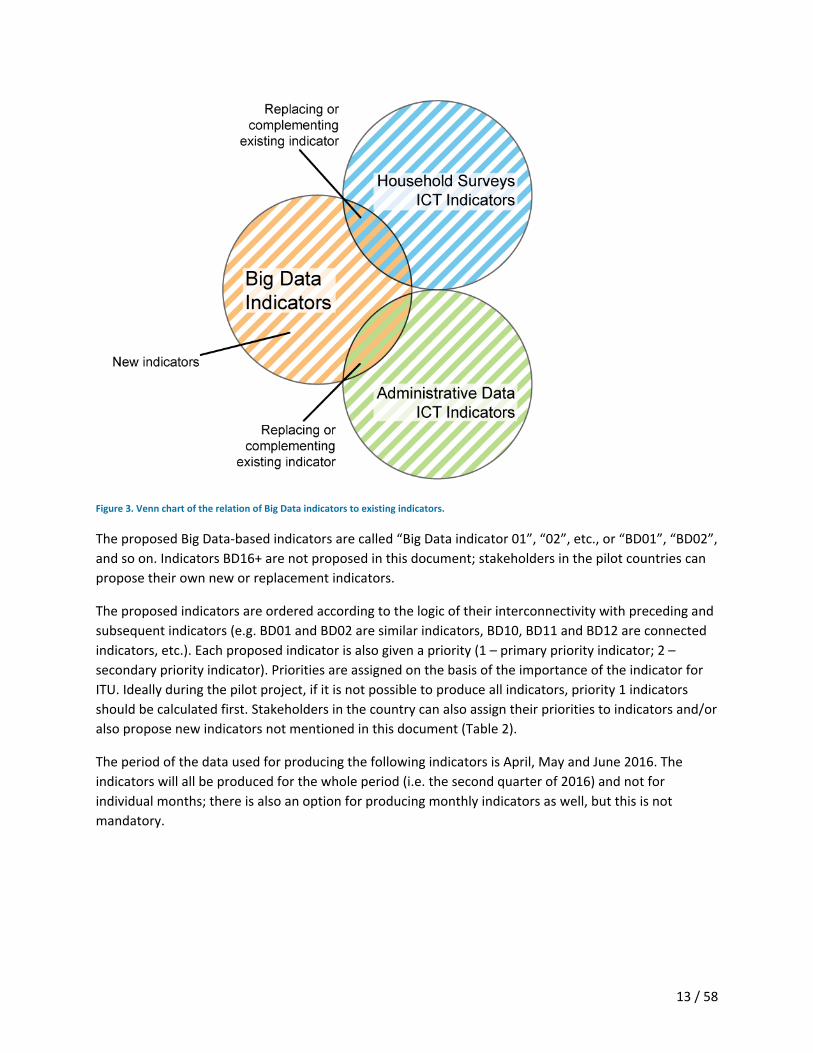
The following proposed indicators can be classified in terms of three options – replacing or
complementing household survey or administrative data, and new indicators. The colours used in the
following illustration are also used to indicate whether the proposed Big Data indicator is a
replacing/complementing indicator or a brand new indicator.
13 / 58
Figure 3. Venn chart of the relation of Big Data indicators to existing indicators.
The proposed Big Data‐based indicators are called “Big Data indicator 01”, “02”, etc., or “BD01”, “BD02”,
and so on. Indicators BD16+ are not proposed in this document; stakeholders in the pilot countries can
propose their own new or replacement indicators.
The proposed indicators are ordered according to the logic of their interconnectivity with preceding and
subsequent indicators (e.g. BD01 and BD02 are similar indicators, BD10, BD11 and BD12 are connected
indicators, etc.). Each proposed indicator is also given a priority (1 – primary priority indicator; 2 –
secondary priority indicator). Priorities are assigned on the basis of the importance of the indicator for
ITU. Ideally during the pilot project, if it is not possible to produce all indicators, priority 1 indicators
should be calculated first. Stakeholders in the country can also assign their priorities to indicators and/or
also propose new indicators not mentioned in this document (Table 2).
The period of the data used for producing the following indicators is April, May and June 2016. The
indicators will all be produced for the whole period (i.e. the second quarter of 2016) and not for
individual months; there is also an option for producing monthly indicators as well, but this is not
mandatory.
14 / 58
Table 2. List of proposed Big Data indicators to be calculated in this project.
Big Data indicator Relation to existing indicators ITU priority No.
BD01: Percentage of the Land Area
Covered by A Mobile‐Cellular
Network, by Technology
This indicator is associated with
Percentage of the land area covered
by mobile‐cellular network
(i271Land).
2
BD02: Percentage of the
Population Covered by a Mobile‐
Cellular Network, by Technology
This indicator is associated with the
Percentage of the population
covered by a mobile‐cellular network
(i271pop) and Percentage of the
population covered by at least a 3G
mobile network (i271G).
1
BD03: Usage of Mobile‐Cellular
Networks for non‐IP‐Related
Activities, by Technology
This indicator is not associated with
any existing indicators. This indicator
provides insights into the actual
usage of mobile technology for
mobile voice and messaging.
2
BD04: Usage of Mobile‐Cellular
Networks for Internet Access,
by Technology
This indicator is not associated with
any existing indicators. This indicator
provides insights into the actual
usage of mobile technology for
Internet access.
1
BD05: Active Subscriptions with
Access to Technology
This indicator is not associated with
any existing indicators. This indicator
provides insights into the actual
access to each mobile‐cellular
technology.
1
BD06: Active Mobile Voice and
Broadband Subscriptions, by
Contract Type
This indicator is associated with
Active mobile‐broadband
subscriptions (i271mw).
2
BD07: Average Number of Active
Mobile Subscriptions per Day, by
Contract Type
This is a new indicator describing the
average number of active mobile
subscriptions per day.
2
BD08: Active Mobile Devices This indicator is associated with
indicators Indicator HH10: Proportion
of individuals using a mobile cellular
telephone, and Indicator HH18:
1
15 / 58
Big Data indicator Relation to existing indicators ITU priority No.
Proportion of individuals who own a
mobile phone, however, this
indicator does not provide the
number or proportion of individuals,
but the number of devices.
BD09: IMEI Conversion Rate This indicator is not associated with
any existing indicators.
2
BD10: Fixed‐Broadband Traffic, by
Speed, Contract Type
This indicator is associated with the
indicator Fixed‐broadband Internet
traffic (exabytes) (i135tfb).
1
BD11: Domestic mobile‐Broadband
Traffic, by Contract Type,
Technology
This indicator is associated with the
indicator Mobile‐broadband Internet
traffic (within the country)
(i136mwi).
1
BD12: International mobile‐
Broadband Traffic, by Contract
Type
This indicator is associated with
indicator Mobile‐broadband Internet
traffic (outside the country, roaming
out) (i136mwo).
1
BD13: Inbound Roaming
Subscriptions per Foreign Tourist
This indicator is slightly related to the
indicator "Roaming by foreign
subscribers (inbound roaming), in
minutes" but reflects the proportion
of foreign subscribers using inbound
roaming services compared to the
number of tourists visiting the
country.
2
BD14: Fixed‐Broadband
Subscriptions, by Technology
This indicator is associated with the
indicator "Fixed‐broadband
subscriptions (i4213tfbb), by
technology".
2
BD15: Fixed‐Broadband
Subscriptions, by Speed
This indicator is associated with the
indicator "Fixed‐broadband
subscriptions (i4213tfbb), by speed".
1
BD16+: Proposed New Indicators
from Pilot Countries
These are proposed new indicators
by the stakeholders from the pilot
countries that are not foreseen by
16 / 58
Big Data indicator Relation to existing indicators ITU priority No.
ITU. Each country may suggest some
indicators that are relevant in the
local context.
The list of existing indicators that are relevant to this project is provided in the annex.
BD01: PERCENTAGE OF THE LAND AREA COVERED BY A MOBILE‐CELLULAR NETWORK, BY
TECHNOLOGY
ITU Priority No. 2
This indicator is associated with the Percentage of the land area covered by mobile‐cellular network
(i271Land). This indicator relates to MNOs.
This indicator is an extension of the official indicator with the aim of more in‐depth geographical and
technological breakdowns. The indicator should provide an understanding of access and spread of the
mobile technology in different parts of the country. The resulting indicator should refer to the mobile‐
cellular coverage expressed as a percentage of the total land area.
For reasons of simplicity, the classification of the technology should be currently limited to three
different generations of wireless mobile telecommunications technology (2G, 3G, LTE/WiMAX) and their
technical relatives (e.g. 3.5G = 3G, EDGE=2G, LTE‐Advanced = LTE).
The source data do not include any private data of the subscribers, but may include confidential and
sensitive business information about the coverage areas of the network which should not be disclosed
to competitor MNOs.
REQUIRED SOURCE DATA
MNO NETWORK DATA;
NSI REF DATA ADMIN – Land area maps in vector format.
See detailed description of the source data in Description of the Required Source Data.
CALCULATION METHODOLOGY
1. Tier I: Extract coverage area data from appropriate database (OSS) including all currently active
antennas. If the coverage areas of the network antennas are not provided by the MNOs
(CELL_GEOM), probabilistic coverage areas should be created for each antenna. The
probabilistic coverage area calculation should be implemented in the same way by all providers
(unless they provide actual coverage areas).
17 / 58
2. Tier II: Using NSI REF DATA ADMIN, crop the antenna coverage areas by lowest LAU level – LAU3
(or LAU2) administrative borders and combine the resulting coverage areas by technology. The
result is a table with the following attributes:
a. LAU3_CODE;
b. TYPE_URBAN_RURAL;
c. TECH_GEN;
d. AREA_COVERAGE – area (in km2) based on the topology (combined area of coverage of
the antennas using a given technology in the respective LAU3 administrative unit);
e. AREA_LAU – total area of the specific LAU unit;
f. RESULT_GEOM – resulting topology (combined vector polygons or raster of the
coverage of the antennas using a given technology in the respective administrative
unit).
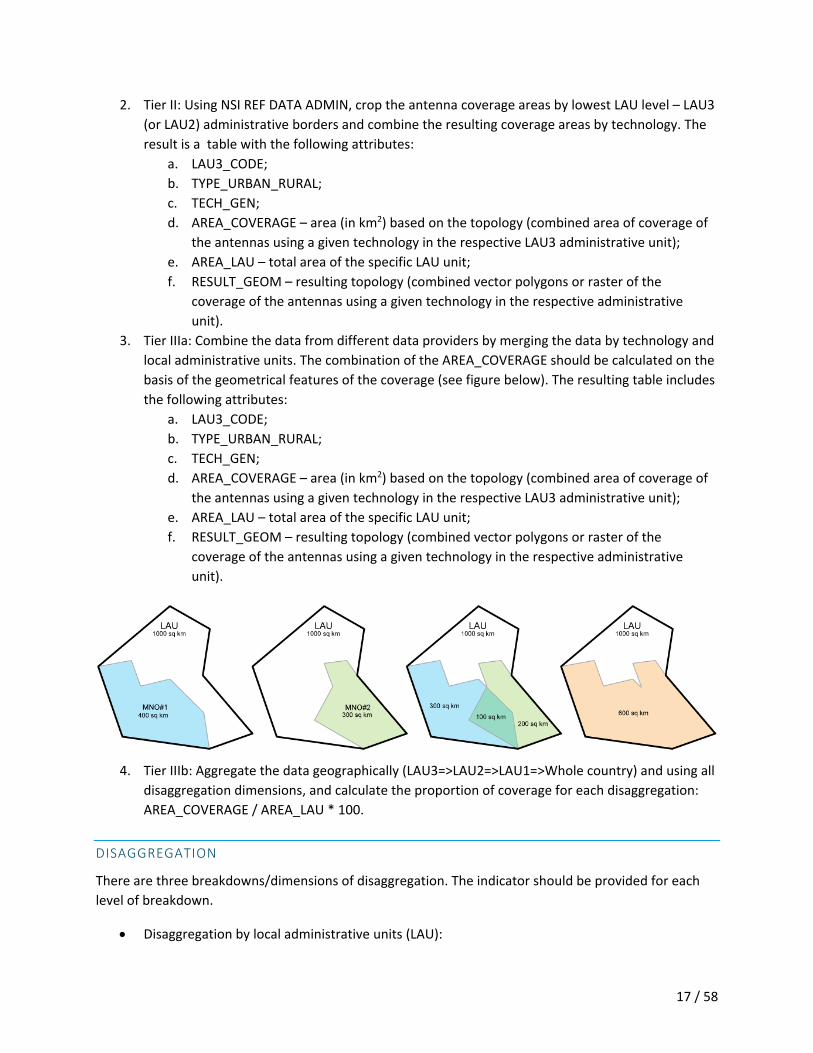
3. Tier IIIa: Combine the data from different data providers by merging the data by technology and
local administrative units. The combination of the AREA_COVERAGE should be calculated on the
basis of the geometrical features of the coverage (see figure below). The resulting table includes
the following attributes:
a. LAU3_CODE;
b. TYPE_URBAN_RURAL;
c. TECH_GEN;
d. AREA_COVERAGE – area (in km2) based on the topology (combined area of coverage of
the antennas using a given technology in the respective LAU3 administrative unit);
e. AREA_LAU – total area of the specific LAU unit;
f. RESULT_GEOM – resulting topology (combined vector polygons or raster of the
coverage of the antennas using a given technology in the respective administrative
unit).
4. Tier IIIb: Aggregate the data geographically (LAU3=>LAU2=>LAU1=>Whole country) and using all
disaggregation dimensions, and calculate the proportion of coverage for each disaggregation:
AREA_COVERAGE / AREA_LAU * 100.
DISAGGREGATION
There are three breakdowns/dimensions of disaggregation. The indicator should be provided for each
level of breakdown.
Disaggregation by local administrative units (LAU):

18 / 58
o Whole country;
o LAU1 level (first level administrative level units);
o LAU2 level (second level administrative level units);
o LAU3 level (third level administrative level units);
Disaggregation by urban and rural areas;
Disaggregation by technology (2G, 3G, LTE).
EXPECTED RESULTS: AN EXAMPLE
Percentage of the land area coverage by network (the indicators are illustrative):
Whole country; urban and rural; all technologies: 95.4%;
Whole country; urban and rural; LTE technology only: 27.5%;
Whole country; urban only; all technologies: 99.1%;
Whole country; rural only; 2G technology only: 86.5%;
LAU1 level, specific administrative unit; urban only; 3G technology only: 46.5%;
LAU2 level, specific administrative unit; rural only; LTE technology only: 12.4%;
etc.
This indicator can also be represented as a map.
BD02: PERCENTAGE OF THE POPULATION COVERED BY A MOBILE‐CELLULAR NETWORK, BY
TECHNOLOGY
ITU Priority No. 1
This indicator is associated with Percentage of the population covered by a mobile‐cellular network
(i271pop) and Percentage of the population covered by at least a 3G mobile network (i271G). It relates
to MNOs and is part of the global indicator framework agreed by the United Nations Statistical
Commission for the Sustainable Development Goals (SDGs).
This indicator is an extension of the official indicator and is intended to allow more in‐depth
geographical and technological breakdowns. The indicator should facilitate an understanding of
accessibility and spread of mobile technology in different parts of the country. The resulting indicator
should refer to the percentage of the total population of a specific area within range of a mobile‐cellular
signal. This is an extension of the previous indicator (BD01) on land area coverage and it is proposed that
it should be calculated together with it by including the population calculation in the algorithm. The
source data and the calculation methodology are basically the same.
The source data do not include any private data of the subscribers, but may include confidential and
sensitive business information about the coverage areas of the network which should not be disclosed
to competitor MNOs.
REQUIRED SOURCE DATA
19 / 58
MNO NETWORK DATA;
NSI REF DATA ADMIN – land area maps in vector format;
NSI REF DATA SQ KM POP – 1 square kilometre grid of population.
See detailed description of the source data in Description of the Required Source Data.
CALCULATION METHODOLOGY
1. Tier I: Extract coverage area data from appropriate database (OSS) including all currently active
antennas. If the coverage areas of the network antennas are not provided by the MNOs
(CELL_GEOM), probabilistic coverage areas should be created for each antenna. The
probabilistic coverage area calculation should be implemented in the same way by all providers
(unless they provide actual coverage areas).
2. Tier IIa: For each antenna, identify the population grids that are at least 50 per cent covered by
the coverage area of the antenna, which results in the following attributes (potentially resulting
in several rows with the same CELL_ID, TECH_GEN, but different GRID_ID – one CELL_ID to many
GRID_ID’s):
a. CELL_ID;
b. TECH_GEN;
c. GRID_ID;
d. POP_CNT;
e. GRID_GEOM – geometry polygon of the grid cell.
3. Tier IIb: To aggregate all possible TECH_GEN in all grids, the data should be grouped by GRID_ID,
TECH_GEN and GRID_GEOM, resulting in the table where GRID_ID’s that are within the coverage
areas of each unique technology generations.2 This table includes the following attributes:
a. GRID_ID;
b. TECH_GEN;
c. POP_CNT;
d. GRID_GEOM – geometry polygon of the grid cell.
4. Tier IIc: Combine the results to administrative units LAU3 level using the grid’s geometric
centroid to allocate them in specific LAU3 units and using data from NSI REF DATA ADMIN.3
Table should be grouped by LAU3_CODE, TYPE_URBAN_RURAL and sum of population count
(POP_CNT) from grid and compared with the POP_CNT_LAU which is the population count of
the specific LAU3_UNIT from lookup table. The resulting table includes the following attributes:
a. LAU3_CODE;
b. TYPE_URBAN_RURAL;
c. TECH_GEN;
d. POP_CNT_GRID – sum of the population count from grids that are covered by the
network antennas;
2 An example of SQL query for this step would be: SELECT GRID_ID, TECH_GEN, POP_CNT, GRID_GEOM FROM DATA_TABLE GROUP BY GRID_ID, TECH_GEN, POP_CNT, GRID_GEOM. This step eliminates CELL_ID and leaves all grids with 2G, 3G and/or LTE TECH_GEN. 3 This can be done on the basis of GRID_ID by joining it with a lookup table in which each GRID_ID is linked to the corresponding LAU3 unit.
20 / 58
e. POP_CNT_LAU – total population count from the specific LAU3 unit.
5. Tier IIIa: Combine the data from different data providers by aggregating the data by technology
and local administrative units. The combination of the POP_CNT_LAU should be calculated on
the basis of the geometric features of the grid – the total population covered can only be equal
to or less than 100 per cent of the total population in the administrative unit. The resulting table
includes the following attributes:
a. LAU3_CODE;
b. TYPE_URBAN_RURAL;
c. TECH_GEN;
d. POP_CNT_GRID – sum of the population count from grids that are covered by the
network antennas;
e. POP_CNT_LAU – total population count from the specific LAU3 unit.
6. Tier IIIb: Aggregate the data geographically (LAU3=>LAU2=>LAU1=>Whole country) and using all
disaggregation dimensions, and calculate the proportion of population for each disaggregation:
POP_CNT_GRID / POP_CNT_LAU * 100.
DISAGGREGATION
There are three breakdowns/dimensions of disaggregation. The indicator should be provided for each
level of breakdown.
Disaggregation by local administrative units (LAU):
o Whole country;
o LAU1 level (first level administrative level units);
o LAU2 level (second level administrative level units);
o LAU3 level (third level administrative level units);
Disaggregation by urban and rural areas;
Disaggregation by technology (2G, 3G, LTE).
EXPECTED RESULTS: AN EXAMPLE
Percentage of the population coverage by network (the indicators are illustrative):
Whole country; urban and rural; all technologies: 95.4%;
Whole country; urban and rural; LTE technology only: 27.5%;
Whole country; urban only; all technologies: 99.1%;
Whole country; rural only; 2G technology only: 86.5%;
LAU1 level, specific administrative unit; urban only; 3G technology only: 46.5%;
LAU2 level, specific administrative unit; rural only; LTE technology only: 12.4%;
etc.
This indicator can also be represented as a map.
BD03: USAGE OF MOBILE‐CELLULAR NETWORKS FOR NON‐IP‐RELATED ACTIVITIES, BY
TECHNOLOGY
21 / 58
ITU Priority No. 2
This indicator provides an insight into the actual usage of mobile technology for voice calls and
messaging. It relates to MNOs. There is no associated official indicator, so it can be regarded as a new
ICT indicator.
The indicator should facilitate an understanding of the actual usage of mobile technology in different
parts of the country for making and receiving mobile calls and messages. Usage is defined as the number
of connections made between the device and the network – e.g. one outgoing call in a 2G network is an
instance of the usage of 2G networks, one incoming SMS via a 3G network is an instance of the usage of
3G networks.4 The resulting indicator should refer to the usage share of the specific technology
compared to the total usage of all generations of mobile technologies (e.g. the usage share of 2G
technology in the specific region divided by the total usage of all technologies in the specific region).
The indicator is calculated on the basis of different types of Call Detail Records (CDR) including incoming
and outgoing voice CDRs, and incoming and outgoing messaging CDRs (SMS, MMS and other). Internet
access and usage are excluded in this indicator. For reasons of simplicity, all the aforementioned
activities will be considered simply as instances of mobile‐cellular network usage and divided into two
technology types (2G, 3G).5
The source data might include some private data of the subscribers which can be removed in Tier I in
Tier I (no need for subscriber ID). In addition, they may include confidential and sensitive business
information about the coverage areas of the network and usage statistics, which should not be disclosed
to competing MNOs.
REQUIRED SOURCE DATA
MNO NETWORK DATA;
MNO CDR DATA – domestic CDRs only (inbound and outbound roaming are excluded, IPDRs are
excluded):
o DATETIME;
o CELL_ID;
NSI REF DATA ADMIN – Land area maps in vector format.
See detailed description of the source data in Description of the Required Source Data.
CALCULATION METHODOLOGY
4 All calls are counted equally, irrespective of their duration. In order to exclude unintended or erroneous calls, data may be filtered to exclude calls of very short duration (e.g. five seconds or less). 5 It is assumed that the LTE network is not used for voice and SMS services. If this changes in the future as a result of the adoption of voice over LTE, for instance, then LTE should be also considered together with 2G and 3G.
22 / 58
1. Tier I: Extract MNO CDR DATA from data warehouse and network antennas location data (from
OSS) including all currently active antennas.
2. Tier II: Combine the CDR data, the network antenna data, and distribute to lowest local
administrative units (LAU3) using NSI REF DATA ADMIN:
a. LAU3_CODE;
b. TYPE_URBAN_RURAL (1‐2);
c. TECH_GEN (2G, 3G);
d. COUNT_MNO_X – count of the number of all CDR of the specific technology
(TECH_GEN) class in the specific LAU unit and the given urban/rural classification for a
single data provider;
e. COUNT_TOTAL_MNO_X – count of the number of all CDR in the specific LAU unit and
the given urban/rural classification for a single data provider.
3. Tier IIIa: Combine the data from different data providers by summarizing the data by technology
and local administrative units. The resulting table includes the following attributes:
a. LAU3_CODE;
b. TYPE_URBAN_RURAL (1‐2);
c. TECH_GEN (2G, 3G);
d. COUNT – count of the number of all CDR of the specific technology (TECH_GEN) class in
the specific LAU unit and the given urban/rural classification from all data providers;
e. COUNT_TOTAL – count of the number of all CDR in the specific LAU and the given
urban/rural classification unit from all data providers.
4. Tier IIIb: Calculate individual indicators with breakdowns. Aggregate the data geographically
(LAU3=>LAU2=>LAU1=>Whole country):
a. LAU3_CODE / LAU2_CODE / LAU1_CODE / Whole country;
b. TYPE_URBAN_RURAL (1‐2);
c. TECH_GEN (2G, 3G);
d. PROPORTION – (COUNT_TECH_GEN / COUNT_TOTAL * 100), the percentage value of
the subscriptions that have accessed the technology (TECH_GEN) out of all subscriptions
in the specific LAU unit and the given urban/rural classification from all data providers.
DISAGGREGATION
There are three breakdowns/dimensions of disaggregation. The indicator should be provided for each
level of breakdown.
Disaggregation by technology (2G, 3G)
Disaggregation by local administrative units (LAU):
o Whole country
o LAU1 level (first level administrative level units)
o LAU2 level (second level administrative level units)
o LAU3 level (third level administrative level units)
Disaggregation by urban and rural areas
EXPECTED RESULTS: AN EXAMPLE
23 / 58
Use of a given technology as a percentage of all technologies used (the indicators are illustrative):
Whole country; urban and rural; 2G: 56.4%
Whole country; urban and rural; 3G: 43.6%
Whole country; rural only; 2G: 85.3%
Whole country; rural only; 3G: 14.7%
LAU1 level, specific administrative unit; urban only; 2G: 46.0%
LAU1 level, specific administrative unit; urban only; 3G: 54.0%
etc.
BD04: USAGE OF MOBILE‐CELLULAR NETWORKS FOR INTERNET ACCESS, BY TECHNOLOGY
ITU Priority No. 1
This indicator provides an insight into the actual usage of mobile technology for Internet access. Access
to Internet should include access to broader public Internet (open Internet) and “walled garden” access
(closed Internet, zero‐rated, and limited access to walled‐garden content) and should distinguish by this
type if possible (TYPE_EVENT 6 – open Internet; 7 – closed Internet).
Usage is defined as the number of connections made between the device and the network. For example,
one access to the Internet via a 2G network is an instance of 2G network usage, one access to the
Internet via an LTE network is an instance of LTE network usage. This indicator is applied to MNOs. There
is no associated official indicator, so this can be regarded as a new ICT indicator.
This indicator is similar to indicator BD03: Usage of Mobile‐Cellular Networks for non‐IP‐Related
Activities, by Technology, except that BD03 is limited to non‐IP usage (calls, messaging) while BD04 is
limited to Internet usage (no voice or messaging, only Internet access via IP). The indicator should
provide an understanding of actual usage of mobile technology for accessing the Internet in different
parts of the country. The resulting indicator should refer to the usage share of the specific technology
for accessing the Internet compared to the total usage of all generations of wireless mobile
telecommunications technology (e.g. the usage share of 2G technology in a given region divided by the
total usage in that region of all technologies for accessing the Internet).
The indicator is calculated on the basis of Internet traffic detail records (IPDR). In the interests of
simplicity, all the aforementioned activities will be considered simply as mobile‐cellular network usage
facts and divided into three technology types (2G, 3G and LTE).
The source data could include some private data on subscribers which can be removed in Tier I (no need
for ID of the subscriptions). In addition, they may include confidential and sensitive business information
about the coverage areas of the network, as well as usage statistics, which should not be disclosed to
competing MNOs.
REQUIRED SOURCE DATA
24 / 58
MNO NETWORK DATA
MNO IPDR DATA – domestic data only, IPDRs only:
o DATETIME
o TYPE_EVENT
o CELL_ID
NSI REF DATA ADMIN – Land area maps in vector format.
See detailed description of the source data in Description of the Required Source Data.
CALCULATION METHODOLOGY
1. Tier I: Extract MNO IPDR DATA (IPDR only) from data warehouse and network antennas location
data (from OSS) including all currently active antennas.
2. Tier II: Combine the IPDR data, the network antenna data, and distribute to lowest local
administrative units (LAU3) using NSI REF DATA ADMIN:
a. LAU3_CODE;
b. TYPE_URBAN_RURAL (1‐2);
c. TECH_GEN (2G, 3G, LTE);
d. TYPE_EVENT (6‐7);
e. COUNT – count of the number of all IPDR of the specific technology (TECH_GEN) class in
the specific LAU unit.
3. Tier IIIa: Combine the data from different data providers by summarizing the data by technology
and local administrative units. The resulting table includes the following attributes:
a. LAU3_CODE;
b. TYPE_URBAN_RURAL (1‐2);
c. TECH_GEN (2G, 3G, LTE);
d. TYPE_EVENT (6‐7);
e. COUNT – count of the number of all IPDR of the specific technology (TECH_GEN) class in
the specific LAU unit and the specific urban/rural type from all data providers;
f. COUNT_TOTAL – count of the number of all IPDR in the specific LAU unit and the specific
urban/rural type from all data providers.
4. Tier IIIb: Calculate individual indicators with breakdowns. Aggregate the data geographically
(LAU3=>LAU2=>LAU1=>Whole country):
a. LAU3_CODE / LAU2_CODE / LAU1_CODE / Whole country;
b. TYPE_URBAN_RURAL (1‐2);
c. TECH_GEN (2G, 3G, LTE);
d. TYPE_EVENT (6‐7);
e. PROPORTION – (COUNT_TECH_GEN / COUNT_TOTAL * 100), the percentage value of
the subscriptions who have accessed the technology (TECH_GEN) out of all subscriptions
in the specific LAU unit and the specific urban/rural type from all data providers.
DISAGGREGATION

25 / 58
There are four breakdowns/dimensions of disaggregation. The indicator should be provided for each
level of breakdown.
Disaggregation by technology (2G, 3G, LTE);
Disaggregation by technology (open Internet, closed Internet);
Disaggregation by local administrative units (LAU):
o Whole country;
o LAU1 level (first level administrative level units);
o LAU2 level (second level administrative level units);
o LAU3 level (third level administrative level units).
Disaggregation by urban and rural areas.
EXPECTED RESULTS: AN EXAMPLE
Use of a given technology as a percentage of all technologies used (the indicators are illustrative):
Whole country; urban and rural; 2G: 56.4%;
Whole country; urban and rural; 3G: 31.1%;
Whole country; urban and rural; LTE: 12.5%;
Whole country; rural only; 2G: 85.3%;
Whole country; rural only; 3G: 12.1%;
Whole country; rural only; LTE: 2.6%;
LAU1 level, specific administrative unit; urban only; 2G: 46.0%;
LAU1 level, specific administrative unit; urban only; 3G: 34.5%;
LAU1 level, specific administrative unit; urban only; LTE: 19.5%;
etc.
BD05: ACTIVE SUBSCRIPTIONS WITH ACCESS TO TECHNOLOGY
ITU Priority No. 1
This indicator provides insights into users’ actual access to specific mobile‐cellular technologies. It
relates to MNOs. There is no associated official indicator, so this can be regarded as a new ICT indicator.
The indicator provides an understanding of how many mobile‐network subscriptions actually have
access to and make use of a given mobile‐cellular technology by generation (2G, 3G, LTE). An active
subscription is considered to have access to a given technology if it has used the technology in question
over the last three months. If a subscription has used only 2G network antennas to access voice,
messaging and data services, then this means that subscriber’s access has been limited to 2G
technology. If a subscription has used 2G, 3G and LTE, then this means that the subscription’s access has
been limited to LTE and earlier technology. The idea of this is to provide an insight into the best
technology (2G<3G<LTE) accessed and used by all unique subscriptions as reflected by the proportion of
subscriptions that have really been able to access 2G only; 3G (or earlier); and LTE.

26 / 58
This indicator is calculated on the basis of different types of call detail records (CDR) including incoming
and outgoing voice CDRs, incoming and outgoing messaging CDRs (SMS, MMS and other) and Internet
traffic detail records (IPDR). In the interests of simplicity, all the aforementioned activities will be
considered simply as instances of mobile‐cellular network usage and divided into three technology types
(2G, 3G and LTE).
The source data include private data of the subscribers which can be removed in Tier I. In addition, they
may include confidential and sensitive business information about network coverage areas, as well as
usage statistics, which should not be disclosed to competing MNOs.
REQUIRED SOURCE DATA
MNO NETWORK DATA;
MNO CDR/IPDR DATA – domestic data only, CDRs and IPDRs:
o ID;
o DATETIME;
o CELL_ID;
NSI REF DATA ADMIN – Land area maps in vector format.
See detailed description of the source data in Description of the Required Source Data.
CALCULATION METHODOLOGY
1. Tier I: Extract MNO CDR/IPDR DATA from data warehouse and network antennas location data
(from OSS) including all currently active antennas.
2. Tier II: Assign each transaction to the LAU levels using NSI REF DATA ADMIN and calculate the
best technology used by each subscription (2G<3G<LTE) in each LAU level.6 This will result in a
list of subscriptions indicating the best technology accessed during the observed period at each
LAU level. Aggregate the number of subscriptions for each technology (see Figure 4). This should
be calculated for all LAU levels separately:
a. LAU3_CODE / LAU2_CODE / LAU1_CODE / Whole country;
b. TECH_GEN (2G, 3G, LTE);
c. COUNT_UNIQUE – count of the unique subscriptions that have accessed the specific
technology.
3. Tier III: Combine the data from different data providers by summarizing the data by technology
and local administrative units. The resulting table includes the following attributes:
a. LAU3_CODE / LAU2_CODE / LAU1_CODE / Whole country;
b. TECH_GEN (2G, 3G, LTE);
c. COUNT_UNIQUE – count of the subscriptions that have accessed the specific
technology;
d. COUNT_TOTAL – count of total unique subscriptions active in the specific LAU unit.
6 If a subscription made transactions in different LAU levels, it will be counted as one count in each LAU level and assigned to the best technology used by that subscription at that particular LAU level.

27 / 58
Figure 4. Illustration of assigning the best technology accessed using LAU2, LAU1 and LAU0 levels along with expected results.
DISAGGREGATION

28 / 58
There are three breakdowns/dimensions of disaggregation. The indicator should be provided for each
level of breakdown.
Disaggregation by technology (2G, 3G, LTE);
Disaggregation by local administrative units (LAU):
o Whole country;
o LAU1 level (first level administrative level units);
o LAU2 level (second level administrative level units);
o LAU3 level (third level administrative level units).
Disaggregation by urban and rural areas.
EXPECTED RESULTS: AN EXAMPLE
Percentage of the technology used compared to the total amount of technologies used (the indicators
are illustrative):
Whole country; access to 2G only: 56.4%;
Whole country; access to 3G and lower: 31.1%;
Whole country; access to LTE and lower: 12.5%;
LAU1 level, specific administrative unit; 2G: 46.0%;
LAU1 level, specific administrative unit; 3G: 34.5%;
…
BD06: ACTIVE MOBILE VOICE AND BROADBAND SUBSCRIPTIONS, BY CONTRACT TYPE
ITU Priority No. 2
This indicator is similar to existing Active mobile‐broadband subscriptions (i271mw). It relates to MNOs.
This indicator refers to the number of active mobile subscriptions disaggregated by contract type
(residential, non‐residential; prepaid, postpaid; no‐data, voice and data, data only). The indicator is
associated with two existing indicators, Data and voice mobile‐broadband subscriptions (i271mb_active)
and Data‐only mobile‐broadband subscriptions (i271md), and includes one new indicator.
Active mobile‐broadband subscriptions refers to the sum of active handset‐based and computer‐based
(USB/dongles) mobile‐broadband subscriptions to the public Internet. It covers actual subscribers, not
potential subscribers, even though the latter may have broadband‐enabled handsets. Subscriptions
must include a recurring subscription fee or pass a usage requirement – users must have accessed the
Internet in the last three months. The indicator includes subscriptions to mobile‐broadband networks
that provide download speeds of at least 256 kbit/s (e.g. WCDMA, HSPA, CDMA2000 1x EV‐DO, WiMAX
IEEE 802.16e and LTE), and excludes subscriptions that have access only to GPRS, EDGE and CDMA
1xRTT.
29 / 58
The source data do not include any private subscriber data, but may include confidential and sensitive
business information about the number of subscribers, which should not be disclosed to competing
MNOs.
REQUIRED SOURCE DATA
MNO NETWORK DATA;
MNO CDR/IPDR DATA – domestic and outbound roaming data only, CDRs and IPDRs:
o ID;
o CELL_ID (NULL if outbound roaming);
o TYPE_COMMERCIAL_PRIVATE;
o TYPE_PRE_POST;
o TYPE_VOICE_DATA;
NSI REF DATA ADMIN – Land area maps in vector format.
See detailed description of the source data in Description of the Required Source Data.
CALCULATION METHODOLOGY
1. Tier I: Extract MNO CDR/IPDR DATA from data warehouse and network antennas location data
(from OSS) including all currently active antennas. Extract also CRM data about the
subscriptions.
2. Tier II: Aggregate the number of unique subscriptions by grouping according to LAU
administrative units using NSI REF DATA ADMIN and contract type attributes. Resulting table
with following attributes:
a. LAU3_CODE / LAU2_CODE / LAU1_CODE / Whole country / Abroad;
b. TYPE_URBAN_RURAL (NULL if outbound roaming);
c. TYPE_COMMERCIAL_PRIVATE;
d. TYPE_PRE_POST;
e. TYPE_VOICE_DATA;
f. COUNT – count the number of distinct subscriptions with appropriate type of the
contract.
3. Tier III: Combine the data from different data providers by merging the data contract type.
Aggregate the data on the basis of four geographical levels (LAU3, LAU2, LAU1 and whole
country). The resulting table includes the following attributes:
a. LAU3_CODE / LAU2_CODE / LAU1_CODE / Whole country / Abroad;
b. TYPE_URBAN_RURAL (NULL if outbound roaming);
c. TYPE_COMMERCIAL_PRIVATE;
d. TYPE_PRE_POST;
e. TYPE_VOICE_DATA;
f. COUNT.
DISAGGREGATION
30 / 58
There are three breakdown dimensions in addition to the geographical breakdown based on LAU levels
(1‐3 and Abroad) and the urban/rural classification:
TYPE_COMMERCIAL_PRIVATE – type of contract (residential / non‐residential, 1‐2):
o (1) – residential;
o (2) – non‐residential.
TYPE_PRE_PST – type of SIM card (1‐2):
o (1) – prepaid;
o (2) – postpaid.
TYPE_VOICE_DATA – type of contract (voice / data, 1‐3):
o (1) – no data;
o (2) – voice and data;
o (3) – dedicated data only.
EXPECTED RESULTS: AN EXAMPLE
Whole country and abroad; urban and rural; voice and data contract; all prepaid and postpaid;
residential and non‐residential subscriptions: 200 000.
Whole country and abroad; urban only; data only contract; all prepaid and postpaid; residential
and non‐ residential subscriptions: 750 000.
Abroad; voice and data contract; all prepaid and postpaid; residential and non‐ residential
subscriptions: 50 000.
LAU1 level, specific administrative unit; rural only; data only contract; only postpaid; only non‐
residential subscriptions: 125 000.
etc.
BD07: AVERAGE NUMBER OF ACTIVE MOBILE SUBSCRIPTIONS PER DAY, BY CONTRACT TYPE
ITU Priority No. 2
This is a new indicator describing the average number of active mobile subscriptions per day. It relates
to MNOs.
The indicator refers to the average number of active mobile subscriptions on a daily basis disaggregated
by contract type (residential, non‐ residential; prepaid, postpaid; no‐data, voice and data, data only).
Compared to indicator BD06: Active Mobile Voice and Broadband Subscriptions, by Contract Type, this
indicator refers to subscribers’ daily activity and shows the level of active use of the mobile voice and
messaging service, and Internet access via mobile networks. The indicator shows how many
subscriptions are active on a daily basis during the observed period. The higher this number is, the more
subscriptions are using and accessing the mobile network on a daily basis. The ideal number should be
equal to the indicator from BD06, meaning that all subscriptions are active and using the mobile
network on all the days of the observed period.
31 / 58
The source data do not include any private data of the subscribers, but may include confidential and
sensitive business information about the number of subscribers, which should not be disclosed to
competing MNOs.
REQUIRED SOURCE DATA
MNO NETWORK DATA;
MNO CDR/IPDR DATA – domestic and outbound roaming data only, CDRs and IPDRs:
o ID;
o CELL_ID (NULL if outbound roaming);
o TYPE_COMMERCIAL_PRIVATE;
o TYPE_PRE_POST;
o TYPE_VOICE_DATA;
o DATETIME;
NSI REF DATA ADMIN – Land area maps in vector format.
See detailed description of the source data in Description of the Required Source Data.
CALCULATION METHODOLOGY
1. Tier I: Extract MNO CDR/IPDR DATA from data warehouse and network antennas location data
(from OSS) including all currently active antennas. Extract also CRM data about the
subscriptions. Extract the date (NB: local country time zone) from the DATETIME attribute and
group by the following attributes:
a. ID;
b. CELL_ID (NULL if outbound roaming);
c. TYPE_COMMERCIAL_PRIVATE;
d. TYPE_PRE_POST;
e. TYPE_VOICE_DATA;
f. DATE – extracted from DATETIME attribute (local country time zone, for outbound
roaming data, date of the country the subscription was present at the time of the CDR).
2. Tier II: Aggregate the number of subscriptions by grouping according to LAU administrative unit,
DATE attribute and other attributes. The resulting table should have the following attributes:
a. LAU3_CODE / LAU2_CODE / LAU1_CODE / Whole country / Abroad (Abroad = CELL_ID is
NULL);
b. TYPE_URBAN_RURAL (NULL if outbound roaming);
c. TYPE_COMMERCIAL_PRIVATE;
d. TYPE_PRE_POST;
e. TYPE_VOICE_DATA;
f. DATE;
g. COUNT.
3. Tier IIIa: Sum the count of the subscriptions from the different data providers:
a. LAU3_CODE / LAU2_CODE / LAU1_CODE / Whole country / Abroad (Abroad = CELL_ID is
NULL);
32 / 58
b. TYPE_URBAN_RURAL (NULL if outbound roaming);
c. TYPE_COMMERCIAL_PRIVATE;
d. TYPE_PRE_POST;
e. TYPE_VOICE_DATA;
f. DATE;
g. COUNT.
4. Tier IIIb: Calculate the average COUNT of subscriptions per day. The resulting table includes the
following attributes:
a. LAU3_CODE / LAU2_CODE / LAU1_CODE / Whole country / Abroad;
b. TYPE_URBAN_RURAL (NULL if outbound roaming);
c. TYPE_COMMERCIAL_PRIVATE;
d. TYPE_PRE_POST;
e. TYPE_VOICE_DATA;
f. AVG_COUNT – the average number of subscriptions per day.
DISAGGREGATION
There are three breakdown dimensions, in addition to the geographical breakdown based on LAU levels
(1‐3 and Abroad) and the urban/rural classification:
TYPE_COMMERCIAL_PRIVATE – type of the contract (residential / non‐residential, 1‐2):
o (1) – residential;
o (2) – non‐residential;
TYPE_PRE_PST – type of SIM card (1‐2):
o (1) – prepaid;
o (2) – postpaid:
TYPE_VOICE_DATA – type of the contract (voice / data, 1‐3):
o (1) – no data;
o (2) – voice and data;
o (3) – dedicated data only;
EXPECTED RESULTS: AN EXAMPLE
Whole country and abroad; urban and rural; voice and data contract; all prepaid and postpaid;
residential and non‐residential subscriptions: 120 000;
Whole country and abroad; urban only; data only contract; all prepaid and postpaid; residential
and non‐residential subscriptions: 500 000;
Abroad; voice and data contract; all prepaid and postpaid; residential and non‐residential :
40 000;
LAU1 level, specific administrative unit; rural only; data only contract; only postpaid; only non‐
residential subscriptions: 100 000;
etc.
BD08: ACTIVE MOBILE DEVICES

33 / 58
ITU Priority No. 1
This indicator is associated with Indicator HH10: Proportion of individuals using a mobile cellular
telephone, and with Indicator HH18: Proportion of individuals who own a mobile phone. However, the
indicator refers to the number of devices, rather than the number of individual users. Although it is
impossible to provide the exact number of phone users and owners from these data sources, it can be
estimated, as the number of phone users and owners should correlate to the number of devices. This
indicator relates to MNOs.
The source data do not include any private data of the subscribers, but may include confidential and
sensitive business information about the number of subscribers, which should not be disclosed to
competing MNOs.
REQUIRED SOURCE DATA
MNO NETWORK DATA;
MNO CDR/IPDR DATA – domestic data only, CDRs and IPDRs:
o ID;
o IMEI.
TAC DATA: o TAC; o DEVICE_TYPE.
NSI REF DATA ADMIN – Land area maps in vector format.
See detailed description of the source data in Description of the Required Source Data.
CALCULATION METHODOLOGY
1. Tier I: Extract domestic data (CDR/IPDR).
2. Tier II: Extract the unique IMEI codes from the raw dataset, extract the initial 6‐8 digits from
IMEI code that represent the Type Allocation Code (TAC) that can be used to identify the device
model. Combine the table with TAC device manufacturer and distribute to the LAU levels
(separate aggregation to not allow double counting of devices, so for each LAU level, the table
should be aggregated based on Tier I and not lower LAU levels):
a. LAU3_CODE / LAU2_CODE / LAU1_CODE / Whole country ;
b. TAC – extracted TAC code from IMEI (initial 6 or 8 digits from IMEI);7
c. COUNT – the number of devices.
3. Tier III: Combine the data from different data providers and apply a lookup table to match each
TAC to a device type (e.g. dongle, tablet, feature phone, smartphone, etc.):
a. LAU3_CODE / LAU2_CODE / LAU1_CODE / Whole country;
7 In order to extract the TAC from the IMEI code, the first eight IMEI digits are needed in most cases. Prior to 2004, the TAC corresponded to the first six digits, but it is to be assumed that most devices currently active came into use after that date.

34 / 58
b. DEVICE_TYPE;
c. COUNT – the number of devices.
DISAGGREGATION
There is only one breakdown of disaggregation – the device type.
EXPECTED RESULTS: AN EXAMPLE
Whole country; all devices: 15 000 000;
Whole country; smartphones: 7 500 000;
LAU1 level, specific administrative unit; feature phones: 1 232 000;
etc.
BD09: IMEI CONVERSION RATE
ITU Priority No. 2
This is a new indicator describing the conversion of mobile devices in the country’s mobile networks.
Ideally the IMEI code represents a unique device used in the network. Subscribers change their devices
over a period of time, so this indicator should ideally represent the number of subscribers that have
changed the devices. Because IMEI codes can be changed by using often illegal tools, the high rate of
IMEI conversion could suggest the high level of black market activity. The normal or typical conversion
rate (the proportion of individuals changing devices) during any quarter should be around 10 per cent
per cent.8 If this indicator is much higher, then it could suggest the “black market” proportion is high.
Alternatively, it could mean that a significant share of the population uses multiple devices for the same
SIM card. If this indicator is low, then it can be interpreted as meaning that customers do not tend to
acquire new devices very often. This indicator relates to MNOs.
The source data do not include any private data of the subscribers, but may include confidential and
sensitive business information about the number of subscribers, which should not be disclosed to
competing MNOs.
REQUIRED SOURCE DATA
MNO NETWORK DATA;
MNO CDR/IPDR DATA – domestic data only, CDRs and IPDRs:
o ID;
o IMEI.
NSI REF DATA ADMIN – Land area maps in vector format.
8 Estimate based on about 5 billion phone users around the world and 500 million new devices acquired each quarter.

35 / 58
See detailed description of the source data in Description of the Required Source Data.
CALCULATION METHODOLOGY
1. Tier I: Extract domestic data (CDR/IPDR).
2. Tier IIa: Calculate the number of IMEI codes associated with ID’s resulting in the number of
devices used by each individual ID.:
a. ID;
b. LAU3_CODE;
c. IMEI_COUNT – count of devices used by this subscriber.
3. Tier IIb: Aggregate the number based on data provider. This should be calculated for each LAU
level separately using NSI REF DATA ADMIN:
a. LAU3_CODE / LAU2_CODE / LAU1_CODE / Whole country;
b. ID_COUNT_MULTI ‐ number of ID’s who have been using more than one device
(IMEI_COUNT > 1);
c. ID_COUNT_TOTAL – total count of ID’s (total number of active subscribers).
4. Tier IIIa: Aggregate the combined data:
a. LAU3_CODE / LAU2_CODE / LAU1_CODE / Whole country;
b. ID_COUNT_MULTI ‐ number of ID’s who have been using more than one device
(IMEI_COUNT > 1);
c. ID_COUNT_TOTAL – total count of ID’s (total number of active subscribers).
5. Tier IIIb:
a. LAU3_CODE / LAU2_CODE / LAU1_CODE / Whole country;
b. COUNT – Calculate the indicator: ID_COUNT_MULTI / ID_COUNT_TOTAL * 100.
DISAGGREGATION
Geographical breakdown based on LAU levels.
EXPECTED RESULTS: AN EXAMPLE
The proportion of subscribers changing their IMEI codes/devices during the observed period:
10.6 per cent.
BD10: FIXED‐BROADBAND TRAFFIC, BY SPEED, CONTRACT TYPE
ITU Priority No. 1
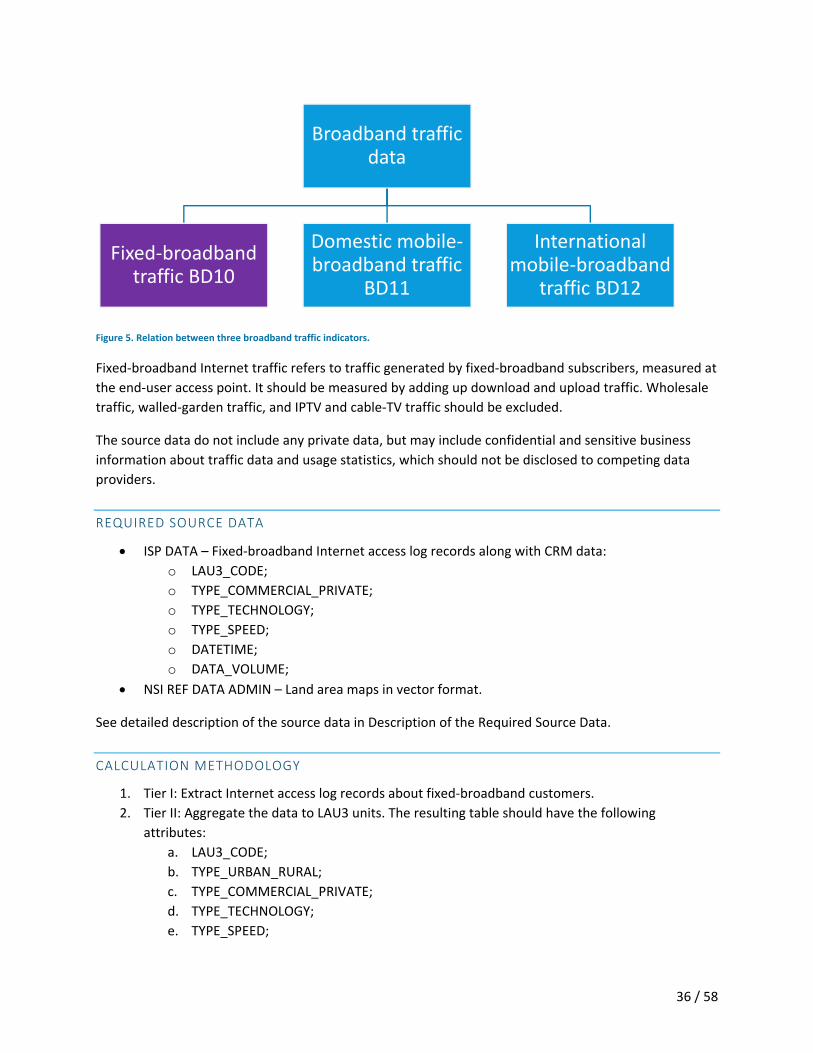
This indicator is associated with the Indicator Fixed‐broadband Internet traffic (exabytes) (i135tfb). This
indicator, BD11: Domestic mobile‐Broadband Traffic, by Contract Type, Technology, and BD12:
International mobile‐Broadband Traffic, by Contract Type, comprise the three indicators representing
the overall broadband traffic from fixed and mobile networks. This indicator relates to ISPs.
36 / 58
Figure 5. Relation between three broadband traffic indicators.
Fixed‐broadband Internet traffic refers to traffic generated by fixed‐broadband subscribers, measured at
the end‐user access point. It should be measured by adding up download and upload traffic. Wholesale
traffic, walled‐garden traffic, and IPTV and cable‐TV traffic should be excluded.
The source data do not include any private data, but may include confidential and sensitive business
information about traffic data and usage statistics, which should not be disclosed to competing data
providers.
REQUIRED SOURCE DATA
ISP DATA – Fixed‐broadband Internet access log records along with CRM data:
o LAU3_CODE;
o TYPE_COMMERCIAL_PRIVATE;
o TYPE_TECHNOLOGY;
o TYPE_SPEED;
o DATETIME;
o DATA_VOLUME;
NSI REF DATA ADMIN – Land area maps in vector format.
See detailed description of the source data in Description of the Required Source Data.
CALCULATION METHODOLOGY
1. Tier I: Extract Internet access log records about fixed‐broadband customers.
2. Tier II: Aggregate the data to LAU3 units. The resulting table should have the following
attributes:
a. LAU3_CODE;
b. TYPE_URBAN_RURAL;
c. TYPE_COMMERCIAL_PRIVATE;
d. TYPE_TECHNOLOGY;
e. TYPE_SPEED;
Broadband traffic data
Fixed‐broadband traffic BD10
Domestic mobile‐broadband traffic
BD11
International mobile‐broadband
traffic BD12

37 / 58
f. DATA_VOLUME – sum of the traffic volume for all upload and download traffic of
customers with these disaggregation attributes.
3. Tier III: Combine the data from different data providers. Aggregate the data based on
geographical levels – LAU3, LAU2, LAU1 and whole country. The resulting table includes the
following attributes:
a. LAU3_CODE / LAU2_CODE / LAU1_CODE / Whole country;
b. TYPE_URBAN_RURAL;
c. TYPE_COMMERCIAL_PRIVATE;
d. TYPE_TECHNOLOGY;
e. TYPE_SPEED;
f. DATA_VOLUME – sum of the traffic volume from all data providers.
DISAGGREGATION
There are four breakdowns/dimensions of disaggregation. The indicator should be provided for each
level of breakdown.
Disaggregation by contract type (residential / non‐residential);
Disaggregation by type of the speed (1‐5);
Disaggregation by local administrative units (LAU):
o Whole country;
o LAU1 level (first level administrative level units);
o LAU2 level (second level administrative level units);
o LAU3 level (third level administrative level units).
Disaggregation by urban and rural areas.
EXPECTED RESULTS: AN EXAMPLE
Whole country; urban and rural; residential and non‐residential; all speeds: 100 (EB – exabytes);
Whole country; rural only; residential and non‐residential; all speeds: 0.5 (EB – exabytes);
Whole country; urban and rural; residential and non‐residential; above 1 Gbps subscriptions: 2
(EB – exabytes);
LAU1 level, specific administrative unit; urban only; residential; all speeds: 0.21 (EB – exabytes);
LAU2 level, specific administrative unit; rural only; residential; 10 Mbps to less than 100 Mbps
subscriptions: 1.3 (EB – exabytes);
etc.
BD11: DOMESTIC MOBILE‐BROADBAND TRAFFIC, BY CONTRACT TYPE, TECHNOLOGY
ITU Priority No. 1
This indicator is associated with the indicator Mobile‐broadband Internet traffic (within the country)
(i136mwi). This indicator, BD10: Fixed‐Broadband Traffic, by Speed, Contract Type, and BD12:

38 / 58
International mobile‐Broadband Traffic, by Contract Type, comprise the three indicators representing
the overall broadband traffic from fixed and mobile networks. This indicator relates to MNOs.
Figure 6. Relation between three broadband traffic indicators.
Mobile‐broadband Internet traffic (within the country) refers to broadband traffic volumes originated
within the country from 3G or other more advanced mobile networks, including 3G upgrades, evolutions
or standards that are equivalent in terms of data transmission speeds. Traffic data should be collected
and aggregated at the country level for all 3G or more advanced mobile networks within the country.
Download and upload traffic should be added up and reported together. Traffic should be measured at
the end‐user access point. Wholesale and walled‐garden traffic should be excluded. The traffic should be
reported in exabytes.
The source data do not include any private data, but may include confidential and sensitive business
information about traffic and usage statistics, which should not be disclosed to competing data
providers.
REQUIRED SOURCE DATA
MNO NETWORK DATA;
MNO IPDR DATA – domestic data only, IPDRs only:
o TYPE_COMMERCIAL_PRIVATE;
o DATETIME;
o CELL_ID;
o DATA_VOLUME.
NSI REF DATA ADMIN – Land area maps in vector format.
See detailed description of the source data in Description of the Required Source Data.
CALCULATION METHODOLOGY
1. Tier I: Extract Internet usage data from IPDR for domestic mobile‐cellular subscriptions.
2. Tier II: Aggregate the data to LAU3 units using NSI REF DATA ADMIN. The resulting table should
have the following attributes:
Broadband traffic data
Fixed‐broadband traffic BD10
Domestic mobile‐broadband traffic
BD11
International mobile‐broadband
traffic BD12
39 / 58
a. LAU3_CODE;
b. TYPE_URBAN_RURAL;
c. TECH_GEN (2G, 3G, LTE);
d. TYPE_COMMERCIAL_PRIVATE;
e. DATA_VOLUME – sum of the traffic volume for all upload and download traffic of
customers with these disaggregation attributes;
3. Tier III: Combine the data from different data providers. Aggregate the data based on
geographical levels – LAU3, LAU2, LAU1 and whole country. The resulting table includes the
following attributes:
a. LAU3_CODE / LAU2_CODE / LAU1_CODE / Whole country;
b. TYPE_URBAN_RURAL;
c. TECH_GEN (2G, 3G, LTE);
d. TYPE_COMMERCIAL_PRIVATE;
e. DATA_VOLUME – sum of the traffic volume from all data providers;
DISAGGREGATION
Disaggregation by type of the contract (residential / non‐residential):
Disaggregation by local administrative units (LAU):
o Whole country;
o LAU1 level (first level administrative level units);
o LAU2 level (second level administrative level units);
o LAU3 level (third level administrative level units);
Disaggregation by urban and rural areas;
Disaggregation by technology (2G; 3G; LTE);
EXPECTED RESULTS: AN EXAMPLE
Whole country; urban and rural; residential and non‐residential; all generations: 100 (EB –
exabytes);
Whole country; rural only; non‐residential; all generations: 0.5 (EB – exabytes);
Whole country; urban and rural; non‐residential; LTE: 2 (EB – exabytes);
LAU1 level, specific administrative unit; urban only; non‐residential; all generations: 0.21 (EB –
exabytes);
LAU2 level, specific administrative unit; rural only; non‐residential; 3G: 1.3 (EB – exabytes);
etc.
BD12: INTERNATIONAL MOBILE‐BROADBAND TRAFFIC, BY CONTRACT TYPE
ITU Priority No. 1
This indicator is associated with the indicator Mobile‐broadband Internet traffic (outside the country,
roaming out) (i136mwo). This indicator, BD10: Fixed‐Broadband Traffic, by Speed, Contract Type and

40 / 58
BD11: Domestic mobile‐Broadband Traffic, by Contract Type, Technology comprise the three indicators
representing the overall broadband traffic from fixed and mobile networks. This indicator relates to
MNOs.
Figure 7. Relation between three broadband traffic indicators.
Mobile‐broadband Internet traffic (outside the country, roaming out) refers to broadband traffic
volumes originated outside the country from 3G or other more advanced mobile‐networks, including 3G
upgrades, evolutions or equivalent standards in terms of data transmission speeds. Traffic should be
collected and aggregated at the country level for all customers of domestic operators roaming outside
the country and using 3G or more advanced mobile networks. Download and upload traffic should be
added up and reported together. Traffic should be measured at the end‐user access point. Wholesale
and walled‐garden traffic should be excluded. Traffic should be reported in exabytes. This indicator is
applied to MNOs.
The source data do not include any private data, but may include confidential and sensitive business
information about traffic data and usage statistics, which should not be disclosed to competing data
providers.
REQUIRED SOURCE DATA
MNO IPDR DATA – outbound roaming data only, IPDRs only:
o TYPE_COMMERCIAL_PRIVATE;
o DATETIME;
o DATA_VOLUME.
See detailed description of the source data in Description of the Required Source Data.
CALCULATION METHODOLOGY
1. Tier I: Extract Internet usage data from IPDR for domestic mobile‐cellular subscriptions in
foreign countries using outbound roaming service.
2. Tier II: Aggregate the data based on contract type. The resulting table should have the following
attributes:
Broadband traffic data
Fixed‐broadband traffic BD10
Domestic mobile‐broadband traffic
BD11
International mobile‐broadband
traffic BD12
41 / 58
a. TYPE_COMMERCIAL_PRIVATE;
b. DATA_VOLUME – sum of the traffic volume for all upload and download traffic of the
customers with these disaggregation attributes.
3. Tier III: Combine the data from different data providers. The resulting table includes the
following attributes:
a. TYPE_COMMERCIAL_PRIVATE;
b. DATA_VOLUME – sum of the traffic volume from all data providers.
DISAGGREGATION
Disaggregation by type of the contract (residential/non‐residential).
EXPECTED RESULTS: AN EXAMPLE
All outbound roaming traffic volume; residential and non‐residential: 0.34 (EB – exabytes);
All outbound roaming traffic volume; non‐residential: 0.22 (EB – exabytes);
All outbound roaming traffic volume; residential: 0.12 (EB – exabytes).
BD13: INBOUND ROAMING SUBSCRIPTIONS PER FOREIGN TOURIST
ITU Priority No. 2
This is a new indicator representing the number of foreign roaming subscriptions that have been used in
the country compared to the number of foreign tourists accommodated in the county. This indicator can
be associated with the indicator Roaming by foreign subscribers (inbound roaming), in minutes
(i1336wm). However this indicator does not refer to total roaming in minutes, but in terms of foreign
roaming subscriptions as a proportion of the total number of foreign tourists visiting the country. This
indicator are gathered by MNOs.
The number of foreign roaming subscriptions in the country correlates with the number of visiting
tourists. Depending on the cost of the roaming service, the number of roaming subscriptions used may
be higher or lower, as some visitors tend to obtain a prepaid local SIM card for the duration of their stay
and therefore do not use the roaming service. The reduction in international roaming charges has
resulted in higher numbers of visitors using roaming services and the indicator should reflect this.
This indicator is calculated on the basis of a monthly aggregation.
The source data do not include any private data, but may include confidential and sensitive business
information about traffic data and usage statistics, which should not be disclosed to competing data
providers.
REQUIRED SOURCE DATA

42 / 58
MNO CDR/IPDR DATA – inbound roaming data only, CDRs and IPDRs:
o ID;
o DATETIME.
NSI REF DATA ACCOMMODATED TOURISTS.
See detailed description of the source data in Description of the Required Source Data.
CALCULATION METHODOLOGY
1. Tier I: Extract inbound roaming data for visiting subscriptions in the country from MNO
CDR/IPDR DATA. Extract the month from DATETIME attribute:
a. ID;
b. MONTH – extracted from DATETIME attribute.
2. Tier II: Group the result data by IDs, origin country and MONTH. Then we count the unique ID’s
for each month and origin country:
a. MONTH;
b. MCC;
c. COUNT distinct IDs.
3. Tier IIIa: Combine the data from different data providers. The resulting table should include only
unique IDs of the inbound roaming service per month. It should be noted that identical IMSI
codes from different data providers should be treated as one ID (because of the cross‐roaming
in several MNOs). Sum the total number of unique IDs from all data providers. Add the monthly
accommodation count of foreign tourists visiting the country:
a. MONTH;
b. COUNT – the total number of unique inbound roaming subscriptions during the
observed period;
c. FOR_ACCOM.
4. Tier IIIb: Divide the total number of unique inbound roaming subscriptions by the number of
foreign tourists, resulting in the number of inbound roaming subscriptions per foreign tourist:
a. MONTH;
b. COUNT / FOR_ACCOM.
DISAGGREGATION
The only disaggregation is by month.
EXPECTED RESULTS: AN EXAMPLE
April 2016: 1.23 inbound roaming subscriptions per foreign tourist visiting the country during
the observed time period.
BD14: FIXED‐BROADBAND SUBSCRIPTIONS, BY TECHNOLOGY
ITU Priority No. 2

43 / 58
This indicator is associated with the Fixed‐broadband subscriptions (i4213tfbb), by technology. This
indicator relates to ISPs.
Fixed‐broadband subscriptions, by technology, refers to fixed subscriptions for high‐speed access to the
public Internet (a TCP/IP connection), at downstream speeds equal to or greater than 256 kbps. This
includes cable modem, DSL, fibre‐to‐the‐home/building, other fixed (wired)‐broadband subscriptions,
satellite broadband and terrestrial fixed wireless broadband. This total is measured irrespective of the
method of payment. It excludes subscriptions allowing access to data communications (including the
Internet) via mobile‐cellular networks. It should include fixed WiMAX and any other fixed wireless
technologies. It includes both residential subscriptions and subscriptions for organizations. The indicator
can be broken down as follows:
Cable modem Internet subscriptions;
DSL Internet subscriptions;
Fibre‐to‐the‐home/building Internet subscriptions;
Other fixed (wired)‐broadband subscriptions;
Satellite broadband subscriptions;
Fixed wireless broadband subscriptions.
The source data do not include any private data, but may include confidential and sensitive business
information about traffic data and usage statistics, which should not be disclosed to competing data
providers.
REQUIRED SOURCE DATA
ISP DATA – Fixed‐broadband Internet access log records along with CRM data:
o ID;
o LAU3_CODE;
o TYPE_TECHNOLOGY;
NSI REF DATA ADMIN – Land area maps in vector format.
See detailed description of the source data in Description of the Required Source Data.
CALCULATION METHODOLOGY
1. Tier I: Extract Internet access log records of fixed‐broadband customers. Group the data by ID.
2. Tier II: Aggregate the data to LAU3 units. The resulting table should have the following
attributes:
a. LAU3_CODE;
b. TYPE_URBAN_RURAL;
c. TYPE_TECHNOLOGY;
d. COUNT – the number of unique subscriptions.
3. Tier III: Combine the data from different data providers. Aggregate the data based on
geographical levels – LAU3, LAU2, LAU1 and whole country. The resulting table includes the
following attributes:

44 / 58
a. LAU3_CODE / LAU2_CODE / LAU1_CODE / Whole country;
b. TYPE_URBAN_RURAL;
c. TYPE_TECHNOLOGY;
d. COUNT.
DISAGGREGATION
There are three breakdowns/dimensions of disaggregation. The indicator should be provided for each
level of breakdown.
Disaggregation by type of technology;
Disaggregation by local administrative unit (LAU):
o Whole country;
o LAU1 level (first level administrative level units);
o LAU2 level (second level administrative level units);
o LAU3 level (third level administrative level units);
Disaggregation by urban and rural areas.
EXPECTED RESULTS: AN EXAMPLE
Whole country; urban and rural; all technologies: 125,000,000;
Whole country; rural only; all technologies: 25,000,000;
Whole country; urban and rural; DSL subscriptions: 50,000,000;
LAU1 level, specific administrative unit; urban only; all technologies: 24,000,000;
LAU2 level, specific administrative unit; rural only; cable modem: 1,000,000;
etc.
BD15: FIXED‐BROADBAND SUBSCRIPTIONS, BY SPEED
ITU Priority No. 1
This indicator is associated with the Fixed‐broadband subscriptions (i4213tfbb), by speed. This indicator
relates to ISPs.
Fixed‐broadband subscriptions, by speed, refers to fixed subscriptions for high‐speed access to the
public Internet (a TCP/IP connection), at downstream speeds equal to, or greater than, 256 kbps. This
includes cable modem, DSL, fibre‐to‐the‐home/building, other fixed (wired)‐broadband subscriptions,
satellite broadband and terrestrial fixed wireless broadband. This total is measured irrespective of the
method of payment. It excludes subscriptions allowing access to data communications (including the
Internet) via mobile‐cellular networks. It should include fixed WiMAX and any other fixed wireless
technologies. It includes both residential subscriptions and subscriptions for organizations. The indicator
can be broken down by advertised speeds as follows:
o 256 Kbps to less than 2 Mbps

45 / 58
o 2 Mbps to less than 10 Mbps
o 10 Mbps to less than 30 Mbps
o 300 Mbps to less than 100 Mbps
o Equal or above 100 Mbps.
The source data do not include any private data, but may include confidential and sensitive business
information about traffic data and usage statistics, which should not be disclosed to competing data
providers.
REQUIRED SOURCE DATA
ISP DATA – Fixed‐broadband Internet access log records along with CRM data:
o LAU3_CODE;
o TYPE_SPEED;
NSI REF DATA ADMIN – Land area maps in vector format.
See detailed description of the source data in Description of the Required Source Data.
CALCULATION METHODOLOGY
1. Tier I: Extract Internet access log records of fixed‐broadband customers. Group the data by ID.
2. Tier II: Aggregate the data to LAU3 units. The resulting table should have the following
attributes:
a. LAU3_CODE;
b. TYPE_URBAN_RURAL;
c. TYPE_SPEED;
d. COUNT – the number of unique subscriptions.
3. Tier III: Combine the data from different data providers. Aggregate the data based on
geographical levels – LAU3, LAU2, LAU1 and whole country. The resulting table includes the
following attributes:
a. LAU3_CODE / LAU2_CODE / LAU1_CODE / Whole country;
b. TYPE_URBAN_RURAL;
c. TYPE_SPEED;
a. COUNT.
DISAGGREGATION
There are three breakdowns/dimensions of disaggregation. The indicator should be provided for each
level of breakdown.
Disaggregation by type of the connection speed;
Disaggregation by local administrative unit (LAU):
o Whole country;
o LAU1 level (first level administrative level units);
o LAU2 level (second level administrative level units);
46 / 58
o LAU3 level (third level administrative level units);
Disaggregation by urban and rural areas.
EXPECTED RESULTS: AN EXAMPLE
Whole country; urban and rural; all speeds: 125 000 000;
Whole country; rural only; all speeds: 25 000 000;
Whole country; urban and rural; equal to or above 100 Mbps: 200 000;
LAU1 level, specific administrative unit; urban only; all speeds: 24 000 000;
LAU2 level, specific administrative unit; rural only; 10 Mbps to less than 30 Mbps: 500 000;
etc.
BD16+: PROPOSED NEW INDICATORS FROM PILOT COUNTRIES
ITU Priority No. NOT ASSIGNED
The indicators previously described are proposed because the necessary data exist and are of relevance
for international data collection. If there are additional indicators of relevance for stakeholders in the
pilot countries, they can be proposed and produced on the basis of a well‐defined methodology which
should be set out in advance.
REQUIRED SOURCE DATA
The new indicators proposed by country stakeholders can be based on the source data description
provided in Description of the Required Source Data, or, alternatively, other data sources can be
proposed (extended additional attributes or new data sources).
CALCULATION METHODOLOGY
The proposed methodology should follow the general tier‐based description.
DISAGGREGATION
The proposed disaggregation should be detailed.
EXPECTED RESULTS: AN EXAMPLE
An example of the expected results should be provided.
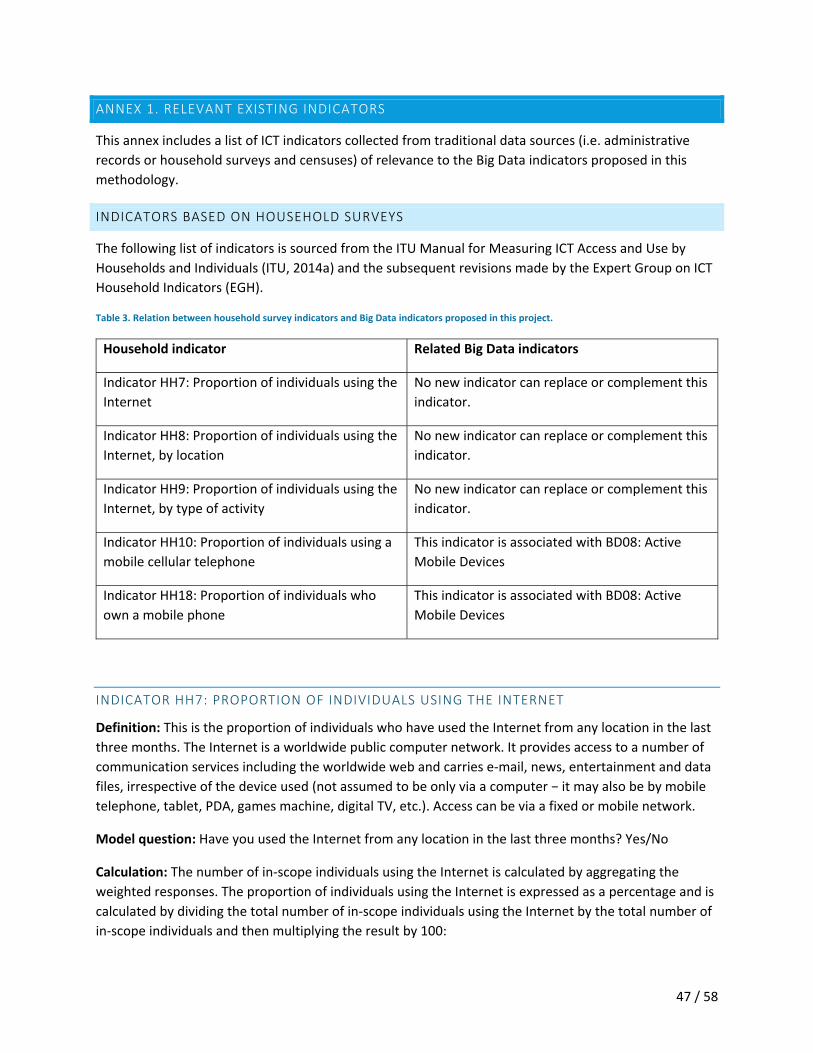
47 / 58
ANNEX 1. RELEVANT EXISTING INDICATORS
This annex includes a list of ICT indicators collected from traditional data sources (i.e. administrative
records or household surveys and censuses) of relevance to the Big Data indicators proposed in this
methodology.
INDICATORS BASED ON HOUSEHOLD SURVEYS
The following list of indicators is sourced from the ITU Manual for Measuring ICT Access and Use by
Households and Individuals (ITU, 2014a) and the subsequent revisions made by the Expert Group on ICT
Household Indicators (EGH).
Table 3. Relation between household survey indicators and Big Data indicators proposed in this project.
Household indicator Related Big Data indicators
Indicator HH7: Proportion of individuals using the
Internet
No new indicator can replace or complement this
indicator.
Indicator HH8: Proportion of individuals using the
Internet, by location
No new indicator can replace or complement this
indicator.
Indicator HH9: Proportion of individuals using the
Internet, by type of activity
No new indicator can replace or complement this
indicator.
Indicator HH10: Proportion of individuals using a
mobile cellular telephone
This indicator is associated with BD08: Active
Mobile Devices
Indicator HH18: Proportion of individuals who
own a mobile phone
This indicator is associated with BD08: Active
Mobile Devices
INDICATOR HH7: PROPORTION OF INDIVIDUALS USING THE INTERNET
Definition: This is the proportion of individuals who have used the Internet from any location in the last
three months. The Internet is a worldwide public computer network. It provides access to a number of
communication services including the worldwide web and carries e‐mail, news, entertainment and data
files, irrespective of the device used (not assumed to be only via a computer − it may also be by mobile
telephone, tablet, PDA, games machine, digital TV, etc.). Access can be via a fixed or mobile network.
Model question: Have you used the Internet from any location in the last three months? Yes/No
Calculation: The number of in‐scope individuals using the Internet is calculated by aggregating the
weighted responses. The proportion of individuals using the Internet is expressed as a percentage and is
calculated by dividing the total number of in‐scope individuals using the Internet by the total number of
in‐scope individuals and then multiplying the result by 100:

48 / 58
HH7% = [(number of in‐scope individuals using the Internet) / (total number of in‐scope
individuals)]*100
For more information on this indicator please refer to ITU (2014a).
INDICATOR HH8: PROPORTION OF INDIVIDUALS USING THE INTERNET, BY LOCATION
Definition: This is the proportion of individuals who have used the Internet from specified locations in
the last three months that have access to a number of communication services including the worldwide
web and carries e‐mail, news, entertainment and data files, irrespective of the device used (not
assumed to be only via a computer − it may also be by mobile telephone, tablet, PDA, games machine,
digital TV, etc.). Access can be via a fixed or mobile network, including wireless access at a WiFi
‘hotspot’. Access via a mobile device should be classified to the appropriate location or to “in mobility”,
that is, while mobile.
Locations of Internet use are defined as follows:
Home
Work: a person whose workplace is located at home would answer yes to the home category
only.
Place of education: applies only to students. Teachers and others who work at a place of
education would report “work” as the place of Internet use. If a place of education is also made
available as a location for general community Internet use, such use should be reported in the
Community Internet access facility category.
Another person’s home: the home of a friend, relative or neighbour.
Community Internet access facility (typically free of charge): Internet use at community facilities
such as public libraries, publicly provided Internet kiosks, non‐commercial telecentres, digital
community centres, post offices, other government agencies. Access is typically free and
available to the general public.
Commercial Internet access facility (typically not free of charge): Internet use at publicly
available commercial facilities such as Internet cafés or cybercafés, hotels, airports etc., where
access is typically paid for.
In mobility: Use of the Internet while mobile, via a mobile cellular telephone (including devices
with mobile telephone functionality) or other mobile access devices, for example, a laptop
computer, tablet or other hand‐held device connected to a mobile phone network.
Model question: Where did you use the Internet in the last three months? Respondents should select all
locations that apply (see above).
Calculation: The number of in‐scope individuals using the Internet from a specific location is calculated
by aggregating the weighted responses for each location. Proportions are expressed as percentages and
are calculated by dividing the number of in‐scope individuals using the Internet from a specific location
by either the total number of in‐scope individuals using the Internet (see HH7) or by the total number of
in‐scope individuals, and then multiplying the result by 100.
Examples:

49 / 58
The percentage of Internet users using the Internet at home is calculated as:
HH8%Internet users home = [(number of in‐scope individuals using the Internet at home) / (total
number of in‐scope individuals using the Internet)]*100
The percentage of in‐scope individuals using the Internet at home is calculated as:
HH8%Individuals home = [(number of in‐scope individuals using the Internet at home) / (total
number of in‐scope individuals)]*100
For more information on this indicator please refer to ITU (2014a).
INDICATOR HH9: PROPORTION OF INDIVIDUALS USING THE INTERNET, BY TYPE OF ACTIVITY
Definition: This is the proportion of individuals who undertook one or more activities using the Internet
for private (defined as non‐work) purposes from any location in the last three months. Internet activities
are defined as follows:
Getting information about goods or services.
Seeking health information (on injury, disease, nutrition, etc.).
Making an appointment with a health practitioner via a website.
Getting information from general government organizations.
Interacting with general government organizations (downloading/requesting forms,
completing/lodging forms online, making online payments and purchasing from government
organizations etc.).
Sending or receiving e‐mail.
Telephoning over the Internet/VoIP (using Skype, iTalk, etc.; includes video calls via webcam).
Participating in social networks (creating user profile, posting messages or other contributions
to Facebook, Twitter etc.).
Accessing chat sites, blogs, newsgroups or online discussions.
Purchasing or ordering goods or services (purchase orders placed via the Internet whether or
not payment was made online; excludes orders that were cancelled or not completed; includes
purchasing of products such as music, travel and accommodation via the Internet).
Selling goods or services (via eBay, Mercado libre, Facebook etc.).
Using services related to travel or travel‐related accommodation.
Internet banking (includes electronic transactions with a bank for payment, transfers, etc., or for
looking up account information; excludes electronic transactions via the Internet for other types
of financial services such as share purchases, financial services and insurance).
Doing a formal online course (in any subject).
Consulting wikis (Wikipedia etc.), online encyclopedias or other websites for formal learning
purposes.
Listening to web radio (either paid or free of charge).
Watching web television (either paid or free of charge).
Streaming or downloading images, movies, videos or music; playing or downloading games
(either paid or free of charge).

50 / 58
Downloading software or applications (includes patches and upgrades, either paid or free of
charge).
Reading or downloading online newspapers or magazines, electronic books (includes accessing
news websites, either paid or free of charge; includes subscriptions to online news services).
Looking for a job or sending/submitting a job application (includes searching specific web sites
for a job; sending/submitting an application online).
Participating in professional networks (professional networks are also seen in the broader
context of social networking and have the same requirement of profile creation, contributing
through messaging or chat, or uploading text or audio‐visual content files; examples of
professional or business networks are LinkedIn and Xing).
Managing personal/own homepage.
Uploading self/user‐created content to a website to be shared (text, images, photos, videos,
music, software, etc.).
Blogging: maintaining or adding contents to a blog.
Posting opinions on civic or political issues via websites (blogs, social networks, etc.) that may be
created by any individual or organization.
Taking part in online consultations or voting to define civic or political issues (urban planning,
signing a petition etc.).
Using storage space on the Internet to save documents, pictures, music, video or other files (e.g.
Google Drive, Dropbox, Windows Skydrive, iCloud, Amazon Cloud Drive).
Using software run over the Internet for editing text documents, spreadsheets or presentations.
Model question: For which of the following activities did you use the Internet for private purposes (from
any location) in the last three months? Respondents should select all activities that apply (see above).
Calculation: The number of in‐scope individuals using the Internet for a specific activity is calculated by
aggregating the weighted responses for each activity. Proportions are expressed as percentages and are
calculated by dividing the number of in‐scope individuals using the Internet for a specific activity by
either the total number of in‐scope individuals using the Internet (see HH7) or by the total number of in‐
scope individuals, and then multiplying the result by 100.
Examples:
The percentage of Internet users who undertook Internet banking is calculated as:
HH9%Internet users banking = [(number of in‐scope individuals who used the Internet for
banking) / (total number of in‐scope individuals who used the Internet)]*100.
The percentage of in‐scope individuals using the Internet for Internet banking is calculated as:
HH9%Individuals banking = [(number of in‐scope individuals who used the Internet for banking)
/ (total number of in‐scope individuals)]*100.
For more information on this indicator please refer to ITU (2014a).

51 / 58
INDICATOR HH10: PROPORTION OF INDIVIDUALS USING A MOBILE CELLULAR TELEPHONE
Definition: This is the proportion of individuals who used a mobile telephone in the last three months. A
mobile (cellular) telephone refers to a portable telephone subscribing to a public mobile telephone
service using cellular technology, which provides access to the PSTN. This includes analogue and digital
cellular systems and technologies such as IMT‐2000 (3G) and IMT‐Advanced. Users of both postpaid
subscriptions and prepaid accounts are included.
Model question: Have you used a mobile telephone in the last three months? Yes/No
Calculation: The number of in‐scope individuals using a mobile cellular telephone is calculated by
aggregating the weighted responses. The proportion of individuals using a mobile telephone is
expressed as a percentage and is calculated by dividing the total number of in‐scope individuals using a
mobile telephone by the total number of in‐scope individuals, and then multiplying the result by 100.
HH10% = [(number of in‐scope individuals using a mobile cellular telephone) / (total number of in‐scope
individuals)]*100.
For more information on this indicator please refer to ITU (2014a).
INDICATOR HH18: PROPORTION OF INDIVIDUALS WHO OWN A MOBILE PHONE
Definition: This is the proportion of individuals who own a mobile phone. An individual owns a mobile
cellular phone if he/she has a mobile cellular phone device with at least one active SIM card for personal
use. This includes mobile cellular phones supplied by employers that can be used for personal reasons
(to make personal calls, access the Internet, etc.) and those who have a mobile phone for personal use
that is not registered under his/her name. It excludes individuals who have only active SIM card(s) and
not a mobile phone device.
The indicator is relatively new and is therefore not included in the 2014 edition of the Manual (ITU,
2014a).
INDICATORS FROM ADMINISTRATIVE DATA SOURCES
The following list of indicators is sourced from the ITU Handbook for the Collection of Administrative
Data on Telecommunications/ICT (ITU, 2011) and the subsequent revisions carried out by the Expert
Group on Telecommunication/ICT Indicators.
Table 4. Relation between ICT indicators from administrative records and Big Data indicators proposed in this project
ICT indicator Related Big Data indicators
Percentage of the land area covered by mobile‐
cellular network (i271Land)
This indicator is associated with BD01:
Percentage of the Land Area Covered by A
Mobile‐Cellular Network, by Technology

52 / 58
Percentage of the population covered by a
mobile‐cellular network (i271pop)
This indicator is associated with BD02:
Percentage of the Population Covered by a
Mobile‐Cellular Network, by Technology
Percentage of the population covered by at least
a 3G mobile network (i271G)
This indicator is associated with BD02:
Percentage of the Population Covered by a
Mobile‐Cellular Network, by Technology
Fixed‐broadband subscriptions (i4213tfbb), by
technology
This indicator is associated with BD14: Fixed‐
Broadband Subscriptions, by Technology
Fixed‐broadband subscriptions (i4213tfbb), by
speed
This indicator is associated with BD15: Fixed‐
Broadband Subscriptions, by Speed
Active mobile‐broadband subscriptions (i271mw) This indicator is associated with BD06: Active
Mobile Voice and Broadband Subscriptions, by
Contract Type
Roaming by foreign subscribers (inbound
roaming), in minutes (i1336wm)
This indicator is associated with BD13: Inbound
Roaming Subscriptions per Foreign Tourist
Fixed‐broadband Internet traffic (exabytes)
(i135tfb)
This indicator is associated with BD10: Fixed‐
Broadband Traffic, by Speed, Contract Type
Mobile‐broadband Internet traffic (within the
country) (i136mwi)
This indicator is associated with BD11: Domestic
mobile‐Broadband Traffic, by Contract Type,
Technology
Mobile‐broadband Internet traffic (outside the
country, roaming out) (i136mwo)
This indicator is associated with BD12:
International mobile‐Broadband Traffic, by
Contract Type
PERCENTAGE OF THE LAND AREA COVERED BY MOBILE‐CELLULAR NETWORK (I271LAND)
Definition: Percentage of the land area covered by mobile‐cellular network refers to the total mobile‐
cellular coverage of the land area in per cent. This is calculated by dividing the land area covered by a
mobile‐cellular signal by the total land area and multiplying by 100.
Method of collection: The data can be collected from licensed mobile‐cellular operators in the country.
However, they are likely to have different coverage locations. Another method would be to request each
operator’s coverage maps. These could then be compared in order to determine the total land area
covered by any mobile‐cellular signal.
For more information on this indicator, please refer to ITU (2011).
PERCENTAGE OF THE POPULATION COVERED BY A MOBILE‐CELLULAR NETWORK (I271POP)
53 / 58
Definition: Percentage of the population covered by a mobile‐cellular network refers to the percentage
of inhabitants within range of a mobile‐cellular signal, irrespective of whether or not they are
subscribers or users. This is calculated by dividing the number of inhabitants within range of a mobile‐
cellular signal by the total population and multiplying by 100.
Method of collection: The data can be collected from licensed mobile‐cellular operators. However, they
are likely to have different levels and locations of coverage. Another method would be to request each
operator’s coverage maps, which can be overlaid with maps showing the country’s population.
For more information on this indicator, please refer to ITU (2011).
PERCENTAGE OF THE POPULATION COVERED BY AT LEAST A 3G MOBILE NETWORK (I271G)
Definition: Percentage of the population covered by at least a 3G mobile network refers to the
percentage of inhabitants within range of at least a 3G mobile‐cellular signal, whether or not they are
subscribers. This is calculated by dividing the number of inhabitants covered by at least a 3G mobile‐
cellular signal by the total population and multiplying by 100. It excludes people covered only by GPRS,
EDGE or CDMA 1xRTT.
Method of collection: The data can be collected from licensed 3G mobile‐cellular operators in the
country. However, they are likely to have different levels and locations of coverage. Another method
would be to request each operator’s 3G coverage maps, which can then be overlaid with maps showing
the country’s population.
For more information on this indicator, please refer to ITU (2011) and ITU (2017a).
FIXED‐BROADBAND SUBSCRIPTIONS (I4213TFBB), BY TECHNOLOGY
Definition: Fixed‐broadband subscriptions, by technology, refers to fixed subscriptions for high‐
speed access to the public Internet (a TCP/IP connection), at downstream speeds equal to or
greater than 256 kbps. This includes cable modem, DSL, fibre‐to‐the‐home/building, other fixed
(wired)‐broadband subscriptions, satellite broadband and terrestrial fixed wireless broadband.
This total is measured irrespective of the method of payment. It excludes subscriptions allowing
access to data communications (including the Internet) via mobile‐cellular networks. It should
include fixed WiMAX and any other fixed wireless technologies. It includes both residential
subscriptions and subscriptions for organizations. The indicator can be broken down as follows:
Cable modem Internet subscriptions (i4213cab)
DSL Internet subscriptions (i4213dsl)
Fibre‐to‐the‐home/building Internet subscriptions (i4213ftth/b)
Other fixed (wired)‐broadband subscriptions (i4213ob)
Satellite broadband subscriptions (i271s)
Fixed wireless broadband subscriptions (i271fw).
Method of collection: The data can be collected by asking all ISPs in the country to provide the number
of their fixed‐broadband subscriptions (by type – cable, DSL, fibre‐optic, other wired, fixed wireless).

54 / 58
This indicator can be divided by the population and multiplied by 100 to obtain fixed‐broadband
subscriptions per 100 inhabitants.
Calculation:
i4213tfbb = [(i4213cab) + (i4213dsl) + (i4213ftth/b) + (i4213ob) + (i271fw) + (i271s)]
For more information on this indicator please refer to ITU (2017a).
FIXED‐BROADBAND SUBSCRIPTIONS (I4213TFBB), BY SPEED
Definition: Fixed‐broadband subscriptions, by speed, refers to fixed subscriptions for high‐speed access
to the public Internet (a TCP/IP connection), at downstream speeds equal to or greater than 256 kbps.
This includes cable modem, DSL, fibre‐to‐the‐home/building, other fixed (wired)‐broadband
subscriptions, satellite broadband and terrestrial fixed wireless broadband. This total is measured
irrespective of the method of payment. It excludes subscriptions allowing access to data
communications (including the Internet) via mobile‐cellular networks. It should include fixed WiMAX
and any other fixed wireless technologies. It includes both residential subscriptions and subscriptions for
organizations. The indicator can be broken down by speeds as follows:
256 Kbps to less than 2 Mbps (4213_256to2)
2 Mbps to less than 10 Mbps (4213_2to10)
10 Mbps to less than 30 Mbps
300 Mbps to less than 100 Mbps
Equal or above 100 Mbps.
Method of collection: The data can be collected by asking each ISP in the country to provide the number
of their fixed (wired)‐broadband subscriptions by the speeds indicated for this group of indicators. The
data can then be added up to obtain the country totals.
For more information on this indicator please refer to ITU (2011) and ITU (2017b).
ACTIVE MOBILE‐BROADBAND SUBSCRIPTIONS (I271MW)
Definition: Active mobile‐broadband subscriptions refers to the sum of active handset‐based and
computer‐based (USB/dongles) mobile‐broadband subscriptions to the public Internet. It covers actual
subscribers, not potential subscribers, even though the latter may have broadband‐enabled handsets.
Subscriptions must include a recurring subscription fee or pass a usage requirement (users must have
accessed the Internet in the last three months). It includes subscriptions to mobile‐broadband networks
that provide download speeds of at least 256 kbps (e.g. WCDMA, HSPA, CDMA2000 1x EV‐DO, WiMAX
IEEE 802.16e and LTE), and excludes subscriptions that only have access to GPRS, EDGE and CDMA
1xRTT. This indicator can be further broken down into:
Data and voice mobile‐broadband subscriptions (i271mb_active). This refers to subscriptions to
mobile‐broadband services that allow access to the open Internet via HTTP and in which data
services are contracted together with voice services (mobile voice and data plans) or as an add‐
55 / 58
on package to a voice plan. These are typically smartphone‐based subscriptions with voice and
data services used in the same terminal. Data and voice mobile‐broadband subscriptions with
specific recurring subscription fees for Internet access are included regardless of actual use.
Prepaid and pay‐per‐use data and voice mobile‐broadband subscriptions should only be counted
if they have been used to access the Internet in the last three months. M2M subscriptions
should be excluded. The indicator includes subscriptions to mobile networks that provide
download speeds of at least 256 kbps (e.g. WCDMA, HSPA, CDMA2000 1x EV‐DO, WiMAX IEEE
802.16e and LTE), and excludes lower‐speed technologies such as GPRS, EDGE and CDMA 1xRTT.
Data‐only mobile‐broadband subscriptions (i271md). Refers to subscriptions to mobile
broadband services that allow access to the open Internet via HTTP and that do not include
voice services, i.e. subscriptions that offer mobile broadband as a standalone service, such as
mobile‐broadband subscriptions for datacards, USB modem/dongle and tablets. Data‐only
mobile‐broadband subscriptions with recurring subscription fees are included regardless of
actual use. Prepaid and pay‐per‐use data‐only mobile‐broadband subscriptions should only be
counted if they have been used to access the Internet in the last three months. M2M
subscriptions should be excluded. The indicator includes subscriptions to mobile networks that
provide download speeds of at least 256 kbps (e.g. WCDMA, HSPA, CDMA2000 1x EV‐DO,
WiMAX IEEE 802.16e and LTE), and excludes lower‐speed technologies such as GPRS, EDGE and
CDMA 1xRTT. It excludes data subscriptions that are contracted together with mobile voice
services.
Method of collection: The data can be collected from licensed mobile operators in the country that
offer mobile‐broadband services providing access to the Internet. These operators should have mobile‐
broadband networks that provide download speeds of at least 256 Kbps (e.g. WCDMA, HSPA,
CDMA2000 1x EV‐DO, WiMAX IEEE 802.16e and LTE). Data are then aggregated at the country level.
For more information on this indicator please refer to ITU (2017).
ROAMING BY FOREIGN SUBSCRIBERS (INBOUND ROAMING), IN MINUTES (I1336WM)
Definition: Roaming by foreign subscribers (inbound roaming) refers to the total call minutes of visiting
(foreign) subscribers making and receiving calls within a country (inbound roaming). This indicator refers
to the roaming traffic of foreign mobile subscribers, in minutes (the traffic they generate when they are
roaming in the country to which the data refer). It does not refer to international traffic originating on
mobile networks in the country, nor to domestic mobile subscribers generating roaming traffic abroad.
Method of collection: The data can be obtained from mobile‐telephone operators in the country, and
then aggregated at the country level.
For more information on this indicator please refer to ITU (2011).
FIXED‐BROADBAND INTERNET TRAFFIC (EXABYTES) (I135TFB)

56 / 58
Definition: Fixed‐broadband Internet traffic (exabytes) refers to traffic generated by fixed‐broadband
subscribers, measured at the end‐user access point. It should be measured by adding up download and
upload traffic. Wholesale traffic, walled‐garden traffic and IPTV and cable‐TV traffic should be excluded.
For more information on this indicator please refer to ITU (2014b).
MOBILE‐BROADBAND INTERNET TRAFFIC (WITHIN THE COUNTRY) (I136MWI)
Definition: Mobile‐broadband Internet traffic (within the country) refers to broadband traffic volumes
originated within the country from 3G networks or other more advanced mobile networks, including 3G
upgrades, evolutions or equivalent standards in terms of data transmission speeds. Traffic data should
be collected and aggregated at the country level for all 3G or more advanced mobile networks within
the country. Download and upload traffic should be added up and reported together. Traffic should be
measured at the end‐user access point. Wholesale and walled‐garden traffic should be excluded. The
traffic should be reported in exabytes.
For more information on this indicator please refer to ITU (2014b).
MOBILE‐BROADBAND INTERNET TRAFFIC (OUTSIDE THE COUNTRY, ROAMING OUT)
(I136MWO)
Definition: Mobile‐broadband Internet traffic (outside the country, roaming out) refers to broadband
traffic volumes originated outside the country from 3G networks or other more advanced mobile
networks, including 3G upgrades, evolutions or equivalent standards in terms of data transmission
speeds. Traffic data should be collected and aggregated at the country level for all customers of
domestic operators roaming outside the country and using 3G or more advanced mobile networks.
Download and upload traffic should be added up and reported together. Traffic should be measured at
the end‐user access point. Wholesale and walled‐garden traffic should be excluded. Traffic should be
reported in exabytes.
For more information on this indicator please refer to ITU (2014b).
REFERENCES
ITU (2011). ITU Handbook for the Collection of Administrative Data on Telecommunications/ICT,
Geneva, 2011. http://www.itu.int/en/ITU‐D/Statistics/Pages/publications/handbook.aspx.
ITU (2014a). Manual for Measuring ICT Access and Use by Households and Individuals, Geneva, 2014.
http://www.itu.int/en/ITU‐D/Statistics/Pages/publications/manual2014.aspx.
ITU (2014b). Covering Note: New telecommunication/ICT indicators from administrative data sources,
2011‐2013, https://www.itu.int/dms_pub/itu‐d/opb/ind/D‐IND‐ITC_IND_HBK‐2011‐C1‐PDF‐E.pdf.
ITU (2017a). ITU World Telecommunication/ICT Indicators Long Questionnaire 2017,
http://www.itu.int/en/ITU‐D/Statistics/Documents/datacollection/ITU_LQ_2017.pdf.

57 / 58
ITU (2017b). Summary of 8th Meeting of the ITU Expert Group on Telecommunication/ICT Indicators,
https://www.itu.int/net4/ITU‐D/ExpertGroup/topic.asp?TOPIC_ID=6284.