big data: beyond the buzzword - ey - united states data: beyond the buzzword transformative trends...
TRANSCRIPT
Big Data:Beyond the buzzwordTransformative trends in the property sector

2 | Big Data: Beyond the buzzword Transformative trends in the property sector2 | Big Data: Beyond the buzzword Transformative trends in the property sector

3Big Data: Beyond the buzzword Transformative trends in the property sector |
Every second we create new data. And every day our ability to create, analyse and investigate data is growing.Consider this: we generated more data in the last two years than in our entire previous history. By 2020, around 1.7 megabytes of new information will be created every second for every human being on the planet.
The data we generate today – from the tiny data point of a single step to the plethora of information generated by the watch on your wrist, the phone in your pocket, the car you drive and the spaces you occupy – is quite simply mind–bending.
The recent report, Will the Australian property industry seize the upside of disruption? by EY, the Property Council of Australia and the Green Building Council of Australia explored how disruptive technological innovations are gaining a foothold in every area of our lives. This is the first in a series of white papers to further unpack the opportunities outlined in this report.
Some organisations and industries are adept at understanding data – hello Facebook, Amazon and Google.
According to the Wall Street Journal, Amazon, Alphabet and Microsoft together racked up nearly $32bn in capital expenditure and capital leases in 2016, up by 22 percent from the previous year.
However, a recent Forrester survey reveals that these companies are in the minority. While 74 percent of firms aspire to be data–driven, only 29 percent agree that they’re good at translating analytics into measureable results.
On the whole, the property sector is still sitting low on the EY analytics maturity curve (see Figure 1), and is building a data foundation. But at the very tip of the maturity curve is an entirely new way of thinking - one which augments human decision-making with artificial intelligence.
3Big Data: Beyond the buzzword Transformative trends in the property sector |

4 | Big Data: Beyond the buzzword Transformative trends in the property sector
What is big data?The term ‘big data’ can feel like the latest buzzword but essentially what we are talking about is harvesting data en masse across multiple sources, and looking for both patterns and anomalies to provide insights that can lead to better business outcomes.
The Economist has hailed data as “the oil of the future”. As a driver of growth and change, flows of data have “created new infrastructure, new businesses, new monopolies, new politics and - crucially - new economics.”
Of course, companies have always collected and analysed data. But in the past, storing vast amounts of information was challenging. New technologies have eased this burden. At the same time, sensors, smart metering, wearable technology and social media, not to mention RFID chips in credit cards, online transactions and more, are generating data at an ever-increasing rate.
Connecting and correlating these disparate sources of data can unearth a treasure trove of insights to drive business efficiencies and reduce costs, analyse risks, predict behaviours and outcomes, optimise current offerings or develop new ones, and guide smarter strategy.
As our technological efficiency grows, big data will be less about the size of a dataset and more about high-level analytics and methodologies used to gather insights that inform data-driven decision making. Capturing the power of big data needs to be accompanied by a fundamental cultural shift in the way businesses operate. The overall approach to the integration and utilisation of analytics, outlined in Figure 1, further demonstrates how companies need to realign thinking to harness the power of data and analytics, and build an iterative process into strategy and business operations.
When we talk about big data as it relates to the property sector it is useful to consider its place and impact across the value chain.
Creation - data informed development, design, construction and investment.
Utilisation - asset effectiveness and efficiency.
Participation - customer end-to-end journeys.
At each stage of this value chain it is critical that valuation be embedded in assessing the return to shareholders, customers and communities.

Figure 1: Analytics maturity curve
The human elementConsuming and actioning the insights from data and advanced analytics
Technical capabilityProducing insights through data and analytics
5Big Data: Beyond the buzzword Transformative trends in the property sector |
Executive insightData is used at highest levels for macro decision-making
Management insightFact-based decision-making shifts to management
Semi-operational insightData is used to inform actions and make decisions
Operationalised insightData is the basis for all decision-making and action across the organisation
Automated insight with cognitive and AIData is used in systems that emulate human decision-making processes to enable informed, automated responses to questions
Build a data foundationA trusted central data source supports corporate strategy
Develop trusted insightsDashboards and reports add value to executive decision-making
Explore & analyse data insightsDeeper insights are uncovered using analysis and diagnostics on historical data
Predict what will happen nextInsights are translated into action with advanced analytics
Prescribe next best actionProcesses and resources are optimised to maximise profits and efficiencies
Augmenting human intelligence with cognitive and AISoftware learns and responds like a human when using unstructured data to answer questions
6 | Big Data: Beyond the buzzword Transformative trends in the property sector
Creation
Case studies
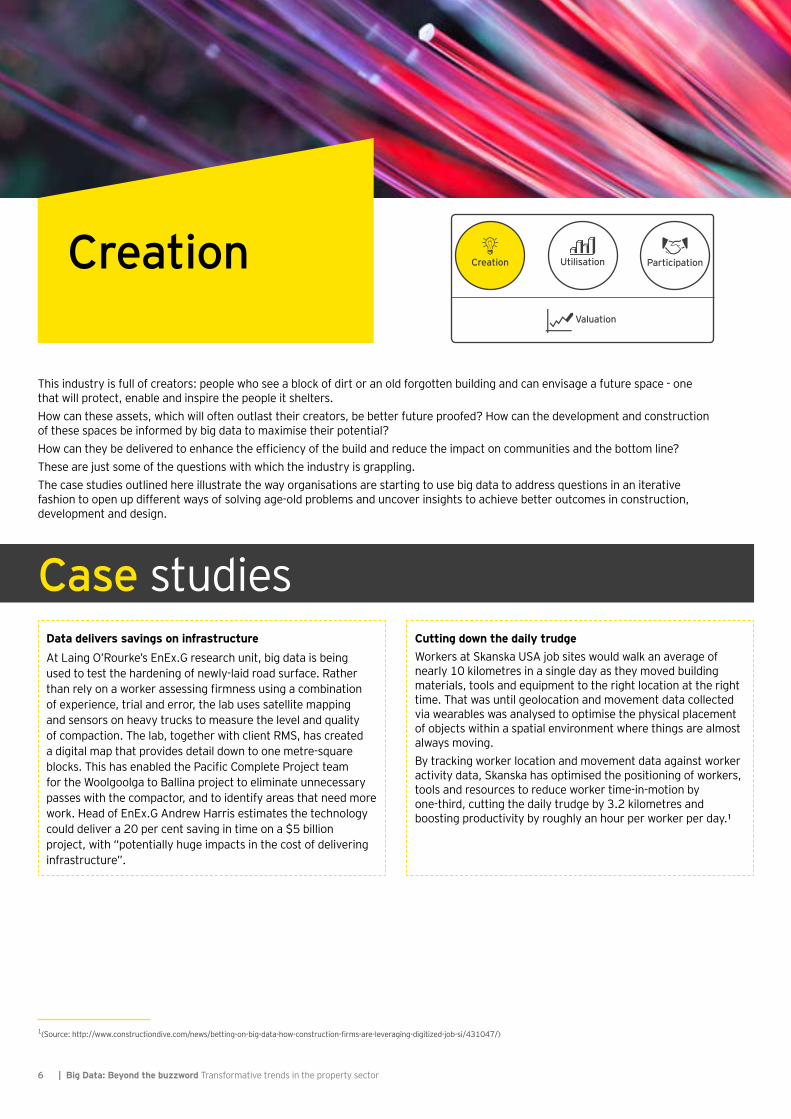
This industry is full of creators: people who see a block of dirt or an old forgotten building and can envisage a future space - one that will protect, enable and inspire the people it shelters.How can these assets, which will often outlast their creators, be better future proofed? How can the development and construction of these spaces be informed by big data to maximise their potential?How can they be delivered to enhance the efficiency of the build and reduce the impact on communities and the bottom line?These are just some of the questions with which the industry is grappling.The case studies outlined here illustrate the way organisations are starting to use big data to address questions in an iterative fashion to open up different ways of solving age-old problems and uncover insights to achieve better outcomes in construction, development and design.
1(Source: http://www.constructiondive.com/news/betting-on-big-data-how-construction-firms-are-leveraging-digitized-job-si/431047/)
Creation Utilisation Participation
Valuation
Data delivers savings on infrastructureAt Laing O’Rourke’s EnEx.G research unit, big data is being used to test the hardening of newly-laid road surface. Rather than rely on a worker assessing firmness using a combination of experience, trial and error, the lab uses satellite mapping and sensors on heavy trucks to measure the level and quality of compaction. The lab, together with client RMS, has created a digital map that provides detail down to one metre-square blocks. This has enabled the Pacific Complete Project team for the Woolgoolga to Ballina project to eliminate unnecessary passes with the compactor, and to identify areas that need more work. Head of EnEx.G Andrew Harris estimates the technology could deliver a 20 per cent saving in time on a $5 billion project, with “potentially huge impacts in the cost of delivering infrastructure”.
Cutting down the daily trudgeWorkers at Skanska USA job sites would walk an average of nearly 10 kilometres in a single day as they moved building materials, tools and equipment to the right location at the right time. That was until geolocation and movement data collected via wearables was analysed to optimise the physical placement of objects within a spatial environment where things are almost always moving.By tracking worker location and movement data against worker activity data, Skanska has optimised the positioning of workers, tools and resources to reduce worker time-in-motion by one-third, cutting the daily trudge by 3.2 kilometres and boosting productivity by roughly an hour per worker per day.¹
7Big Data: Beyond the buzzword Transformative trends in the property sector |
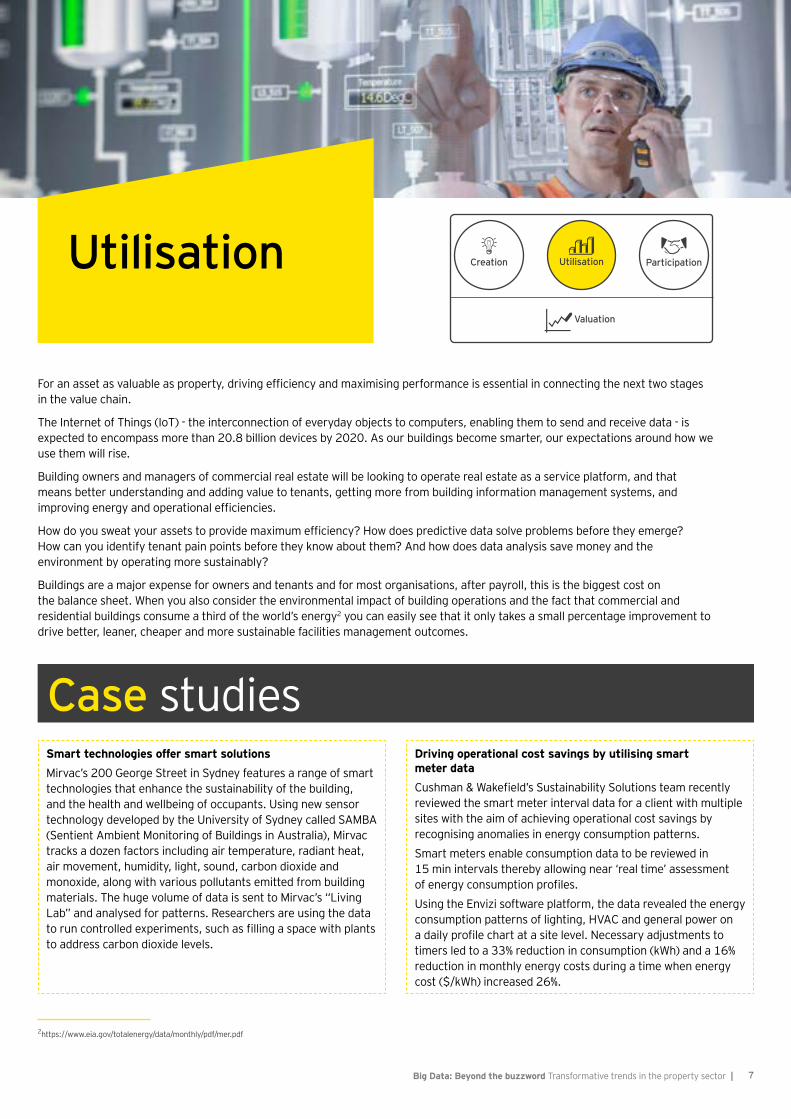
For an asset as valuable as property, driving efficiency and maximising performance is essential in connecting the next two stages in the value chain.
The Internet of Things (IoT) - the interconnection of everyday objects to computers, enabling them to send and receive data - is expected to encompass more than 20.8 billion devices by 2020. As our buildings become smarter, our expectations around how we use them will rise.
Building owners and managers of commercial real estate will be looking to operate real estate as a service platform, and that means better understanding and adding value to tenants, getting more from building information management systems, and improving energy and operational efficiencies.
How do you sweat your assets to provide maximum efficiency? How does predictive data solve problems before they emerge? How can you identify tenant pain points before they know about them? And how does data analysis save money and the environment by operating more sustainably?
Buildings are a major expense for owners and tenants and for most organisations, after payroll, this is the biggest cost on the balance sheet. When you also consider the environmental impact of building operations and the fact that commercial and residential buildings consume a third of the world’s energy2 you can easily see that it only takes a small percentage improvement to drive better, leaner, cheaper and more sustainable facilities management outcomes.
2https://www.eia.gov/totalenergy/data/monthly/pdf/mer.pdf
Utilisation
Case studies
UtilisationCreation Participation
Valuation
Smart technologies offer smart solutionsMirvac’s 200 George Street in Sydney features a range of smart technologies that enhance the sustainability of the building, and the health and wellbeing of occupants. Using new sensor technology developed by the University of Sydney called SAMBA (Sentient Ambient Monitoring of Buildings in Australia), Mirvac tracks a dozen factors including air temperature, radiant heat, air movement, humidity, light, sound, carbon dioxide and monoxide, along with various pollutants emitted from building materials. The huge volume of data is sent to Mirvac’s “Living Lab” and analysed for patterns. Researchers are using the data to run controlled experiments, such as filling a space with plants to address carbon dioxide levels.
Driving operational cost savings by utilising smart meter dataCushman & Wakefield’s Sustainability Solutions team recently reviewed the smart meter interval data for a client with multiple sites with the aim of achieving operational cost savings by recognising anomalies in energy consumption patterns.Smart meters enable consumption data to be reviewed in 15 min intervals thereby allowing near ‘real time’ assessment of energy consumption profiles.Using the Envizi software platform, the data revealed the energy consumption patterns of lighting, HVAC and general power on a daily profile chart at a site level. Necessary adjustments to timers led to a 33% reduction in consumption (kWh) and a 16% reduction in monthly energy costs during a time when energy cost ($/kWh) increased 26%.

8 | Big Data: Beyond the buzzword Transformative trends in the property sector
Creation Utilisation Participation
Valuation
Participation
Both Creation and Utilisation lay critical foundation stones to drive the third and arguably the most powerful link in the chain - Participation.
How do you anticipate which tenants are most likely to leave? How do you tailor incentives to address tenants’ key concerns at just the right level to get the deal done? How do you anticipate the needs and pain points of your customers before they even know what they are?
Assets produce a wealth of information, often kept in the silo where it has been created. Taking a holistic view of the data landscape and combining data sources, the story of the property comes alive showing us both the patterns and anomalies that help us better understand the user or customer.
The shift required is to think not of the asset but the users of the space.
Amazon has shown us the criticality of using data to know what your customer needs before they do. Those leading in the sector are thinking about customer journeys, whether that is the shopper in a mall, an office worker or someone passing through a precinct. Customer journey mapping can help us analyse what’s missing from the customer perspective. This is an exercise in analytics and data; it requires the application of a big data mindset as outlined earlier in Figure 1.
The shift to digital has created unique opportunities to measure, analyse, experiment and tune experiences in real-time.
The data that can be extracted from the asset, shown in Figure 2, is only one set of possible inputs. With proper instrumentation and systems, it’s possible to understand every step of the customer journey, long before they arrive at the asset and long after they leave it.
This is where opportunity exists to re-imagine the role of data to enhance and enable this experience.
Looking at the end-to-end customer journey of the people who work in the offices, live in the apartments, shop at the retail spaces and inhabit the precinct creates new, exciting and challenging questions about a company’s growth strategy beyond its current core offerings.
Our most important job is to serve the 250,000 people who work in our buildings each and every day. Instead of defining ourselves by the square feet we own, we will define ourselves by the quarter million people who use the square feet and how well we tend to them.Rob Speyer CEO, Tishman Speyer
We are driven by data, and data is driven by scale. We all share one thing: the customer, and when those customers show up to shop, they aren’t thinking about their relationship with any one brand or company or store… all they want is a great experience. Steven Lowy co-CEO, Westfield
9Big Data: Beyond the buzzword Transformative trends in the property sector |
3(Source: https://www.forbes.com/sites/bernardmarr/2016/01/26/how-big-data-and-analytics-changing-hotels-and-the-hospitality-industry/#63da1d9f1c22)4(Source: http://www.cio.com/article/3070384/analytics/starwood-taps-machine-learning-to-dynamically-price-hotel-rooms.html)
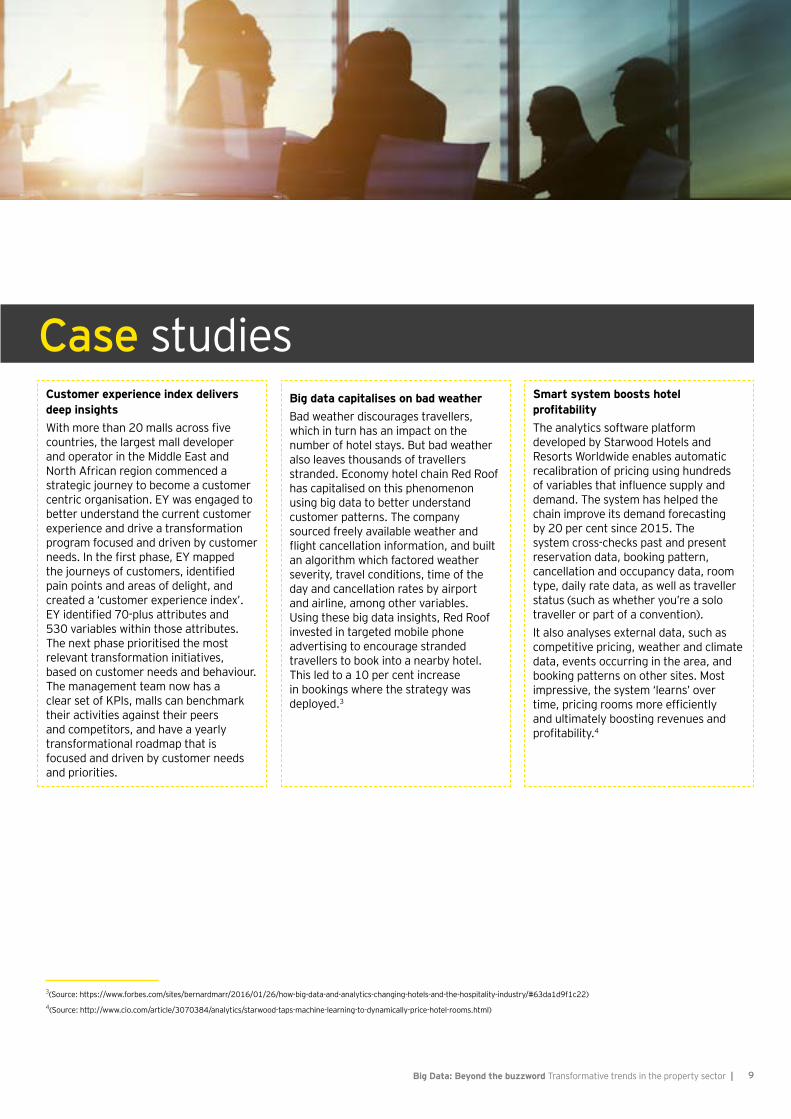
Case studiesCustomer experience index delivers deep insights With more than 20 malls across five countries, the largest mall developer and operator in the Middle East and North African region commenced a strategic journey to become a customer centric organisation. EY was engaged to better understand the current customer experience and drive a transformation program focused and driven by customer needs. In the first phase, EY mapped the journeys of customers, identified pain points and areas of delight, and created a ‘customer experience index’. EY identified 70-plus attributes and 530 variables within those attributes. The next phase prioritised the most relevant transformation initiatives, based on customer needs and behaviour. The management team now has a clear set of KPIs, malls can benchmark their activities against their peers and competitors, and have a yearly transformational roadmap that is focused and driven by customer needs and priorities.
Big data capitalises on bad weatherBad weather discourages travellers, which in turn has an impact on the number of hotel stays. But bad weather also leaves thousands of travellers stranded. Economy hotel chain Red Roof has capitalised on this phenomenon using big data to better understand customer patterns. The company sourced freely available weather and flight cancellation information, and built an algorithm which factored weather severity, travel conditions, time of the day and cancellation rates by airport and airline, among other variables. Using these big data insights, Red Roof invested in targeted mobile phone advertising to encourage stranded travellers to book into a nearby hotel. This led to a 10 per cent increase in bookings where the strategy was deployed.3
Smart system boosts hotel profitabilityThe analytics software platform developed by Starwood Hotels and Resorts Worldwide enables automatic recalibration of pricing using hundreds of variables that influence supply and demand. The system has helped the chain improve its demand forecasting by 20 per cent since 2015. The system cross-checks past and present reservation data, booking pattern, cancellation and occupancy data, room type, daily rate data, as well as traveller status (such as whether you’re a solo traveller or part of a convention).It also analyses external data, such as competitive pricing, weather and climate data, events occurring in the area, and booking patterns on other sites. Most impressive, the system ‘learns’ over time, pricing rooms more efficiently and ultimately boosting revenues and profitability.4

10 | Big Data: Beyond the buzzword Transformative trends in the property sector
CCTV streams can be used to count people and movements and even recognise individuals
01
Building sensor data can be used to improve the building environment and efficiency to improve cost and enhance environmental outcomes
02
Lift data can provide insights into peoples’
movement patterns and building efficiency
03 WiFi can capture movement
in communal areasof the asset
04
Car park ticketing andboom gate sensor data
measures visitation andcan enhance revenue
05
Issued security cards and swipes can be used to track individual accesses, working practices and behaviours to provide useful value-add insights to tenants
06
Use of digital directories provides insights into design, preferencesand demand
07Door (and other)sensors measurefoot traffic and canbe used to indicateand infer movement in addition to correlating with other data points
08
P
i
IoT
CCTV streams: counting people, their paths and visit duration01
WiFi: capturing movement and volume of people, and habitual customers02
Building sensors: ranging from temperature, to utilities consumption, lighting, doors03
Facilities data: ranging from lift, escalator, recreational data04
Sales terminal: purchase trends, outlets, quantity, location, movement 05
Car park: ticketing and boom gates help measure visitation patterns06
Mobile devices: understanding movement patterns, search sites, preferences and likes 07
Directory: insight in what visitors look for, destination, path 08
Real time campaigns: gratitude discounts, cross sale promotions 09
Digital billboards: purchase trends, specials and events10
Figure 2: Big data ecosystem

Hypothesis Thinking
Hypothesis
Interrogate
Analyse
Insight
Action
15
2
3
4
11Big Data: Beyond the buzzword Transformative trends in the property sector |
Big data must be evaluated on how it achieves better business outcomes. The truth is many companies struggle to quantify the benefits of data-driven business initiatives. For example, an EY-Forbes study, High Stakes, High Rewards, found only a third of companies can accurately measure business value to demonstrate the impact of their initiatives.
The reasons for this are technical, financial and cultural. Many companies are overwhelmed by the complexity of the task and the costs involved with capturing data. They are unsure of how to communicate the benefits of big data analysis to their stakeholders. They are also confounded by the complexity of their businesses, which make the task of isolating and measuring specific actions taken as a result of big data analysis a challenging one.
Central to this is creating a culture that embeds analytics into decision-making and embraces an iterative approach using big data to answer questions that solve problems and open up opportunities.
Valuation
The key pieces to the valuation puzzle are:Hypothesis thinking Look to solve a defined problem, uncover actionable insights and demonstrate quick wins. Then build scale by connecting across the value chain.
1
2 Set clear measurements Ensure evaluation is a key part of your project. Quantify the data-driven outcomes, and then feed learnings back into analytics for further refinement.
3 Culture trumps data Leaders must embrace and then make it clear that the analytics era demands a new way of thinking, both individually and collectively.
4 Create an environment of rapid innovation Analytics can enable breakthrough innovations, but only if the environment supports open discovery and experimentation.
UtilisationCreation Participation
Valuation

ContactsSelina Short EY Oceania Market Segment Leader for Real Estate Ernst & Young, Australia Tel: +61 459 842 115 [email protected]
Blair Delzoppo EY Partner, EYC3 Ernst & Young, Australia Tel: +61 405 627 091 [email protected]
Melissa Broadhead EY Oceania Real Estate Advisory Leader Ernst & Young, Australia Tel: + 61 422 005 949 [email protected]
12 | Big Data: Beyond the buzzword Transformative trends in the property sector

EY | Assurance | Tax | Transactions | Advisory
About EYEY is a global leader in assurance, tax, transaction and advisory services. The insights and quality services we deliver help build trust and confidence in the capital markets and in economies the world over. We develop outstanding leaders who team to deliver on our promises to all of our stakeholders. In so doing, we play a critical role in building a better working world for our people, for our clients and for our communities.
EY refers to the global organization, and may refer to one or more, of the member firms of Ernst & Young Global Limited, each of which is a separate legal entity. Ernst & Young Global Limited, a UK company limited by guarantee, does not provide services to clients. For more information about our organization, please visit ey.com.
© 2017 Ernst & Young, Australia.All Rights Reserved.
APAC no. AU00002986 ED NonePH1730527
This communication provides general information which is current at the time of production. The information contained in this communication does not constitute advice and should not be relied on as such. Professional advice should be sought prior to any action being taken in reliance on any of the information. Ernst & Young disclaims all responsibility and liability (including, without limitation, for any direct or indirect or consequential costs, loss or damage or loss of profits) arising from anything done or omitted to be done by any party in reliance, whether wholly or partially, on any of the information. Any party that relies on the information does so at its own risk. The views expressed in this article are the views of the author, not Ernst & Young. Liability limited by a scheme approved under Professional Standards Legislation.
ey.com/au