bic group press release clichy 03 august 2017 · 2017-08-03 · bic group – press release –...
TRANSCRIPT

BIC Group – Press Release – Page 1 of 12
BIC GROUP – PRESS RELEASE CLICHY – 03 AUGUST 2017
Follow BIC latest news on
SECOND QUARTER AND FIRST HALF 2017 RESULTS 1
GOOD SECOND-QUARTER PERFORMANCE BOTH IN TERMS OF NET SALES AND PROFITABILITY
• First Half Net Sales: 1,062.9 million euros, up 3.0% as reported and up 0.3% on a comparative basis2 o Second Quarter Net Sales: 593.7 million euros, up 5.6% as reported and up 3.9% on a comparative basis2
• First Half Normalized3 IFO: 219.4 million euros - Normalized3 IFO margin: 20.6% o Q2 Normalized3 IFO: 138.2 million euros - Normalized3 IFO margin: 23.3%
• First Half Net Income Group Share: 129.6 million euros, down 7.5% o EPS Group Share: 2.78 euros, down 6.7% o Normalized EPS Group Share: 3.23 euros, up 6.3%
• Net cash position at the end of June 2017: 87.2 million euros
Commenting on the First Half 2017 results, Bruno Bich, Chairman and Chief Executive Officer, said: “With a good Second Quarter performance, H1 2017 Net Sales were flat on a comparative basis. Supported by new product launches, the Stationery early Back-to-School sell-in was strong. Lighters continued to perform well in Europe and sell-in rebounded in the U.S. In Shavers, Net Sales were driven by a solid performance in Europe and Developing Markets but down in North America, reflecting the continued highly competitive environment and disruption of the category in the U.S.
As markets remain volatile for the balance of the year, coupled with recent signs of lower consumption in Brazil, we now expect to trend between 3% to 4% Full Year Organic Net Sales growth.
While we continue to invest for the long term, we are adjusting our 2017 Brand support due to market dynamics. Therefore, we expect the decrease in 2017 Normalized Income from Operations margin to be less than the – 100 basis points initially expected.”
1 Second quarter and First Half 2016 and 2017 results are accounted for and presented in accordance with IFRS 5; BIC Graphic is no longer considered as a separate category or reporting segment. BIC Graphic Europe reports to European BIC Consumer Product management. In Developing Markets, BIC Graphic operations report to their respective country's Consumer Product management. On June 30, 2017, BIC Graphic North America and Asian Sourcing operations were sold to H.I.G. Capital. 2 During the First Half of 2017, certain BIC Graphic operations in Developing Markets without a sustainable business model, were stopped. 3 See glossary page 12.
Q2 AND H1 2017 KEY OPERATIONAL FIGURES
Change in Net Sales on a comparative basis2 Normalized3 IFO margin
Q2 H1 Q2 H1
GROUP +3.9% +0.3% 23.3% 20.6%
STATIONERY +9.1% +3.3% 16.0% 11.3%
LIGHTERS +2.0% +0.8% 41.7% 39.6%
SHAVERS -0.9% -4.3% 14.1% 13.4%

BIC Group – Press Release – Page 2 of 12
KEY FIGURES (in millions euros) Q2 2017 vs. Q2 2016 H1 2017 vs. H1 2016
Q2 2016
Q2 2017
As reported
Constant currency
basis
Compa-rative basis
H1 2016
H1 2017
As reported
Constant currency
basis
Compa-rative basis
GROUP Net Sales 562.2 593.7 +5.6% +3.6% +3.9% 1,031.5 1,062.9 +3.0% +0.1% +0.3%
Gross Profit 292.2 304.5 529.0 550.2
Income From Operations 127.9 120.6 -5.7% 209.3 194.9 -6.9%
IFO margin 22.7% 20.3% 20.3% 18.3%
Normalized Income From Operations 132.1 138.2 +4.6% 213.6 219.4 +2.7%
Normalized IFO margin 23.5% 23.3% 20.7% 20.6%
Normalized IFO margin excluding the special employee bonus 23.5% 23.3%
21.6% 20.6%
Net Income Group Share 89.1 79.9 -10.3% 140.1 129.6 -7.5%
Earnings Per Share Group Share (in euros) 1.89 1.71 -9.5% 2.98 2.78 -6.7%
STATIONERY
Net Sales 241.1 264.7 +9.8% +8.3% +9.1% 408.2 428.1 +4.9% +2.8% +3.3% IFO 41.6 36.2 50.2 36.6 IFO margin 17.3% 13.7% 12.3% 8.6% Normalized IFO margin 18.0% 16.0% 12.7% 11.3% Normalized IFO margin excluding the special employee bonus 18.0% 16.0% 13.6% 11.3%
LIGHTERS
Net Sales 177.2 185.5 +4.7% +2.0% +2.0% 340.8 356.9 +4.7% +0.8% +0.8% IFO 70.6 77.3 132.7 141.2 IFO margin 39.8% 41.7% 38.9% 39.6% Normalized IFO margin 40.5% 41.7% 39.3% 39.6% Normalized IFO margin excluding the special employee bonus 40.5% 41.7% 40.0% 39.6%
SHAVERS
Net Sales 120.1 122.0 +1.6% -0.9% -0.9% 237.9 236.4 -0.6% -4.3% -4.3% IFO 15.4 17.2 28.0 31.5 IFO margin 12.8% 14.1% 11.8% 13.3% Normalized IFO margin 13.8% 14.1% 12.3% 13.4% Normalized IFO margin excluding the special employee bonus 13.8% 14.1% 13.3% 13.4%
OTHER PRODUCTS
Net Sales 23.8 21.4 -10.2% -10.7% -10.0% 44.6 41.5 -6.9% -7.7% -7.3% IFO 0.3 -10.1 -1.6 -14.4 Normalized IFO 0.4 1.3 -1.5 -1.8 Normalized IFO excluding the special employee bonus 0.4 1.3 -1.3 -1.8

BIC Group – Press Release – Page 3 of 12
GROUP OPERATIONAL TRENDS NET SALES
H1 2017 Net Sales totaled 1,062.9 million euros, up 3.0% as reported and up 0.3% on a comparative basis. The favorable impact of currency fluctuations (+2.9%) was mainly due to the appreciation of the U.S. dollar and Brazilian real against the euro. Europe and Developing markets grew by 3.7% and 2.3%, respectively, while North America declined by 3.7% on a comparative basis.
INCOME FROM OPERATIONS AND NORMALIZED INCOME FROM OPERATIONS
H1 2017 Gross Profit margin was 51.8%, compared to 51.3% in H1 2016.
H1 2017 Normalized IFO was 219.4 million euros.
KEY COMPONENTS OF THE CHANGE IN NORMALIZED IFO MARGIN (in points)
H1 2016 vs. H1 20154
Q1 2017 vs. Q1 2016
Q2 2017 vs. Q2 2016
H1 2017 vs. H1 2016
• Change in cost of production5 -0.1 +0.8 -0.3 +0.3
• Total Brand Support6 -0.8 -0.8 +0.5 -0.1 o Of which, promotions and investments related to consumer and
business development support accounted for in Gross Profit Margin -0.1 -0.1 -0.4 -0.3
o Of which, advertising, consumer and trade support -0.7 -0.7 +0.9 +0.2 • OPEX and other expenses -0.8 -1.9 -0.4 -1.2
Total change in Normalized IFO margin excluding the special employee bonus -1.7 -1.9 -0.2 -1.0 Special employee bonus -1.1 +1.9 - +0.9
• Of which, impact on Gross Profit -0.7 +1.2 - +0.5 • Of which, impact on OPEX -0.4 +0.7 - +0.4
Total change in Normalized IFO margin -2.8 0.0 -0.2 -0.1
NET INCOME AND EPS
Income before tax fell back to 194.9 million euros, from 208.5 million euros in H1 2016. Net finance revenue was nil, compared to a negative 0.8 million euros in H1 2016. H1 2016 was negatively impacted by fair value adjustments to financial assets denominated in USD when compared to December 2015.
4 Non-restated from IFRS 5 5 Gross Profit margin excluding promotions and investments related to consumer and business development support. 6 Total Brand Support: consumer and business development support + advertising, consumer and trade support.
NON-RECURRING ITEMS Q1 Q2 H1
(in million euros) 2016 2017 2016 2017 2016 2017 Income From Operations 81.4 74.3 127.9 120.6 209.3 194.9 As % of Net Sales 17.3% 15.8% 22.7% 20.3% 20.3% 18.3% Restructuring costs (related primarily to BIC Graphic Europe and Developing Markets operations in 2017) - 7.0 4.2 17.6 4.2 24.5
Normalized IFO 81.4 81.3 132.1 138.2 213.6 219.4 As % of Net Sales 17.3% 17.3% 23.5% 23.3% 20.7% 20.6% Special employee bonus 8.8 - - - 8.8 - Normalized IFO excluding the special employee bonus 90.2 81.3 132.1 138.2 222.3 219.4 As % of Net Sales 19.2 % 17.3% 23.5% 23.3% 21.6% 20.6%

BIC Group – Press Release – Page 4 of 12
Net income Group Share was 129.6 million euros, a 7.5% drop as reported. The effective tax rate was 30.0% excluding the impact of the sale of BIC Graphic North America and Asian Sourcing.
• Net Income From Continuing Operations was 136.3 million euros; • Net Income From Discontinued Operations was a negative 6.7 million euros and included the net loss related to
the sale of BIC Graphic North America and Asian Sourcing. EPS Group share was 2.78 euros, compared to 2.98 euros in H1 2016, i.e. down by 6.7%. Normalized EPS Group share increased 6.3% to 3.23 euros, compared to 3.04 euros in H1 2016. EPS Group Share in Q2 2017 was 1.71 euros compared to 1.89 euros in Q2 2016, down by 9.5%.
NET CASH POSITION
At the end of June 2017, the Group’s net cash position stood at 87.2 million euros.
CHANGE IN NET CASH POSITION (in million euros)
2016 2017
NET CASH POSITION (BEGINNING OF PERIOD - DECEMBER) 448.0 222.2
• Net cash from operating activities +61.6 +77.0
o Of which operating cash flow +196.1 +198.1
o Of which change in working capital and others -134.5 -121.1
• CAPEX -74.4 -74.7
• Dividend payment -277.0 -161.0
• Share buyback program -60.7 -18.0
• Net cash from the exercise of stock options and the liquidity contract
+0.8 +0.6
• Proceeds from sale of BIC Graphic North America and Asian Sourcing7
- +55.7
• Others -0.1 -14.6
NET CASH POSITION (END OF PERIOD - JUNE) 98.2 87.2
Net cash from operating activities was +77.0 million euros, including +198.1 million euros in operating cash flow. The negative change in working capital and other items of 121.1 million euros was mainly related to the seasonality of trade receivables. Net cash was also impacted by investments in CAPEX as well as the dividend payments and share buybacks. Net cash was positively impacted by the proceeds from the sale of BIC Graphic North America and Sourcing Asia. SHAREHOLDERS’ REMUNERATION
• Ordinary dividend of 3.45 euros per share paid in May 2017.
• 18.0 million euros in share buy-backs at the end of June 2017 (160,577 shares purchased at an average price of 111.98 euros).
7 Excluding 8.8 million euros of subordinated loan.

BIC Group – Press Release – Page 5 of 12
OPERATIONAL TRENDS BY CATEGORY
STATIONERY
Stationery H1 2017 Net Sales increased by 4.9% as reported and by 3.3% on a comparative basis. Second quarter 2017 Net Sales were up 9.8% as reported and up 9.1% on a comparative basis. Developed markets
• In Europe, Net Sales grew mid-single digit thanks to a good Back-to-School sell-in in both Western and Eastern Europe. We recorded strong initial sell-in for our new products, most notably the BIC® Gelocity Illusion erasable gel pen, the BIC® Intensity Writing Felt pen and the BIC® 4-color 3+1 pen.
• In North America, Net Sales grew low-single digit. In a slightly declining market (YTD June 2017), we reinforced our leadership in Ball Pens, Mechanical Pencils and Correction products. We also benefited from the success of new products: BIC® Gelocity Quick Dry and BIC® Velocity Max Mechanical Pencil.
Developing Markets H1 2017 Net Sales grew low-single-digit with a strong second quarter.
• In Latin America, we grew low-single digit. In Brazil, we continued to gain market share thanks to both core and new products (BIC® Cristal Fashion and BIC® Cristal Up) as well as distribution gains. Mexico registered positive growth on the back of a successful back-to-school sell-in across the entire range driven by our core products, including BIC® Cristal and the BIC® Evolution® coloring range.
• In the Middle-East and Africa, sales increased double-digit with growth across all regions. South Africa back-to-school was solid, with significant market share gains. In North-West Africa, our Proximity strategy helped us to gain distribution with a broader range of products.
• Cello Pens Domestic Sales grew mid-single digit, thanks to our Champion brands strategy with successful new product launches in the ButterflowTM and GelTech ranges. We also benefited from targeted brand support investments.
H1 2017 Normalized IFO margin for Stationery was 11.3%, compared to 12.7% in H1 2016 (13.6% excluding the impact of the special employee bonus). This decline is mainly due to the reinforcement of our brand support investment plan, particularly in developing markets, and the increase in OPEX. Q2 2017 Normalized IFO margin was 16.0%, compared to 18.0% in Q2 2016, due to higher operating expenses.
LIGHTERS
H1 2017 Net Sales of Lighters increased by 4.7% as reported and by 0.8% on a constant currency basis. Second quarter 2017 Net Sales were up 4.7% as reported and up 2.0% on a constant currency basis.
Developed Markets
Europe delivered mid-single-digit growth in Net Sales, driven by good performance in both Western and Eastern Europe. North American Net Sales were stable. We gained market share in the U.S..
Developing Markets
In H1 2017, Net Sales declined at a low single-digit rate, with a good performance in Mexico, in the Middle-East and in Africa. H1 2017 Normalized IFO margin for Lighters was 39.6%, compared to 39.3% in H1 2016 (40.0% excluding the impact of the special employee bonus), due to lower Gross Profit. The increase in operating expenses was more than offset by lower Brand Support investment. Q2 2017 Normalized IFO margin was 41.7%, compared to 40.5% in Q2 2016, due to lower Brand Support investment compared to Q2 2016.

BIC Group – Press Release – Page 6 of 12
SHAVERS
H1 2017 Net Sales of Shaver's decreased by 0.6% as reported, and by 4.3% on a constant currency basis. Second quarter 2017 Net Sales grew by 1.6% as reported but decreased by 0.9% on a constant currency basis.
Developed Markets
• In Europe, Net Sales increased mid-single-digit, with high-single digit performance in Q2 2017. The solid growth in Eastern Europe was driven by the success of both core and value-added products such as the BIC® 3, the BIC® Flex 3 Hybrid and the BIC® Miss Soleil® shavers.
• In North America, Net Sales declined double-digit, with an improved trend in the second quarter compared to the first quarter. At the end of June 2017, the total U.S. wet shave market8 declined by 9.5% (-4.5% for the one-piece segment). Continued disruption in the refillable segment has led to increased competitive activity and unprecedented levels of pricing and promotional pressure in the one-piece segment, in addition to increased activity from Private labels. BIC’s market share in the one-piece segment was 26.9% at end-June, representing a 2.1-point drop on our 29.0% record market share achieved in H1 2016. Focusing on our value/performance positioning, we continued to gain market share in the 5-blade men’s one-piece segment, thanks notably to the launch of the BIC® Hybrid 5 shaver: we achieved a market share of 34.8%8, in H1 2017, up 6.4 points on H1 2016.
Developing Markets In H1 2017 the increase in Net Sales grew mid-single-digit.
• In Latin America, we recorded high-single digit growth in Net Sales with all product ranges contributing, especially the BIC® Flex 3 shaver and the BIC® Soleil® range.
• In the Middle-East and Africa, Net Sales were stable thanks to a strong Q2 (orders shifted from Q1 to Q2). H1 2017 Normalized IFO margin for Shaver's was 13.4% compared to 12.3% in H1 2016 (13.3% excluding the impact of the special employee bonus). The margin change mainly reflected the decline in North American Net Sales and higher operating expenses (including continued investments in R&D), which were offset by lower cost of production and Brand Support compared to H1 2016. Q2 2017 Normalized IFO margin was 14.1%, compared to 13.8% in Q2 2016 as a result of the same impacts as those described previously.
OTHER PRODUCTS
H1 2017 Net Sales of Other Products decreased by 6.9% as reported and by -7.3% on a comparative basis.
BIC Sport posted a mid-single-digit decrease in its Net Sales on a comparative basis.
H1 2017 Normalized IFO for Other Products was a negative 1.8 million euros, compared to a negative 1.5 million euros in H1 2016. Q2 2017 Normalized IFO for Other Products was a positive 1.3 million euros, compared with a positive 0.4 million euros in Q2 2016.
FULL YEAR 2017 OUTLOOK As markets remain volatile for the balance of the year, coupled with recent signs of lower consumption in Brazil, we now expect to trend between 3% to 4% Full Year Organic Net Sales growth.
While we continue to invest for the long term, we are adjusting our 2017 Brand support due to market dynamics. Therefore, we expect the decrease in 2017 Normalized Income from Operations margin to be less than the – 100 basis points initially expected.
8 Source: IRI total market YTD ending 02-JULY-2017 – in value terms

BIC Group – Press Release – Page 7 of 12
ACQUISITIONS – DISPOSALS - MISCELLANEOUS BIC GRAPHIC
BIC Group announced on June 30, 2017 that following the Asset and Share Purchase Agreement signed on June 6, 2017, BIC Graphic North America and Asian Sourcing operations had been sold to H.I.G. Capital. BIC Graphic North America and Asian Sourcing Assets and Liabilities have been accounted for as “Non-Current Assets Held For Sale” and “Discontinued Operations” since 31 December 2016, in accordance with IFRS 59.
9 Please refer to BIC Q1 2017 press release issued on April 26, 2017.

BIC Group – Press Release – Page 8 of 12
BIC GROUP NET SALES BY GEOGRAPHY (in million euros)
Q2 2017 vs. Q2 2016 H1 2017 vs. H1 2016
Q2 2016 Q2 2017 As
reported Comparative
basis H1 2016 H1 2017 As
reported Comparative
basis
GROUP Net Sales 562.2 593.7 +5.6% +3.9% 1,031.5 1,062.9 +3.0% +0.3% EUROPE Net Sales 170.0 177.5 +4.4% +4.8% 296.5 307.1 +3.5% +3.7% NORTH AMERICA Net Sales 236.4 242.1 +2.4% +0.7% 424.4 419.7 -1.1% -3.7% DEVELOPING MARKETS Net Sales 155.8 174.0 +11.7% +7.9% 310.6 336.1 +8.2% +2.3%
IFO AND NORMALIZED IFO BY CATEGORY (in million euros)
Q2 2016 Q2 2017 H1 2016 H1 2017
GROUP Income From Operations 127.9 120.6 209.3 194.9 Normalized Income From operations 132.1 138.2 213.6 219.4 STATIONERY Income From Operations 41.6 36.2 50.2 36.6 Normalized Income From operations 43.4 42.3 52.0 48.2 LIGHTERS Income From Operations 70.6 77.3 132.7 141.2 Normalized Income From operations 71.7 77.3 133.9 141.4 SHAVERS Income From Operations 15.4 17.2 28.0 31.5 Normalized Income From operations 16.6 17.2 29.2 31.7 OTHER PRODUCTS Income From Operations 0.3 -10.1 -1.6 -14.4 Normalized Income From operations 0.4 1.3 -1.5 -1.8
IMPACT OF CHANGE IN PERIMETER AND CURRENCY FLUCTUATIONS ON NET SALES (in %)
Q2 2016 Q2 2017 H1 2016 H1 2017
Perimeter - -0.3 - -0.2 Currencies -5.3% +2.0% -5.5% +2.9% Of which USD -1.0% +0.8% -0.1% +1.1% Of which BRL -1.0% +0.8% -1.7% +1.4% Of which ARS -0.6% -0.1% -1.1% -0.1% Of which INR -0.2% +0.2% -0.2% +0.2% Of which MXN -1.1% +0.0% -1.0% -0.2% Of which RUB and UAH -0.3% +0.2% -0.3% +0.2%
BIC Group – Press Release – Page 9 of 12
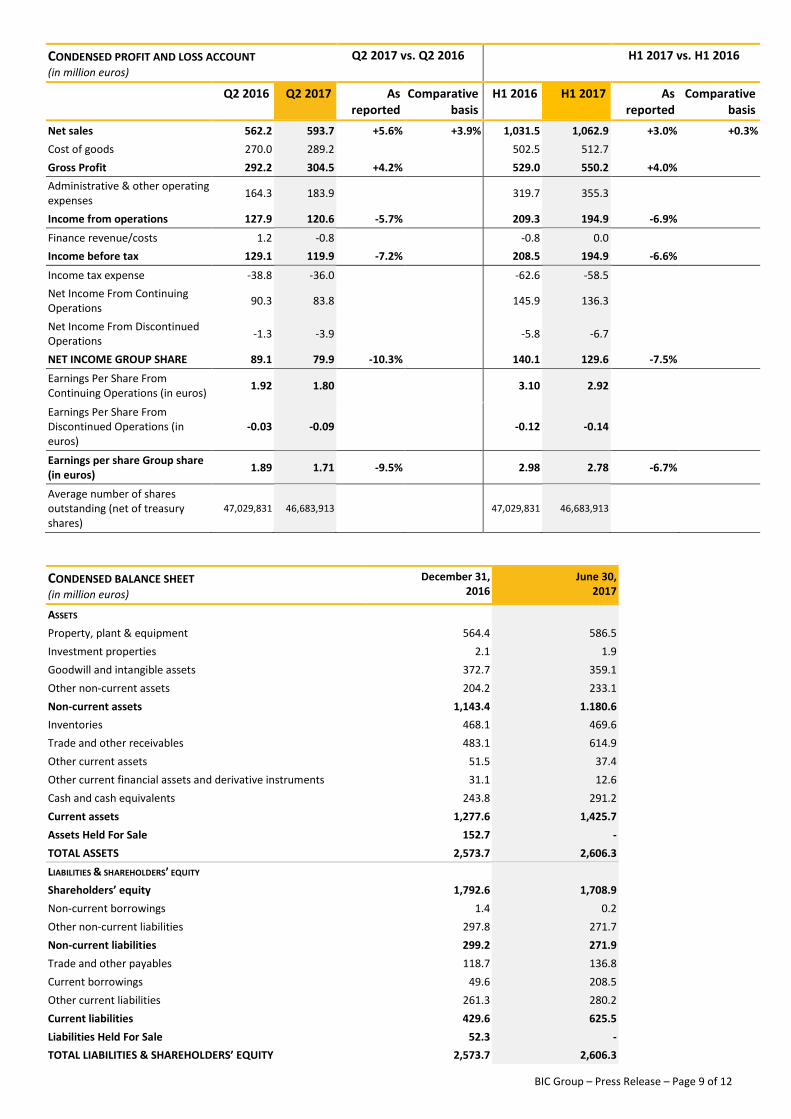
CONDENSED PROFIT AND LOSS ACCOUNT (in million euros)
Q2 2017 vs. Q2 2016 H1 2017 vs. H1 2016
Q2 2016 Q2 2017 As reported
Comparative basis
H1 2016 H1 2017 As reported
Comparative basis
Net sales 562.2 593.7 +5.6% +3.9% 1,031.5 1,062.9 +3.0% +0.3% Cost of goods 270.0 289.2 502.5 512.7 Gross Profit 292.2 304.5 +4.2% 529.0 550.2 +4.0% Administrative & other operating expenses 164.3 183.9 319.7 355.3
Income from operations 127.9 120.6 -5.7% 209.3 194.9 -6.9%
Finance revenue/costs 1.2 -0.8 -0.8 0.0 Income before tax 129.1 119.9 -7.2% 208.5 194.9 -6.6%
Income tax expense -38.8 -36.0 -62.6 -58.5 Net Income From Continuing Operations 90.3 83.8 145.9 136.3
Net Income From Discontinued Operations -1.3 -3.9 -5.8 -6.7
NET INCOME GROUP SHARE 89.1 79.9 -10.3% 140.1 129.6 -7.5%
Earnings Per Share From Continuing Operations (in euros) 1.92 1.80 3.10 2.92
Earnings Per Share From Discontinued Operations (in euros)
-0.03 -0.09 -0.12 -0.14
Earnings per share Group share (in euros) 1.89 1.71 -9.5% 2.98 2.78 -6.7%
Average number of shares outstanding (net of treasury shares)
47,029,831 46,683,913 47,029,831 46,683,913
CONDENSED BALANCE SHEET (in million euros)
December 31, 2016
June 30, 2017
ASSETS Property, plant & equipment 564.4 586.5 Investment properties 2.1 1.9 Goodwill and intangible assets 372.7 359.1 Other non-current assets 204.2 233.1 Non-current assets 1,143.4 1.180.6 Inventories 468.1 469.6 Trade and other receivables 483.1 614.9 Other current assets 51.5 37.4 Other current financial assets and derivative instruments 31.1 12.6 Cash and cash equivalents 243.8 291.2 Current assets 1,277.6 1,425.7 Assets Held For Sale 152.7 - TOTAL ASSETS 2,573.7 2,606.3 LIABILITIES & SHAREHOLDERS’ EQUITY Shareholders’ equity 1,792.6 1,708.9 Non-current borrowings 1.4 0.2 Other non-current liabilities 297.8 271.7 Non-current liabilities 299.2 271.9 Trade and other payables 118.7 136.8 Current borrowings 49.6 208.5 Other current liabilities 261.3 280.2 Current liabilities 429.6 625.5 Liabilities Held For Sale 52.3 - TOTAL LIABILITIES & SHAREHOLDERS’ EQUITY 2,573.7 2,606.3

BIC Group – Press Release – Page 10 of 12
SHARE BUY-BACK PROGRAM Number of shares
acquired
Average weighted price
in €
Amount in M€
February 2017 38,433 117.49 4.5 March 2017 42,144 115.05 4.9 April 2017 - - - May 2017 40,000 106.28 4.2 June 2017 40,000 109.14 4,4 Total 160,577 111.98 18.0
CASH FLOW STATEMENT (in million euros) FY 2016 H1 2017
Group Net income 249.7 129.6 Net income from discontinued operations -35.8 -6.7 Net income from continuing operations 285.5 136.3 Amortization and provisions 165.4 61.8 (Gain)/Loss from disposal of fixed assets -0.2 10.2 Others 2.3 -3.5 CASH FLOW FROM OPERATIONS 417.2 198.1 (Increase) / decrease in net current working capital -62.8 -125.1 Others -55.7 4.0 Net Cash from operating activities from continuing operations 276.2 70.9 Net Cash from operating activities from discontinued operations 22.5 6.1 NET CASH FROM OPERATING ACTIVITIES (A) 298.7 77.0 Net capital expenditure -178.9 -73.9 (Purchase)/Sale of other current financial assets 46.1 24.7 Divestiture of BIC Graphic North America and Asian Sourcing 0 55.7 Other Investments 0.3 -0.4 Net Cash from investing activities from continuing operations -127.2 9.5 Net Cash from investing activities from discontinued operations -5.3 -3.4 NET CASH FROM INVESTING ACTIVITIES (B) -132.5 6.1 Dividends paid -277.0 -161.0 Borrowings/(Repayments)/(loans) 19.8 130.6 Share buy-back program net of stock-options exercised -79.1 -17.4 Others -3.2 -2.7 Net Cash from financing activities from continuing operations -291,5 -48.2 Net Cash from financing activities from discontinued operations -48,0 -2.3 NET CASH FROM FINANCING ACTIVITIES (C) -339.5 -50.5
NET INCREASE/ (DECREASE) IN CASH AND CASH EQUIVALENTS NET OF BANK OVERDRAFTS (A+B+C) -173.2 32.6
OPENING CASH AND CASH EQUIVALENTS NET OF BANK OVERDRAFTS 380.6 217.4 Net increase / decrease in cash and cash equivalents net of bank overdrafts (A+B+C) -173.2 32.6 Exchange difference 10.0 -14.7 CLOSING CASH AND CASH EQUIVALENTS NET OF BANK OVERDRAFTS 217.4 235.3

BIC Group – Press Release – Page 11 of 12
RECONCILIATION WITH ALTERNATIVE PERFORMANCE MEASURES
CAPITAL AND VOTING RIGHTS, JUNE 30, 2017 As of June 30, 2017, the total number of issued shares of SOCIÉTÉ BIC was 47,582,472 shares, representing:
• 69,159,383 voting rights, • 68,210,891 voting rights excluding shares without voting rights.
Total number of treasury shares held at the end of June 2017: 948,492.
10 In the balance sheet, the line “Other current financial assets and derivative instruments” also includes 7.9 million euros and 1.7 million euros worth of derivative instruments, respectively at June 30, 217 and at December 31, 2016.
NORMALIZED IFO RECONCILIATION
(in million euros) FY 2016 H1 2017 Income From Operations 403.4 194.9 Restructuring costs (related primarily to BIC Graphic Europe and Developing Markets operations in 2017) +6.6 +24.5
Retiree Medical Adjustment in the U.S. -0.9 - Normalized IFO 409.1 219.4 Special employee bonus 8.8 - Normalized IFO excluding the special employee bonus 417.9 219.4
NORMALIZED EPS RECONCILIATION
(in euros) FY 2016 H1 2017
EPS 5.32 2.78 Impairment recognized for BIC Graphic North America and Asian sourcing +0.78 - Net loss from divestiture of BIC Graphic North America and Asian Sourcing - +0.09 Restructuring costs (related primarily to BIC Graphic Europe and Developing Markets operations in 2017) +0.15 +0.36
Retiree Medical Adjustment in the U.S. -0.01 - Normalized EPS 6.24 3.23
NET CASH RECONCILIATION (in million euros – rounded figures)
December 31, 2016
June 30, 2017
Cash and cash equivalents (1) 243.8 291.2 Other current financial assets (2)10 29.4 4.7 Current borrowings (3) -49.6 -208.5 Non-current borrowings (4) -1.4 -0.2 NET CASH POSITION (1) + (2) + (3) + (4) 222.2 87.2

BIC Group – Press Release – Page 12 of 12
GLOSSARY • Constant currency basis: constant currency figures
are calculated by translating the current year figures at prior-year monthly average exchange rates.
• Comparative basis: at constant currencies and constant perimeter. Figures at constant perimeter exclude the impacts of acquisitions and/or disposals that occurred during the current year and/or during the previous year, until their anniversary date. All Net Sales category comments are made on a comparative basis.
• Normalized IFO: normalized means excluding non-recurring items as detailed on page 3.
• Normalized IFO margin: Normalized IFO as a percentage of Net Sales.
• Net cash from operating activities: principal revenue-generating activities of the entity and other activities that are not investing or financing activities.
• Net cash position: Cash and cash equivalents + Other current financial assets - Current borrowings - Non-current borrowings.
SOCIETE BIC consolidated financial statements as of June 30, 2017, were approved by the Board of Directors on August 2, 2017. A presentation related to this announcement is also available on the BIC website (at www.bicworld.com). This document contains forward-looking statements. Although BIC believes its expectations are based on reasonable assumptions, these statements are subject to numerous risks and uncertainties. A description of the risks borne by BIC appears in the section, “Risk Factors” in BIC’s 2016 Registration Document filed with the French financial markets authority (AMF) on March 22, 2017.
CONTACTS
Investor Relations: +33 1 45 19 52 26 Press Contacts Sophie Palliez-Capian [email protected]
Priscille Reneaume: +33 1 53 70 74 70 [email protected]
Katy Bettach [email protected]
For more information, please consult the corporate website: www.bicworld.com 2017-2018 AGENDA (ALL DATES TO BE CONFIRMED)
3rd Quarter 2017 results 25 October 2017 Conference call
Full Year 2017 results 14 February 2018 Meeting – BIC Headquarters
First Quarter 2018 results 25 April 2018 Conference call
2018 AGM 16 May 2018 Meeting – BIC Headquarters
ABOUT BIC BIC is a world leader in stationery, lighters, shavers and promotional products. For more than 60 years, BIC has honored the tradition of providing high-quality, affordable products to consumers everywhere. Through this unwavering dedication and thanks to everyday efforts and investments, BIC has become one of the most recognized brands and is a trademark registered worldwide for identifying BIC products which are sold in more than 160 countries around the world. In 2016, BIC recorded Net Sales of 2,025.8 million euros. The Company is listed on “Euronext Paris” and is part of the SBF120 and CAC Mid 60 indexes. BIC is also part of the following Socially Responsible Investment indexes: CDP’s Climate A List, CDP’s Supplier Climate A List, CDP Supplier Engagement Leader Board, FTSE4Good indexes, Ethibel Sustainability Index (ESI) Excellence Europe, Euronext Vigeo – Eurozone 120, Euronext Vigeo – Europe 120, Stoxx Global ESG Leaders Index.