bias reduction by recursive mean adjustment in dynamic
TRANSCRIPT

Bias Reduction by Recursive Mean Adjustmentin Dynamic Panel Data Models
Chi-Young ChoiUniversity of New Hampshire
Nelson C. MarkUniversity of Notre Dame and NBER
Donggyu SulUniversity of Auckland
July 2, 2004
Abstract
Accurate estimation of the dominant root of a stationary but persistent time seriesare required to determine the speed at which economic time series, such as realexchange rates or interest rates, adjust towards their mean values. In practice,accuracy is hampered by downward small-sample bias. Recursive mean adjustmenthas been found to be a useful bias reduction strategy in the regression context. Inthis paper, we study recursive mean adjustment in dynamic panel data models.When there exists cross-sectional heterogeneity in the dominant root, the recursivemean adjusted SUR estimator is appropriate. When homogeneity restrictions canbe imposed, a pooled recursive mean adjusted GLS estimator with �xed e¤ectsis the desired estimator. Application of these techniques to a small panel of �veeurocurrency rates �nds that these interest rates are unit root nonstationary asthe bias-corrected autoregressive coe¢ cient exceeds 1.
Keywords: Small sample bias, Recursive mean adjustment, Panel Data, Cross-Sectional Dependence, Interest rate dyanamics
JEL Classi�cation: C23,G10
1

Introduction
Accurate estimation of the autocorrelation coe¢ cient of a stationary but persistent �rst-order autoregressive time series yt = c + �yt�1 + ut; where ut
iid� (0; �2u); must takeaccount of the downward small-sample bias that induced by running the regression witha constant. To see the source of this bias, think of running least squares without aconstant on observations that are deviations from the sample mean. Then for anyobservation t, the regression error ut is correlated with current and future values ofyt; yt+1; : : : yT . These values are embedded in the sample mean which is now a componentof the explanatory variable.1 The use of panel data does not eliminate this small samplebias. Nickell (1981), showed that the least squares dummy variable (LSDV) estimatorfor the dynamic panel regression model with cross-sectionally independent observationsis more e¢ cient than OLS but retains some downward bias even as the number of cross-sectional units goes to in�nity.Recursive mean adjustment is a bias reduction technique that has been found to
be useful in the regression context [So and Shin (1999)]. The idea is to adjust theobservations not with the sample mean but with the recursive mean, (t� 1)�1
Pt�1j=1 yj:
Because it does not contain future values of yt; one obtains an unbiased control for theconstant which orthogonal to the regression error.In this paper, we study and apply recursive mean adjustment to dynamic models for
panel data. The �rst estimator that we propose is a recursive mean adjusted seeminglyunrelated regression estimator, which is appropriate if the autoregressive coe¢ cientsacross the di¤erent time series in the panel are heterogeneous. In order to pool (imposehomogeneity across the cross-sectional units), the panel must pass a test of homogeneityrestrictions. However, such a test will su¤er from size distortion if it is based on a biasedestimator. The recursive mean adjusted seemingly unrelated regression estimator hasfamiliar asymptotic properties and achieves favorable reduction of small sample bias andthat the associated test of homogeneity restrictions is reasonably sized.Assuming that homogeneity restrictions can be imposed, sharper results can be ob-
tained by estimating under these restrictions. Here, we propose a pooled recursive meanadjusted generalized least squares estimator with �xed e¤ects. The asymptotic distribu-tion theory for this estimator also works reasonably well in small samples and a notablecontribution of the paper is that this recursive mean adjusted generalized least squaresestimator can be directly applied estimate more general AR(p) models. This is notablebecause alternative mean (median) unbiased estimators are generally unavailable in thepanel AR(p) case.The methods we discuss have a wide range of applicability. The use of panel data
1Mariott and Pope (1954) and Kendall (1954) discuss and characterize the �rst-order approximaitonof this bias. Several bias correction strategies have been suggested in the literature. These includemean unbiased estimation, median unbiased estimation, and recursive mean adjustment strategies. SeeAndrews (1993) for the exactly median unbiased estimator, Andrews and Chen (1994) for approximatelymedian unbiased estimation, and Phillips and Sul (2003a) for mean unbiased estimation.
2

has become increasingly important in areas such as �nance and international macroeco-nomics where the research focus is on estimating the speed of adjustment of price or�nancial variables. In international economics, panel data has been used to estimate thespeed of adjustment towards purchasing power parity [Frankel and Rose (1996), Papell(2004), Murray and Papell (2002) ] whereas in �nance research has emphasized the ad-justment speed of interest rate dynamics [Chan et. al. (1992), Ball and Torus (1996),Wu and Zhang (1996).]. Previous estimates that did not control for the downward bias[Gibbons and Ramaswamy (1993), Perarson and Sun (1994)] found adjustment speedsto be too fast to be consistent with the observed dynamics in bond yield data. Whenwe apply the methods to estimate the dynamics of a small panel of Eurocurrency in-terest rates, we �nd that our bias adjusted estimates imply a zero speed of adjustment.That is, short-term nominal interest rates are not mean reverting, but are unit-rootnonstationary.The remainder of the paper is organized as follows. The next section develops the
recursive seemingly unrelated regression estimator which is appropriate under cross-sectional heterogeneity and which provides a convenient framework for testing homo-geneity restrictions. Section 2 develops the recursive mean adjusted generalized leastsquares estimator for panel data with �xed e¤ects. Section 3 reports the results ofMonte Carlo experiments that compares performance across alternative estimators. InSection 4, we apply the recursive mean adjusted generalized least squares to estimatethe dynamics of interest rates using a small panel of Eurocurrency rates, and Section 5concludes.Because we discuss several di¤erent estimators with cumbersome names, we use the
following labels: RLS�recursive mean adjusted least squares estimator; RSUR�recursivemean adjusted seemingly unrelated regression estimator; RLSDV�recursive mean ad-justed least squares dummy variable estimator; RGLS�recursive mean adjusted gener-alized least squares estimator with �xed e¤ects; MLSDV�mean unbiased least squaresdummy variable estimator; MGLS�mean unbiased generalized least squares estimatorwith �xed e¤ects. In addition, feasible multivariate estimators that employ parametric(nonparametric) estimates of error covariance matrices are indicated accordingly. Theappendix contain the details of several arguments made in the text.
1 Recursive mean adjustment under heterogeneity
To �x ideas, we review recursive mean adjustment in the univariate regression context.Subsection 1.2 extends the strategy to the dynamic panel regression under parameterheterogeneity and introduces the RSUR estimator. The strategy is to use RLS to obtainbias corrected residuals in estimation of the error-covariance matrix for RSUR. TheRSUR framework also provides a convenient test of homogeneity restrictions acrosscross-sectional units.
3

1.1 Recursive Mean Adjusted Least Squares (RLS)
Assume that the time series fytg is generated by the AR(1) process
yt = c+ �yt�1 + ut; (1)
where j�j � 1; utiid� (0; �2u), c = (1 � �)�; and E(yt) = �: Estimating (1) by OLS is
equivalent to running OLS without a constant on deviations from the sample mean, yt �
1
T
TXj=1
yj
!= �
yt�1 �
1
T
TXj=1
yj
!+
ut � (1� �)
1
T
TXj=1
yj
!: (2)
When 0 < � < 1; ut is positively correlated with current and future values (yt; yt+1; : : : yT ) ;which themselves are contained in the sample mean and it is this correlation that causesthe downward bias in OLS.2
Instead of adjusting the observations with the full sample mean, the recursive meanadjustment method adjusts each observation yt with the recursive sample mean,�t�1 = (t� 1)�1
Pt�1j=1 yj;�
yt � �t�1�= c+ �
�yt�1 � �t�1
�+�ut � (1� �)�t�1
�:
Recursive mean adjustment controls for the presence of the constant sinceE(1� �)�t�1 = c and the explanatory variable is orthogonal to ut as the recursive meannow contains observations only up through date t � 1. Recursive mean adjustment inthe regression context has been studied by So and Shin (1999). We now extend thisstrategy to an environment of systems of dynamic regression equations.
1.2 Recursive Mean Adjusted Seemingly Unrelated Regression(RSUR)
Consider a system of dynamic regression equations indexed by i = 1; : : : N: Each time se-ries in the system fyitg follows an AR(1) with autocorrelation coe¢ cient �i and unknownconstant ci;
yit = ci + �iyit�1 + uit; (3)
2The correlation between the regressor�yt�1 � 1
T
PTj=1 yj
�and the second part of the com-
posite error term �(1 � �) 1TPT
j=1 yj is inconsequential for values of � near the borderline
of stationarity. To see this, note that E(1 � �)�1T
PTj=1 yj
��yt�1 � �� 1
T
PTj=1(yj � �)
�=
(1��)T
�1 +
Pt�1j=1 �
j +PT�t+1
j=1 �j�� (1� �)V ar
�1T
PTj=1 yj
�= 1+���t��T�t+1
T � (1� �) 1T�PT�1
j=0T�jT �j
�: For t = 3, T = 30, � = 0:98; this expectation is 0.008.
4

where j�ij � 1 and the regression errors, which may be cross sectionally correlated, aregenerated by the single factor structure3
uit = �i�t + �it: (4)
The factor �tiid� (0; 1) is a time t common shock that may have a di¤erential impact
(�i) across individuals. The idiosyncratic error f�itg has mean zero and is not cross-sectionally or temporally correlated but may be heteroskedastic across individuals withcovariance matrix � = E(�1t; : : : �Nt)
0(�1t; : : : �Nt) =diag[�21; : : : �2N ]:
The RSUR estimator for the system of AR(1) equations with unknown constant isconstructed as follows.
Step 1 Estimate each equation i = 1; : : : N by RLS. Construct the recursive means ofthe observations, �it =
1t�1Pt�1
s=1 yis; and estimate yit � �it = �i (yit�1 � �it) + eitby OLS. Call the RLS estimator �RLS,i:
Step 2 Construct the RLS residuals uit = yit ��RLS,iyit�1 � bci; (not beit) where bci =1T
PTt=1
�yit � �RLS,iyit�1
�:4 Let ut = (u01t; � � � ; u0Nt)
0 and form the sample errorcovariance matrix,
MT =1
T
TXt=1
utu0t: (5)
Let �= (�1; � � � �N)0 : Estimate �i and � by the iterative method of moments assuggested by Phillips and Sul (2003a).�
�; ��= argmin
�;�
�tr�(MT ��� ��0) (MT ��� ��0)
0�: (6)
Use the estimates to form a parametric estimate of the error covariance matrix,
Vu = �+ ��0: (7)
Step 3 Let zit�1 = (yit�1 � �it) ;Zt�1 =diag[z1t; z2t; : : : zNt] ; Y t = (y1t � �1t; : : : ; yNt � �Nt)0 ;
3The factor structure has been employed by Bai and Ng (2002), Moon and Perron (2003), andPhillips and Sul (2003a). The single factor assumption is not restrictive as our results go through witha multi-factor model.
4The RLS residual eit contains the recursive mean adjustment term �it: As a result, the asymptoticvariance eit is not same as that of uit. That is why one should use uit rather than eit: Note that thecomposite error term is eit = [ai � (1� �i)�it] + uit = � (1� �i) 1
t�1Pt�1
s=1 xis + uit: For any �nite T ,Ee0iteit 6= Eu0ituit but the di¤erence between the two becomes vanishingly small with increasing samplesize. We show in the appendix that E (e0iteit � u0ituit) = O
�T�1 lnT
�:
5

and � = (�1; : : : �N)0. Then the RSUR estimator is
�RSUR
=
TXt=1
Z0t�1V�1u Zt�1
!�1 TXt=1
Z0t�1V�1u y
t
!: (8)
Note that step 2 produces a parametric estimate of the covariance matrix. An alterna-tive approach is to estimate the error covariance matrix Vu by nonparametric methods,say by usingMT . If the parametric structure is known and can be properly modeled bya factor structure, the parametric method is likely to be more e¢ cient in small samples.5
For �xed N; as T !1 RSUR is asymptotically normally distributed,pTh�RSUR
� �i
D�! N(0;); where = limT!1
�1T
PTt=1 Z
0t�1V
�1u Zt�1
��1; and the
Wald test provides a convenient test of homogeneity restrictions across equations. Totest the null hypothesis Ho : �1 = �2 = � � � = �N ; form the restriction matrix
R =
266641 �1 0 � � � � � � 00 1 �1 � � � � � � 0...
...0 0 0 � � � 1 �1
37775 : (9)
Then under the null hypothesis,
W =hR�
RSUR
i0 �RbR0
��1 hR�
RSUR
i� �2N�1
where b = �PTt=1 Z
0tV
�1u Zt
��1.
2 Recursive mean adjustment for pooled estimators
We now turn to the main focus of the paper �that of pooled estimation of the dominantroot under homogeneity restrictions.6 In this section, we assume that the observations
5If the assumptions of the factor structure are violated, it is possible that robust nonparametricestimators will dominate the parametric approach. The alternative approaches involve an age-oldtrade-o¤ to the researcher. The increased demands on long-run covariance parameter estimation of thenonparametric methods may be viewed as the price of �exibility whereas the computational tractabilityof the parametric method creates the possibility for speci�cation error.
6Pooling the cross-section with the time series achieves some bias reduction even for the unadjustedLSDV estimator. Nickell (1981) and Phillips and Sul (2003b) studied the properties of the unadjustedLSDV for the panel AR(1) model when the observations are cross-sectionally independent. Theiranalyses showed that pooling results in more e¢ cient estimates of �; than OLS but does not eliminatethe downward bias for �nite T even when N ! 1: Because this bias remains when N ! 1 we referto it as N -asymptotic bias.
6

are generated as in (3)-(4) above except that �i = �j = � for all i; j = 1; : : : N: That is,
yit = ai + �yit�1 + uit; (10)
where j�j � 1, and as before, uit = �i�t + �it; �tiid� (0; 1);� = E[(�1t; : : : �Nt)
0(�1t; : : : �Nt)]=diag[�21; : : : �
2N ]:
Section 2.1 discusses estimation under parameter homogeneity with the RPLS estima-tor. This is the recursive-mean adjusted analog to the LSDV method pooled estimationwith �xed e¤ects [Hsiao (2003)]. While this estimator is not e¢ cient, it provides reducedbias residuals for estimation of error-covariance matrices needed in the construction ofthe e¢ cient RGLS estimator which we present in subsection 2.2. For expositional clarity,we �rst develop these estimators under the assumption that the time series follow AR(1)processes. The extension to higher ordered p-th order autoregressions (AR(p)) is takenup in subsection
2.1 Recursive Mean Adjusted Least-Squares Dummy Variable(RLSDV)
RLSDV, introduced here, is the recursive mean adjusted version of the LSDV estimatorfor regression in panel data with �xed e¤ects. Let �it = (t � 1)�1
Pt�1s=1 yis be the
recursively constructed mean. Then the RLSDV estimator is
�RLSDV =
PNi=1
PTt=2 (yit�1 � �it) (yit � �it)PNi=1
PTt=2 (yit�1 � �it)
2:
Analytic expressions for the bias, variance, and mean-square errors are cumbersomeand not especially illuminating, so they are relegated to the appendix. Here, we visu-alize the properties of RLSDV for �xed T as N ! 1 (the N�asymptotic properties)in Figure 1 which plots a family of RLSDV N�asymptotic bias functions. This isplimN!1
1N(�RLSDV � �) for alternative sample sizes T , over 0 < � < 1. It can be seen
that RLSDV slightly overcompensates for the downward bias and is left with a smallupward N�asymptotic bias. The resulting upward bias is generally not very sizable andis vanishingly small as �! 1.
7

Figure 1: N�asymptotic bias of RLSDV for alternative sample sizes T andeconomically relevant values of �
2.2 Pooled recursive mean adjusted GLS with �xed e¤ects(RGLS)
RLSDV does not exploit the cross-sectional covariance structure of the observations inestimation and an e¢ ciency improvement can therefore be achieved by making a meanadjustment to a pooled GLS estimator Since RGLS requires an unbiased estimator ofthe error-covariance matrix, we employ RLSDV residuals for this purpose. The feasibleRGLS estimator is obtained as follows.
Step 1 Estimate � by RLSDV as outlined in subsection 2.1.
Step 2 Construct the RLSDV residuals.
uit = (yit � �RLSDVyit�1)�1
T
TXt=1
(yit � �RLSDVyit�1)
and use them to estimate the error-covariance matrix Vu as described in step 2 ofRSUR. Let viju be the ij�th element of V�1
u :
Step 3 The RGLS estimator is
�RGLS
=
PNi=1
PNj=1 v
iju
PTt=1 (yit � �it) (yit�1 � �it)PN
i=1
PNj=1 v
iju
PTt=1 (yit�1 � �it)
2:
8

Characterizing RGLS is analytically cumbersome and provides little insight beyondthat discussed in connection with RLSDV. We defer further examination of the smallsample properties of RGLS to Section 3 where we compare its performance to alternativeestimators in a series of Monte Carlo experiments.
2.3 Extension to Higher-ordered Autoregressions
In the panel AR(p > 1) case, mean or median unbiased estimation procedures areunavailable due to the di¢ culty in obtaining analytical formulae for small-sample bias ofpanel data estimators. A very useful aspect of the recursive mean adjustment procedureis that it can be directly applied to estimate panel AR(p) models. Here, we take anheuristic approach to show how small-sample bias arises and how it can be reduced. We�rst consider a simple strategy to reduce the bias of autoregressive coe¢ cients underthe assumption that the errors are cross-sectionally uncorrelated. We then proceed toimplement a GLS version of the estimator under cross section dependence.
Homogeneous coe¢ cients and cross-sectional independence. Let the observa-tions in the panel AR(p) model be generated by
yit = �i +
pXj=1
�jyit�j + uit
= �i + �yit�1 +
p�1Xj=1
�j+1�yit�j + uit: (11)
where � =Pp
j=1 �j uit = �it and E(u2it) = �2i ; E(uitujt) = 0 if i 6= j (i.e., the observations
are cross-sectionally independent). Let zit =��y0it�1; :::�y
0it�p+1
�0and �0 = (�2; : : : �p); :
where �j =Pp
i=j+1 �i; j = 1; :::; p� 1: In recursive mean-adjusted form we have
(yit � �it) = � (yit�1 � �it) + zit�0 + eit: (12)
where �it = (t � 1)�1Pt�1
j=1 yjt; eit = �i � (1� �)�it + uit and E(eit) = 0: Estimating�0 � (�; �0) by RLSDV as in the AR(1) case substantially reduces bias, resulting in asmall positive N�asymptotic bias for the estimator of �: However, the RLSDV doesnot adequately address bias in estimating the individual �j coe¢ cients, which maypotentially be even more severe than the bias in unadjusted LSDV. The N�asymptoticbias of the estimator for the �j coe¢ cients is characterized in the appendix. Because half-life estimation in higher-ordered autoregressive systems must be conducted by impulseresponse analyses, it is important to correct for bias in all of the coe¢ cients.To reduce bias in estimation of the �j coe¢ cients, we run a second stage regression
by treating the RLSDV estimate as the true value of �: Let yyit � yit � �RLSDVyit�1 and
9

run the regressionyyit = zit�
0 + ~uit (13)
by OLS. Call the resulting estimator �y: We show below that the residual bias in �yis
inconsequential.
Heterogeneous coe¢ cients and cross-sectional independence To extend thisbias reduction method to heterogeneous AR(p) coe¢ cients, we suggest the followingprocedure.
Step 1 Regress (yit � �it) on zit without a constant. Denote the regression residuals byvit: Also, regress (yit�1 � �it) on zit without a constant and denote these regressionresiduals by vit�1: The �LSDV is obtained by running the pooled regression of viton vit�1 without a constant.
Step 2 Let yyit � yit � �LSDVyit�1: Regressing yyit on zit with a constant term for each
i gives the estimator �yi . Standard errors for �LSDV and �yi must be constructed
using uyit = uit � 1T
PTt=1 uit where buit = yit � �LSDVyit�1 � z0it�
yi :
Heterogeneous coe¢ cients and cross-sectional dependence Under cross sectiondependence we extend the above procedure to an SUR estimator as follows.
Step 1 Obtain uyit as described above. Estimate the covariance matrix Vu as describedin steps 1-2 in subsection 1.2. Let viju be the ij�th element of V �1
u :
Step 2 Let Zt�1 =diag�z1t; z2t; : : : zNt
�; Y t = (y1t � �1t; : : : ; yNt � �Nt)
0 and Y t�1 =�y1t�1 � �1t�1; : : : ; yNt�1 � �Nt�1
�0; wt = Y t�
�PTt=1 Z
0t�1V
�1u Zt�1
��1PTt=1 Z
0t�1V
�1u Y t;
and wt�1 = Y t�1��PT
t=1 Z0t�1V
�1u Zt�1
��1PTt=1 Z
0t�1V
�1u Y t�1: Let � = (�1; : : : �N)
0,then the RSUR estimator for � is
�RSUR =
TXt=1
w0t�1V
�1u wt�1
!�1 TXt=1
w0t�1V
�1u wt
Step 3 Let ~yyit = ~yit � �RSUR~yit�1; and ~Yyt =
�~yy1t; :::~y
yNT
�. The RSUR estimator for �
is
�RSUR =
TXt=1
Z0t�1V�1u Zt�1
!�1 TXt=1
Z0t�1V�1u~Yyt
10
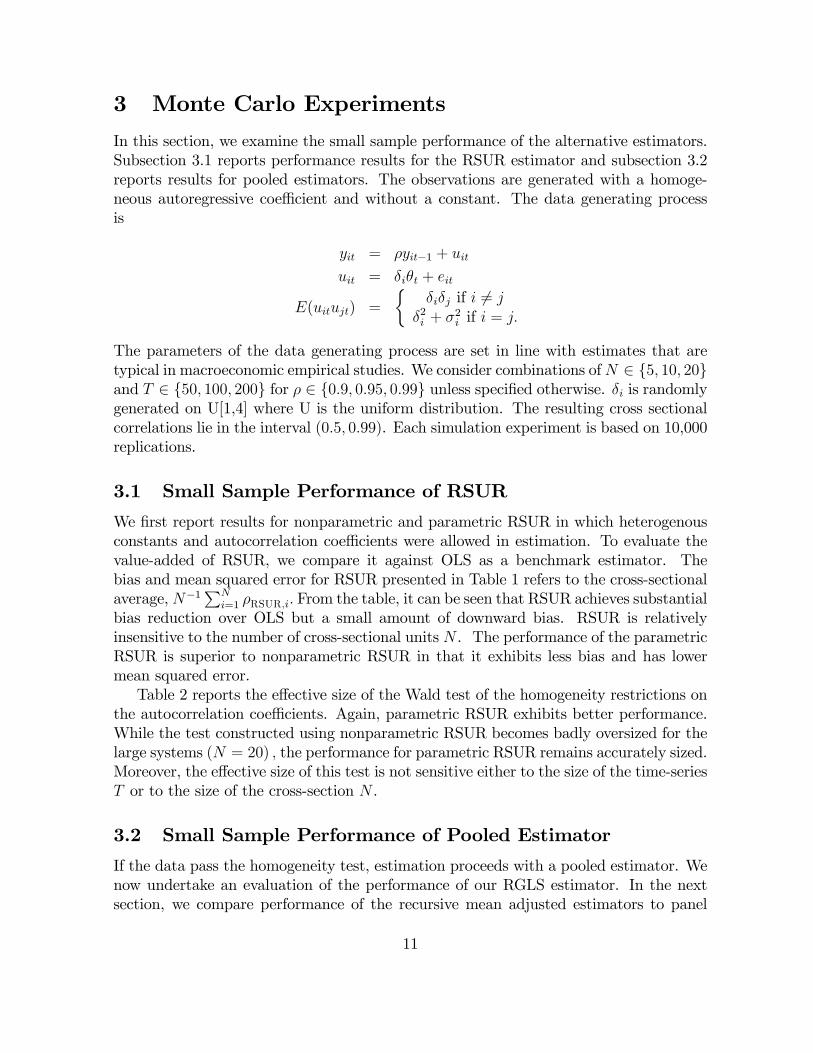
3 Monte Carlo Experiments
In this section, we examine the small sample performance of the alternative estimators.Subsection 3.1 reports performance results for the RSUR estimator and subsection 3.2reports results for pooled estimators. The observations are generated with a homoge-neous autoregressive coe¢ cient and without a constant. The data generating processis
yit = �yit�1 + uit
uit = �i�t + eit
E(uitujt) =
��i�j if i 6= j
�2i + �2i if i = j:
The parameters of the data generating process are set in line with estimates that aretypical in macroeconomic empirical studies. We consider combinations ofN 2 f5; 10; 20gand T 2 f50; 100; 200g for � 2 f0:9; 0:95; 0:99g unless speci�ed otherwise. �i is randomlygenerated on U[1,4] where U is the uniform distribution. The resulting cross sectionalcorrelations lie in the interval (0:5; 0:99). Each simulation experiment is based on 10,000replications.
3.1 Small Sample Performance of RSUR
We �rst report results for nonparametric and parametric RSUR in which heterogenousconstants and autocorrelation coe¢ cients were allowed in estimation. To evaluate thevalue-added of RSUR, we compare it against OLS as a benchmark estimator. Thebias and mean squared error for RSUR presented in Table 1 refers to the cross-sectionalaverage, N�1PN
i=1 �RSUR,i: From the table, it can be seen that RSUR achieves substantialbias reduction over OLS but a small amount of downward bias. RSUR is relativelyinsensitive to the number of cross-sectional units N . The performance of the parametricRSUR is superior to nonparametric RSUR in that it exhibits less bias and has lowermean squared error.Table 2 reports the e¤ective size of the Wald test of the homogeneity restrictions on
the autocorrelation coe¢ cients. Again, parametric RSUR exhibits better performance.While the test constructed using nonparametric RSUR becomes badly oversized for thelarge systems (N = 20) ; the performance for parametric RSUR remains accurately sized.Moreover, the e¤ective size of this test is not sensitive either to the size of the time-seriesT or to the size of the cross-section N .
3.2 Small Sample Performance of Pooled Estimator
If the data pass the homogeneity test, estimation proceeds with a pooled estimator. Wenow undertake an evaluation of the performance of our RGLS estimator. In the nextsection, we compare performance of the recursive mean adjusted estimators to panel
11

mean-unbiased estimators suggested by Phillips and Sul (2003a,b).7 The idea behindmean-unbiased estimators to estimate � using a method with known bias, such as LSDVand then to adjust the point estimate by this bias. Speci�cally we discuss mean adjustedLSDV (MLSDV) and mean adjusted GLS (MGLS).8 Since these estimators are describedin detail in Phillips and Sul (2003 a, b), we provide only a cursory description here.MSLDV proceeds as follows: Nickell (1981) derived the bias in LSDV,
plimN!1 (�LSDV) = m(�) (with the precise formula for the function m (�) given inthe appendix). Then the MLSDV estimator is obtained by inverting this function,�MSLDV = m�1 (�LSDV) : For MGLS, we draw on Phillips and Sul (2003a) who showthat in an environment where the regression errors are cross-sectionally correlated andfollow a single factor structure, the N�asymptotic bias of the pooled GLS estimatordepends neither on the parameters �i nor on the unobserved factor �t. As a result ofthis independence we can apply the same mean adjustment rule to get MGLS, namely�MGLS = m�1 (�GLS) :We compare its performance to the following alternative pooled estimators: LSDV,
MLSDV, nonparametric MGLS and parametric MGLS. The LSDV (and MLSDV) es-timators include a set of time-speci�c dummy variables as a partial control for cross-sectional dependence.
The results, reported in Table 3, list the alternative estimators in inverse order oftheir bias. RGLS is the least biased. Nonparametric MGLS is less biased than MLSDVbut the GLS estimator is more e¢ cient as expected while parametric MGLS achievesadditional e¢ ciency gains. RGLS is the preferred estimator as it generally dominates theothers in reducing bias and is most e¢ cient in a mean-square error sense. The exceptionis for T = 200 where RGLS appears to slightly overcorrect the bias (e.g., for N = 20,T = 200, � = 0:95, the bias is 0.00235).A visual representation of the alternative estimator performance is given in Figure
2 which displays empirical distributions for each of the estimators of � = 0:98 withN = 21; T = 51. Here again, it can be seen that the worst performer is pooled OLSwhich is has large variance and is severely downward biased. Next, is LSDV, followedby nonparametric MGLS, parametric MGLS and our preferred RGLS estimator.
7In the AR(p) model with exogenous regressors under cross section independence, IV/GMM estima-tors in dynamic panel regressions can be employed to reduce bias but neither the asymptotic nor the�nite sample properties of these estimators have been investigated under cross-sectional dependence.See Ahn and Schmidt (1995) and Hahn and Kuersteiner (2001).
8In this paper we consider only mean-unbiased estimators since for moderately sized T samples, theproperties of median-unbiased and mean-unbiased estimators are quite similar.
12

Figure 2: Empirical distributions of alternative pooled estimators. � = 0:98; N=21,T=51.
Table 4 shows the results for the AR(2) case. The DGP is
yit = �yit�1 + eit
eit = �ieit�1 + uit
uit = �i�t + "it
where "itiid� N(0; 1) and �i � U [�0:3;�0:2] if = �0:3 and �i � U [0:3; 0:4] if = 0:3.
As can be seen, RGLS is very e¢ cient in terms of relative mean square error. For smallT = 50 and large N = 50; RGLS retains a slight negative bias. As T increases andN decreases, RGLS begins to overcompensate slightly as � moves down away from 1,however, the overall amount of residual bias in RGLS is very small.
4 Estimating Short-Term Interest Rate Dynamics
This section uses RGLS to estimate dynamic models of short-term interest rates. Muchinterest has centered on mean-reverting speci�cations suggested by Cox, Ingersoll, andRoss (1985, hereafter CIR). Based on a single factor model of the term structure CIR
13

characterize the interest rate as the continuous time �rst-order autoregressive process
dr = �(� � r)dt+ �prdZ; (14)
where � represents long-term mean of the interest rate to which r reverts at rate � anddZ is a standard Wiener process.9 In practice the parameters in (14) are estimatedusing a single time series of short-term interest rates which itself serves as a proxy forthe instantaneous interest rate. Models of the term structure of interest rates are oftenevaluated on the basis of those estimates using available closed-form expressions fordefault-free bond prices. As pointed out by Ball and Torous (1996), the downward biasin these estimates produce implied adjustment speeds of the short term interest ratethat are too high to be consistent with the actual dynamics of bond price data.To obtain reduced biased estimates of short-term interest dynamics, we follow Ball
and Torus in discretizing (14) as
rt+� = �+ �rt + ut; (15)
where � = �(1 � e���t), � = e��� and ut = ��tp� where �t is zero meaned with
variance proportional to rt:
4.1 Another Simulation Experiment
Before we employ the RGLS estimator on the data, we examine its performance in thecontext of the simulation experiment considered by Ball and Torous (1996) which weextend to the panel context. We consider two alternative cross section dimensions ofN = 5; 10 which are comparable. Pseudo observations for annualized interest ratesare generated from a �rst order discrete-time approximation to (14) assuming 360 timesteps per year. We consider weekly frequencies (� = 1=52) and monthly frequencies(� = 1=12) for sampling the data. and data sets consisting of �ve years and ten yearsof observations. Parameter values are set according to � = 1, and � � U [0:1; 0:9]: Theinitial observation for interest rate is set at �, and � = 0:05 and 0:1, respectively.Cross-sectional dependence is introduced by setting cov(dZi; dZj) = �ijdt where �ij �U [�0:5; 0:5]. Each simulation run is carried out with 1,000 as in Ball and Torous (1996).
Table 4 reports the performance of LSDV and RGLS with associated biases (�� �)in parentheses. There is only a tiny bit of residual bias in the RGLS estimator. Betterresults are evidently obtained when observations are sampled weekly.
9Chan et. al. (1992) examined models of the form dr = (�+ �r) dt+ �r dZ: The speci�cation thatwe estimate is a special case of Chan et. al�s. that is obtained with � = 1, � = �, � = �1 and = 0:5.This characterization guarantees that the interest rate is nonnegative.
14

4.2 Five Weekly Eurocurrency Rates
We now apply RGLS to estimate the speed of adjustment in a data set of weekly eurocur-rency rates.10 Eurocurrency rates are free market interest rates which are not directlya¤ected by such domestic factors such as reserve requirements and foreign exchange con-trols. We collected �ve weekly data sets of 325 weekly Eurodeposit rates for Australia,Canada, Germany, Switzerland, and the U.S.�one data set for each day of the week.The time span of the data extends from December 1, 1997 to February 20, 2004. Thesedata were originally collected by Harris bank which we downloaded from Datastream.All rates are expressed in percent per annumIn our empirical speci�cation, we allow the interest rates to follow an AR(2). The
Table 5 reports the results for � estimated for each of the �ve data sets. We �rstestimated the system by RSUR and conduct tests of homogeneity restrictions across the�ve eurocurrency rates. None of the p-values for this test lie below 0.3 so proceed toperform estimation under homogeneity restrictions. Panel estimation by LSDV yieldsestimates that consistently lie below 1 whereas the RGLS estimates consistently lieabove 1. The bias corrected RGLS estimator suggests that short-term interest rates donot mean revert and instead may be unit-root nonstationary. However, a 95% con�denceinterval includes values of � that lie below 1.It is also possible that short-term interestrates are governed by stationary but nonlinear dynamics.
5 Conclusion
In this paper, we extend the idea of recursive mean adjustment as a bias reduction strat-egy in estimating the dominant root in dynamic systems and for panel regressions. Themethod is straightforward to implement and has familiar asymptotic properties. Becausemean and median unbiased estimators are generally unavailable for higher ordered panelautoregression models, the recursive mean adjustment procedure �lls an important gapin the literature. Monte Carlo experiments show that it is an e¢ cient and e¤ective biasreduction strategy in small samples.We applied RGLS to estimate the speed of adjustment in a small panel of short-term
interest rates. The bias-adjusted estimates suggest that there may be no reversion tothe mean.10Factor models of the term structure are concerned with mean reversion in real interest rates but
due to the very short sampling intervals, our examination focuses on the nominal interest rate.
15

References
[1] Ahn, S.C., Schmidt P., 1995. E¢ cient Estimation of Models for Dynamic Panel-data. Journal of Econometrics 68, 5�27.
[2] Andrews, D.W.K., 1993. Exactly Median-unbiased Estimation of First Order Au-toregressive/Unit root Models. Econometrica 61, 139�165.
[3] Andrews, D.W.K., Chen, H., 1994. Approximately median-unbiased estimation ofautoregressive models. Journal of Business and Economic Statistics 12, 187�204.
[4] Ball, Cli¤ord A. and Walter N. Torous, 1996. �Unit Roots and the Estimation ofInterest Rate Dynamics,�Journal of Empirical Finance, 3, 25-238.
[5] Bai, J., Ng, S., 2002. Determining the Number of Factors in Approximate FactorModels. Econometrica 70, 191�221.
[6] Chan, K., G. Karolyi� F. Longsta¤, and A. Sanders,1992. �An Empirical Com-parison of Alternative Models of the Short-Teerm Interest Rate,� Journal ofFinance, 47, 1209-27.
[7] Frankel, Je¤rey A. and Andrew K. Rose, 1996. �A Panel Project on PurchasingPower Parity: Mean Reversion within and between Countries,�Journal of In-ternational Economics, 40, 209-24
[8] Hahn J, Kuersteiner G., 2002. Asymptotically Unbiased Inference for a DynamicPanel Model with Fixed E¤ects When Both n and T are Large. Econometrica70(4), 1639�1657.
[9] Gibbons, M.R. and K. Ramaswamy, 1993.�A Test of the Cox, Ingersoll, and RossModel of the Term Structure,�The Review of Financial Studies, 6, 619� 58.
[10] Hsiao, C., 2003. Analysis of Panel Data, Second Edition. Cambridge UniversityPress.
[11] Kendall, M.G., 1954. Note on Bias in the Estimation of Autocorrelation. Biometrika41, 403�404.
[12] Marriott, F.H.C., Pope, J.A., 1954. Bias in the estimation of autocorrelations, Bio-metrika 41, 393�403.
[13] Moon, H.R., Perron, B., 2003. Testing for A Unit Root in Panels with DynamicFactors. Journal of Econometrics, forthcoming.
[14] Murray, C.J., Papell, D.H., 2002. The Purchasing Power Parity Persistence Para-digm. Journal of International Economics 56(1), 1�19.
[15] Nickell, S. 1981. Biases in Dynamic Models with Fixed E¤ects. Econometrica 49,1417�1426.
[16] Papell, David H., 2004. �The Panel Purchasing Power Parity Puzzle�, mimeo, Uni-versity of Houston.
16
[17] Perarson, N.D. and T. Sun, 1994. �Exploiting the Conditional Density in Estimatingthe Term STructure: An application to the Cox, Ingersoll, and Ross Model,�Journal of Finance, 49, 1279�1304.
[18] Phillips, P.C.B. and D. Sul, 2003a. �Dynamic Panel Estimation and HomogeneityTesting Under Cross Section Dependence,�The Econometrics Journal 6, 217�-259.
[19] Phillips, P.C.B. and D. Sul, 2003b. �Bias in Dynamic Panel Estimation with FixedE¤ects, Incidental Trends and Cross Section Dependence,�mimeo, Universityof Auckland.
[20] So, B.S., Shin, D.W., 1999. Recursive Mean Adjustment in Time Series Inferences.Statistics and Probability Letters 43, 65�73.
[21] Wu, Yangru and Hua Zhang, 1996. �Mean Reversion in Interest Rates: New Evi-dence from a Panel of OECD Countries,�Journal of Money, Credit and Banking,28, 604-621.
17

Table 1: Monte Carlo Performance of RSUR
Bias � T Relative MSEa/
N T � OLS RSURb/ RSURc/ RSURb/ RSURc/
0.900 -4.350 -1.343 -1.248 0.216 0.2045 50 0.950 -4.880 -1.692 -1.604 0.200 0.189
0.990 -5.234 -1.686 -1.620 0.168 0.1600.900 -4.071 -0.780 -0.729 0.214 0.210
5 100 0.950 -4.608 -1.317 -1.261 0.191 0.1850.990 -5.322 -1.678 -1.635 0.158 0.1540.900 -3.987 -0.204 -0.182 0.228 0.227
5 200 0.950 -4.417 -0.793 -0.764 0.192 0.1900.990 -5.350 -1.644 -1.617 0.157 0.1540.900 -4.414 -1.501 -1.225 0.205 0.167
10 50 0.950 -4.909 -1.830 -1.579 0.195 0.1610.990 -5.251 -1.787 -1.607 0.165 0.1400.900 -4.186 -0.879 -0.717 0.176 0.161
10 100 0.950 -4.688 -1.422 -1.238 0.167 0.1490.990 -5.388 -1.729 -1.603 0.144 0.1310.900 -3.965 -0.198 -0.123 0.182 0.177
10 200 0.950 -4.373 -0.796 -0.698 0.156 0.1500.990 -5.323 -1.645 -1.557 0.138 0.1310.900 -4.387 -1.617 -1.212 0.254 0.168
20 50 0.950 -4.913 -1.891 -1.564 0.228 0.1610.990 -5.245 -1.791 -1.594 0.183 0.1410.900 -4.144 -1.016 -0.702 0.202 0.163
20 100 0.950 -4.653 -1.584 -1.231 0.194 0.1530.990 -5.339 -1.838 -1.622 0.163 0.1360.900 -4.002 -0.305 -0.155 0.190 0.177
20 200 0.950 -4.401 -0.927 -0.725 0.168 0.1520.990 -5.307 -1.747 -1.574 0.152 0.135
Notes: a/MSE of RSUR relative to MSE of OLS. b/Nonparametric RSUR. c/Parametric RSUR.
18

Table 2: Monte Carlo Performance of Test for Homogeneity
RSURa/ RSURb/
N T � 10% 5% 1% 10% 5% 1%0.900 0.193 0.118 0.040 0.161 0.092 0.027
5 50 0.950 0.196 0.120 0.040 0.166 0.097 0.0280.990 0.176 0.107 0.033 0.150 0.088 0.0240.900 0.150 0.087 0.025 0.140 0.079 0.020
5 100 0.950 0.165 0.097 0.028 0.154 0.087 0.0220.990 0.154 0.088 0.024 0.144 0.080 0.0200.900 0.123 0.066 0.017 0.116 0.062 0.015
5 200 0.950 0.133 0.074 0.018 0.127 0.069 0.0160.990 0.156 0.085 0.020 0.149 0.081 0.0200.900 0.354 0.253 0.114 0.194 0.118 0.035
10 50 0.950 0.354 0.253 0.117 0.204 0.123 0.0380.990 0.303 0.209 0.090 0.180 0.106 0.0300.900 0.229 0.140 0.048 0.156 0.089 0.022
10 100 0.950 0.254 0.160 0.055 0.182 0.105 0.0290.990 0.238 0.148 0.048 0.179 0.102 0.0270.900 0.158 0.089 0.021 0.124 0.067 0.014
10 200 0.950 0.180 0.104 0.028 0.149 0.082 0.0190.990 0.204 0.122 0.040 0.178 0.103 0.0290.900 0.780 0.703 0.540 0.235 0.144 0.045
20 50 0.950 0.746 0.669 0.511 0.249 0.151 0.0480.990 0.631 0.550 0.398 0.219 0.131 0.0400.900 0.453 0.344 0.170 0.175 0.102 0.027
20 100 0.950 0.495 0.380 0.202 0.216 0.128 0.0400.990 0.443 0.330 0.164 0.217 0.128 0.0370.900 0.263 0.171 0.060 0.149 0.079 0.019
20 200 0.950 0.299 0.201 0.076 0.177 0.099 0.0290.990 0.334 0.226 0.088 0.216 0.130 0.041
Notes: a/Nonparametric RSUR. b/Parametric RSUR.
19

Table 3: Monte Carlo Performance of Pooled Estimators
Bias � T Relative MSEN T � A B C D E B/A C/A D/A E/A
0.90 -3.975 -0.960 -0.813 -0.715 -0.283 0.280 0.172 0.161 0.1165 50 0.95 -4.456 -1.274 -1.081 -0.973 -0.618 0.246 0.163 0.150 0.093
0.99 -4.745 -1.552 -1.248 -1.162 -0.605 0.203 0.137 0.124 0.0690.90 -3.710 -0.814 -0.601 -0.546 0.188 0.310 0.177 0.171 0.144
5 100 0.95 -4.188 -1.022 -0.791 -0.729 -0.297 0.268 0.157 0.151 0.1050.99 -4.826 -1.508 -1.174 -1.121 -0.680 0.208 0.131 0.125 0.0690.90 -3.679 -0.828 -0.496 -0.469 0.692 0.347 0.186 0.183 0.177
5 200 0.95 -4.048 -0.952 -0.616 -0.583 0.168 0.295 0.161 0.158 0.1300.99 -4.859 -1.423 -1.049 -1.012 -0.670 0.223 0.132 0.128 0.0760.90 -3.975 -0.743 -0.852 -0.529 -0.109 0.189 0.124 0.081 0.056
10 50 0.95 -4.412 -0.991 -1.101 -0.747 -0.433 0.164 0.130 0.081 0.0450.99 -4.679 -1.199 -1.102 -0.805 -0.409 0.125 0.109 0.066 0.0320.90 -3.769 -0.664 -0.567 -0.382 0.348 0.221 0.105 0.087 0.075
10 100 0.95 -4.198 -0.819 -0.748 -0.535 -0.114 0.185 0.097 0.077 0.0510.99 -4.815 -1.241 -1.022 -0.822 -0.492 0.136 0.087 0.067 0.0330.90 -3.604 -0.641 -0.369 -0.276 0.882 0.259 0.100 0.094 0.101
10 200 0.95 -3.938 -0.723 -0.466 -0.360 0.382 0.212 0.086 0.079 0.0690.99 -4.764 -1.157 -0.884 -0.761 -0.468 0.151 0.078 0.069 0.0370.90 -3.861 -0.667 -1.052 -0.414 0.009 0.174 0.180 0.047 0.031
20 50 0.95 -4.323 -0.914 -1.276 -0.627 -0.317 0.146 0.186 0.048 0.0240.99 -4.566 -1.091 -1.100 -0.594 -0.287 0.107 0.144 0.039 0.0170.90 -3.648 -0.589 -0.665 -0.276 0.455 0.198 0.096 0.047 0.045
20 100 0.95 -4.065 -0.732 -0.856 -0.418 -0.001 0.164 0.094 0.042 0.0270.99 -4.648 -1.110 -1.032 -0.657 -0.383 0.117 0.091 0.042 0.0180.90 -3.555 -0.590 -0.407 -0.203 0.954 0.235 0.066 0.051 0.065
20 200 0.95 -3.869 -0.663 -0.500 -0.268 0.470 0.190 0.059 0.043 0.0410.99 -4.629 -1.054 -0.886 -0.635 -0.366 0.131 0.062 0.041 0.020
(A): LSDV; (B): MLSDV; (C): Nonparametric MGLS; (D) Parametric MGLS; (E): Parametric RGLS.
20

Table 4: Finite Sample Performance of RGLS for AR(2) case� �
Bias � T MSE Ratio Bias � T MSE RatioT N � A B C B/A C/A D E F E/D F/D
0.90 0.3 -2.487 0.386 1.107 0.902 0.260 147.921 0.721 1.110 0.021 0.008-0.3 -4.401 0.251 1.526 0.827 0.240 -114.999 -0.479 0.509 0.035 0.014
0.92 0.3 -2.461 0.290 1.006 0.877 0.254 153.343 0.725 1.102 0.019 0.008-0.3 -4.449 0.044 1.332 0.791 0.228 -116.994 -0.570 0.426 0.034 0.013
500 5 0.95 0.3 -2.433 0.070 0.780 0.814 0.234 161.475 0.705 1.067 0.017 0.007-0.3 -4.562 -0.405 0.899 0.707 0.197 -119.986 -0.769 0.239 0.032 0.013
0.98 0.3 -2.474 -0.373 0.326 0.656 0.176 169.606 0.633 0.980 0.015 0.006-0.3 -4.912 -1.243 0.048 0.541 0.134 -122.978 -1.121 -0.119 0.031 0.012
1.00 0.3 -2.895 -0.826 -0.263 0.275 0.064 175.028 2.482 2.721 0.015 0.006-0.3 -5.569 -1.594 -0.508 0.275 0.064 -124.972 -0.736 0.136 0.030 0.012
0.90 0.3 -2.609 -0.038 0.963 0.832 0.120 72.558 0.512 0.941 0.044 0.011-0.3 -4.682 -0.540 1.207 0.730 0.100 -59.232 -0.788 0.354 0.068 0.016
0.92 0.3 -2.610 -0.152 0.845 0.795 0.113 75.179 0.500 0.917 0.041 0.010-0.3 -4.781 -0.768 0.993 0.687 0.090 -60.253 -0.890 0.259 0.066 0.016
250 10 0.95 0.3 -2.635 -0.392 0.594 0.712 0.094 79.110 0.467 0.863 0.036 0.009-0.3 -5.016 -1.236 0.538 0.599 0.069 -61.785 -1.094 0.062 0.062 0.015
0.98 0.3 -2.801 -0.834 0.127 0.551 0.056 83.041 0.437 0.799 0.033 0.008-0.3 -5.595 -1.966 -0.244 0.464 0.043 -63.317 -1.347 -0.231 0.059 0.014
1.00 0.3 -3.095 -0.959 -0.127 0.305 0.024 85.661 2.293 2.534 0.031 0.008-0.3 -5.873 -1.831 -0.240 0.304 0.024 -64.339 -0.812 0.207 0.057 0.014
21

Table 4: Continued�� �
Bias � T MSE Ratio Bias � T MSE RatioT N � A B C B/A C/A D E F E/D F/D
0.90 0.3 -2.703 -0.527 0.592 0.680 0.049 29.680 0.340 0.796 0.104 0.022-0.3 -4.970 -1.366 0.549 0.573 0.031 -22.882 -1.164 0.059 0.183 0.036
0.92 0.3 -2.725 -0.634 0.466 0.637 0.041 30.771 0.351 0.783 0.096 0.021-0.3 -5.127 -1.568 0.337 0.537 0.025 -23.279 -1.236 -0.025 0.178 0.035
100 25 0.95 0.3 -2.808 -0.848 0.214 0.557 0.027 32.406 0.395 0.772 0.086 0.019-0.3 -5.463 -1.923 -0.062 0.473 0.018 -23.875 -1.333 -0.162 0.169 0.034
0.98 0.3 -3.054 -1.139 -0.164 0.442 0.017 34.041 0.671 0.931 0.078 0.017-0.3 -5.944 -2.217 -0.455 0.388 0.016 -24.471 -1.285 -0.188 0.161 0.032
1.00 0.3 -3.035 -0.942 -0.053 0.310 0.010 35.132 2.386 2.576 0.078 0.021-0.3 -5.781 -1.823 -0.087 0.310 0.010 -24.868 -0.782 0.278 0.154 0.031
0.90 0.3 -2.805 -0.769 0.270 0.575 0.019 14.944 0.374 0.786 0.213 0.051-0.3 -5.158 -1.669 0.056 0.485 0.012 -11.313 -1.138 -0.126 0.392 0.083
0.92 0.3 -2.852 -0.866 0.146 0.537 0.015 15.496 0.421 0.808 0.198 0.047-0.3 -5.339 -1.825 -0.111 0.457 0.011 -11.510 -1.171 -0.169 0.380 0.081
50 50 0.95 0.3 -2.979 -1.036 -0.076 0.473 0.011 16.323 0.569 0.908 0.179 0.043-0.3 -5.647 -2.036 -0.339 0.410 0.011 -11.805 -1.173 -0.188 0.362 0.078
0.98 0.3 -3.171 -1.159 -0.253 0.386 0.012 17.151 1.080 1.369 0.166 0.043-0.3 -5.845 -2.044 -0.347 0.351 0.009 -12.100 -0.996 -0.023 0.342 0.074
1.00 0.3 -2.987 -0.876 -0.005 0.306 0.006 17.703 2.384 2.676 0.171 0.057-0.3 -5.614 -1.695 0.004 0.303 0.006 -12.297 -0.640 0.315 0.326 0.073
(A) LSDV for �; (B) RLSDV estimator for �; (C) RGLS estimator for �; (D) LSDV for �i;(E) RLSDV estimator for �i; (F) RGLS estimator for �i
22

Table 5: Simulation Results for Short-Term InterestRate Dynamics � = 1, � = 0:05 .Bias (�� �) in parentheses.
Time Span N=5 N=10LSDV PRGLS LSDV PRGLS
60 months 0.8676 0.9185 0.8739 0.9260(0.59) (-0.02) (0.51) (-0.11)
120 months 0.8974 0.9239 0.8990 0.9259(0.23) (-0.09) (0.21) (-0.11)
260 weeks 0.9692 0.9809 0.9699 0.9819(0.60) (-0.01) (0.56) (-0.05)
520 weeks 0.9756 0.9818 0.9759 0.9822(0.27) (-0.05) (0.25) (-0.07)
Table 6: Estimates for the Dynamics of Eurocurrency Rates
Mon Tue Wed Thr FriHomogeneity Test p-value (0.5008) (0.4983) (0.3373) (0.3515) (0.4250)
LSDV � 0.9895 0.9930 0.9958 0.9958 0.9892RGLS � 1.0002 1.0014 1.0023 1.0025 1.0004
[�5%] [0.9928] [0.9940] [0.9958] [0.9936] [0.9933]
Notes: 5% denotes the lower end of 95% con�dence inteval of RGLS estimates.
23

AppendixN-asymptotic bias of LSDV
Nickell (1981) shows that the bias in the LSDV estimator for the AR(1) model with �xede¤ects is
plimN!1
(�LSDV) � m(�) = ���1 + �
T � 1
��1� 1
T
1� �T1� �
�(16)
��1�
�1
T � 1
��2�
1� �
��1� 1
T
1� �T1� �
���1;
N-Asymptotic bias, variance, and mean-square error of RLSDV
Here, we derive the bias, variance, and mean-square errors that underlies Figure 1. Beforeproceeding, we require some preliminary results. First, we adopt
Assumption A1: (Regularity conditions on the error term) The "it have zero mean, �nite2 + 2� moments for some � > 0; are independent over i and t with E("2it) = �2i for all t;and lim
N!11N
PNi=1 �
2i = �2:
We also make use of
Lemma 1 E�Pt�1
s=1 xis
�2=�1��2(1��)2
� ht� 1� 2�1��
t�1
1��2i�2x:
Lemma 2 E�xit�1
Pt�1s=1 xis
�= �2x
�1��t�11��
�:
Proofs to lemmas 1 and 2 are straightforward and are omitted.
Lemma 3 (Asymptotic Equivalence) T�1PTt=1Eeite
0it � T�1
PTt=1Euitu
0it = O
�T�1 lnT
�Proof. Let Ai = diag (�i) ; then we have
T�1TXt=2
Eeite0it = T�1
TXt=2
(I �Ai)�
1
(t� 1)2
�E
"t�1Xs=1
xis
#0 " t�1Xs=1
xis
#(I �Ai)
+T�1TXt=2
Euitu0it
24

By Lemma 1, the maximum order ofPTt=2
�1
(t�1)2�EhPt�1
s=1 xis
i2is O
�PTt=2
1(t�1)
�: Also,
sincePTt=1
�1t�1
�= lnT +Rn where Rn is a residual, we have
T�1TXt=1
Eeite0it = O
�T�1 lnT
�+ T�1
TXt=1
Euitu0it
It follows that eit and uit have the same asymptotic variance.
The N�asymptotic bias, variance and mean squared error formulae for RLSDV and LSDVare given in,
Claim 1 (N�Asymptotic Properties of RLSDV). Let the observations be generated by (10);and
A =1
T
�1
1� �
� �T �
�1� �T1� �
��;
B =
�T � 11� �2
��1�
�1
T � 1
��2�
1� �
��1�
�1
T
��1� �T1� �
���;
C =
�1
1� �2
� TXt=2
��
t� 1
��1 + �t �
�2
t� 1
��1� �t�1(1� �)
��;
D =
�1
1� �2
� TXt=2
�1�
�1
t� 1
��1�
�2�t�1
1� �
�+
�2�
t� 1
��1� �t�1(1� �)2
���;
E =
�1
T � 1
� TXt=2
�1
t� 1
��1�
�2�
t� 1
��1� �t�11� �2
��:
Then the N�asymptotic bias of the RLSDV estimator is
plimN!1
(�RLSDV � �) =�C
D
�> 0
Proof. The data generating process has the observationally equivalent latent model structure,
qit = ci + xit;
xit = �xit�1 + uit:
For this latent structure, RPLS is de�ned as
�RLSDV = �+
�1
DNT
�fC1;NT + C2;NT g
25

where
C1;NT =
NXi=1
TXt=2
xit�1 �
1
t� 1
t�1Xs=1
xis
!uit;
C2;NT = � (1� �)NXi=1
TXt=2
xit�1 �
1
t� 1
t�1Xs=1
xis
! 1
t� 1
t�1Xs=1
xis
!;
DNT =
NXi=1
TXt=2
xit�1 �
1
t� 1
t�1Xs=1
xis
!2:
To evaluate the probability limit, plimN!1
(�RLSDV � �) =plim 1
N [C1;NT+C2;NT ]plim 1
NDNT
, we have
plimN!1
�1
N
�DNT = E
TXt=2
xit�1 �
1
t� 1
t�1Xs=1
xis
!2
= E
TXt=2
24x2it�1 +
1
t� 1
t�1Xs=1
xis
!2� 2 1
t� 1xit�1t�1Xs=1
xis
35=
TXt=2
�2x +
TXt=2
�1
t� 1
�2��2x (t� 1)
�1 + �
1� � �2�
t� 11� �t�1(1� �)2
����
2
t� 1
��1� �t�11� �
��2x
=
TXt=2
�2x
0@ 1 +h1t�1
i h1+�1��
i�h2t�1
i h1��t�11��
i�h1t�1
i h2�t�1
i h1��t�1(1��)2
i 1A=
TXt=2
�2x
�1�
�1
t� 1
��1�
�2�t�1
1� �
�+
�2�
t� 1
� �1� �t�1(1� �)2
���= D
where �2x = plimN!1
1N
P�2i;x: Note that plim
N!11NC1;NT = 0, whereas
26

plimN!1
1
NC2;NT = �E (1� �)
TXt=2
" xit�1 �
1
t� 1
t�1Xs=1
xis
!1
t� 1
t�1Xs=1
xis
#
= �E (1� �)TXt=2
24xit�1 1
t� 1
t�1Xs=1
xis � E
1
t� 1
t�1Xs=1
xis
!235= �
TXt=2
�1� �t�1t� 1
��2x +
TXt=2
�2xt� 1
�1 + �� 2�
t� 11� �t�11� �
�
= �2x
TXt=2
�
t� 1
�1 + �t � 2
t� 11� �t�1(1� �)
�= C:
Finally we have the N�asymptotic bias of RLSDV,
plimN!1
(�RLSDV � �) =
PTt=2
��t�1
��1 + �t �
�2t�1
��1��t�1(1��)
��(T � 1)�
PTt=2
�1t�1
��1�
�2�t�1
1��
�+�2�t�1
��1��t�1(1��)2
�� = �CD
�:
N�Asymptotic bias in panel AR(p) case
In section 2.3, we claimed that the RPLS bias may be more severe than the LSDV bias for the�j ; j = 2; : : : p coe¢ cients. The biases are
plimN!1
��LSDV
� ��
= plimN!1
(�LSDV � �) PNPT zit~yit�1PNPT ~z2it
!+ plimN!1
PNPT ~zit~uitPNPT ~z2it
!
plimN!1
��RLSDV
� ��
= plimN!1
(�RLSDV � �) PNPT zit (yit�1 � �it)PNPT z2it
!
+plimN!1
PNPT ziteitPNPT z2it
!
Residual bias in second stage � estimates for panel AR(p)
In section 2.3, it was claimed that the residual bias of the estimator �y is inconsequential. To�x the idea, we take AR(2) as an example and rewrite (13) as
yit � �RLSDVyit�1 = �i + � (yit�1 � yit�2) + uyit (17)
27

where uyit = uit�(�RLSDV � �) yit�1:Using the fact that (yit�1 � �)�(yit�2 � �) = (yit�1 � yit�2)where � is unconditional mean of yit; the bias of the pooled estimator �
ycan be written as
�y�� = (�� �RLSDV)
PNPT (yit�1 � yit�2) (yit�1 � yi��1)PNPT (yit�1 � yit�2)2+
PNPT (yit�1 � yit�2) (uit � ui�)PNPT (yit�1 � yit�2)2
As N !1; the asymptotic bias is given by
plimN!1
��y � �
�= plim
N!1(�� �RLSDV)O (1) +O
�T�1
�plimN!1
1
N
NX TX(yit�1 � yit�2) (uit � ui�)
However note that �1� �1L� �2L2
�yit = (1� �1L) (1� �2L) yit = uit
oryit =
c11� �1L
uit +c2
1� �2Luit
Since
E1
T
0@ 1Xj=0
cs�jsuit�j
1A TXt=1
uit
!� E 1
T
0@ 1Xj=0
cs�jsuit�j�1
1A TXt=1
uit
!
= cs (1� �1)� cs�T � 1T
�(1� �1) +O
�T�2
�= O
�T�1
�for s = 1; 2:
wherec1 = �1 (�1 � �2) and c2 = ��2= (�1 � �2) :
Hence we have
plimN!1
1
N
NX TX(yit�1 � yit�2) (uit � ui�)
= �plim 1
N
NX TX(yit�1 � yit�2)ui� = O
�T�1
�That is,
plimN!1
��y � �
�= plim
N!1
��� �RPLS
�O (1) +O
�T�2
�The above logic goes through for general AR(p), hence we can say that
plimN!1
��y � �
�= plim
N!1(�� �RLSDV)
PNPT zityit�1PNPT z2it
!+ plimN!1
PNPT zit~uitPNPT z2it
!= plim
N!1(�� �RLSDV)O (1) +O
�T�2
�
28

it follows that the residual bias in �yis inconsequential.
29