beyond the scent: optical characterization of incense
TRANSCRIPT
Beyond the Scent: Optical Characterization of Incense Julian Haimovich1, Beizhan Yan2, James Ross2, Marco Baletta2 , Steve Chillrud2
1Columbia University, 2Lamont Doherty Earth Observatory
Introduction
キ The World Health Organization estimates that air pollution causes approximately 2 million premature deaths worldwide per year3 キMechanisms by which particulate matter (PM) causes mortality and morbidity are unkown キPM2.5 (2.5 microns or smaller in diameter) identified as most harmful because it can penetrate deepest into the lungs3 キIncense is used in both indoor and outdoor settings for personal use as well as for ceremonies (especially in Eastern Asia)3 キIncense has been associated with health outcomes related to prolonged exposure キIncense may be a confounder for optical measurements of Enviornmental Tobacco Smoke (ETS)
Methods
キ Ιncense burned in combustion Chamber (shown to right) キ Collected filters with varying mass loadings キOptical Analysis: integrated sphere, spectrometer, and balanced deuterium tungsten halogen light source with spectrum ranging from 250 to 1000 nm to measure absorption of light by particulate matter on filter キData analysis: end-member data plotted as Optical Density v. Mass loading and fit to Optical Density = (A)asinh(m/B)2 キFitted Data used in data-reduction program which carries out linear combination of 3 different components (BC, ETS, INC) キTested data with reduction program using synthetic data キArchived filters from NYC cohort study analyzed
References
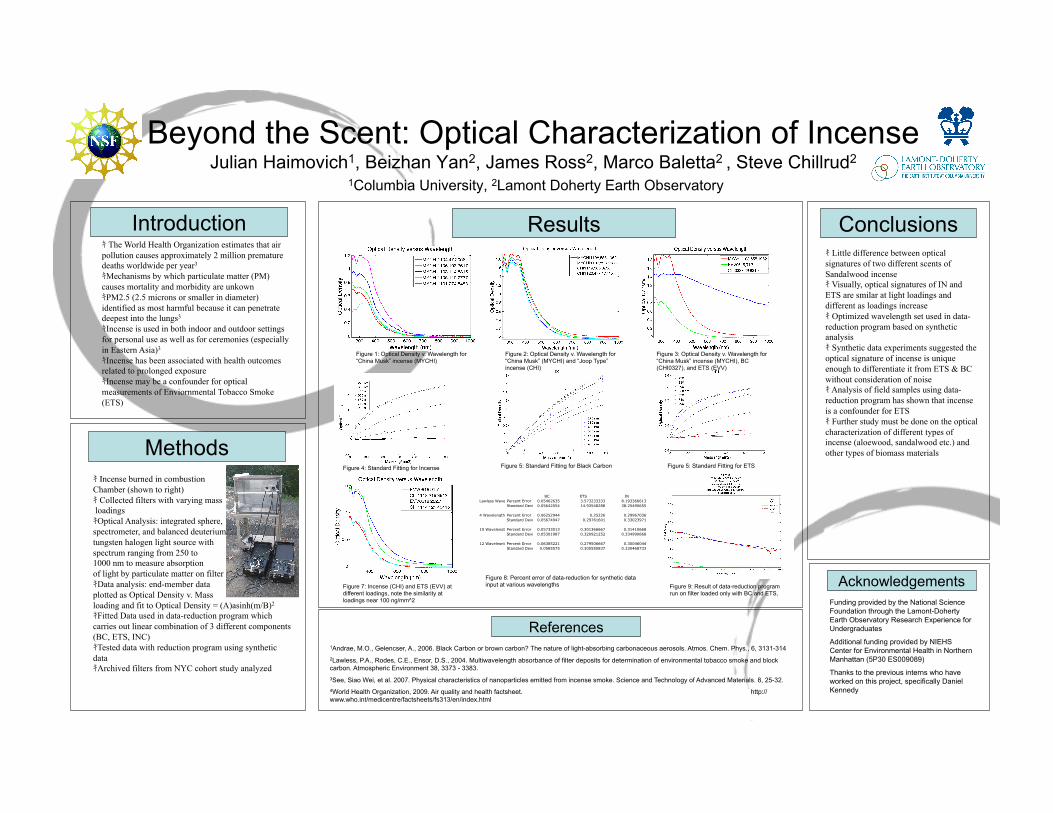
Conclusions Results
キ Little difference between optical signatures of two different scents of Sandalwood incense キ Visually, optical signatures of IN and ETS are smilar at light loadings and different as loadings increase キ Optimized wavelength set used in data-reduction program based on synthetic analysis キ Synthetic data experiments suggested the optical signature of incense is unique enough to differentiate it from ETS & BC without consideration of noise キ Analysis of field samples using data-reduction program has shown that incense is a confounder for ETS キ Further study must be done on the optical characterization of different types of incense (aloewood, sandalwood etc.) and other types of biomass materials
Acknowledgements
Figure 1: Optical Density v. Wavelength for “China Musk” incense (MYCHI)
Figure 2: Optical Density v. Wavelength for “China Musk” (MYCHI) and “Joop Type” incense (CHI)
Figure 3: Optical Density v. Wavelength for “China Musk” incense (MYCHI), BC (CHI0327), and ETS (EVV)
Figure 4: Standard Fitting for Incense Figure 5: Standard Fitting for Black Carbon Figure 5: Standard Fitting for ETS
Figure 7: Incense (CHI) and ETS (EVV) at different loadings, note the similarity at loadings near 100 ng/mm^2
BC ETS INLawless WavelengthsPercent Error 0.05462635 3.573233333 8.193366613
Standard Deviation0.05642054 14.93548288 38.25490655
4 WavelengthsPercent Error 0.06252944 0.25226 0.29967036Standard Deviation0.05674947 0.29761601 0.33023971
10 WavelengthsPercent Error 0.05733013 0.301366667 0.31410668Standard Deviation0.05301987 0.320921252 0.334990668
12 WavelegnthsPercent Error 0.06385221 0.279506667 0.30046044Standard Deviation0.0585575 0.305550837 0.330468733
Figure 8: Percent error of data-reduction for synthetic data input at various wavelengths Figure 9: Result of data-reduction program
run on filter loaded only with BC and ETS, Funding provided by the National Science Foundation through the Lamont-Doherty Earth Observatory Research Experience for Undergraduates
Additional funding provided by NIEHS Center for Environmental Health in Northern Manhattan (5P30 ES009089)
Thanks to the previous interns who have worked on this project, specifically Daniel Kennedy
1Andrae, M.O., Gelencser, A., 2006. Black Carbon or brown carbon? The nature of light-absorbing carbonaceous aerosols. Atmos. Chem. Phys., 6, 3131-314 2Lawless, P.A., Rodes, C.E., Ensor, D.S., 2004. Multiwavelength absorbance of filter deposits for determination of environmental tobacco smoke and block carbon. Atmospheric Environment 38, 3373 - 3383. 3See, Siao Wei, et al. 2007. Physical characteristics of nanoparticles emitted from incense smoke. Science and Technology of Advanced Materials. 8, 25-32. 4World Health Organization, 2009. Air quality and health factsheet. http://www.who.int/medicentre/factsheets/fs313/en/index.html