beyond the crisis: revisiting emerging … · ruben atoyan, phd* article** international monetary...
TRANSCRIPT

329
* The author thanks Thanos Arvanitis for extensive discussions and guidance, as well as Bas Bakker, Holger Floerkemeier, Albert Jaeger, Yuko Kinoshita, Zuzana Murgasova, Jesmin Rahman, and the Financial Theory and Practice reviewers for useful comments and suggestions. The author is also grateful to Dustin Smith for his excell-ent technical assistance.
An earlier draft of the paper was presented at Finance and Growth in Central and Eastern Europe conference April 29-30, 2010, Zagreb, Croatia.
This paper should not be reported as representing the views of the IMF. The views expressed herein are those of the author and do not necessarily represent those of the IMF or IMF policy.
** Received: April 1, 2010 Accepted: September 10, 2010
BEYOND THE CRISIS: REVISITING EMERGING EUROPE’S GROWTH MODEL
Ruben ATOYAN, PhD* Article**
International Monetary Fund, Washington JEL: E21, E22, O11, O47, O52
[email protected] UDC: 336.1
Abstract
Focusing on the nexus between economic growth and the buildup of external vulne-rabilities, this paper provides a systematic account of different growth strategies followed in Central and Eastern Europe in 2000-08 and then uses this growth diagnostics to deri-ve implications for a post-crisis recovery. The main findings point to three policy lessons for improving growth sustainability. First, greater reliance on tradable sectors should be the cornerstone of a future growth model. Second, enhancing domestic sources of bank credit funding would contribute to the mitigation of external vulnerabilities and make the domestic financial system more resilient to global financial shocks. Third, prudential and macroeconomic policies will have to be more proactive in managing capital inflows, in-cluding funneling these inflows into investment in export-oriented industries.
Keywords: sustainable economic growth, sources of growth, external vulnerabilities
1 Introduction
The recent crisis has had a profound effect on Central and Eastern European countries, raising questions about the sustainability of the pre-crisis growth models.

330
R. Atoyan: Beyond the crisis: revisiting emerging Europe’s growth modelFinancial Theory and Practice 34 (4) 329-356 (2010)
The turmoil derailed these economies from their pre-crisis pace of growth, impairing
productive capacity and balance sheets, raising unemployment, and sharply lowering
capital formation. In many cases, external and fiscal vulnerabilities worsened considerably.
As signs of financial stabilization are emerging, attention is increasingly shifting to the
quest for robust policy frameworks to restore external and domestic sustainability, promote
growth, and prevent another boom-bust cycle. Since countries pursued different economic
strategies prior to the crisis, thus entering the crisis with different degree of vulnerabilities,
the spectrum of experiences during the boom years can help us to draw lessons about the
broad characteristics of (un-)sustainable growth.
This paper seeks to provide a systematic account of different growth models followed in the region in 2000-08 and then uses this growth diagnostics to derive implications for a post-crisis recovery. The focus of recent research has been on contrasting various features
of growth models in different emerging-market regions.1 There is much to learn, however,
from the heterogeneity of growth experiences in Central and Eastern Europe. Therefore,
this paper contributes to the literature by providing a systematic account of different
growth models followed within the region. However, the standard taxonomy of emerging
Europe-into the Baltics, the CEE, the Balkans, and the CIS-can be overly simplistic. While
this taxonomy may be encompassing, critical heterogeneity exists within each group. Most
importantly, countries entered the crisis with different degrees of vulnerability as they had
pursued different economic strategies prior to the crisis.
An alternative approach to categorize experiences in emerging Europe proposed in this paper is to focus on the link between economic growth and the buildup of external vulnerabilities. What prior to the crisis appeared like a solid growth performance in some
countries in the region was built on brittle fundamentals. The growth solution often came
in the form of abundant, but ultimately unsustainable, capital inflows that bridged incre-
asing gaps between spending and incomes, fueled credit booms, and resulted in accumu-
lation of foreign liabilities, spilling over into large current account deficits.2 But there is
a great deal of heterogeneity in emerging Europe – including differences in structure of
economy, stage of convergence, policy stance, and perceptions of attractiveness for inve-
stors – suggesting that grouping countries according to the extent of accumulated exter-
nal vulnerabilities is likely to help distill the stylized facts of different growth models fo-
llowed by countries in the region. In other words, studying the joint determination of the
economic growth and the external vulnerability is the key to discovering a sustainable
growth model.
The main findings of the analysis point to three policy lessons for improving sustai-nability of growth in Central and Eastern Europe. First, greater reliance on tradable sec-tors should be the cornerstone of a future growth model. Enhancing the profitability of
tradable sectors, however, may prove to be challenging in an environment where large
foreign currency balance sheet vulnerabilities make exchange rate readjustment difficult.
In this context, measures enhancing external competiveness through improving the busi-
1 See Fabrizio, Leigh, and Mody (2009) and Schadler et al. (2007) for a comparison of growth performances and mechanisms in East European, East Asian, and Latin American emerging economies.
2 Abiad, Leigh, and Mody (2009) provide a useful analysis of the role of the “downhill” flow of capital in facilitating income convergence with Western Europe.

331
R. Atoyan: Beyond the crisis: revisiting emerging Europe’s growth modelFinancial Theory and Practice 34 (4) 329-356 (2010)
ness environment and cost competitiveness will be of critical importance. Second, grea-ter reliance on domestic sources of bank credit funding would contribute to the mitigati-
on of external vulnerabilities and make domestic financial systems more resilient to glo-
bal financial shocks. Third, prudential and macroeconomic policies will have to be more proactive in managing capital inflows, including funneling these inflows into investment
in export-oriented industries.
The paper’s focus is on comparative short-term growth performance of countries in Central and Eastern Europe. This is in contrast with a large pool of studies that have anal-
yzed the determinants of long-term income convergence along the lines of the neoclassical
growth model, which suggests that economies with relatively low per capita income sho-
uld be converging to their more developed peers (conditional on the same steady state).3
While economic growth is a long-term phenomenon and is typically studied through a
prism of traditional growth determinants (demographic factors, education, innovation, and
institutional factors), an accumulation of vulnerabilities raises risks of a hard landing with
its prolonged effects on economic growth and incomes, thus making it important to under-
stand the link between economic growth and vulnerabilities. In other words, the conver-
gence path may be volatile as countries with large imbalances adjust. The jury is still out
on whether a “higher risk” strategy can deliver sustainably higher growth returns than its
“low risk” alternative. In this respect, the present paper is similar to the study of key short-
term risks and medium-term challenges related to finance and convergence in emerging
Europe presented in Bems and Schellekens (2007); and Vamvakidis (2009).
The remainder of the paper is organized as follows. Section 2 identifies different vul-
nerability clusters among Central and Eastern European economies and discusses some
stylized differences in the growth strategies followed. Section 3, for the purpose of this
paper, defines growth model as the nexus between the economic growth and the buildup of
external vulnerability and empirically investigates the relative importance of various fac-
tors for its determination. Section 4 attempts to gain further insight into post-crisis growth
prospects in Central and Eastern Europe by using the estimated model to conduct a series
of illustrative simulations to gauge the extent to which shifts in the structure of economi-
es would facilitate development of a sustainable growth model in two European emerging
economies (Croatia and Slovakia). Finally, Section 5 outlines some policy implications.
2 Stylized facts of different growth models in Central and Eastern Europe
2.1 Clusters of external vulnerability
The starting point for identifying different growth models is the detection of cases where the boom years coincided with the accumulation of large external vulnerabilities. Specifically, we are interested in studying episodes where robust economic growth was
achieved at the expense of accumulation of large external liabilities and, in consequen-
ce, spilled over into large current account deficits. This is achieved by applying the hi-
erarchical cluster analysis, a method that allows finding of clusters of observations wit-
hin a data set (see appendix 1), to (i) the external debt in 2007 and (ii) the change in the
3 See Barro and Sala-í-Martin (2004).

332
R. Atoyan: Beyond the crisis: revisiting emerging Europe’s growth modelFinancial Theory and Practice 34 (4) 329-356 (2010)
current account balance between 2003 and 2007 (both expressed in percent of GDP).4
While heterogeneity among CEE countries is significant and can be recognized without
reliance on formal data-partitioning technique, the paper uses cluster analysis to avoid a
rather arbitrary process of grouping countries in the sample according to ad hoc threshol-
ds on vulnerability and growth indicators, particularly for countries with low vulnerabi-
lities. Also, it is important to recognize that external vulnerability clusters analyzed here
are used exclusively to group countries by the extent to which the external current acco-
unt has widened and by the accumulation of external debt.5 Hence an inclusion in one of
the vulnerability clusters should not be interpreted as a proxy for risk of a crisis.
Figure 1: External vulnerability clusters
4 As some of countries in the sample were already in crisis during 2008, the year of 2007 represents a good proxy for the end of the boom cycle. Results are reasonably robust to the choice of the benchmark years.
5 While a number of alternative metrics (e.g., the extent of currency mismatches, the composition of capital inflows, and deviation of the current account balance from the norm) of external vulnerability could be studied, the two-variable grouping used here has important advantages of tractability and ease of interpretation.
High
Medium
Low
ALBBLRRUSTURCZEBIH
ROMMKDPOLMDAUKRSVKSRBMNELTUHRV
Multivariate clustering is based on CA deficit (change in 2003-07)and external debt (level in 2007).
0 5,000 10,000 15,000 20,000 25,000
External vulnerability dendogram (Ward’s Method)
L2 squared dissimilarity measure
BGRHUNESTLVA
ALB
BIH
BLR
CZERUSTUR
HRVLTU
MDAMKD
MNEPOL
ROM
SRBSVKUKR
BGR
EST HUN
LVA
-25 -20 -15 -10 -5 0 5 10Current account balance, change 2003-07 (% of GDP).
Exter
nal d
ebt, 2
007 (
% of
GDP)
20
40
60
80
100
120
140
0
High
Medium
Low
-20
-16
-12
-8
-4
0
4
8
2000 2002 2004 2006 2008
Current account balance (% of GDP)
2000 2002 2004 2006 20080
20
40
60
80
100
120 External debt (% of GDP)
Low vulnerabilities, low initial income (broken line) – Albania (ALB), Belarus (BLR), Bosnia and Herzegovina (BIH), Russia (RUS); low vulnerabilities, high initial income (solid line) – Czech Republic (CZE), Turkey (TUR); medium vulnerabilities (circle marker) – Moldova (MDA), FYR Macedonia (MKD), Croatia (HRV), Lithuania (LTU), Montenegro (MNE), Poland (POL), Romania (ROM), Serbia (SRB), Slovakia (SVK), Ukraine (UKR); high vulnerabilities (diamond marker) – Bulgaria (BGR), Estonia (EST), Hungary (HUN), Latvia (LVA).

333
R. Atoyan: Beyond the crisis: revisiting emerging Europe’s growth modelFinancial Theory and Practice 34 (4) 329-356 (2010)
The analysis suggests at least three distinct external vulnerability clusters in Cen-tral and Eastern Europe that go well beyond the regional groupings (figure 1). Over the
years preceding the crisis, countries with low external vulnerability – the most diverse
cluster of the three in terms of types of countries including Albania, Belarus, Bosnia and
Herzegovina, Czech Republic, Russia, and Turkey – contained deterioration (or even re-
gistered an improvement) of the current account balance and entered the crisis with mo-
derate external debt (on average about 35 percent of GDP).6 The medium level vulnera-
bility countries (Croatia, Lithuania, the Former Yugoslav Republic of Macedonia, Mol-
dova, Montenegro, Poland, Romania, Serbia, Slovak Republic, and Ukraine) experienced
a notable widening of current account deficits and a significantly higher level of external
debt (on average about 7 percent of GDP and 60 percent of GDP, respectively). Finally,
countries in the high level vulnerability cluster (Bulgaria, Estonia, Hungary, and Latvia)
are primarily characterized by an exceptionally high external debt burden (over 100 per-
cent of GDP). However, current account balance dynamics varied widely across coun-
tries, ranging from improving modestly in Hungary to deteriorating by nearly 20 percent
of GDP in Bulgaria.7
2.2 Stylized facts
Notwithstanding large differences in external imbalances, the growth record was ro-bust in all countries, at least until 2008. Throughout the boom years, the average rate of
economic growth within each cluster was in the range of 6-7 percent per year, irrespec-
tive of the degree of external vulnerability (figure 2). Why didn’t the borrow-and-spend
behavior in high vulnerability countries yield stronger growth? As shown below, the an-
swer to this question underpins the essence of the growth strategies followed by these co-
untries: externally financed domestic demand growth in high vulnerability countries was
primarily driven by consumption and inward-oriented investment booms, thus spilling
over to exploding import bills and rising trade deficits. Accordingly, the growth-enhan-
cing effect of buoyant domestic demand was largely offset by the growth-depressing ef-
fect of negative net exports contributions.
Growth performances diverged drastically with the onset of the global financial cri-sis. Real GDP growth collapsed in the most vulnerable countries, reflecting a sudden stop
of capital flows and sharp contraction in domestic demand. Although to a notably smaller
extent, growth also plummeted in the more advanced countries with low external vulne-
rabilities on the back of falling demand for imports in advanced Europe. In contrast, eco-
nomic growth in 2008 fared markedly better in commodity exporters and the less financi-
ally developed and regionally integrated economies, although the former group also took
a hit once commodity prices dropped sharply amid the global slowdown.
6 It is important to stress heterogeneity of countries in the low vulnerability cluster as it covers countries of very different income level, ranging from Albania (10 percent of Euro Area level) to Czech Republic (over 50 percent of Euro Area level), which was recently recognized as an advanced economy. To highlight these critical differences, the low external vulnerability cluster is further clustered into two sub-groups based on the level of per capita income in 2003.
7 The two input variables enter cluster analysis in non-standardized way and thus differences in levels and variances influence variables’ relative importance in cluster determination. As a result, the stock vulnerabilities (external debt) dominate determination of dissimilarity between two individual countries, particularly for the high vulnerability cluster. The role of the flow vulnerabilities (current account balance) is to separate the low and the medium vulnerability clusters.

334
R. Atoyan: Beyond the crisis: revisiting emerging Europe’s growth modelFinancial Theory and Practice 34 (4) 329-356 (2010)
A deeper dissection of the driving forces of economic performance confirms signifi-cant heterogeneity in the underlying growth models. Systematic analysis of differences
across clusters of external vulnerability for factors traditionally thought to be important
for economic growth provides the following insights:
• Countries in higher vulnerability clusters had liberalized economies, pushed forward with structural reforms, and notably improved the business environment by the be-
ginning of the studied period (figure 3). These countries promptly completed broad
privatization programs, eliminated import and export restrictions, and facilitated fi-
nancial deepening through comprehensive banking reforms. Overall business en-
vironment in these countries was at par with that in high-income low-vulnerabili-
ty countries. In contrast, the less developed countries with low external vulnerabi-
lity had unfinished reform agendas and were beset by corruption, abuse of market
power, and weak competition.8, 9
• Countries in higher vulnerability clusters experienced credit and absorption booms
(figure 4). On the back of a benign external environment and, in many cases, propelled
8 As suggested by poor EBRD Transition Indicator and ICRG Institutional Quality ratings. 9 The role of the EU accession process is likely to be two fold. On the one hand, it has been the driving force of
structural reforms, making these reforms acceptable to the public, anchoring investor confidence, and creating solid foundation for future robust growth. On the other hand, prospects of approaching membership in the EU reduced market perceptions of risks associated with investing in these countries, often beyond the extent of what would be justified by fundamentals. With funding constraint not binding, an expectation of rapid convergence in real incomes translated into overleveraging, contributing to the buildup of vulnerabilities.
Figure 2: Economic growth
2000 2001 2002 2003 2004 2005 2006 2007 2008-2
0
2
4
6
8
10
Rea
l GD
P gr
owth
(%)
Low vulnerabilities, low initial income (broken line) – Albania, Belarus, Bosnia and Herzegovina, Russia.
Low vulnerabilities, high initial income (solid line) – Czech Republic, Turkey. Medium vulnerabilities (circle marker) – Moldova, FYR Macedonia, Croatia, Lithuania,
Montenegro, Poland, Romania, Serbia, Slovakia, Ukraine.High vulnerabilities (diamond marker) – Bulgaria, Estonia, Hungary, Latvia.

335
R. Atoyan: Beyond the crisis: revisiting emerging Europe’s growth modelFinancial Theory and Practice 34 (4) 329-356 (2010)
by strong reform records and EU accession prospects, capital flowed to these countri-
es at an overwhelming pace. In sharp contrast to the situation in countries in the low
vulnerability cluster, the composition of inflows progressively shifted toward debt-
creating, non-FDI flows. The increasingly foreign-owned banking systems revved-
up credit growth, most of which concentrated in the non-tradable sector.10 Hastened
financial deepening fueled the absorption-led growth and exacerbated the (often alre-
ady pronounced) non-tradable sector bias in the structure of these economies.
• Countries in higher vulnerability clusters were initially significantly more open-on account of global financial and trade integration-than many of their low vulnerability counterparts (figure 5).11 This wedge in the extent of integration to the global markets
widened rapidly over the boom years, primarily on account of amassing external lia-
bilities and exploding imports, exacerbating the negative contribution of the net fore-
ign demand to economic growth. While overall export performance has been mixed,
high-income low-vulnerability countries are typically characterized by a higher share
of high-value manufactured exports, probably reflecting their bigger industrial base.
• Countries in higher vulnerability clusters allowed little (if any) exchange rate flexi-bility (figure 6). In the face of massive capital inflows, leaning against nominal
appreciation implied significant central bank foreign currency purchases. As com-
plete sterilization was excessively costly, higher inflation in countries with fixed
exchange rate regimes lowered real interest rates, fueling credit booms and aggra-
vating external vulnerabilities. While erosion of competitiveness was not an obvio-
us problem, higher vulnerability countries’ expansion in the world export markets
was less vibrant.12 Moreover, fixed exchange rate regimes reduced perceptions of
the exchange rate risk and contributed to overleveraging and high degree of finan-
cial euroization.
• Countries in higher vulnerability clusters were characterized by somewhat more pro-cyclical fiscal stances than their low vulnerability counterparts (figure 6). It appe-
ars that fiscal policy was not the primary contributor to the buildup of external vul-
nerabilities: tax revenues were buoyant, fiscal balances were improving, and public
debt falling. Nonetheless, it can be argued that higher vulnerability countries – where
growth was driven by domestic demand booms – have benefitted more in terms of tax
revenue collection than their export-oriented counterparts. As the policymakers failed
fully to appreciate the cyclical nature of revenue buoyancy, government expenditures
grew notably (particularly after 2004), driving a significant deterioration in structural
10 Ranciere et al. (2010) show that borrowing costs lower in foreign than in domestic currency, even after taking into account market expectations for exchange rate movements, was among the primary drivers of overleveraging, particularly in the non-tradable sector.
11 While an economy’s openness is a very broad concept, for the purpose of this paper, trade and financial openness are defined as sums of exports and imports of goods and services and overall external assets and liabilities expressed as a ratio to GDP.
12 Bakker and Gulde (2010) show that countries where the nominal exchange rate appreciated showed less signs of overheating and lower nominal wage increases. As a result, external competitiveness in these countries was better preserved.

336
R. Atoyan: Beyond the crisis: revisiting emerging Europe’s growth modelFinancial Theory and Practice 34 (4) 329-356 (2010)
fiscal balances and adding to fiscal policy procyclicality.13 With the benefit of the hin-
dsight, arresting the buildup of external vulnerabilities would have required a tighter
fiscal stance from both demand-management and cyclical points of view.
13 Rahman (2010); and Bakker and Gulde (2010) provide extensive discussion of the fiscal policy stance in Cen-tral and Eastern European countries during the boom years.
Figure 3: Transition indicators and institutional quality
large scale privatization
trade and foreign exchangesystem
banking reform and interestrate liberalisation
corruption
small scale privatization
price liberalization
securities markets and non-bankfinancial institutions
law and order
governance and enterpriserestructuring
competition policy
overall infrastructure reform
investment profile
2000 2002 2004 2006 2008
4
3
1
2
02000 2002 2004 2006 2008
4
3
1
2
02000 2002 2004 2006 2008
4
3
1
2
0
2000 2002 2004 2006 2008
4
3
1
2
02000 2002 2004 2006 2008
4
3
1
2
02000 2002 2004 2006 2008
4
3
1
2
0
2000 2002 2004 2006 2008
4
3
1
2
02000 2002 2004 2006 2008
4
3
1
2
02000 2002 2004 2006 2008
4
3
1
2
0
2000 2002 2004 2006 2008
6
4
5
2
3
1
02000 2002 2004 2006 2008
6
4
5
2
3
1
02000 2002 2004 2006 2008
12
8
10
4
6
2
0
Source: EBRD Transition indices, ICRG indices (last row). Low vulnerabilities, low initial income (broken line) – Albania, Belarus, Bosnia and Herzegovina, Russia. Low vulnerabilities, high initial income (solid line) – Czech Republic, Turkey. Medium vulnerabilities (circle marker) – Moldova, FYR Macedonia, Croatia, Lithuania, Montenegro,
Poland, Romania, Serbia, Slovakia, Ukraine.High vulnerabilities (diamond marker) – Bulgaria, Estonia, Hungary, Latvia.

337
R. Atoyan: Beyond the crisis: revisiting emerging Europe’s growth modelFinancial Theory and Practice 34 (4) 329-356 (2010)
Figure 4: Capital flows, credit, and domestic demand
2000 2002 2004 2006 2008
25
20
15
10
5
0
Net private capital flows(% of GDP)
2000 2002 2004 2006 2008
25
20
15
10
5
0
FDI (% of GDP)
2000 2002 2004 2006 2008
90
80
70
60
50
40
30
20
10
0
Private credit (% of GDP)
2000 2002 2004 2006 2008
20
15
5
10
0
-5
-10
Domestic demand contribution to growth (%)
2000 2002 2004 2006 2008
80
75
70
65
60
55
Private consumption (% of GDP)
2000 2002 2004 2006 2008
80
75
70
65
60
55
Share of non-tradable sectors in real GDP (%)
Low vulnerabilities, low initial income (broken line) – Albania, Belarus, Bosnia and Herzegovina, Russia.
Low vulnerabilities, high initial income (solid line) – Czech Republic, Turkey. Medium vulnerabilities (circle marker) – Moldova, FYR Macedonia, Croatia, Lithuania,
Montenegro, Poland, Romania, Serbia, Slovakia, Ukraine. High vulnerabilities (diamond marker) – Bulgaria, Estonia, Hungary, Latvia.

338
R. Atoyan: Beyond the crisis: revisiting emerging Europe’s growth modelFinancial Theory and Practice 34 (4) 329-356 (2010)
Figure 5: External sector indicators
2000 2002 2004 2006 2008
360
310
260
210
160
110
60
Financial openness(assets+liabilities, % of GDP)
2000 2002 2004 2006 2008
160
140
120
100
80
60
Trade openness(exports+imports, % of GDP)
2000 2002 2004 2006 2008
80
70
60
50
40
30
Exports (% of GDP) Imports (% of GDP)
2000 2002 2004 2006 2008
6
4
2
0
-2
-4
-6
-8
Net exports contribution to growth (%)
2000 2002 2004 2006 2008
80
70
60
50
40
30
2000 2002 2004 2006 2008
100
90
80
70
60
50
Manufactured exports (% of GDP)
Low vulnerabilities, low initial income (broken line) – Albania, Belarus, Bosnia and Herzegovina, Russia.
Low vulnerabilities, high initial income (solid line) – Czech Republic, Turkey. Medium vulnerabilities (circle marker) – Moldova, FYR Macedonia, Croatia, Lithuania, Montenegro,
Poland, Romania, Serbia, Slovakia, Ukraine. High vulnerabilities (diamond marker) – Bulgaria, Estonia, Hungary, Latvia.

339
R. Atoyan: Beyond the crisis: revisiting emerging Europe’s growth modelFinancial Theory and Practice 34 (4) 329-356 (2010)
Figure 6: Policy indicators
2000 2002 2004 2006 2008
8
7
6
4
5
2
3
1
0
Exchange rate regime(AREAER code)
2000 2002 2004 2006 2008
140
120
110
130
100
90
80
REER(2003=100)
2000 2002 2004 2006 2008
220
200
180
160
140
120
100
Market share of world exports(2000=100)
FX debt of non-financial sector, 2008* 1/ (% of GDP)
2000 2002 2004 2006 2008
4
2
0
-2
-6
-4
-8
-10
-12
Structural fiscal balance(% of GDP)
120
100
80
60
20
40
0
2000 2002 2004 2006 2008
47
45
43
41
39
37
General government expenditures (% of GDP)
low vuln.,high
income
low vuln.,low
income
medium
high
Low vulnerabilities, low initial income (broken line) – Albania, Belarus, Bosnia and Herzegovina, Russia.
Low vulnerabilities, high initial income (solid line) – Czech Republic, Turkey. Medium vulnerabilities (circle marker) – Moldova, FYR Macedonia, Croatia, Lithuania, Montenegro,
Poland, Romania, Serbia, Slovakia, Ukraine. High vulnerabilities (diamond marker) – Bulgaria, Estonia, Hungary, Latvia.* 1/ Country coverage is constrained by data availability.

340
R. Atoyan: Beyond the crisis: revisiting emerging Europe’s growth modelFinancial Theory and Practice 34 (4) 329-356 (2010)
3 Joint determination of economic growth and external vulnerability
The evidence from the previous section suggests a link between economic growth and the buildup of external vulnerabilities. Therefore, there seems to be a case for defining an economic growth model as a joint outcome of economic growth and external vulnerability.
The significant heterogeneity among countries in initial conditions, policy stances, and
external conditions, even between countries of similar vulnerability levels, begs the
question of whether it is possible to identify more systematically the specific factors
that influence determination of the growth model. Determination of the growth model,
however, should not be viewed as if it were fully a matter of choice of countries in Central
and Eastern Europe. In contrast, the recent growth-followed-by-crisis model in some
of the countries in the sample was, to a large extent, more “accidental” than chosen or
planned.14 With this important caveat in mind, this section studies the evolution of growth-
vulnerability outcomes in the sample and estimates a model linking the probability of a
specific growth-vulnerability outcome to a number of explanatory variables, with a view
to evaluating their relative importance in defining growth performances.
3.1 Growth-vulnerability nexus
The wide spectrum of growth models pursued in Central and Eastern Europe can be described in terms of joint growth-vulnerability outcomes. Applying the hierarchical clu-
ster analysis to vulnerability indicators (current account deficit and external debt, both
expressed in percent of GDP) and economic growth rates (in percent) on a year-by-year
basis helps to trace the evolution of growth models in the sample (figure 7). To keep thin-
gs tractable in terms of the number of the analyzed growth models (joint growth-vulne-
rability outcomes), three vulnerability (3-high, 2-medium, and 1-low) and two growth
(2-high and 1-low) clusters are identified in the sample for each year. Thus, evolution of
a growth model in a given country can be described by six possible growth-vulnerabili-
ty outcomes:15
GVit = {23, 22, 21, 13, 12, 11}
While most of the countries do not exclusively fall into a single growth-vulnerability
cluster throughout the sample, the “saints” (high growth and low and, perhaps, medium
vulnerability) and the “sinners” (high growth and high vulnerabilities or, even worse, low
growth and high vulnerabilities) of Central and Eastern Europe can be easily identified.
For instance, the former group may be associated with certain spans of macroeconomic
performance in Poland, Slovakia, and Turkey, while the latter group would include Estonia,
Hungary, and Latvia.
14 See Section 5 for more discussion.15 It is important to recognize that, despite appearances, the six growth-vulnerability outcomes do not have a
well-defined and ordered structure. While it can be argued that the high growth/low vulnerability cluster is clearly “superior” to the low growth/high vulnerability cluster, the choice between, for example, low growth/low vulnerability and high growth/high vulnerability clusters is less obvious.

341
R. Atoyan: Beyond the crisis: revisiting emerging Europe’s growth modelFinancial Theory and Practice 34 (4) 329-356 (2010)
3.2 Potential factors determining the growth model
Conceptually, the factors expected to influence the determination of the economic
growth model can be divided into three categories.
• Structural characteristics of the economy: A country’s initial stage of convergen-
ce to EU income levels is likely to have a bearing on both the pace of economic
growth and the level of external vulnerabilities. For instance, countries at early sta-
ges of convergence often experience high catch-up growth and run current account
deficits. These may not necessarily be grounds for concern, particularly if reflecting
FDI-financed investment booms or if followed by a surge in exports that leads to
a normalization of initial buildup of external vulnerabilities back to sustainable le-
vels. In addition, the extent of integration into the global financial system and trade
openness are also likely to be important features of an economic growth model.
• Policy stance: A country’s policy choices can be expected to have considerable
impact on growth. For instance, a choice of pegged exchange rate regime may
encourage overleveraging of the private sector (by reducing the currency risk
premium in the interest rate term structure) and undermine competitiveness
and development of the tradable sector (particularly if aggravated by exchange
rate movements of main competitors). Similarly, macro-prudential regulations
(including prudential limits of foreign exchange exposure, loan-to-value ratios,
leverage and liquidity ratios) are likely to have a bearing on external borrowing
and domestic credit growth and thus the extent of fragilities engendered by boom-
bust cycles.16 Finally, countries with underlying structural fiscal problems and
oversized public sectors may require high taxes, particularly on labor, which favors
informal economic activities and therefore nontradables and consumption. Equally
importantly, fiscal policy is significant for demand management and prospects of
fiscal medium-term sustainability are imperative for the country’s risk premium,
business environment, and investor climate.
• External factors: While capital inflows to emerging markets generally boost growth,
signaling market confidence in the fundamentals of the economy and providing
lower cost financing, sudden surges – caused by shifts in investors’ appetite for
emerging market risks and global liquidity conditions – can also complicate ma-
croeconomic management and create financial risks. On the macroeconomic front,
the surge in capital inflows may lead to exchange rate appreciation and faltering
external competitiveness, possibly undermining development of the tradable sec-
tor. On the financial front, the surge in capital inflows may lead to excessive fore-
ign borrowing and foreign currency exposures, fueling domestic credit booms and
asset bubbles. In addition to the size of capital inflows, the structure of capital flows
is likely to have a considerable impact on the nature of economic growth model:
debt and perhaps certain forms of financial FDI may be inductive of domestic len-
ding and consumption booms.
16 See Ostry et al. (2010).

342
R. Atoyan: Beyond the crisis: revisiting emerging Europe’s growth modelFinancial Theory and Practice 34 (4) 329-356 (2010)
2000 2001 2002 2003 2004 2005 2006 2007 2008
ALBGrowth 2 2 2 2 1 1 1 1 2
Vulnerability 1 1 1 1 1 1 1 1 1
BGRGrowth 2 2 2 2 2 1 1 1 2
Vulnerability 2 2 2 3 2 2 2 3 3
BIHGrowth 2 2 2 1 2 1 1 1 2
Vulnerability 1 2 2 3 1 2 1 2 2
BLRGrowth 2 2 2 2 2 2 2 2 2
Vulnerability 1 1 1 1 1 1 1 1 1
CZEGrowth 1 2 1 1 1 1 1 1 1
Vulnerability 1 1 1 1 1 1 1 1 1
ESTGrowth 2 2 2 2 2 2 2 1 1
Vulnerability 2 2 2 3 3 3 3 3 3
HRVGrowth 1 2 2 2 1 1 1 1 1
Vulnerability 2 2 2 3 3 2 2 2 2
HUNGrowth 2 2 2 1 1 1 1 1 1
Vulnerability 2 2 2 3 2 2 3 3 3
LTUGrowth 1 2 2 2 2 2 1 2 1
Vulnerability 1 2 1 2 1 1 2 2 2
LVAGrowth 2 2 2 2 2 2 2 2 1
Vulnerability 2 2 3 3 3 3 3 3 3
MDAGrowth 1 2 2 2 2 2 1 1 2
Vulnerability 3 3 3 3 2 2 2 2 2
MKDGrowth 1 1 1 1 1 1 1 1 2
Vulnerability 2 2 1 2 1 1 1 2 2
MNEGrowth 1 2 1 1 1 1 1 2 2
Vulnerability . . . 1 1 1 1 2 2
POLGrowth 1 2 1 1 1 1 1 1 2
Vulnerability 1 1 1 2 1 1 1 2 2
ROMGrowth 1 2 2 2 2 1 1 1 2
Vulnerability 1 1 1 1 1 1 1 2 2
RUSGrowth 2 2 2 2 2 1 1 2 2
Vulnerability 2 2 1 2 1 1 1 1 1
SRBGrowth 2 2 2 1 2 1 1 1 2
Vulnerability 3 3 3 3 2 2 2 2 2
SVKGrowth 1 2 2 2 1 1 1 2 2
Vulnerability 2 2 2 2 2 2 2 2 2
TURGrowth 2 1 2 2 2 2 1 1 1
Vulnerability 1 2 2 2 1 1 1 1 1
UKRGrowth 2 2 2 2 2 1 1 2 1
Vulnerability 2 2 1 2 1 1 1 2 2
Figure 7: Growth-vulnerability track record
Cluster
Growth2 High
1 Low
Vulnerability
3 High
2 Medium
1 Low
Note: Vulnerability clusters are based on current account defi-cit and external debt. Country abbreviations are as follows: Albania (ALB), Belarus (BLR), Bosnia and Herzegovina (BIH), Bulgaria (BGR), Croatia (HRV), Czech Republic (CZE), Estonia (EST), FYR Macedonia (MKD), Hungary (HUN), Latvia (LVA), Lithuania (LTU), Moldova (MDA), Montenegro (MNE), Poland (POL), Romania (ROM), Russia (RUS), Serbia (SRB), Slovakia (SVK), Turkey (TUR), Ukraine (UKR).

343
R. Atoyan: Beyond the crisis: revisiting emerging Europe’s growth modelFinancial Theory and Practice 34 (4) 329-356 (2010)
Structural policy measures are also likely to be important determinants of a growth model given their influence on the business environment and investment climate.17 Lack
of significant progress in this area may pose important bottlenecks to growth. Indeed,
Mitra et al. (2009) find that years preceding the crisis saw the socialist legacy of high en-
dowments of infrastructure and labor skills disappear, significantly constraining firms’
expansion potential. Furthermore, the record of building market economy institutions has
been mixed: while concerns about tax administration and customs regulations have fallen
significantly in most CEE countries, concerns about the legal environment and corrupti-
on have been steadily on the rise. On the other hand, significant progress has been made
in improving access to bank financing and in de-shadowing the economy.
3.3 Econometric methodology
The influence of the abovementioned factors is estimated within the framework of a multinomial logit model. The model assumes that the probability of the membership in
one of the growth-vulnerability clusters (m=11, 12, 13, 21, 22) relative to the probabili-
ty of membership in the reference high-growth/high-vulnerability cluster (m=23) can be
modeled as follows:18,19
The probability of a country belonging to one of the non-reference clusters can be
computed as:
,
and for the reference cluster:
.
The model specification includes a range of variables covering the above-mentioned
categories of factors influencing determination of the economic growth model:
17 These measures are omitted from the empirical analysis, however, on account of the difficulty quantifying their impact.
18 The reference cluster is chosen to facilitate interpretation of policy implications and has no bearing for the model estimation implemented by the generalized linear latent and mixed model procedure.
19 As in any choice model in a panel setting, the model may be subject to the presence of unobserved effects, including the presence of state dependence. However, this type of “country-branding” is unlikely to be excessively strong in the sample as countries frequently transited across clusters. To account for the unobserved factors, the model assumes the presence of a random effect at the country level. Whether this approach is fully successful in accounting for the unobserved effects – completely eliminating potential for the presence of the parameter bias – is an empirical question that lies outside of the scope of this paper (see Abramson et al., 2000).

344
R. Atoyan: Beyond the crisis: revisiting emerging Europe’s growth modelFinancial Theory and Practice 34 (4) 329-356 (2010)
• With respect to the structural characteristics of the economy, the model controls
for the income per capita (in percent of the euro area average) and exports-to-GDP
ratio, as well as indicators of trade openness (proxied by the sum of exports and im-
ports of goods and services) and financial openness (proxied by the sum of exter-
nal assets and liabilities), also expressed in percent of GDP.20
• In terms of policy stance, the model includes overall fiscal balance (in percent of
GDP), private credit growth (in percent), and the exchange rate regime (based on
the Fund’s AREAER classification).
• External factors are proxied by the ratios to GDP of the net private capital flows
and foreign direct investment.21
3.4 Estimation results
The estimated parameter values for each growth-vulnerability cluster are shown in
table 1 and associated relative risk ratios, measuring the risk of a country being in the cu-
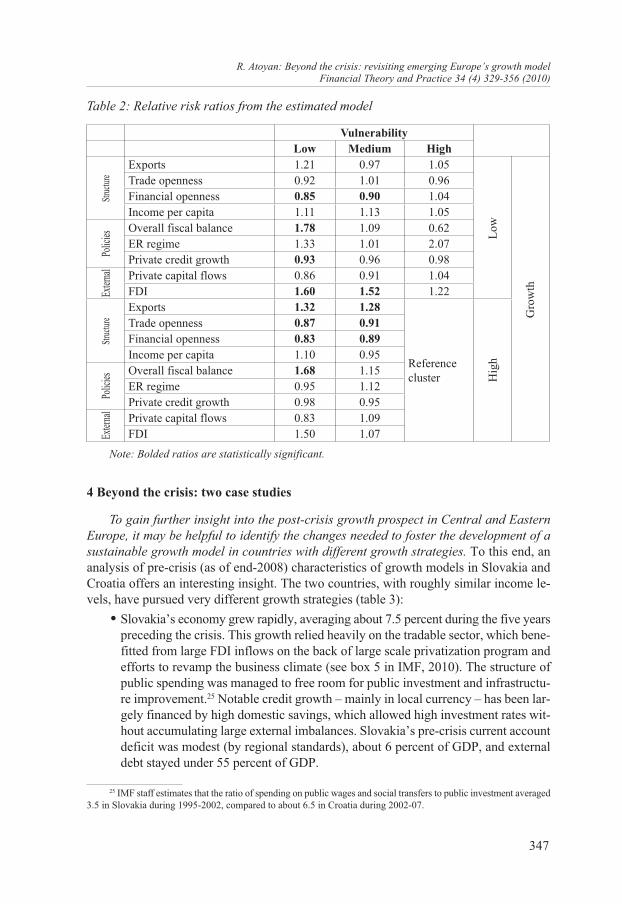
rrent cluster relative to the exposure, are reported in table 2.22 The findings suggest that the
structural characteristics of the economy are the key to high and sustainable growth.
• The degree of external financial openness is shown to be an important determinant of the growth model, particularly along the vulnerability dimension. Levels of finan-
cial openness more moderate than in the referenced high-growth/high-vulnerability
cluster are strongly associated with growth models with lower external vulnerabi-
lities, with no direct link to growth prospect deterioration (as suggested by broadly
similar values of the estimated coefficients across the growth dimension of the clu-
sters). Indirectly, however, reduced financial openness is likely to be at the expense
of lower credit growth and thus of lower economic growth (see below).
• The composition of trade openness matters for the choice of the growth model, par-ticularly along the growth dimension. Countries with trade openness arising from
higher exports – rather than from imports – are more likely to be in high growth
clusters that are also characterized by lower external vulnerabilities. Furthermo-
re, the magnitudes of the risk ratios suggested by the model imply that returns in
terms of the increased probability of moving toward a sustainable growth model
are high, even in the case of a relatively small shift towards the more export-ori-
ented model.
20 Jones and Olken (2005) show that changes in both exports-to-GDP and trade openness (exports plus imports-to-GDP) are positively associated with up-breaks in economic growth. Increasing importance of exports may signal the efficiency gains arising from cross-sector reallocation of factors toward the country’s comparative advantage. Increasing trade openness may signal increased productivity through increased scale economies, enhanced technology spillovers, and efficiency improvements. But it may also reflect growth-subtracting spillovers from buoyant domestic consumption.
21 Strictly speaking, the level and the composition of capital flows to a country is a joint outcome of external factors (as it reflects global liquidity conditions), macroeconomic policies (as it reflects investors’ risk perceptions), and structural characteristics of the economy (as it reflects availability of business opportunities and ease of doing business).
22 Relative risk ratio measures the risk of a country being in the current cluster relative to the exposure (one unit increase in the underlining variable): RR=P(GV=ij)/P(GV=23). A relative risk ratio of less (greater) than one suggests that the current growth-vulnerability cluster is less (more) likely than the reference cluster.

345
R. Atoyan: Beyond the crisis: revisiting emerging Europe’s growth modelFinancial Theory and Practice 34 (4) 329-356 (2010)
• There is no strong evidence that income convergence by itself is associated with the move toward a more sustainable growth model. In the sample, per capita income is
only weakly associated with higher probability of being in the high-growth/lower-
vulnerability clusters: the coefficient has the right sign but fails to be statistically
significant in most model specifications. This finding is not surprising, however,
as evidence from the region suggests that normalization of external vulnerabilities
in the high growth environment is preconditioned by a strong structural reform re-
cord, surge in FDI, and large expansion of the export sector.23
The econometric results also suggest that the authorities’ policy stance and external factors have considerable bearing on the choice of the growth model.
• There is strong empirical evidence that fiscal prudence goes hand-in-hand with growth models associated with lower external vulnerabilities. Keeping all other
growth determinants constant, the model suggests that countries with larger fiscal
surpluses (or smaller deficits) are significantly less likely to run large external def-
icits and pile up external liabilities than their counterparts following more relaxed
fiscal policies.24 Nevertheless, the data seem to suggest that contractionary effect
of fiscal tightening may be dominating the growth-enhancing confidence effect of
fiscal consolidation: magnitudes of the relative risk ratios imply that a country em-
barking on the path of fiscal consolidation is likely to move toward lower external
vulnerability but perhaps at the cost of lower economic growth.
• Credit growth is found to be conducive to economic growth, particularly if financed by domestic savings and channeled to export-oriented sectors. Not surprisingly,
countries with the anemic private sector credit are likely to grow slower than their
peers. It should be recognized, however, that the source of the credit expansion fund-
ing is very important: as shown above, excessive financial openness often associ-
ated with overly buoyant foreign-financed credit growth is found to be detrimen-
tal to the sustainability of the growth model. Similarly, credit booms risk spilling
over into consumption growth and widening import bills, worsening the composi-
tion of the country’s trade openness. Put together, these findings argue that poli-
cies need to focus on encouraging financial deepening arising from channeling do-
mestic savings into domestic investment, particularly those that flow into export-
oriented industries.
The structure and the scale of capital inflows are found to influence the choice of growth model. Surges in capital inflows – particularly if skewed toward non-FDI debt-
creating flows – significantly increase the probability of a country being in the referenced
high-growth/high-vulnerability cluster, reflecting high risks of faltering competitiveness
and consumption-driven over-indebtedness. These results suggest that in an environment
in which capital flows to emerging markets are reviving, macroeconomic management
23 Slovakia exemplified a successful transition: the country, widely considered a difficult case in the 1990s, undertook sweeping structural reforms, ran high current account deficits, mostly financed by FDI, then saw a surge in exports, and current account deficits normalizing back to sustainable levels.
24 Bakker and Gulde (2010) argue that fiscal policy in some countries in Eastern Europe was too loose from a demand management prospective as spending was particularly high in overheating countries. Similarly, Rahman (2010) finds evidence of significant pro-cyclicality of the government expenditures in the region.

346
R. Atoyan: Beyond the crisis: revisiting emerging Europe’s growth modelFinancial Theory and Practice 34 (4) 329-356 (2010)
needs to focus on improving the attractiveness of the economy to strategic long-term in-
vestors (including through greater exchange rate flexibility and structural reforms) and
design policies (including prudential and tax policy measures) channeling inflows and do-
mestic lending to the tradable sector.
Table 1: Estimation results for the multinomial logit model
Vulnerability Low Medium High
Exports 0.19 -0.03 0.05Trade openness -0.09 0.01 -0.04Financial openness -0.16*** -0.10*** 0.04Income per capita 0.11 0.12 0.05Overall fiscal balance 0.58** 0.08 -0.47ER regime 0.28 0.01 0.73Private credit growth -0.07* -0.04 -0.03Private capital flows -0.15 -0.09 0.04FDI 0.47** 0.42** 0.20
Constant 23.10*** 14.86** 13.06Exports 0.27** 0.25**
Reference cluster
Trade openness -0.13* -0.09*Financial openness -0.19*** -0.11***Income per capita 0.10 -0.05Overall fiscal balance 0.52** 0.14ER regime -0.05 0.11Private credit growth -0.02 -0.05Private capital flows -0.19 0.08FDI 0.41 0.07
Constant 27.87*** 18.20***
Low
Hig
h
Gro
wth
Struct
urePo
licies
Exter
nal
Note: Bolded parameters are statistically significant. ***, **, and * indicate significance at the 1 percent, 5 percent, and 10 percent levels of significance.
Number of level 1 units = 141Number of level 2 units = 17Condition number = 10917.446Log likelihood = –130.12055Variances and covariances of random***level 2 (country_id)var(1): 2.784e-14 (1.998e-07)
Struct
urePo
licies
Exter
nal
347
R. Atoyan: Beyond the crisis: revisiting emerging Europe’s growth modelFinancial Theory and Practice 34 (4) 329-356 (2010)
4 Beyond the crisis: two case studies
To gain further insight into the post-crisis growth prospect in Central and Eastern Europe, it may be helpful to identify the changes needed to foster the development of a sustainable growth model in countries with different growth strategies. To this end, an
analysis of pre-crisis (as of end-2008) characteristics of growth models in Slovakia and
Croatia offers an interesting insight. The two countries, with roughly similar income le-
vels, have pursued very different growth strategies (table 3):
• Slovakia’s economy grew rapidly, averaging about 7.5 percent during the five years
preceding the crisis. This growth relied heavily on the tradable sector, which bene-
fitted from large FDI inflows on the back of large scale privatization program and
efforts to revamp the business climate (see box 5 in IMF, 2010). The structure of
public spending was managed to free room for public investment and infrastructu-
re improvement.25 Notable credit growth – mainly in local currency – has been lar-
gely financed by high domestic savings, which allowed high investment rates wit-
hout accumulating large external imbalances. Slovakia’s pre-crisis current account
deficit was modest (by regional standards), about 6 percent of GDP, and external
debt stayed under 55 percent of GDP.
25 IMF staff estimates that the ratio of spending on public wages and social transfers to public investment averaged 3.5 in Slovakia during 1995-2002, compared to about 6.5 in Croatia during 2002-07.
Table 2: Relative risk ratios from the estimated model
Low
Hig
h
Gro
wth
Struct
urePo
licies
Exter
nalStr
ucture
Polic
iesEx
ternal
Vulnerability Low Medium High
Exports 1.21 0.97 1.05Trade openness 0.92 1.01 0.96Financial openness 0.85 0.90 1.04Income per capita 1.11 1.13 1.05Overall fiscal balance 1.78 1.09 0.62ER regime 1.33 1.01 2.07Private credit growth 0.93 0.96 0.98Private capital flows 0.86 0.91 1.04FDI 1.60 1.52 1.22Exports 1.32 1.28
Reference cluster
Trade openness 0.87 0.91Financial openness 0.83 0.89Income per capita 1.10 0.95Overall fiscal balance 1.68 1.15ER regime 0.95 1.12Private credit growth 0.98 0.95Private capital flows 0.83 1.09FDI 1.50 1.07
Note: Bolded ratios are statistically significant.

348
R. Atoyan: Beyond the crisis: revisiting emerging Europe’s growth modelFinancial Theory and Practice 34 (4) 329-356 (2010)
• Croatia’s economy registered a respectable, but notably more moderate, pace of
economic development – about half of Slovakia’s growth. In the face of increasin-
gly large capital inflows, the policies aimed to lessen the imbalances although limi-
tations soon became evident: prudential and regulatory measures were only parti-
ally effective in restraining strong credit demand and the fiscal stance lacked suffi-
cient force to ease demand pressures (see IMF, 2009).26 While not capable of fully
offsetting overheating pressures, leaning against the wind seemed to have produ-
ced some tangible payoffs: as of 2008, the private sector credit growth was conta-
ined at about 10 percent per annum and the pre-crisis current account deficit and
external debt-albeit rapidly rising-peaked at 9 percent of GDP and 81 percent of
GDP, respectively.
Table 3: Slovakia and Croatia: pre-crisis characteristics (2008)
Slovakia Croatia
Vulnerability,Growth
Current account balance -6 -9External debt 55 81Growth (5-year average), % 7.4 4.2
Structure
Exports 82 42Trade openness 165 92Financial openness 130 159Income per capita, EA=100 41 36
PoliciesOverall fiscal balance -2 -1ER regime, AREAER 4 3Private credit growth, % 15 12
ExternalPrivate capital flows 5 10FDI 3 6
Note: In percent of GDP, unless indicated otherwise.
A series of illustrative simulations is conducted to gauge the extent to which shifts in the structure of the Slovak and Croatian economies would facilitate the development of high-growth/low-vulnerability growth model. First, the estimated parameters and the pre-
crisis values of the model variables are used to construct the baseline-predicted probabi-
lity of being in each of the six growth-vulnerability clusters. Second, sequentially adding
the impact of the changes in individual variables on the predicted probability of different
growth-vulnerability clusters, the analysis attempts to find a feasible combination of the
growth model determinants that would increase the likelihood of a transition to a sustai-
nable growth model.
26 With over 90 percent of banking system being foreign-owned, certain prudential measures (e.g., introduction of marginal reserve requirement rate) encouraged parent banks to fund their Croatian subsidiaries through beefing up their equity rather than by debt financing. This raised banking system buffers and, to some extent, moderated the pace of external debt accumulation. On the other hand, bank credit ceilings were only partially effective in limiting private sector credit growth as the best corporate clients shifted to direct cross-border financing.

349
R. Atoyan: Beyond the crisis: revisiting emerging Europe’s growth modelFinancial Theory and Practice 34 (4) 329-356 (2010)
An important point to note is that simulations discussed in this section are partial in their nature and should not be taken literally. As such, conclusions below need to
be interpreted as indications of the general direction for policy formulation, rather than
the quantitative goal posts. Furthermore, excluded from this analysis are risks for long-
term growth associated with “excessive” specialization in a single industry that need to
be mitigated by a sufficient degree of economic diversification.27 With these important
caveats in mind, the following observations highlighting the differences in countries’ pre-
crisis initial positions are worth noting.
The estimated model suggests that Slovakia already appears to have many of the pre-
conditions needed to facilitate development of a high-growth/low-vulnerability growth
model.
• Moderate external deleveraging is likely to be conducive to growth and would help anchor external vulnerability at a low level (figure 8, left upper chart). The relati-
vely high estimated probability of low-vulnerability clusters (at the 2008 level of
model determinants) suggests that Slovakia has been on the right path to contain
external vulnerabilities. Further moderate shrinkage of the external balance sheet
is likely to be highly conducive to economic growth: the estimated probability of
high-growth/low-vulnerability cluster is rising rapidly for even moderate reducti-
on in financial openness.
• The growth is likely to be supported by global economic recovery, which would sti-mulate exports (figure 8, right upper chart). With some reduction in financial ope-
nness (i.e., external deleveraging), a rebound of global economic growth is likely
to further boost Slovakia’s (already high) export-to-GDP ratio, probably bringing
it closer to its pre-crisis level (about 90 percent of GDP) and yielding high growth
dividends: the estimated probability of high-growth/low-vulnerability cluster be-
comes dominant for export-to-GDP ratios above 90 percent of GDP.
• The economic growth is also likely to get another boost from improvements in do-mestic credit conditions (figure 8, left lower chart). While Slovakia experienced he-
althy credit growth of 15 percent in 2008, this level is still somewhat lower than the
average credit growth of about 20 percent in the recent years, probably reflecting
the initial impact of the global financial jitters on investor confidence and banks’
willingness to extend credit. As the global attitude towards risk relaxes, the flow
of credit to the economy is also likely to increase somewhat, adding an extra boost
to economic growth: the estimated probability of high-growth/low-vulnerability
cluster is quickly becoming dominant for even small increase in credit growth. As
much of the banking sector credit funding already comes from domestic sources,
the impact on external vulnerability is likely to be very limited.
• The room for countercyclical fiscal policy maneuver is likely to be ample (figure 8,
right lower chart). While fiscal consolidation would be somewhat contractionary:
27 Some of these risks have already materialized. Indeed, a slowdown in Slovakian growth performance since the last quarter of 2008 is, to a large extent, a reflection of its excessive specialization in the automotive industry. On the other hand, risks related to Croatia’s specialization in tourism have not played an important role during the current crisis.

350
R. Atoyan: Beyond the crisis: revisiting emerging Europe’s growth modelFinancial Theory and Practice 34 (4) 329-356 (2010)
Figure 8: Slovakia: predicted probability of growth-vulnerability clusters
70 90 110 130 150 170 190
1.00.90.80.70.60.50.40.30.20.10.0
70 75 80 82 85 90 95
1.00.90.80.70.60.50.40.30.20.10.0
0 5 10 15 20 25 30
118 115 113 110 113 115 1181.00.90.80.70.60.50.40.30.20.10.0
-5 -4 -3 -2 -1 0 1
1.00.90.80.70.60.50.40.30.20.10.0
Moderate deleveraging is likely to be conducive to economicgrowth, helps to anchor low external vulnerability...
Financial openness (assets plus liabilities, % of GDP)1/ All determinants are set at 2008 level.
Private sector credit growth, % 1/ All determinants are set at 2008 level, except for financial
openness (110% of GDP) and exports (90% of GDP). Externally funded credit growth is assumed.
Overall fiscal budget, % of GDP 1/ All determinants are set at 2008 level, except for financial
openness (110% of GDP), exports (90% of GDP).
Financial openness, % of GDP
Export, % of GDP1/ All determinants are set at 2008 level, except for financial
openness (110% of GDP).
...and global recovery is likely to stimulate exports, bringing them to about the pre-crisis level, and support economic growth...
...which is likely to get another boost from improvements in domestic credit conditions.
Room for fiscal policy maneuver is likely to be significant.
G-High,V-Low G-High,
V-Low
G-High,V-High G-Low,
V-High
G-Low,V-Medium
G-Low,V-Medium
G-Low,V-Low
G-High,V-Low
G-High, V-HighG-Low, V-High
G-High, V-HighG-Low, V-HighG-Low, V-Med.
G-High, V-HighG-Low, V-HighG-Low, V-Med.
G-Low,V-Low
G-Low,V-Low
2008 1/
2008 1/
G-High,V-Medium
G-High,V-Medium
G-Low,V-Low
G-High,V-Low
G-High,V-Medium
G-High,V-Medium
2008 1/2008 1/
Source: IMF staff calculations.
running fiscal surpluses increases the estimated probability of low growth cluster;
but the impact is likely to be rather small as suggested by the persistently high pro-
bability of high growth cluster for a wide range of fiscal positions. At the same time,
fiscal loosening would be only moderately supportive of economic growth and is
unlikely rapidly to aggravate external vulnerabilities: running high fiscal deficits
increases the estimated probability of high growth, without clear evidence of a ne-
gative feedback loop to external vulnerability.
The estimated model suggests that to the extent that Croatia’s initial external vulne-
rabilities and bias toward the non-tradable sector are more pronounced, fostering the de-
velopment of a more sustainable growth model in Croatia would require a more concer-
ted policy effort.
• Moderate external deleveraging is likely to have a significant return in terms of re-ducing external vulnerabilities and establishing an economic environment condu-cive to growth (figure 9, left upper chart). The estimated probability of low vulne-

351
R. Atoyan: Beyond the crisis: revisiting emerging Europe’s growth modelFinancial Theory and Practice 34 (4) 329-356 (2010)
rability clusters increases quickly, even for a rather moderate reduction of financi-
al openness. In the nonlinear world of the estimated multinomial logit model, this
level of financial openness is likely to be conducive to economic growth since the
marginal impact of other determinants is likely to be more pronounced.
• Fiscal consolidation would need to be a cornerstone of the external adjustment (fi-gure 9, right upper chart). At the minimum, maintaining the pre-crisis stance of fis-
cal policy (general government fiscal deficit of about 1 percent of GDP) is likely
to be supportive of restraining external vulnerabilities. In addition to the aggregate
demand management effect, fiscal consolidation is also likely to improve the busi-
ness environment and facilitate the resumption of capital inflows. In contrast, fis-
cal slippages are likely to be costly, as larger fiscal deficits are estimated to incre-
ase the probability of low-growth/medium-vulnerability cluster.
• The policy challenge would be to channel renewed capital inflows into the tradable sector investment (figure 9, left and right lower charts). If successful, the strategy
Figure 9: Croatia: predicted probability of growth-vulnerability clusters
Source: IMF staff calculations.
1.00.90.80.70.60.50.40.30.20.10.0
1.00.90.80.70.60.50.40.30.20.10.0
140 143 148 153 158 164 1701.00.90.80.70.60.50.40.30.20.10.0
1.00.90.80.70.60.50.40.30.20.10.0
Moderate deleveraging is likely to be conducive to economicgrowth, contains vulnerability...
Financial openness (assets plus liabilities, % of GDP)1/ All determinants are set at 2008 level.
Exports, % of GDP 1/ All determinants are set at 2008 level, except for financial
openness (140% of GDP).
Private sector credit growth, % 1/ All determinants are set at 2008 level, except for financial
openness (140% of GDP) and exports (55% of GDP). Externally funded credit growth is assumed.
Financial openness, % of GDP
Overall fiscal balance, % of GDP1/ All determinants are set at 2008 level, except for financial
openness (140% of GDP).
...and fiscal consolidation is likely to be effective in restraining external vulnerability; fiscal slippages are likely to be costly.
Boosting exports is likely to generate large growth dividens, reduce imbalances...
...which can be done by channeling resumed inflows intotradable sector credit.
100 120 140 159 180 200 220 -7 -5 -3 -1 1 3 5
35 42 45 50 55 60 65 12 15 20 25 30 35 40
G-High,V-Low
G-High,V-Low
G-High,V-Low
G-High,V-Low
G-High,V-High
G-Low,V-High
G-Low,V-Medium
G-Low,V-Medium
G-Low,V-Medium
G-Low,V-Medium
G-High, V-High
G-High, V-High
G-Low, V-High
G-Low,V-Low
G-Low,V-Low
G-Low,V-Low
G-Low,V-Low
2008 1/
2008 1/
G-High,V-Medium G-High,
V-Medium
G-High, V-HighG-Low, V-High
G-High,V-Medium
G-High,V-Medium
2008 1/2008 1/
G-Low, V-High

352
R. Atoyan: Beyond the crisis: revisiting emerging Europe’s growth modelFinancial Theory and Practice 34 (4) 329-356 (2010)
of funneling resources to boosting export growth is likely to generate large growth
dividends and buttress normalization of the external imbalances: the probability of
high-growth/low-vulnerability and high-growth/medium-vulnerability clusters in-
creases significantly for higher export-to-GDP ratios and for higher rates of priva-
te sector credit growth, even if the latter is also associated with some expansion of
the external balance sheet.
5 Policy implications
Before deriving policy implications, there is a need to recognize that growth models followed by countries in Central and Eastern Europe were not fully a matter of choice. Although vulnerabilities cannot be delinked from the pre-crisis policy choices, the re-
cent growth-followed-by-crisis model in Central and Eastern Europe was to some extent
“accidental” rather than chosen and planned. As the analysis shows, to a large extent,
growth before the crisis was driven by easily available foreign currency funding by fore-
ign owned banks, in economies with open capital accounts and often rigid exchange rate
regimes. The first was the result of bank privatization in the 1990s; the second was requ-
ired by the European Union; and the third was, in many cases, driven by the heritage of
historically high and deeply entrenched euroization (in terms of keeping savings first in
German marks and then in euro). None of them were the ingredients of a chosen growth
model by policymakers. At the same time, low global interest rates and search for yields
provided a strong (exogenous) push for capital towards emerging markets. While some
national authorities have actively introduced monetary and prudential measures to slow
accumulation of external and domestic vulnerabilities, banks often stayed ahead of the re-
gulation arbitrage, quickly finding ways to circumvent regulations. 28,29 Similar constraints
could be expected to affect the growth model, chosen or not, looking forward.
The structure of the economic growth matters for its sustainability. Perhaps the most
important lesson of this analysis is related to the fact that a fine balance between dome-
stic demand-driven and export-driven models is the key to the sustainability of economic
growth. Since over the last decade growth in most Central and Eastern European coun-
tries with heightened external vulnerabilities has been driven by large absorption booms,
a significant rebalancing towards greater reliance on tradable sectors is needed for foste-
ring sustainability in economic growth.
Rebalancing the growth structure towards greater reliance on exports would require boosting external competitiveness, a challenging task for countries with strong preferen-
28 These included increased risk weights for capital adequacy calculations, indicative credit growth thresholds, currency- and maturity-specific liquidity asset ratios, minimum foreign exchange liquidity requirements, leverage ratio limits, varying reserve requirements, and tighter regulations on loan classification. See Hilber et al. (2005) for a detailed account of the macro-prudential measures introduced in CEE countries during the pre-crisis period and their impact on credit growth and vulnerability buildup.
29 As discussed in Mitra et al. (2009), countercyclical prudential and monetary policies to pour “sand in the wheels” in CEE countries were only partially successful. The typical credit growth or capital control regulation is said to have “shelf life” of only one to two years.

353
R. Atoyan: Beyond the crisis: revisiting emerging Europe’s growth modelFinancial Theory and Practice 34 (4) 329-356 (2010)
ces for fixed exchange rate regimes.30 Enhancing the profitability of tradable sectors may
prove to be challenging in an environment where large foreign-currency balance sheet
vulnerabilities make exchange rate readjustments difficult. While traditional policy reco-
mmendations of improving business environment through reducing corruption and red
tapes still hold, they are unlikely to be sufficient to alter significantly the growth strategy
of the past decade. Boosting external competitiveness is also likely to require a prolon-
ged period of internal devaluation, involving policies aimed at reducing input costs for
tradables.31 These may entail competitiveness-enhancing income policies relying on ne-
gotiations of wage restraints in the formal parts of the economy in return for the expecta-
tion of enhanced job creation.32
Advancing exports may also require unconventional policy formulation. Improving
the profitability and attractiveness of the tradable sectors may require measures addre-
ssing coordination failures and poor institutional infrastructure, which could require some
rethinking of the permissiveness of certain polices.33 As suggested by the EBRD, directly
subsidizing the tradable sector is likely to be risky. The policies should instead target the
building of sector-specific capabilities (e.g., loosening financing or infrastructural con-
straints) and improving the sector-specific operational environment (e.g., government in-
vestments in development of specialized industrial or professional skills and investments
in trade infrastructure).34,35
Fostering sustainable growth model would require a delicate balance between relying on foreign capital and promoting domestic savings. While renewed capital inflows would
provide lower cost financing, they may also subject economic growth to global financial
shocks, contribute to a buildup of external vulnerabilities, and complicate macroeconomic
management. Greater domestic savings would not only contribute to the mitigation of
external vulnerabilities (by slowing down domestic consumption) but also make the do-
mestic financial system more resilient to swings in investor sentiment.
Prudential and macroeconomic policies will have to be more proactive in responding to renewed capital inflows. While the rebound in capital flows to emerging markets is a
welcome development, large inflows can pose challenges for economic management and/
or financial stability. The right policy mix will depend on each country’s circumstances,
including the nature of the capital inflows, as well as domestic policy considerations. Po-
licymakers have a number of tools at their disposal: they can allow the currency to appre-
ciate; accumulate more reserves; adjust fiscal and monetary policies; and strengthen pru-
dential rules to prevent excessive risk in the financial system. In some circumstances, ca-
30 Development of the appropriate policy mix for individual countries lies outside of the scope of this paper. It will depend critically on the specific circumstances of each country, including potential constraints that may arise from the memberships in the EU and the WTO.
31 The use of targeted reductions of tariffs on intermediate inputs – an option for reducing input costs for trada-bles – in some countries may be limited by a need to harmonize the tariff structure with the European Union.
32 In countries where the social partnership with labor unions in the private sector is difficult to institute, wage cuts in the public sector would have to lead the way, envisaging demonstration effects for the private sector.
33 See Rodrik (2009) for a discussion of a need for unconventional policy formulation. 34 EBRD (2008) argues that increased government interventions are unavoidable in the aftermath of the crisis,
but, in doing so, the focus should be on preserving market incentives and transparency. 35 See Klemm (2009) for a discussion of benefits and risks of using tax incentives.

354
R. Atoyan: Beyond the crisis: revisiting emerging Europe’s growth modelFinancial Theory and Practice 34 (4) 329-356 (2010)
pital controls may be a legitimate component of the policy response to surges in capital
inflows.36,37 In addition to the traditional aggregate demand management role, the focus of
the policymakers needs to be on finding a way to channel these inflows into investment in
the export-oriented industries. But as the effectiveness of domestic policies in the context
of a small open economy is likely to be limited, a coordinated effort demanding enhanced
international coordination of macroeconomic and prudential policies is warranted.
APPENDIX 1: Multivariate hierarchical cluster analysis
In the context of this paper, cluster analysis is used to classify a set of countries
into two or more mutually exclusive unknown groups based on combinations of interval
variables (e.g., external vulnerabilities or economic growth). The goal of cluster analysis
is to organize countries into groups while maximizing the degree of similarity within the
group and minimizing similarity across groups.38
Hierarchical clustering creates a hierarchy of clusters which may be represented in a
tree structure (dendrogram). The root of the tree consists of a single cluster containing all
observations, and the leaves correspond to individual observations. The dendrogram plots
the sequential linkage between countries according to the distance measure between those
observations at the point of linkage. In this setting, the distance along the vertical axis
determines the similarity/dissimilarity of different clusters. Inspection of the dendrogram
can be used to determine whether the sample is clustered, and if so how many clusters
there are and which countries are in each cluster.
The Ward Method, used in this paper, is generally regarded as very efficient even
though it tends to create clusters of small size. 39 It attempts to minimize the sum of squares
of any two hypothetical clusters that can be formed at each step. The dissimilarity measure,
best known as squared Euclidean distance, is computed as:
,
where xki denotes the value of observation i for variable k=1…p.
36 See Ostry et al. (2010).37 At the present, the use of capital controls as a policy option may be severely restrained by the existing EU
legislation. However, the lessons of the recent crisis seem to suggest that a coordinated initiative aimed at re-thinking of circumstances under which some forms of capital controls may be appropriate is needed.
38 See Everitt and Dunn (1991) for a detailed discussion on the use of hierarchical clustering in applied multivariate data analysis.
39 Alternative linkage methods (e.g., complete, centroid, and group-average) were also tested and generally produced similar groupings of the countries.

355
R. Atoyan: Beyond the crisis: revisiting emerging Europe’s growth modelFinancial Theory and Practice 34 (4) 329-356 (2010)
LITERATURE
Abiad, A., Leigh, D. and Mody, A., 2009. “Financial Integration, Capital Mobility,
and Income Convergence”. Economic Policy, 24 (58), 241-305.
Abramson, C. [et al.], 2000. “Parameter Bias from Unobserved Effects in the
Multinomial Logit Model of Consumer Choice”. Journal of Marketing Research, 37,
410-426.
Bakker, B. B. and Gulde, A. M., 2010. “The Credit Boom-Bust in Emerging Europe:
Bad Luck or Bad Policies?” IMF Working Paper, No. 10/130. Washington: International
Monetary Fund.
Barro, R. and Sala-í-Martin, X., 2004. Economic Growth. New York: McGraw
Hill.
Bems, R. and Schellekens, P., 2007. “Finance and Convergence: What’s Ahead for
Emerging Europe?” IMF Working Paper, No. 07/244. Washington: International Monetary
Fund.
EBRD, 2009. Transition Report 2008: Growth in Transition. London: European Bank
for Reconstruction and Development.
Everitt, B. and Dunn, G., 1991. Applied multivariate data analysis. London: Edward
Arnold.
Fabrizio, S., Leigh, D. and Mody, A., 2009. “The Second Transition.” European Economy, No. 366 (March).
Hilbers, P. [et al.], 2005. “Assessing and Managing Rapid Credit Growth and the Role
of Supervisory and Prudential Policies.” IMF Working Paper, No. 05/151. Washington:
International Monetary Fund.
IMF, 2009. IMF Country Report, No. 09/185. Washington: International Monetary
Fund.
IMF, 2010. IMF Country Report on “Republic of Serbia—Staff Report for the 2010 Article IV Consultation (forthcoming). Washington: International Monetary Fund.
Jones, B. and Olken, B., 2005. “The Anatomy of Start-Stop Growth.” NBER Working Paper, No. 11528.
Klemm, A., 2009. “Causes, Benefits, and Risks of Business Tax Incentives”. IMF Working Paper, WP/09/21. Washington: International Monetary Fund.
Mitra, P., Selowsky, M. and Zalduendo, J., 2009. Turmoil at Twenty: Recession, Recovery and Reform in Central and Eastern Europe and the former Soviet Union.
Washington: World Bank.
Ostry, J. [et al.], 2010. “Capital Inflows: The Role of Controls.” IMF Staff Positi-on Note, SPN/10/04.
Rahman, J., 2010. “Absorption Boom and Fiscal Stance: What Lies Ahead in Eastern
Europe?”. IMF Working Paper, No. 10/97. Washington: International Monetary Fund.

356
R. Atoyan: Beyond the crisis: revisiting emerging Europe’s growth modelFinancial Theory and Practice 34 (4) 329-356 (2010)
Ranciere, R., Tornell, A. and Vamvakidis, A., 2010. “Currency Mismatch and Sy-
stemic Risk in Emerging Europe.” Economic Policy, forthcoming.
Rodrik, D., 2009. “Growth After the Crisis,” paper prepared for the Commission on
Growth and Development, draft.
Schadler, S. [et al.], 2007. “Growth in the Central and Eastern European Countries
of the European Union.” IMF Occasional Paper, No. 252. Washington: International
Monetary Fund.
Vamvakidis, A., 2009. “Convergence in Emerging Europe: Sustainability and
Vulnerabilities”. Eastern European Economics, 47 (3), 5-27.