beyond entry: examining mcdonald's expansion in...
TRANSCRIPT
Beyond Entry: Examining McDonald's Expansion in International Markets
by
Francine Lafontaine
University of Michigan Business School
and
David Leibsohn
University of Michigan Business School
Abstract
This paper examines the factors that affect not only entry but also subsequent growth of retail chains within international markets. Specifically, we focus on McDonald’s expansion around the globe. Arguably, McDonald’s has introduced the American concept of fast food and franchising to many foreign markets. In that sense, it is of particular interest to examine the international expansion path that this firm has chosen to pursue. The pattern of entry into foreign markets and growth that we observe dispells the notion that McDonald’s expanded abroad because it had saturated its home market. Instead, consistent with traditional profit maximization arguments for a multi-market monopoly, we find evidence that McDonald’s allocated resources to achieve balanced growth across many desirable markets, but particularly favoring those with higher GDP per capita.
April 2004
USC FBE/MOR/CLEO APPLIED ECONOMICS WORKSHOP
FRIDAY, April 2, 20041:30 pm - 3:00 pm, Room: ACC-201
presented by Francine Lafontaine
Preliminary and incomplete, please do not quote
1. INTRODUCTION An extensive body of literature on firm expansion beyond domestic borders has focused
on entry, specifically the issues of timing and mode of entry, where the latter typically takes the
form of exporting, licensing, joint venture or FDI (see e.g. Hymer 1976; Davidson 1983;
Anderson & Gatignon 1986; Teece 1986; Dunning 1988; Gatignon & Anderson 1988; Kogut &
Singh 1988; Barkema, Bell & Pennings 1996; Buckley & Casson 1998; Shaver 1998; Mitra &
Golder 2002). While this literature has provided useful insights regarding where and how firms
enter foreign markets, it treats entry as its own end rather than the beginning of a firm’s foreign
market involvement. This focus on entry may stem in part from the frequent use of
manufacturers as the empirical context for analyzing expansion; a manufacturer can enter a
foreign market at the outset with a plant large enough to service the needs of the market for some
time to come. In this context, entry rightly may be seen as the end as well as the beginning of a
firm’s foreign market investment. But as the U.S. moves increasingly from largely a
manufacturing-based economy towards a more service-based economy, understanding how
service firms expand abroad becomes increasingly important. And the reality is that service
firms typically enter foreign markets with one or a few locations and then expand their
geographic coverage of the foreign market over time in their quest for customers. When and
how these firms develop additional locations in foreign markets becomes potentially more
important than choosing the timing and mode of entry for the initial location(s).
In this paper we employ the empirical context of fast-food franchising to gain a richer
understanding of international expansion by service firms within as well as across foreign
markets. We focus on the expansion of the firm—McDonald’s—credited with introducing the
concept of franchising itself to many markets where it operates. We use data on the number of
1
Preliminary and incomplete, please do not quote
outlets that McDonald’s operated in each country in each year over the past three decades to
assess the importance of various factors in determining the pattern of foreign market expansion
as well as entry. We examine how both firm characteristics and country characteristics
previously identified as important to foreign market entry timing and mode relate to observed
levels and increases in outlet counts by McDonald’s in each country. For instance, we can test
whether economic instability and cultural distance, both factors that have been found to reduce
the likelihood of foreign market entry (see e.g. Kobrin 1976; Davidson 1980; Kogut & Singh
1988; Gomes-Cassares 1989; Henisz 2000), also hinder expansion within previously entered
foreign markets. Likewise, we can assess the relative influence of a firm’s within-market years
of experience against its experience in related markets on its expansion process. Finally, we can
explore how governance mode (subsidiary, joint venture, master franchising) adopted by the firm
to oversee operations within each country influences the rate of subsequent store development
within that market in addition to examining the governance choice itself.
The paper is organized as follows. In the next section we briefly summarize literature on
market entry and identify hypotheses to be tested with our data. Section 3 describes the data and
the international expansion of McDonald’s over time. Section 4 presents our empirical
specification and results. Section 5 concludes.
2. A BRIEF OVERVIEW OF LITERATURE AND CONCEPTUAL FRAMEWORK While manufacturing firms can minimize the risk they expose themselves to in foreign
markets by simply exporting and increasing their involvement only in those markets where they
find success, a firm such as McDonald’s must go abroad where its customers are if it is to sell its
product abroad. The question then arises as to whether such a firm will exhaust all opportunities
within an individual market before moving to another, as might occur if the cost or the risk of
2
Preliminary and incomplete, please do not quote
going abroad is considered very high, or whether the firm will allocate its limited resources
across markets so as to continuously exploit the highest expected return across boundaries, as a
typical multi-market monopolist would. In the latter case, we will observe entry into new
markets simultaneously with continued expansion in existing ones.
The literature on firm entry into markets in economics has focused explicitly on the
importance of sunk costs in determining the number of firms that can operate and thus compete
at a point in time in a market (Bresnahan and Reiss, 1987). This literature also has considered
the effect of firm heterogeneity on the likelihood of entry (Berry (1992), Scott Morton (1999)).
Specifically, the typical model assumes that heterogeneous firms decide simultaneously whether
to enter and incur the sunk costs. Firms then compete in a single market, and the resulting
combination of production levels and prices determine their net profits in this new market.
Our setting differs from that of prior entry studies in that rather than examining multiple
firms deciding whether or not to enter one market, we consider a single firm deciding whether to
enter several different markets. We follow this literature however in assuming that McDonald’s
faces sunk entry costs in each market. This cost might include the cost of devoting resources to
learn about the rules that govern each new market, learn about the customers and advertise the
brand and make itself and its product known in this new market. Because of the limited
managerial resources available at a point in time, we assume that these costs, which for
simplicity we assume to be the same across markets, are convex in the number of countries
entered into in a given time period. This convex cost function imposes a limit on the number of
markets that the firm will want to enter into all at once.
Moreover, as is typical in the literature on location choices, we assume that McDonald’s
also faces sunk costs of entry each time it opens a new outlet in any given market, and that this
cost also is convex in the number of outlets opened in a given market in a given time period.
3
Preliminary and incomplete, please do not quote
This assumption represents the strain on local resources when many outlets are opened at once
and limits the chain’s growth in any market in a given period.
Suppose that the demand for McDonald’s product in any given market i at time t is given
by
Qit = f(Xit, pit) + uit (1)
where the Xit are a series of market characteristics such as population and income, the uit are
random noise that makes it impossible to precisely predict demand, and p is the price charged for
the product in market i at time t. Given price, and holding the size of each McDonald’s constant,
this demand implicitly defines the optimal number of outlets that McDonald’s wants to have by
time t in this market given its characteristics. We use Nit* to represent this optimal number of
stores.
The expected profit from entering a specific new market if all Nit* outlets could be
opened at once then would be
Πit = Nit* (πi – F) – C(J)/J
where πi is the present value of an outlet’s variable profit over time, F is the sunk cost of
establishing each outlet, and C(J)/J is the average cost of entering a market when J markets are
expanded into in a given year. Of course, if all outlets are not opened at once, the expected
profits will be lower as some outlets will only generate profits further in the future. Moreover, at
any given time, returns need not be positive. In those cases, the firm will need to delay entry
until market conditions improve sufficiently so that the profit potential outweighs entry costs.
Thus entry into very low demand markets may be delayed significantly.
Assuming similar development times across markets, for any value of J, firm profits will
be higher the larger the expected number of stores to be opened in a market. This simple
framework provides our first testable implication. In any given period, McDonald’s will first 4
Preliminary and incomplete, please do not quote
enter those remaining markets with the highest expected demand, namely markets where income
and population for example are high (assuming, of course, that fast-food is a normal good), and
where customers are more likely to value its product. Of course, if we allow the sunk market
entry costs to vary across markets, due for example to greater familiarity with some markets than
others, then entry will occur first in high demand low sunk cost markets.
While the setting above provides a hypothesis about entry that is very consistent with
existing empirical patterns in the literature, it does not help us understand the process of
expansion after entry, which is a main focus of this paper.
An alternative way to think about this process is as a series of entry decisions within
specific submarkets. This again would lead to a conclusion that McDonald’s would open those
outlets in the most profitable submarkets first. The convex cost function for unit location choices
would constrain the number of outlets to open in each market in any given period. In many of
the markets where McDonald’s now operates, it brought not just one but two new concepts: its
product – the hamburger, or fast-food itself – and franchising. As a pioneer, it faced significant
uncertainty, not knowing how the population would react to its product offering so that demand
cannot be predicted with as much precision (the variance of the u in (1) is larger) when the firm
has no experience in the market (see e.g. Caplin and Leahy’s (1998) model of search with
information externalities). Thus there is option value in not developing a large number of outlets
all at once but instead taking some time to learn about customers, tailoring products, and
advertising to increase demand in each market. Both the convex cost and the need to retain
option value lead to the notion that McDonald’s will open the number of outlets it expects the
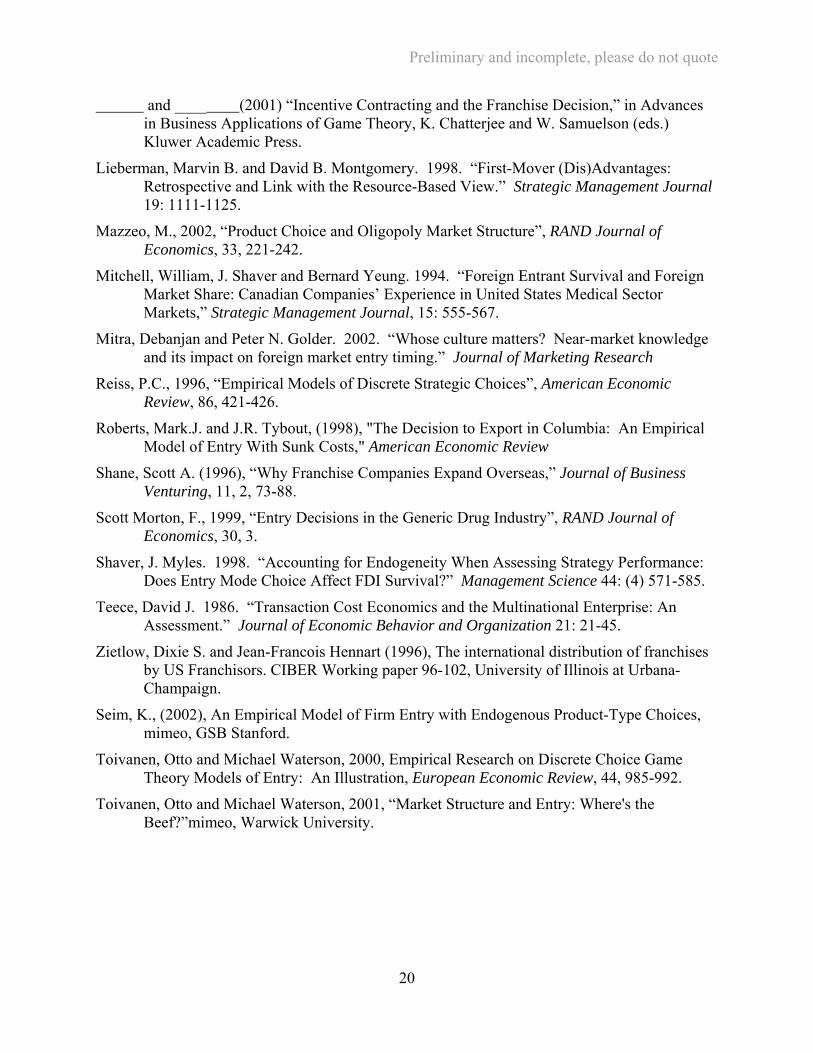
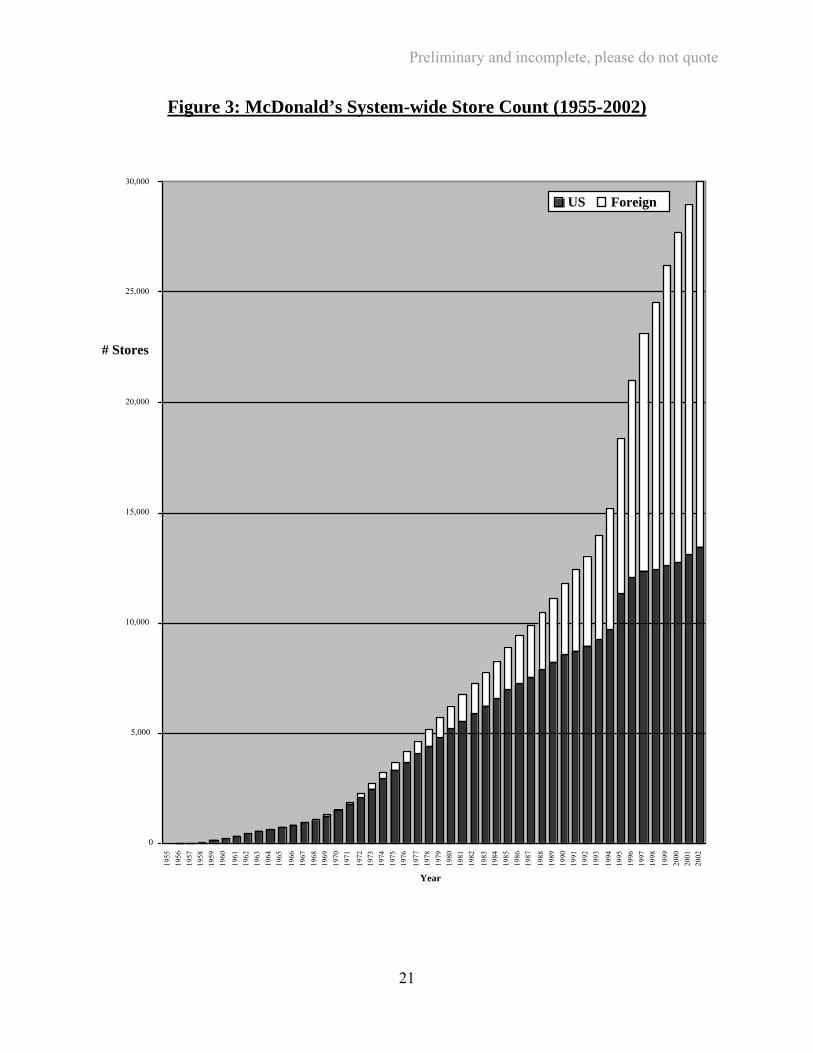
market to bear only gradually. Figures 1 and 2, which illustrate the evolution of the number of
McDonald’s restaurants and the number of restaurants per million people in 25 major markets,
confirm this tendency. They also show that McDonald’s expands beyond its current set of
5
Preliminary and incomplete, please do not quote
countries while it is still rapidly increasing its presence in existing ones. How fast it will choose
to add outlets across different markets however is an open question. What we can infer from this
framework, however, is that holding constant the sunk cost of entry at the outlet level, the
number of outlets will grow more rapidly the larger the expected demand in the market.
However, since McDonald’s can obtain additional information about the markets when it
operates within them, and find ways to better tailor its offerings to each such market, but the
econometrician does not capture such information, our capacity to predict based on observable
country characteristics where faster outlet growth is likely to occur may deteriorate as time in
market increases.
Finally, note that our description has focused on entry, and thus relates new outlets and
growth in outlets not to market growth, but rather to the characteristics of the markets in levels.
In other words, we have a diffusion process where the number of outlets at any point in time
remains so far from the equilibrium level that what we observe are the effect of the market
characteristics on the growth of outlets rather than the effect of market growth on the same. This
is standard in entry analyses, and in turn shapes our empirical model below.
3. THE DATA The panel data set we use has been constructed from McDonald’s Corporation annual
reports which together contain information on the number of stores that the company operates in
each country in each year since the company’s foundation in 1955. In addition, we gathered
information on the characteristics of each of the markets/countries’ that it operates in by 1999.
These data are yearly since 1967 when McDonald’s opened its first outlet outside of the United
States (in Canada). Our goal is to capture those market characteristics that influence expected
demand for McDonald’s in each market as well as the level of sunk costs potentially. Thus we
6
Preliminary and incomplete, please do not quote
obtained data on GDP per capita, population, the proportion of the population living in urban
centers, the surface area of the country, the distance of each capital from Chicago, where
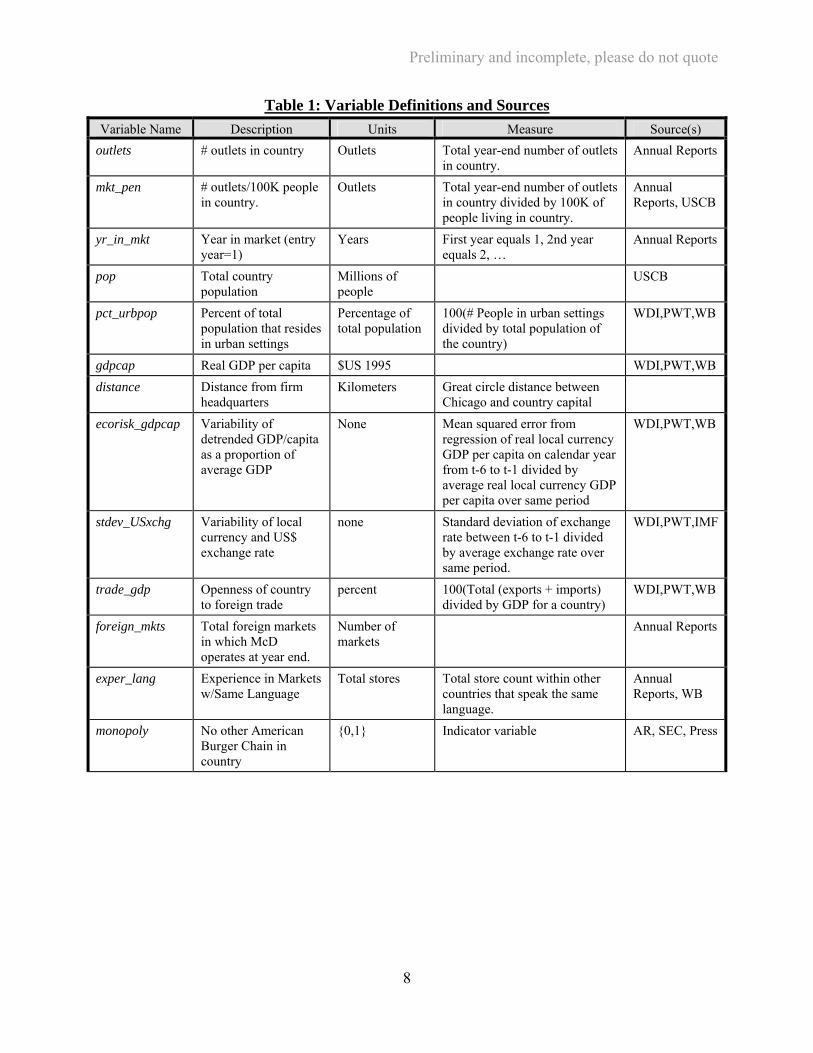
McDonald’s headquarters is located, and so on. Table 1 shows the details of all these variables,
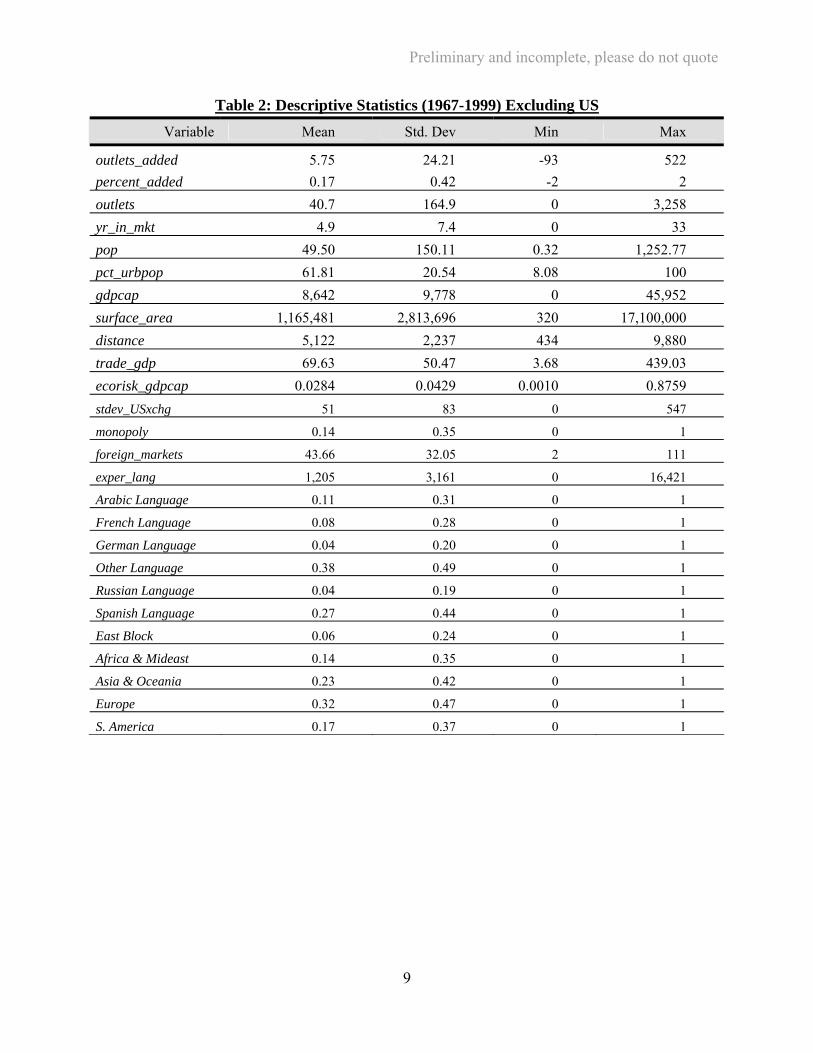
their exact definitions and the sources we used. Table 2 gives descriptive statistics for all these
variables across all the foreign markets over the period from 1967 to 1999 irrespective of
whether McDonald’s had in fact any outlets within a given market at the time. 1
1 Tables A1 and A2 in Appendix A shows the list of markets included in our sample, and those that we had to exclude for lack of data. We made every effort to find all the needed data for all “significant” markets. Though we are missing some data for some of the relevant markets, Table A2 shows that the countries or jurisdictions excluded from our sample are typically small, and many of them are islands.
7
Preliminary and incomplete, please do not quote
Table 1: Variable Definitions and Sources Variable Name Description Units Measure Source(s)
outlets # outlets in country Outlets Total year-end number of outlets in country.
Annual Reports
mkt_pen # outlets/100K people in country.
Outlets Total year-end number of outlets in country divided by 100K of people living in country.
Annual Reports, USCB
yr_in_mkt Year in market (entry year=1)
Years First year equals 1, 2nd year equals 2, …
Annual Reports
pop Total country population
Millions of people
USCB
pct_urbpop Percent of total population that resides in urban settings
Percentage of total population
100(# People in urban settings divided by total population of the country)
WDI,PWT,WB
gdpcap Real GDP per capita $US 1995 WDI,PWT,WB distance Distance from firm
headquarters Kilometers Great circle distance between
Chicago and country capital
ecorisk_gdpcap Variability of detrended GDP/capita as a proportion of average GDP
None Mean squared error from regression of real local currency GDP per capita on calendar year from t-6 to t-1 divided by average real local currency GDP per capita over same period
WDI,PWT,WB
stdev_USxchg Variability of local currency and US$ exchange rate
none Standard deviation of exchange rate between t-6 to t-1 divided by average exchange rate over same period.
WDI,PWT,IMF
trade_gdp Openness of country to foreign trade
percent 100(Total (exports + imports) divided by GDP for a country)
WDI,PWT,WB
foreign_mkts Total foreign markets in which McD operates at year end.
Number of markets
Annual Reports
exper_lang Experience in Markets w/Same Language
Total stores Total store count within other countries that speak the same language.
Annual Reports, WB
monopoly No other American Burger Chain in country
{0,1} Indicator variable AR, SEC, Press
8
Preliminary and incomplete, please do not quote
Table 2: Descriptive Statistics (1967-1999) Excluding USVariable Mean Std. Dev Min Max
outlets_added 5.75 24.21 -93 522 percent_added 0.17 0.42 -2 2 outlets 40.7 164.9 0 3,258 yr_in_mkt 4.9 7.4 0 33 pop 49.50 150.11 0.32 1,252.77 pct_urbpop 61.81 20.54 8.08 100 gdpcap 8,642 9,778 0 45,952 surface_area 1,165,481 2,813,696 320 17,100,000 distance 5,122 2,237 434 9,880 trade_gdp 69.63 50.47 3.68 439.03 ecorisk_gdpcap 0.0284 0.0429 0.0010 0.8759 stdev_USxchg 51 83 0 547
monopoly 0.14 0.35 0 1
foreign_markets 43.66 32.05 2 111
exper_lang 1,205 3,161 0 16,421
Arabic Language 0.11 0.31 0 1
French Language 0.08 0.28 0 1
German Language 0.04 0.20 0 1
Other Language 0.38 0.49 0 1
Russian Language 0.04 0.19 0 1
Spanish Language 0.27 0.44 0 1
East Block 0.06 0.24 0 1
Africa & Mideast 0.14 0.35 0 1
Asia & Oceania 0.23 0.42 0 1
Europe 0.32 0.47 0 1
S. America 0.17 0.37 0 1
9
Preliminary and incomplete, please do not quote
4. THE EMPIRICAL MODEL AND RESULTS The theory above suggests that a firm like McDonald’s estimates its optimal number of
outlets in each market based on market characteristics.2 In other words:
Njt* = f(Xjt ) + εjt (1)
where Njt* is the equilibrium number of outlets in jurisdiction j at time t given market
characteristics Xjt, which include market population and per capita income, which we expect will
have a positive effect on the equilibrium number of outlets, and country risk which we expect
will have a negative effect on the same. Moreover, certain markets may involve lower entry
costs due to lower distance, physical or cultural.
The phenomenon we are focusing on, that is a firm’s expansion across markets, however,
is a dynamic one. In fact, since the firm is expanding from no presence at all in the market,
under the assumptions of convex sunk costs and option value discussed above, our yearly
observations on number of outlets will not represent long term equilibrium configurations of
outlets across markets for many years beyond entry. Instead, the firm is typically playing catch
up, growing not in response to growth in the market, but in response to its desirability. Still, the
number of outlets established in a market may affect the desirability of opening new ones. For
those reasons, we estimate
Yjt = BXjt + ΓZjt + εjt (2)
where Yjt is the number of new outlets in market j at time t, Xjt are the market characteristics at
time t, and Zjt capture the characteristics of McDonald’s in relation to market j at time t, in
2 Indeed, in their study of international expansion, Gonzalez-Diaz and Lopez (2002) use franchisors’ stated desired market size per outlet to determine the point of market saturation.
10
Preliminary and incomplete, please do not quote
particular the number of outlets established by time t-1, and the number of years since it entered
this market.3
We begin by exploring the market entry decision using a duration model. Our focal event
is entry by McDonald’s into a foreign market. In the analysis, a country j is considered to be at
risk of entry if that country is an independent jurisdiction and in year t McDonald’s has not as yet
entered. We specify the probability of entry as
Probability of Entry = exp(α0 +Xjtβ + ZjtГ)
The α0 reflects the baseline hazard of entry and the time-varying covariates X and Z then alter the
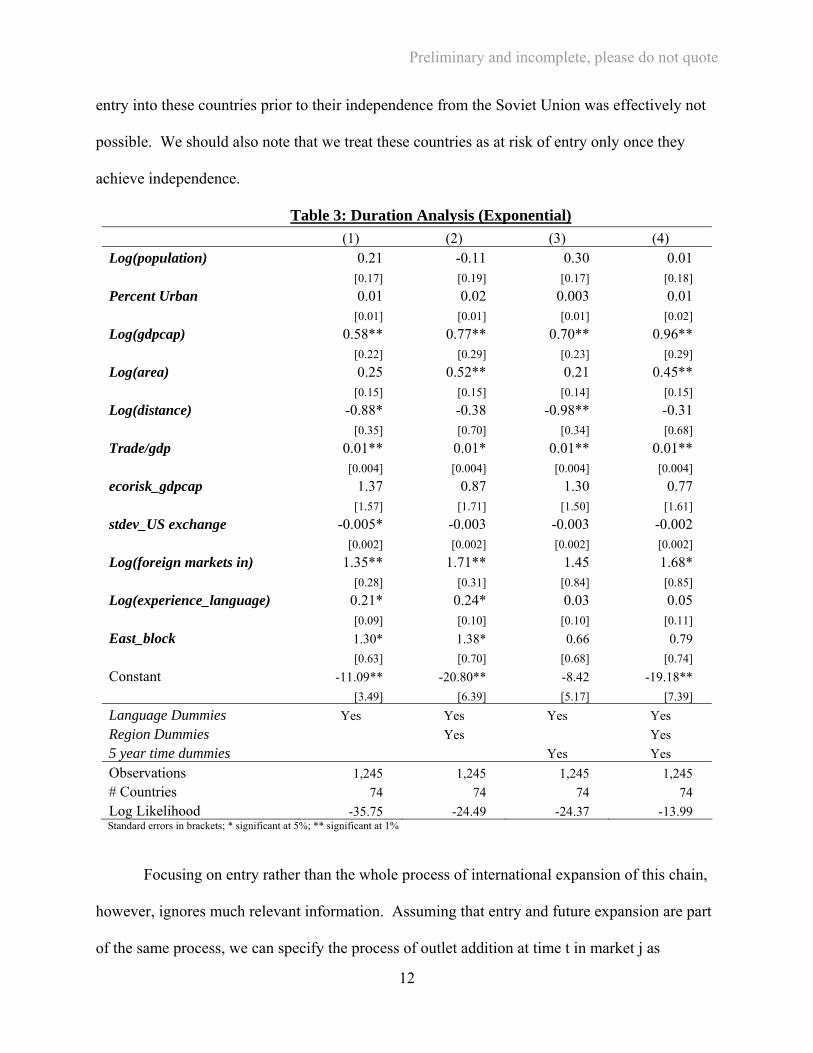
relative likelihood of entry. Results from estimating this model are summarized in Table 3. They
show that indeed high GDP per capita is an important factor attracting McDonald’s to particular
foreign markets. Population and size of country also mostly play a positive role, but their effect
is not consistently estimated to be different from zero. Openness to trade, as captured by
trade/GDP, is another positive factor in choosing markets, while distance and risk, as captured by
exchange rate risk, decrease the probability of entry at any time t. Note that the effect of distance
is reduced importantly, and becomes insignificant statistically, once we also control for the
region of the world where a market is. Contrary to our expectations, our other risk measure,
which was meant to convey the degree of year-to-year variation in GDP per capita around a
trend, turns out to have a positive, though insignificant, effect on the probability of entry. As for
firm characteristics, we find that McDonald’s is more likely to enter new markets at time t if it
has already done this often (large foreign markets), if it has more experience in countries within
the same language group, and in eastern block countries. The latter is not surprising given that
3 For simplicity we ignore functional form issues in equation (2) but address them in our empirical analyses below.
11
Preliminary and incomplete, please do not quote
entry into these countries prior to their independence from the Soviet Union was effectively not
possible. We should also note that we treat these countries as at risk of entry only once they
achieve independence.
Table 3: Duration Analysis (Exponential) (1) (2) (3) (4) Log(population) 0.21 -0.11 0.30 0.01 [0.17] [0.19] [0.17] [0.18] Percent Urban 0.01 0.02 0.003 0.01 [0.01] [0.01] [0.01] [0.02] Log(gdpcap) 0.58** 0.77** 0.70** 0.96** [0.22] [0.29] [0.23] [0.29] Log(area) 0.25 0.52** 0.21 0.45** [0.15] [0.15] [0.14] [0.15] Log(distance) -0.88* -0.38 -0.98** -0.31 [0.35] [0.70] [0.34] [0.68] Trade/gdp 0.01** 0.01* 0.01** 0.01** [0.004] [0.004] [0.004] [0.004] ecorisk_gdpcap 1.37 0.87 1.30 0.77 [1.57] [1.71] [1.50] [1.61] stdev_US exchange -0.005* -0.003 -0.003 -0.002 [0.002] [0.002] [0.002] [0.002] Log(foreign markets in) 1.35** 1.71** 1.45 1.68* [0.28] [0.31] [0.84] [0.85] Log(experience_language) 0.21* 0.24* 0.03 0.05 [0.09] [0.10] [0.10] [0.11] East_block 1.30* 1.38* 0.66 0.79 [0.63] [0.70] [0.68] [0.74] Constant -11.09** -20.80** -8.42 -19.18** [3.49] [6.39] [5.17] [7.39] Language Dummies Yes Yes Yes Yes Region Dummies Yes Yes 5 year time dummies Yes Yes Observations 1,245 1,245 1,245 1,245 # Countries 74 74 74 74 Log Likelihood -35.75 -24.49 -24.37 -13.99 Standard errors in brackets; * significant at 5%; ** significant at 1%
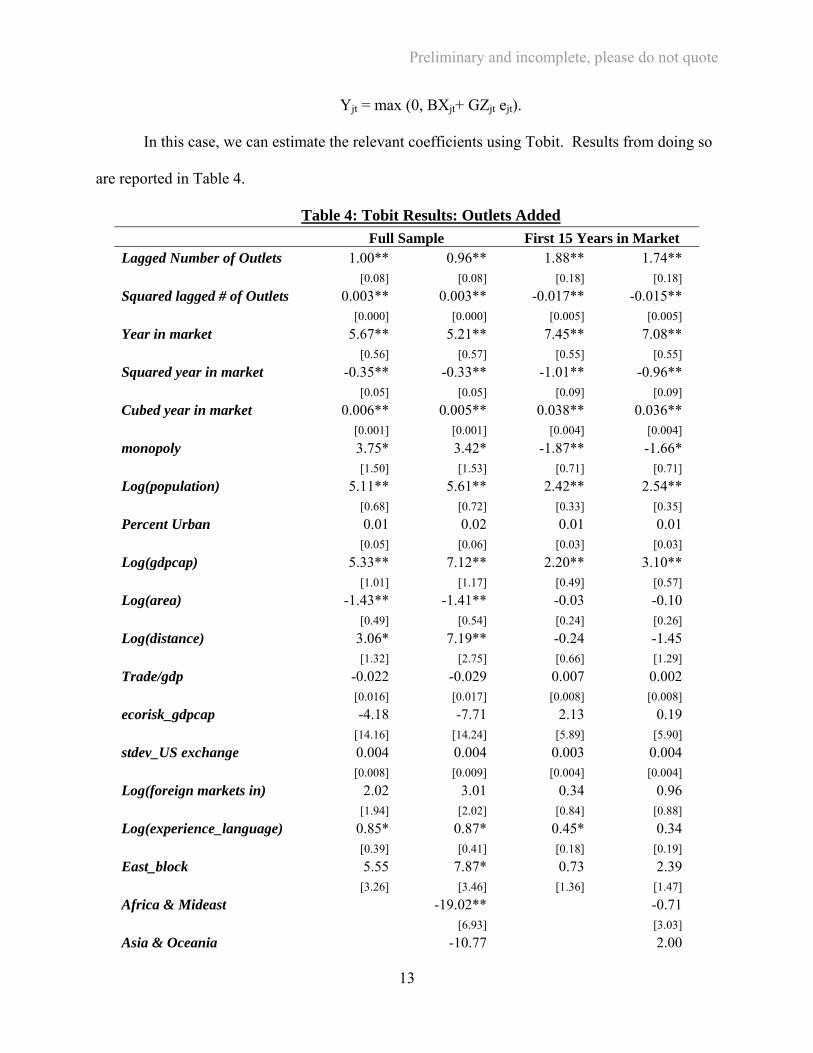
Focusing on entry rather than the whole process of international expansion of this chain,
however, ignores much relevant information. Assuming that entry and future expansion are part
of the same process, we can specify the process of outlet addition at time t in market j as
12
Preliminary and incomplete, please do not quote
Yjt = max (0, BXjt+ GZjt ejt).
In this case, we can estimate the relevant coefficients using Tobit. Results from doing so
are reported in Table 4.
Table 4: Tobit Results: Outlets Added Full Sample First 15 Years in Market Lagged Number of Outlets 1.00** 0.96** 1.88** 1.74** [0.08] [0.08] [0.18] [0.18] Squared lagged # of Outlets 0.003** 0.003** -0.017** -0.015** [0.000] [0.000] [0.005] [0.005] Year in market 5.67** 5.21** 7.45** 7.08** [0.56] [0.57] [0.55] [0.55] Squared year in market -0.35** -0.33** -1.01** -0.96** [0.05] [0.05] [0.09] [0.09] Cubed year in market 0.006** 0.005** 0.038** 0.036** [0.001] [0.001] [0.004] [0.004] monopoly 3.75* 3.42* -1.87** -1.66* [1.50] [1.53] [0.71] [0.71] Log(population) 5.11** 5.61** 2.42** 2.54** [0.68] [0.72] [0.33] [0.35] Percent Urban 0.01 0.02 0.01 0.01 [0.05] [0.06] [0.03] [0.03] Log(gdpcap) 5.33** 7.12** 2.20** 3.10** [1.01] [1.17] [0.49] [0.57] Log(area) -1.43** -1.41** -0.03 -0.10 [0.49] [0.54] [0.24] [0.26] Log(distance) 3.06* 7.19** -0.24 -1.45 [1.32] [2.75] [0.66] [1.29] Trade/gdp -0.022 -0.029 0.007 0.002 [0.016] [0.017] [0.008] [0.008] ecorisk_gdpcap -4.18 -7.71 2.13 0.19 [14.16] [14.24] [5.89] [5.90] stdev_US exchange 0.004 0.004 0.003 0.004 [0.008] [0.009] [0.004] [0.004] Log(foreign markets in) 2.02 3.01 0.34 0.96 [1.94] [2.02] [0.84] [0.88] Log(experience_language) 0.85* 0.87* 0.45* 0.34 [0.39] [0.41] [0.18] [0.19] East_block 5.55 7.87* 0.73 2.39 [3.26] [3.46] [1.36] [1.47] Africa & Mideast -19.02** -0.71 [6.93] [3.03] Asia & Oceania -10.77 2.00
13
Preliminary and incomplete, please do not quote
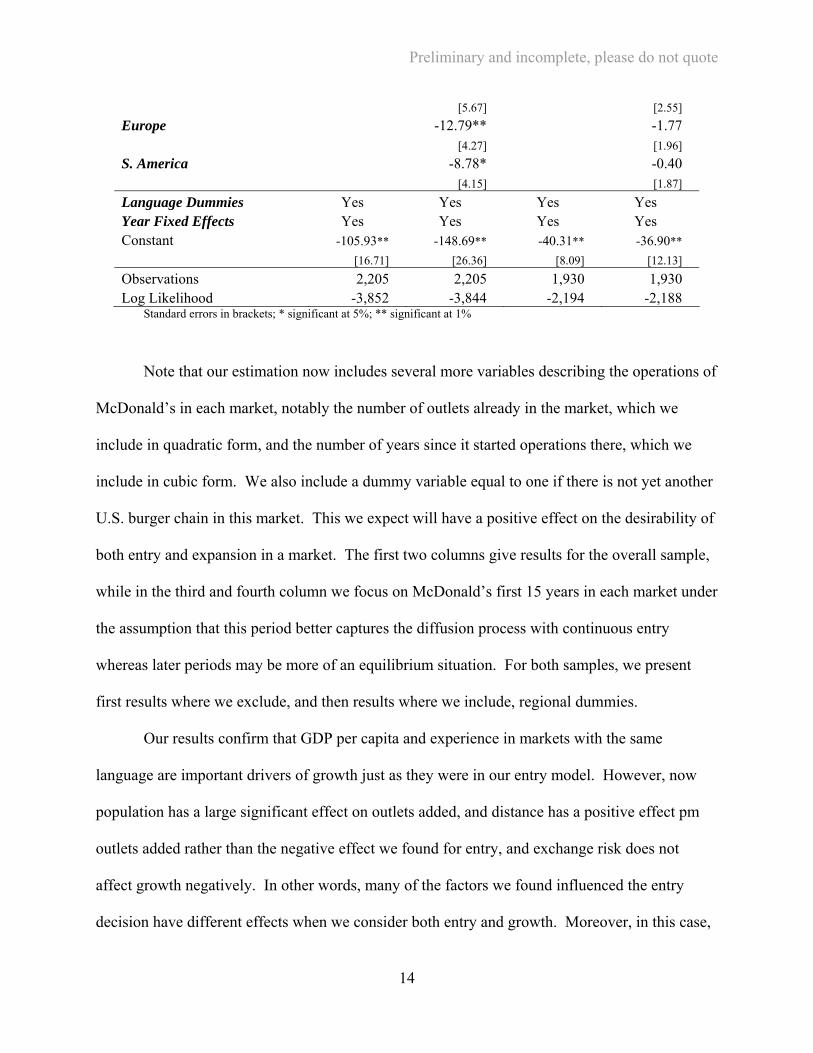
[5.67] [2.55] Europe -12.79** -1.77 [4.27] [1.96] S. America -8.78* -0.40 [4.15] [1.87] Language Dummies Yes Yes Yes Yes Year Fixed Effects Yes Yes Yes Yes Constant -105.93** -148.69** -40.31** -36.90** [16.71] [26.36] [8.09] [12.13] Observations 2,205 2,205 1,930 1,930 Log Likelihood -3,852 -3,844 -2,194 -2,188
Standard errors in brackets; * significant at 5%; ** significant at 1%
Note that our estimation now includes several more variables describing the operations of
McDonald’s in each market, notably the number of outlets already in the market, which we
include in quadratic form, and the number of years since it started operations there, which we
include in cubic form. We also include a dummy variable equal to one if there is not yet another
U.S. burger chain in this market. This we expect will have a positive effect on the desirability of
both entry and expansion in a market. The first two columns give results for the overall sample,
while in the third and fourth column we focus on McDonald’s first 15 years in each market under
the assumption that this period better captures the diffusion process with continuous entry
whereas later periods may be more of an equilibrium situation. For both samples, we present
first results where we exclude, and then results where we include, regional dummies.
Our results confirm that GDP per capita and experience in markets with the same
language are important drivers of growth just as they were in our entry model. However, now
population has a large significant effect on outlets added, and distance has a positive effect pm
outlets added rather than the negative effect we found for entry, and exchange risk does not
affect growth negatively. In other words, many of the factors we found influenced the entry
decision have different effects when we consider both entry and growth. Moreover, in this case,
14
Preliminary and incomplete, please do not quote
we can see that previous experience in the market (both in terms of stores or years of operation
there) increases generally the number of outlets added each year. The absence of other chains in
the market increases the number of outlets added in our overall sample, but it decreases it when
we focus on just the first 15 years in each market.
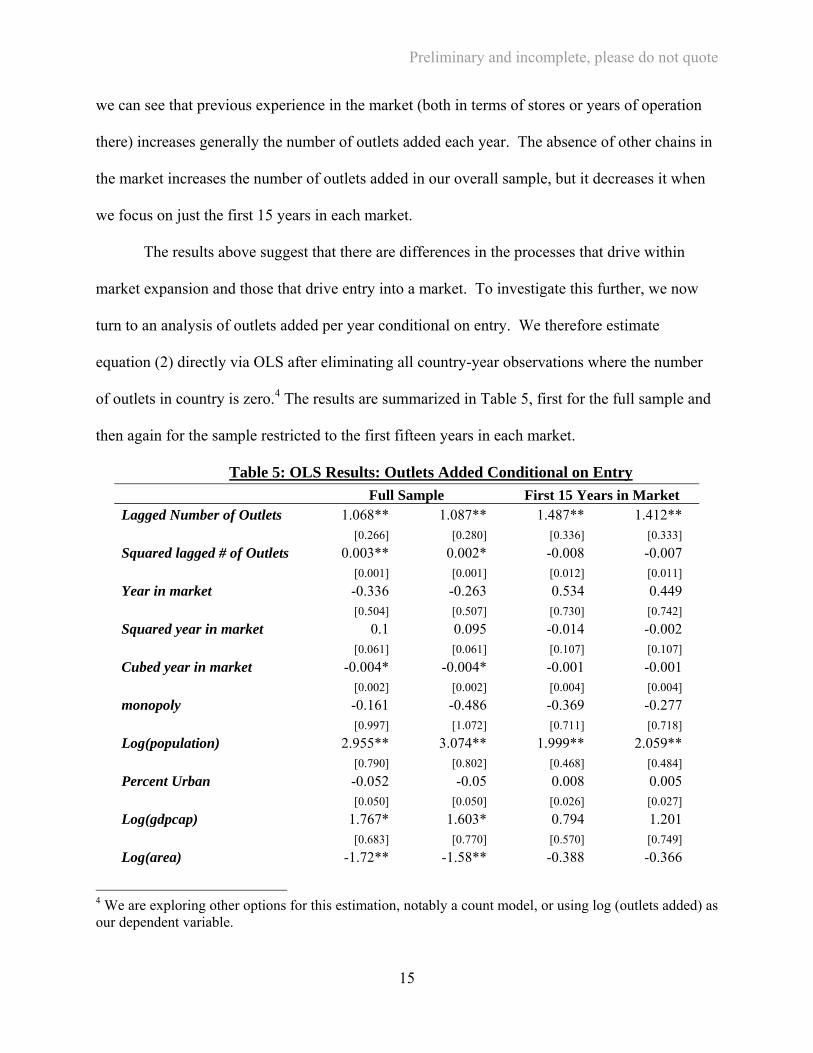
The results above suggest that there are differences in the processes that drive within
market expansion and those that drive entry into a market. To investigate this further, we now
turn to an analysis of outlets added per year conditional on entry. We therefore estimate
equation (2) directly via OLS after eliminating all country-year observations where the number
of outlets in country is zero.4 The results are summarized in Table 5, first for the full sample and
then again for the sample restricted to the first fifteen years in each market.
Table 5: OLS Results: Outlets Added Conditional on Entry Full Sample First 15 Years in Market Lagged Number of Outlets 1.068** 1.087** 1.487** 1.412** [0.266] [0.280] [0.336] [0.333] Squared lagged # of Outlets 0.003** 0.002* -0.008 -0.007 [0.001] [0.001] [0.012] [0.011] Year in market -0.336 -0.263 0.534 0.449 [0.504] [0.507] [0.730] [0.742] Squared year in market 0.1 0.095 -0.014 -0.002 [0.061] [0.061] [0.107] [0.107] Cubed year in market -0.004* -0.004* -0.001 -0.001 [0.002] [0.002] [0.004] [0.004] monopoly -0.161 -0.486 -0.369 -0.277 [0.997] [1.072] [0.711] [0.718] Log(population) 2.955** 3.074** 1.999** 2.059** [0.790] [0.802] [0.468] [0.484] Percent Urban -0.052 -0.05 0.008 0.005 [0.050] [0.050] [0.026] [0.027] Log(gdpcap) 1.767* 1.603* 0.794 1.201 [0.683] [0.770] [0.570] [0.749] Log(area) -1.72** -1.58** -0.388 -0.366
4 We are exploring other options for this estimation, notably a count model, or using log (outlets added) as our dependent variable.
15
Preliminary and incomplete, please do not quote
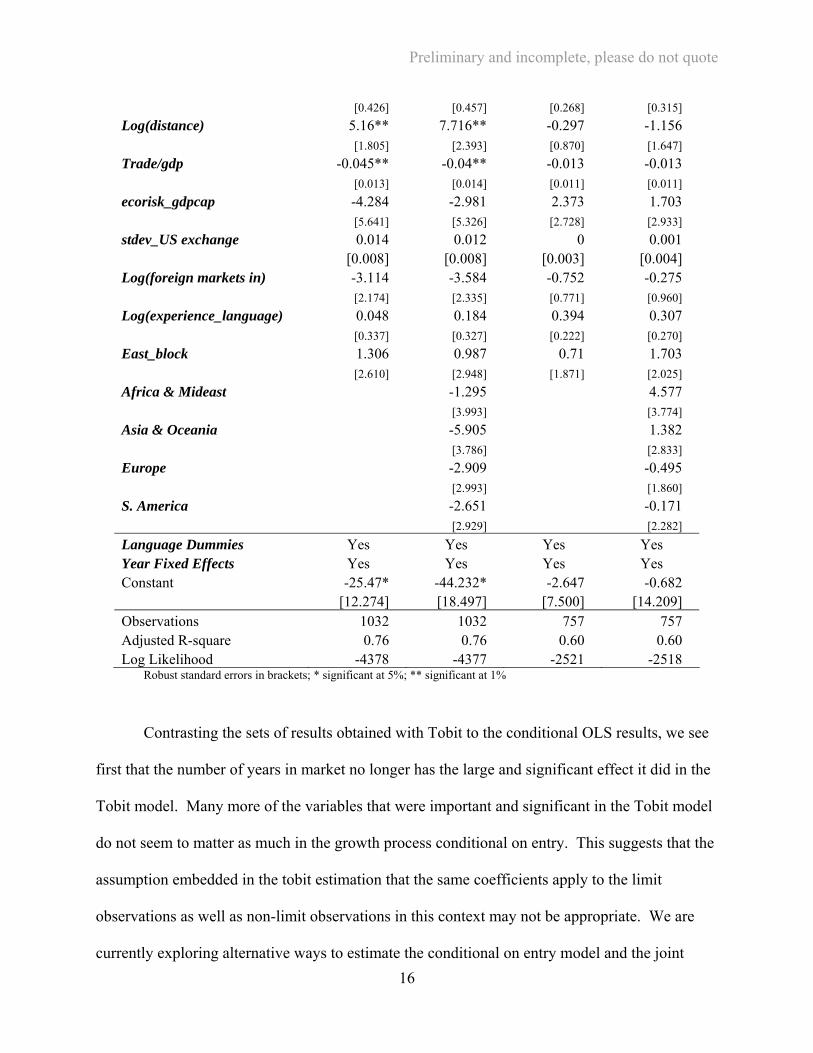
[0.426] [0.457] [0.268] [0.315] Log(distance) 5.16** 7.716** -0.297 -1.156 [1.805] [2.393] [0.870] [1.647] Trade/gdp -0.045** -0.04** -0.013 -0.013 [0.013] [0.014] [0.011] [0.011] ecorisk_gdpcap -4.284 -2.981 2.373 1.703 [5.641] [5.326] [2.728] [2.933] stdev_US exchange 0.014 0.012 0 0.001 [0.008] [0.008] [0.003] [0.004] Log(foreign markets in) -3.114 -3.584 -0.752 -0.275 [2.174] [2.335] [0.771] [0.960] Log(experience_language) 0.048 0.184 0.394 0.307 [0.337] [0.327] [0.222] [0.270] East_block 1.306 0.987 0.71 1.703 [2.610] [2.948] [1.871] [2.025] Africa & Mideast -1.295 4.577 [3.993] [3.774] Asia & Oceania -5.905 1.382 [3.786] [2.833] Europe -2.909 -0.495 [2.993] [1.860] S. America -2.651 -0.171 [2.929] [2.282] Language Dummies Yes Yes Yes Yes Year Fixed Effects Yes Yes Yes Yes Constant -25.47* -44.232* -2.647 -0.682 [12.274] [18.497] [7.500] [14.209] Observations 1032 1032 757 757 Adjusted R-square 0.76 0.76 0.60 0.60 Log Likelihood -4378 -4377 -2521 -2518
Robust standard errors in brackets; * significant at 5%; ** significant at 1%
Contrasting the sets of results obtained with Tobit to the conditional OLS results, we see
first that the number of years in market no longer has the large and significant effect it did in the
Tobit model. Many more of the variables that were important and significant in the Tobit model
do not seem to matter as much in the growth process conditional on entry. This suggests that the
assumption embedded in the tobit estimation that the same coefficients apply to the limit
observations as well as non-limit observations in this context may not be appropriate. We are
currently exploring alternative ways to estimate the conditional on entry model and the joint 16
Preliminary and incomplete, please do not quote
model in nested form (e.g. Cragg, 1971), and the McDonald and Moffit (1980) decomposition of
marginal effects to shed further light on these comparative results. However, at this stage, our
estimations suggest that there is room for improving our understanding of firms’ international
expansion by looking at service firms who need to grow their physical presence in every foreign
country in observable ways in order to access customers there. Moreover, we have found
evidence of gradual expansion starting with more desirable high GDP per capita markets, and
continued expansion across markets the firm has already entered.
5. CONCLUSION In this paper, we examined the international expansion process followed by one of the
most visible American firms to expand abroad, and also a firm that has pioneered American fast-
food and franchising in several countries. We found that this firm’s pattern of entry into foreign
markets and growth easily rejects the notion that McDonald’s expanded abroad because it had
saturated its home market. Instead, consistent with traditional profit maximization arguments for
a multiple market monopoly, we find evidence that it allocated resources to achieve to some
notion of balanced growth across many highly desirable markets, starting with the most desirable
ones first. Finally, we have found that while expansion conditional on entry, and entry itself
share some common properties, e.g. they are both positively related to a market’s GDP per
capita, there are also several factors that affect entry and expansion differently. We conclude
that it is worthwhile considering more generally how service chains expand abroad and go
beyond just entry to gain further insights in the process and hurdles involved in foreign
expansion.
17
Preliminary and incomplete, please do not quote
References
Anderson, Erin and Hubert Gatignon. 1986. “Modes of Foreign Entry: A Transaction Cost Analysis and Propositions.” Journal of International Business Studies (Fall 1986) 1-26.
Barkema, Harry G., John H. J. Bell, and Johannes M. Pennings. 1996. “Foreign Entry, Cultural Barriers, and Learning.” Strategic Management Journal 17: 151-166.
Berry, S., “Estimation of a Model of Entry in the Airline Industry,” Econometrica (60), July 1992, 889-918.
Bhattacharyya, Sugato and Francine Lafontaine, (1995), “Double-Sided Moral Hazard and the Nature of Share Contracts,” RAND Journal of Economics, 26, 761-781.
Bresnahan, T. and P. Reiss (1987)
Buckley, P. J. and M. C. Casson. 1998. “Analyzing Foreign Market Entry Strategies: Extending the Internationalization Approach.” Journal of International Business Studies 29: (3) 539-561.
Camerer, C. and D. Lovallo. 1999. Overconfidence and Excess Entry: An Experimental Approach, American Economic Review, 89(1): 306-318.
Caplin, A. and Leah, J., 1998, “Miracle on Sixth Avenue: Information externalities and search”, Economic Journal, 60-74.
Caves, R.E. and W.F. Murphy (1976) “Franchising: Firms, Markets, and Intangible Assets,” Southern Economic Journal, 42, 572-586.
Contractor, F.J. and S.K. Kundu (1998a) “Franchising Versus Company-Run Operations: Modal Choice in the Global Hotel Sector,” Journal of International Marketing, 6, 28-53.
Contractor, F.J. and S.K. Kundu (1998b) "Modal Choice in a World of Alliances: Analyzing Organizational Forms in the International Hotel Sector." Journal of International Business Studies 29, (2): 325-357.
Davidson, William H. 1980. “The Location of Foreign Direct Investment Activity: Country Characteristics and Experience Effects.” Journal of International Business Studies 11: (2) 9-22.
González-Díaz, Manuel and Begoña López, “Market Saturation, Intangible assets and Monitoring costs: The Internationalization of Spanish Franchising,” mimeo, Universidad de Oviedo - Facultad de Economicas.
Dunne, Timothy, Mark Roberts and Larry Samuelson. 1989. Firm entry and post-entry performance in the U.S. chemical industries. Journal of Law and Economics, 32: 233-272.
Dunning, John H. 1988. “The Eclectic Paradigm of International Production: A Restatement and Some Possible Extensions.” Journal of International Business Studies (Spring)
Evans, W., H. Lane and S. O’Grady. 1992. “Border Crossings: Doing Business in the U.S. Scarborough, Canada: Prentice Hall.
18
Preliminary and incomplete, please do not quote
Falbe, Cecilia M. and Dianne H.B. Welsh, 1998. NAFTA and Franchising: A Comparison of Franchisor Perceptions of Characteristics Associated With Franchisee Success and Failure in Canada, Mexico, and the United States. Journal of Business Venturing, 13 (2), 151-171.
Fladmoe-Lindquist, Karin and Laurent L. Jacque (1995) Control modes in international service operations: The propensity to franchise. Management Science, 41 (7): 1238-1249.
Gatignon, Hubert and Erin Anderson. 1988. “The Multinational Corporation’s Degree of Control over Foreign Subsidiaries: An Empirical Test of a Transaction Cost Explanation.” Journal of Law, Economics, and Organization 4: (2) 305-336.
Geroski, Paul. 1995. “What do we know about entry.” International Journal of Industrial Organization, 13: 421-440.
Gielens, K. and M. Dekimpe. 2001. Do International Entry Decisions of Retail Chains Matter in the Long Run? International Journal of Research in Marketing, 18: 235-259.
Gilman, Alan L. 1992. Franchising: An international frontier. Chain store Age Executive, 68 (2): 70.
Gomes-Casseres, Benjamin. 1989. “Firm Ownership Preferences and Host Government Restrictions: An Integrated Approach.” Journal of International Business Studies (First Quarter): 1-22.
Henisz, Witold J. 2000. “The Institutional Environment for Multinational Investment.” Journal of Law, Economics and Organization 16: (2) 343-363.
Hymer, Stephen H. 1976. The International Operations of National Firms.
Kobrin, Stephen J. 1976. “The Environmental Determinants of Foreign Direct Manufacturing Investment: An Ex Post Empirical Analysis.” Journal of International Business Studies 7: 29-42.
Kogut, Bruce and Sea Jin Chang. 1991. “Technological Capabilities and Japanese Foreign Direct Investment in the United States.” Review of Economics and Statistics 74: 401-413.
Kogut, Bruce and Harbir Singh. 1988. “The Effect of National Culture on the Choice of Entry Mode.” Journal of International Business Studies 19: (4) 263-283.
Lafontaine, Francine. 1992. “Agency Theory and Franchising: Some Empirical Results,” RAND Journal of Economics, 23, 263-283. “
Lafontaine, Francine and Joanne Oxley. 2004. “International Franchising Practices in Mexico: Do Franchisors Customize their Contracts?” forthcoming, Journal of Economics and Management Strategy.
Lafontaine, Francine and Kathryn L. Shaw (1998) “Franchising Growth and Franchisor Entry and Exit in the US Market: Myth and Reality,” Journal of Business Venturing, 13, 95-112.
Lafontaine, Francine and Kathryn L. Shaw. 2005. “Targeting Managerial Control: Evidence from Franchising,” forthcoming, RAND Journal of Economics.
19
Preliminary and incomplete, please do not quote
and ____ (2001) “Incentive Contracting and the Franchise Decision,” in Advances in Business Applications of Game Theory, K. Chatterjee and W. Samuelson (eds.) Kluwer Academic Press.
Lieberman, Marvin B. and David B. Montgomery. 1998. “First-Mover (Dis)Advantages: Retrospective and Link with the Resource-Based View.” Strategic Management Journal 19: 1111-1125.
Mazzeo, M., 2002, “Product Choice and Oligopoly Market Structure”, RAND Journal of Economics, 33, 221-242.
Mitchell, William, J. Shaver and Bernard Yeung. 1994. “Foreign Entrant Survival and Foreign Market Share: Canadian Companies’ Experience in United States Medical Sector Markets,” Strategic Management Journal, 15: 555-567.
Mitra, Debanjan and Peter N. Golder. 2002. “Whose culture matters? Near-market knowledge and its impact on foreign market entry timing.” Journal of Marketing Research
Reiss, P.C., 1996, “Empirical Models of Discrete Strategic Choices”, American Economic Review, 86, 421-426.
Roberts, Mark.J. and J.R. Tybout, (1998), "The Decision to Export in Columbia: An Empirical Model of Entry With Sunk Costs," American Economic Review
Shane, Scott A. (1996), “Why Franchise Companies Expand Overseas,” Journal of Business Venturing, 11, 2, 73-88.
Scott Morton, F., 1999, “Entry Decisions in the Generic Drug Industry”, RAND Journal of Economics, 30, 3.
Shaver, J. Myles. 1998. “Accounting for Endogeneity When Assessing Strategy Performance: Does Entry Mode Choice Affect FDI Survival?” Management Science 44: (4) 571-585.
Teece, David J. 1986. “Transaction Cost Economics and the Multinational Enterprise: An Assessment.” Journal of Economic Behavior and Organization 21: 21-45.
Zietlow, Dixie S. and Jean-Francois Hennart (1996), The international distribution of franchises by US Franchisors. CIBER Working paper 96-102, University of Illinois at Urbana-Champaign.
Seim, K., (2002), An Empirical Model of Firm Entry with Endogenous Product-Type Choices, mimeo, GSB Stanford.
Toivanen, Otto and Michael Waterson, 2000, Empirical Research on Discrete Choice Game Theory Models of Entry: An Illustration, European Economic Review, 44, 985-992.
Toivanen, Otto and Michael Waterson, 2001, “Market Structure and Entry: Where's the Beef?”mimeo, Warwick University.
20
Preliminary and incomplete, please do not quote
Figure 3: McDonald’s System-wide Store Count (1955-2002)
0
5,000
10,000
15,000
20,000
25,000
30,000
1955
1956
1957
1958
1959
1960
1961
1962
1963
1964
1965
1966
1967
1968
1969
1970
1971
1972
1973
1974
1975
1976
1977
1978
1979
1980
1981
1982
1983
1984
1985
1986
1987
1988
1989
1990
1991
1992
1993
1994
1995
1996
1997
1998
1999
2000
2001
2002
Year
# Stores
US Foreign
21
Preliminary and incomplete, please do not quote
Figure 4: # Stores Per Million People System-wide Within Sampled Jurisdictions
(Comparison Across Chains)
0
1
2
3
4
5
6
7
1955 1960 1965 1970 1975 1980 1985 1990 1995 2000
Calendar Year
# St
ores
/Mill
ion
Peop
le
McDonald's Wendy's Burger King
22
Preliminary and incomplete, please do not quote
Appendix
APPENDIX
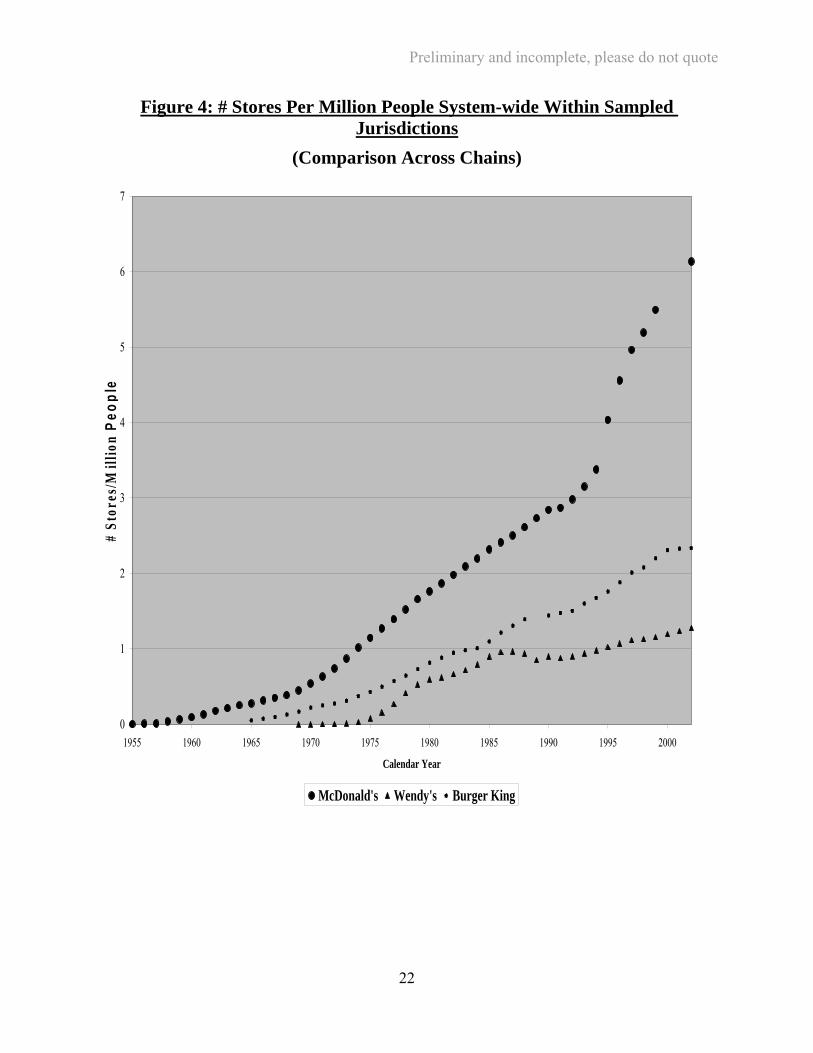
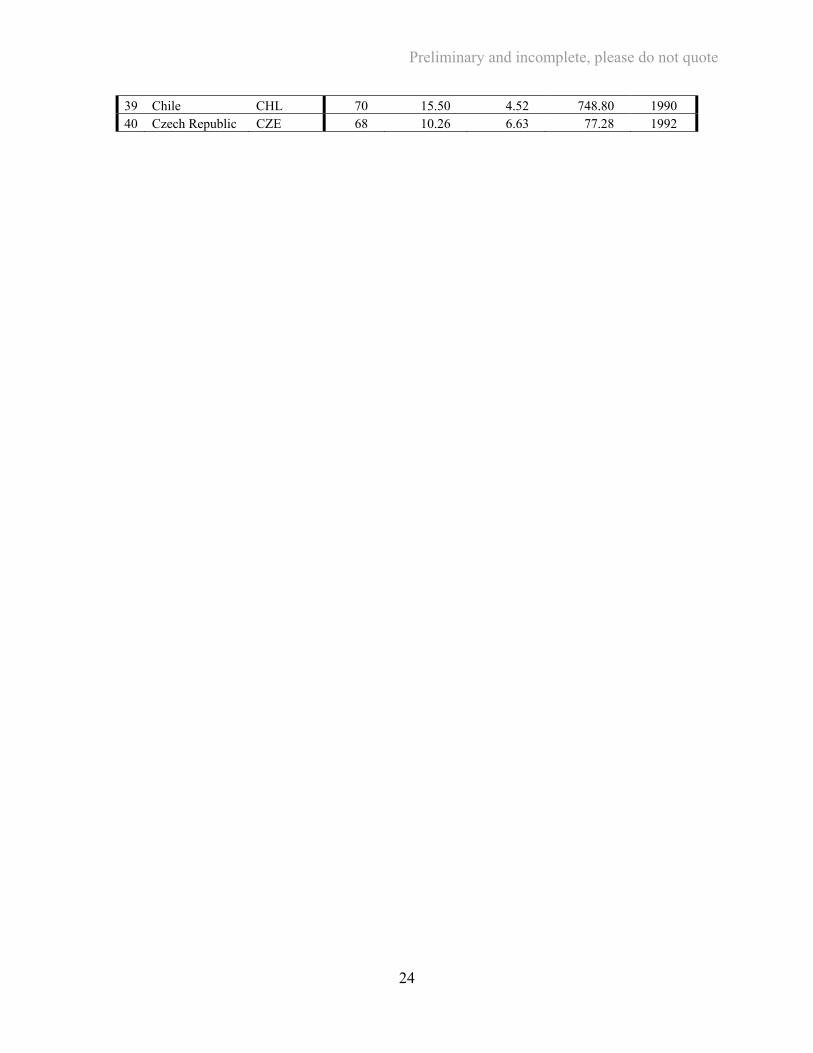
Table A1: McDonald’s International Presence: Jurisdictions in Final Sample
Country Country ID # Stores
Population (Millions)
# Stores/ Million People
Area in Sq. Km (000s)
Entry Year
1 United States USA 13,491 287.68 46.90 9,158.96 1955 2 Japan JPN 3,891 127.07 30.62 364.50 1971 3 Canada CAN 1,304 31.90 40.87 9,220.97 1967 4 United Kingdom GBR 1,229 59.91 20.51 240.88 1974 5 Germany DEU 1,211 82.35 14.71 356.68 1971 6 France FRA 973 59.93 16.24 550.10 1972 7 Australia AUS 726 19.55 37.14 7,682.30 1971 8 Brazil BRA 584 179.91 3.25 8,456.51 1979 9 China CHN 546 1,279.16 0.43 9,327.42 1990
10 South Korea KOR 357 47.96 7.44 98.73 1988 11 Taiwan TWN 350 22.45 15.59 36.00 1984 12 Spain ESP 333 40.15 8.29 499.44 1981 13 Italy ITA 329 57.93 5.68 294.11 1985 14 Mexico MEX 261 103.40 2.52 1,908.69 1985 15 Sweden SWE 245 8.88 27.60 411.62 1973 16 Philippines PHL 236 83.00 2.84 298.17 1981 17 Netherlands NLD 220 16.07 13.69 33.88 1971 18 Hong Kong HKG 216 7.30 29.58 0.99 1975 19 Argentina ARG 203 38.33 5.30 2,736.69 1986 20 Poland POL 200 38.63 5.18 304.42 1992 21 Austria AUT 157 8.17 19.22 82.73 1977 22 Malaysia MYS 149 22.66 6.57 328.55 1982 23 New Zealand NZL 148 3.91 37.87 267.99 1976 24 Switzerland CHE 138 7.30 18.90 39.55 1976 25 Singapore SGP 130 4.45 29.20 0.61 1979 26 Venezuela VEN 129 24.29 5.31 882.05 1985 27 Puerto Rico PRI 112 3.86 28.99 8.87 1967 28 Portugal PRT 110 10.08 10.91 91.50 1991 29 Indonesia IDN 105 231.33 0.45 1,811.57 1991 30 Thailand THA 100 63.65 1.57 510.89 1985 31 Israel ISR 99 6.03 16.42 20.62 1993 32 Russia RUS 94 144.98 0.65 16,888.50 1990 33 Finland FIN 90 5.18 17.36 304.59 1984 34 South Africa ZAF 89 42.72 2.08 1,221.04 1996 35 Denmark DNK 84 5.37 15.65 42.43 1981 36 Hungary HUN 83 10.08 8.24 92.34 1988 37 Turkey TUR 81 67.31 1.20 769.63 1986 38 Saudi Arabia SAU 79 23.51 3.36 2,149.69 1993
23
Preliminary and incomplete, please do not quote
39 Chile CHL 70 15.50 4.52 748.80 1990 40 Czech Republic CZE 68 10.26 6.63 77.28 1992
24
Preliminary and incomplete, please do not quote
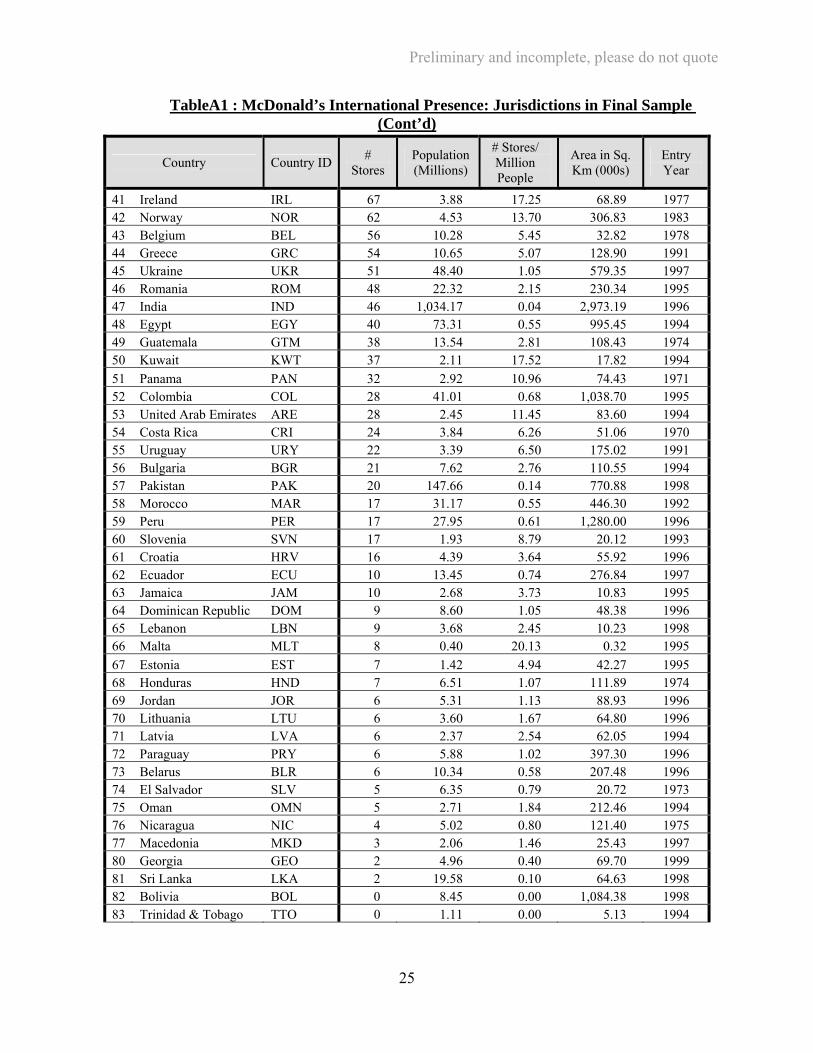
TableA1 : McDonald’s International Presence: Jurisdictions in Final Sample (Cont’d)
Country Country ID # Stores
Population (Millions)
# Stores/ Million People
Area in Sq. Km (000s)
Entry Year
41 Ireland IRL 67 3.88 17.25 68.89 1977 42 Norway NOR 62 4.53 13.70 306.83 1983 43 Belgium BEL 56 10.28 5.45 32.82 1978 44 Greece GRC 54 10.65 5.07 128.90 1991 45 Ukraine UKR 51 48.40 1.05 579.35 1997 46 Romania ROM 48 22.32 2.15 230.34 1995 47 India IND 46 1,034.17 0.04 2,973.19 1996 48 Egypt EGY 40 73.31 0.55 995.45 1994 49 Guatemala GTM 38 13.54 2.81 108.43 1974 50 Kuwait KWT 37 2.11 17.52 17.82 1994 51 Panama PAN 32 2.92 10.96 74.43 1971 52 Colombia COL 28 41.01 0.68 1,038.70 1995 53 United Arab Emirates ARE 28 2.45 11.45 83.60 1994 54 Costa Rica CRI 24 3.84 6.26 51.06 1970 55 Uruguay URY 22 3.39 6.50 175.02 1991 56 Bulgaria BGR 21 7.62 2.76 110.55 1994 57 Pakistan PAK 20 147.66 0.14 770.88 1998 58 Morocco MAR 17 31.17 0.55 446.30 1992 59 Peru PER 17 27.95 0.61 1,280.00 1996 60 Slovenia SVN 17 1.93 8.79 20.12 1993 61 Croatia HRV 16 4.39 3.64 55.92 1996 62 Ecuador ECU 10 13.45 0.74 276.84 1997 63 Jamaica JAM 10 2.68 3.73 10.83 1995 64 Dominican Republic DOM 9 8.60 1.05 48.38 1996 65 Lebanon LBN 9 3.68 2.45 10.23 1998 66 Malta MLT 8 0.40 20.13 0.32 1995 67 Estonia EST 7 1.42 4.94 42.27 1995 68 Honduras HND 7 6.51 1.07 111.89 1974 69 Jordan JOR 6 5.31 1.13 88.93 1996 70 Lithuania LTU 6 3.60 1.67 64.80 1996 71 Latvia LVA 6 2.37 2.54 62.05 1994 72 Paraguay PRY 6 5.88 1.02 397.30 1996 73 Belarus BLR 6 10.34 0.58 207.48 1996 74 El Salvador SLV 5 6.35 0.79 20.72 1973 75 Oman OMN 5 2.71 1.84 212.46 1994 76 Nicaragua NIC 4 5.02 0.80 121.40 1975 77 Macedonia MKD 3 2.06 1.46 25.43 1997 80 Georgia GEO 2 4.96 0.40 69.70 1999 81 Sri Lanka LKA 2 19.58 0.10 64.63 1998 82 Bolivia BOL 0 8.45 0.00 1,084.38 1998 83 Trinidad & Tobago TTO 0 1.11 0.00 5.13 1994
25
Preliminary and incomplete, please do not quote
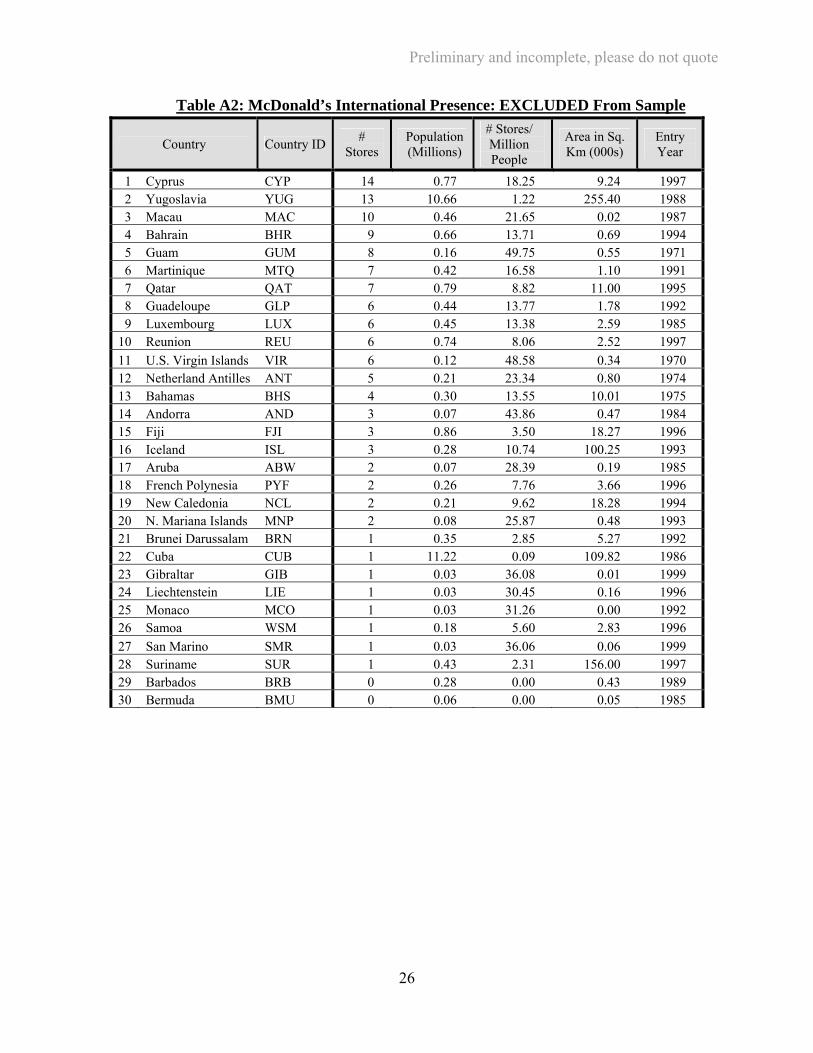
Table A2: McDonald’s International Presence: EXCLUDED From Sample
Country Country ID # Stores
Population (Millions)
# Stores/ Million People
Area in Sq. Km (000s)
Entry Year
1 Cyprus CYP 14 0.77 18.25 9.24 1997 2 Yugoslavia YUG 13 10.66 1.22 255.40 1988 3 Macau MAC 10 0.46 21.65 0.02 1987 4 Bahrain BHR 9 0.66 13.71 0.69 1994 5 Guam GUM 8 0.16 49.75 0.55 1971 6 Martinique MTQ 7 0.42 16.58 1.10 1991 7 Qatar QAT 7 0.79 8.82 11.00 1995 8 Guadeloupe GLP 6 0.44 13.77 1.78 1992 9 Luxembourg LUX 6 0.45 13.38 2.59 1985
10 Reunion REU 6 0.74 8.06 2.52 1997 11 U.S. Virgin Islands VIR 6 0.12 48.58 0.34 1970 12 Netherland Antilles ANT 5 0.21 23.34 0.80 1974 13 Bahamas BHS 4 0.30 13.55 10.01 1975 14 Andorra AND 3 0.07 43.86 0.47 1984 15 Fiji FJI 3 0.86 3.50 18.27 1996 16 Iceland ISL 3 0.28 10.74 100.25 1993 17 Aruba ABW 2 0.07 28.39 0.19 1985 18 French Polynesia PYF 2 0.26 7.76 3.66 1996 19 New Caledonia NCL 2 0.21 9.62 18.28 1994 20 N. Mariana Islands MNP 2 0.08 25.87 0.48 1993 21 Brunei Darussalam BRN 1 0.35 2.85 5.27 1992 22 Cuba CUB 1 11.22 0.09 109.82 1986 23 Gibraltar GIB 1 0.03 36.08 0.01 1999 24 Liechtenstein LIE 1 0.03 30.45 0.16 1996 25 Monaco MCO 1 0.03 31.26 0.00 1992 26 Samoa WSM 1 0.18 5.60 2.83 1996 27 San Marino SMR 1 0.03 36.06 0.06 1999 28 Suriname SUR 1 0.43 2.31 156.00 1997 29 Barbados BRB 0 0.28 0.00 0.43 1989 30 Bermuda BMU 0 0.06 0.00 0.05 1985
26