beware your tracers(?) - startseite | max-planck-institut ...dynamics/ringberg/files/martin.pdf ·...
TRANSCRIPT

Beware your tracers(?)
Nicolas Martin(Strasbourg Observatory
& MPIA)
Musings from the PAndAS view of the M31 satellite system
Friday, April 13, 12

Friday, April 13, 12

Friday, April 13, 12

Insights (I got) from photometry alone
๏ case 1 – distance to M31 satellite galaxies• Measurements are not x.x kpc. Are measurements really x.x ± y.y kpc
(i.e. Gaussian uncertainties)?
• What do the data really tell us?
๏ case 2 – M31 satellite globular clusters
• Can/Should we do away with the isotropy assumption?
๏ case 3 – dwarf galaxies are not spherical
• What impact does it have on modeling?
Friday, April 13, 12

Distance to M31 satellite galaxies
Are measurements really xx.x ±yy.y ?What do the data really tell us?
Friday, April 13, 12

Dwarf galaxies in PAndAS
Friday, April 13, 12

Dwarf galaxies in PAndAS
Friday, April 13, 12

Dwarf galaxies in PAndAS
6 dSphs (2004) → 28 dSphs (now; 4 SDSS + 16 PAndAS)
Zucker et al. (2004; 1)Martin et al. (2006; 3)
Ibata et al. (2007; 2)Irwin et al. (2007; 1)
Zucker et al. (2007; 1)McConnachie et al. (2008; 3)
Martin et al. (2009; 2)Richardson et al. (2011, 5)
Bell, Slater & Martin (2011, 1)Slater, Bell & Martin (2011, 1)
PAndAS et al. (in prep, 1)
Friday, April 13, 12

Two examples760 MARTIN ET AL. Vol. 705
Figure 2. Left panel: spatial distribution of stellar sources around And XXI. Small dots represent all stars in the PAndAS survey whereas large dots correspond tolikely RGB stars of the dwarf galaxy, selected within the dashed box shown on the CMD of the middle panel. These stars are clearly clumped into an overdensity ofstars. MegaCam CCDs are shown as dashed rectangles and white regions correspond to holes in-between CCDs or holes in the survey. Open circles correspond toregions that are lost to the survey due to the presence of saturated bright stars. The central dashed ellipse corresponds to the region within two half-light radii of thedwarf galaxy, assuming the structural parameters listed in Table 1. Right panels: color–magnitude diagrams within two half-light radii of And XXI (middle panel)and, for comparison, of a field region at a distance of !20" covering the same area after correcting from gaps in the survey coverage (rightmost panel). The galaxy’sRGB is clearly visible as an overdensity of stars with 0.8 ! g # i ! 1.5 and i " 21.2 that does not appear in the reference CMD.(A color version of this figure is available in the online journal.)
Figure 3. Same as Figure 2 but for And XXII. Although this system is much fainter, it still appears as a spatial overdensity of stars (left panel) that are aligned along aRGB in the CMD (middle panel), a feature that does not appear in the reference CMD (right panel).(A color version of this figure is available in the online journal.)
Both systems appear as overdensities of stars on the sky, as isvisible in the left panels of Figures 2 and 3. These stars are alsoaligned along a RGB that would be at, or close to, the distanceof M31 or M33. The color-magnitude diagrams (CMDs) within2 half-light radii of the dwarfs (determined in Section 3.3) areshown in the middle panels of these figures and, when comparedto the CMD of reference fields chosen in an annulus covering
the same area at a distance of !20" from the dwarfs’ centers(right panels), indeed reveal an alignment of stars that followthe typical shape of a RGB. Isolating these stars enhances thecontrast of the overdensity of stars on the sky (large symbols inthe left panels).
And XXI is typical of the relatively bright dwarf galaxiesthat we have found before (such as And XV or And XVI).
760 MARTIN ET AL. Vol. 705
Figure 2. Left panel: spatial distribution of stellar sources around And XXI. Small dots represent all stars in the PAndAS survey whereas large dots correspond tolikely RGB stars of the dwarf galaxy, selected within the dashed box shown on the CMD of the middle panel. These stars are clearly clumped into an overdensity ofstars. MegaCam CCDs are shown as dashed rectangles and white regions correspond to holes in-between CCDs or holes in the survey. Open circles correspond toregions that are lost to the survey due to the presence of saturated bright stars. The central dashed ellipse corresponds to the region within two half-light radii of thedwarf galaxy, assuming the structural parameters listed in Table 1. Right panels: color–magnitude diagrams within two half-light radii of And XXI (middle panel)and, for comparison, of a field region at a distance of !20" covering the same area after correcting from gaps in the survey coverage (rightmost panel). The galaxy’sRGB is clearly visible as an overdensity of stars with 0.8 ! g # i ! 1.5 and i " 21.2 that does not appear in the reference CMD.(A color version of this figure is available in the online journal.)
Figure 3. Same as Figure 2 but for And XXII. Although this system is much fainter, it still appears as a spatial overdensity of stars (left panel) that are aligned along aRGB in the CMD (middle panel), a feature that does not appear in the reference CMD (right panel).(A color version of this figure is available in the online journal.)
Both systems appear as overdensities of stars on the sky, as isvisible in the left panels of Figures 2 and 3. These stars are alsoaligned along a RGB that would be at, or close to, the distanceof M31 or M33. The color-magnitude diagrams (CMDs) within2 half-light radii of the dwarfs (determined in Section 3.3) areshown in the middle panels of these figures and, when comparedto the CMD of reference fields chosen in an annulus covering
the same area at a distance of !20" from the dwarfs’ centers(right panels), indeed reveal an alignment of stars that followthe typical shape of a RGB. Isolating these stars enhances thecontrast of the overdensity of stars on the sky (large symbols inthe left panels).
And XXI is typical of the relatively bright dwarf galaxiesthat we have found before (such as And XV or And XVI).
Martin et al. (2009)
And XXIMV = –9.9±0.6 rh = 875±127 pc
And XXIIMV = –6.5±0.8 rh ~ 220 pc
X
Y
g-i
i
Friday, April 13, 12

Determining distances
Severely incomplete information!
A. Conn et al. (2011, 2012)
Friday, April 13, 12

TRGB distancesTip of the Red Giant Branch
A. Conn et al. (2011, 2012)
And IFriday, April 13, 12

TRGB distancesTip of the Red Giant Branch
A. Conn et al. (2011, 2012)
And IFriday, April 13, 12

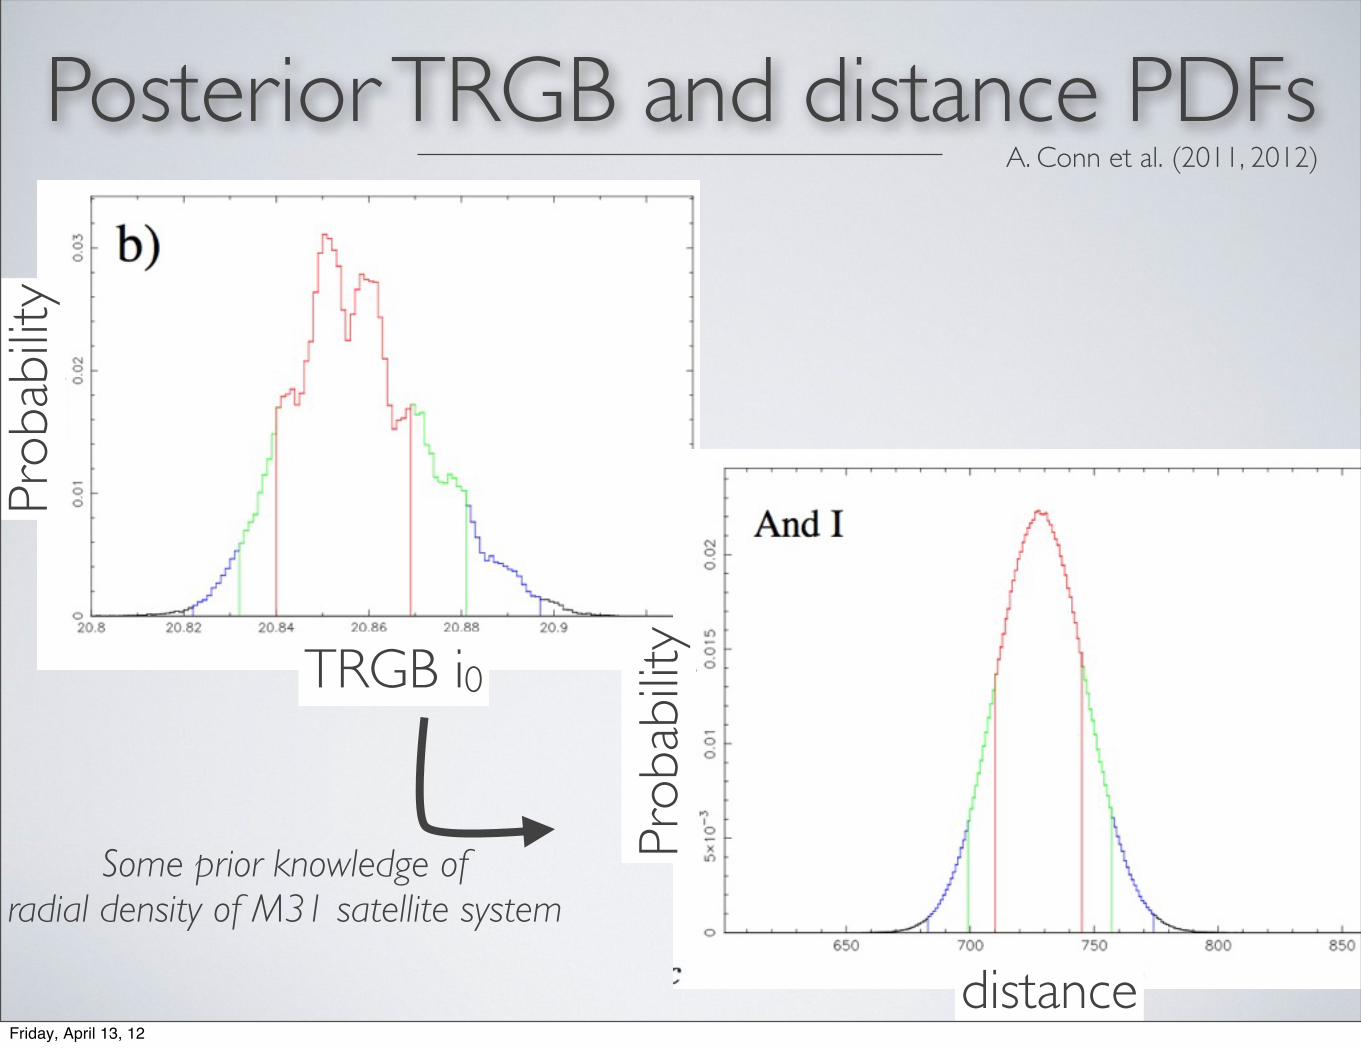
Posterior TRGB and distance PDFsPr
obab
ility
TRGB i0
A. Conn et al. (2011, 2012)
Friday, April 13, 12
Posterior TRGB and distance PDFsPr
obab
ility
TRGB i0
A. Conn et al. (2011, 2012)
Some prior knowledge ofradial density of M31 satellite system
Prob
abilit
y
distanceFriday, April 13, 12

And XIIIA. Conn et al. (2011, 2012)
Friday, April 13, 12

And XIIIA. Conn et al. (2011, 2012)
Friday, April 13, 12

And XIIIA. Conn et al. (2011, 2012)
Friday, April 13, 12

What the data really say…
…
A. Conn et al. (2011, 2012)
Friday, April 13, 12

M31 globular clusters
Can/Should we do away with the isotropy assumption?
Friday, April 13, 12

Globular Clusters is PAndASAn accretion origin for M31 outer halo globular clusters 3
Figure 1. First-semester PAndAS map of the spatial density of stellar sources possessing luminosities and colours consistent with being metal-poor red-giantbranch stars ([Fe/H]! −1.4) in the M31 halo (McConnachie et al. 2009). The two dashed circles, representing Rp = 30 and 130 kpc, indicate the vast scale of thesurvey. Our globular cluster sample is overlaid, marked by red points (compact clusters) and blue points (extended clusters). Objects outside the PAndAS areaare from our previous survey work. Major halo substructres are labelled (see text for details); region (1) indicates the ill-defined major-axis feature and nearbyoverdensities to the east and north, while (2) marks the inner western cluster group. The lower panel shows 1! ! 1! PAndAS i-band thumbnails for ten of ourglobular clusters spanning 30 ! Rp ! 120 kpc and a wide variety of sizes and luminosities. The lower right-most two are good examples of extended clusters.
Mackey et al. (2010)
~2% probability of being randomFriday, April 13, 12

Dwarf galaxies are not spherical
What impact does it have on modeling?
Friday, April 13, 12

Ellipticity of MW satellitesMartin, de Jong & Rix (2008)
(X0,Y0)
θ
ε
rh
ΣbSDSS starsbest max.
likelihood model
Boötes IFriday, April 13, 12

Ellipticity of MW satellitesMartin, de Jong & Rix (2008)
Friday, April 13, 12

Ellipticity of MW satellitesMartin, de Jong & Rix (2008)
Friday, April 13, 12

Ellipticity of MW satellitesMartin, de Jong & Rix (2008)
Friday, April 13, 12
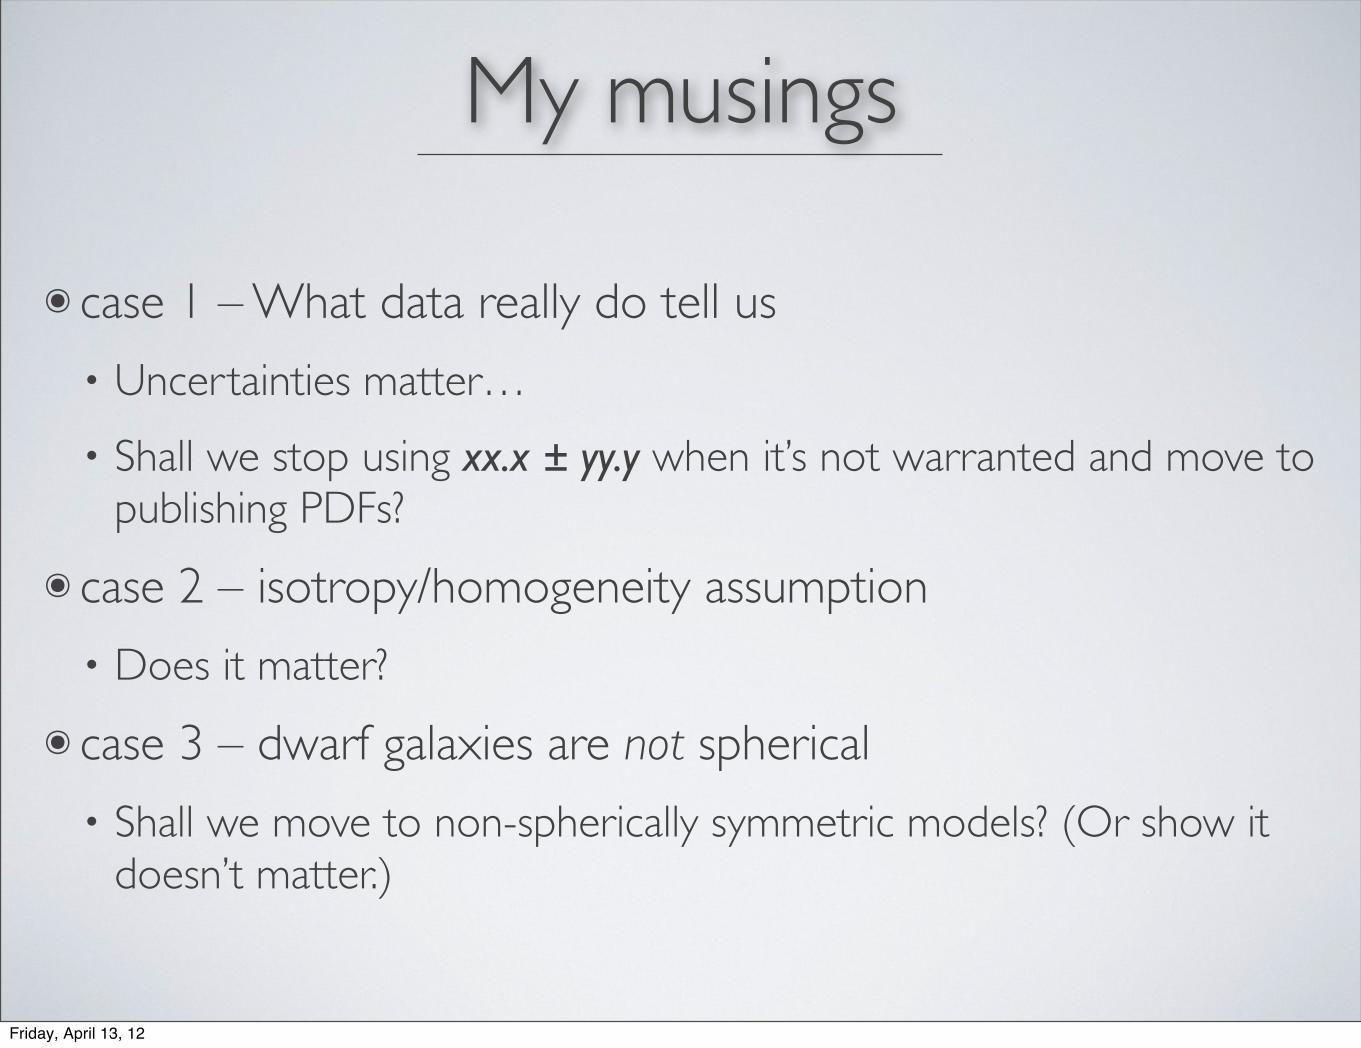
My musings
๏ case 1 – What data really do tell us
• Uncertainties matter…
• Shall we stop using xx.x ± yy.y when it’s not warranted and move to publishing PDFs?
๏ case 2 – isotropy/homogeneity assumption
• Does it matter?
๏ case 3 – dwarf galaxies are not spherical
• Shall we move to non-spherically symmetric models? (Or show it doesn’t matter.)
Friday, April 13, 12