better work discussion paper series: no. 17users.nber.org/~rdehejia/papers/dp 17 web.pdfbetter work...
TRANSCRIPT

Better Work Discussion Paper Series: No. 17
Are Sweatshops Profit-Maximizing? Answer: No. Evidence from Better Work VietnamAuthors: Drusilla Brown/ Tufts UniversityRajeev Dehejia/ New York University Raymond Robertson/ Macalester CollegeGeorge Domat/ Tufts UniversitySelven Veeraragoo/ Tufts University
March 2015

i
DISCUSSION PAPER NO. 17
ARE SWEATSHOPS PROFIT-MAXIMIZING?
ANSWER: NO. EVIDENCE FROM BETTER WORK VIETNAM
Drusilla Brown Rajeev Dehejia Raymond Robertson George Domat New York University Macalester College Selven Veeraragoo Tufts University
March 2015

ii
Copyright © International Labour Organization (ILO) and International Finance Corporation (IFC) 2015
First published 2015
Publications of the ILO enjoy copyright under Protocol 2 of the Universal Copyright Convention. Nevertheless, short excerpts from them may be reproduced without authorization, on condition that the source is indicated. For rights of reproduction or translation, application should be made to the ILO, acting on behalf of both organizations: ILO Publications (Rights and Permissions), International Labour Office, CH-1211 Geneva 22, Switzerland, or by email: [email protected]. The IFC and ILO welcome such applications.
Libraries, institutions and other users registered with reproduction rights organizations may make copies in accordance with the licences issued to them for this purpose. Visit www.ifrro.org to find the reproduction rights organization in your country.
ILO Cataloguing in Publication Data Brown, Drusilla; Domat, George; Veeraragoo, Selven; Dehejia, Rajeev; Robertson, Raymond Are sweatshops profit-maximizing? : Answer: No. Evidence from Better Work Vietnam / Drusilla Brown, George Domat, Selven Veeraragoo, Rajeev Dehejia, Raymond Robertson ; International Labour Office. - Geneva: ILO, 2015 (Better Work discussion paper) International Labour Office clothing industry / clothing worker / factory / working conditions / personnel management / cost benefit analysis / profitability / Viet Nam 08.09.3
The designations employed in this, which are in conformity with United Nations practice, and the presentation of material therein do not imply the expression of any opinion whatsoever on the part of the IFC or ILO concerning the legal status of any country, area or territory or of its authorities, or concerning the delimitation of its frontiers.
The responsibility for opinions expressed in signed articles, studies and other contributions rests solely with their authors, and publication does not constitute an endorsement by the IFC or ILO of the opinions expressed in them.
Reference to names of firms and commercial products and processes does not imply their endorsement by the IFC or ILO, and any failure to mention a particular firm, commercial product or process is not a sign of disapproval.
ILO publications can be obtained through major booksellers or ILO local offices in many countries, or direct from ILO Publications, International Labour Office, CH-1211 Geneva 22, Switzerland. Catalogues or lists of new publications are available free of charge from the above address, or by email: [email protected]
Visit our website: www.ilo.org/publns
Cover photo:© ILO/IFC
Printed by ILO
iii
ABSTRACT Estimating a translog profit function for Vietnamese apparel factories, we jointly test for managerial
quality heterogeneity and whether higher quality managers choose more humane working conditions
and earn higher profits. Working conditions are measured from the perspective of workers, based on a
survey of working conditions, the perspective of management, based on a survey of HR managers, and
compliance assessments of Better Work Vietnam. Given the limited number of observations of factory
level financial data, factor analysis is used to reduce the number of working conditions variables to three
factors. Working conditions measured from the perspective of workers is positively correlated with the
ratio of revenue to total cost. The elasticity of the price-cost margin with respect to each of the three
working conditions factors is positive and statistically significant. When working conditions are
measured from the perspective of compliance assessments, two of the three factors positively predict
the profit margin. However, when conditions are measured from the perspective of the HR manager,
only one of the factors positively predicts firm profits. The findings are consistent with the hypothesis
that attempted improvements in working conditions increase the profit margin only to the extent that
those improvements are perceived by employees of the firm.
We then turn to understand the determinants of the positive relationship between profits and
compliance. Compliance predicts higher work effort as measured by time to production target.
Compliant firms also pay higher wages. However, the relationship between compliance and supply
chain position is undetermined. Some working conditions predict higher supply chain position while
others predict lower supply chain position.

iv
TABLE OF CONTENTS Abstract ........................................................................................................................................................ iii
1. Introduction .............................................................................................................................................. 1
2. Theoretical Model ..................................................................................................................................... 4
Wages, Productivity and Supply Chain Position ....................................................................................... 9
3. Data ......................................................................................................................................................... 10
Coding the Worker and Manager Data ................................................................................................... 11
Missing Data ............................................................................................................................................ 12
Heuristic Aggregate Construction ........................................................................................................... 12
Principal Component Analysis ................................................................................................................ 13
Estimation of the Profit Function ............................................................................................................ 15
4. Empirical Results ..................................................................................................................................... 20
5. Conclusion and Directions for Future Research ...................................................................................... 30
References .................................................................................................................................................. 32
Appendix ..................................................................................................................................................... 33

1
1. INTRODUCTION Harsh conditions of work in the early stages of industrialization have generated a long-running debate
concerning the social value of workplaces commonly referred to as ‘sweatshops.’ Proponents argue that
harsh conditions of work in developing country firms are the inevitable consequence of the fine division
of labor common in the early stages of industrialization and worker preferences over the tradeoff
between pecuniary and nonpecuniary compensation.1 In contrast, Sable et al. (2000) argue that
sweatshops are the product of deficient managerial capital common in developing countries. Factory
managers, who lack knowledge of human resource management innovations that emphasize positive
motivational techniques such as incentive pay, may resort to verbal and physical abuse to elicit work
effort.
Indeed, Melitz (2003) and Verhoogen (2008) attribute differences in firm performance to cross
firm heterogeneity in the skill set of managers. Direct evidence is provided by Bloom et al. (2012) that
factory managers in developing countries lack managerial capital that can impact productivity. Based on
experimental evidence from textile firms in Delhi, a deficit in managerial capital related to the most
basic organizational tasks such as inventory management was found to lower firm profits.
However, in the management of labor, innovations that increase productivity do not necessarily
translate into increased profits. Harsh treatment of workers, particularly young women of limited
literacy and market experience, may allow a firm to set compensation below the marginal value product
of labor, thereby extracting monopsonistic rents (Freeman and Kleiner, 2005). As a consequence, there
is a potential tradeoff between the efficiency benefits that arise when a factory manager employs high
powered pay incentives and the loss of monopsonistic rents when a firm eliminates negative,
nonpecuniary motivational techniques characteristic of sweatshops. That is, factory managers who
1 For example, Sachs (2005).

2
clearly link compensation and work effort undermine attempts to extract monopsony rents through the
use of abuse and deceptive pay practices.
The positive impact of high powered pay incentives on productivity is well documented.
Bandiera et al. (2007) use an experimental methodology to investigate the impact of a switch to
managerial performance pay on labor force quality and productivity in a fruit farm in the United
Kingdom. The authors report that the introduction of managerial performance pay led to a 21 percent
increase in average productivity of the pickers and to a 38 percent increase in the cross-worker
dispersion of productivity.
A positive productivity impact of a broader array of HR innovations including incentive pay,
multi-dimensional pay, teamwork, communication and problem-solving have also been found to
increase productivity and profits. Ichniowski et al. (1995), using an empirical technique they call Insider
Econometrics, examine the effect that introducing HR innovations had on productivity and profitability
in the US steel industry. Production lines that adopted the most innovative and cooperative HR
practices experienced a seven percent increase in productivity as compared to lines that adopted the
least innovative and uncooperative practices. Moreover, the authors estimate that a one percent
increase in productivity leads to a $27,900 increase in profits.
Evidence for a positive connection between incentive pay and productivity, based on an
experimental approach provided by Bandiera et al. (2007), is generally considered definitive. However
the use of Insider Econometrics by Ichniowski et al. (1996) to identify a link from HR innovations to
profitability has been challenged. An increase in productivity may be accompanied by a decrease in
profits when the monopsony losses are larger than the efficiency gains of closely linking pay and work
effort.
Harrison and Scorse (2010) find a significant increase in wage and employment for foreign-
owned exporting apparel, textile and footwear firms in Indonesia as a result of an anti-sweatshop
3
campaign and increases in the statutory minimum wage between 1992 and 1996. However, profits of
firms differentially impacted by the minimum wage legislation and anti-sweatshop agitation declined.
The combination of a rise in employment and a decline in firm profits following an increase in the
minimum wage is a critical indicator of the presence of monopsonistic exploitation. Similarly, Freeman
and Kleiner (2005) report that productivity in a US shoe factory fell by six percent while profitability
increased by 25 percent as a result of a switch from piece rate to hourly rate.
Using a novel data set to estimate a profit function, we test three hypotheses central to the
question of the profitability of labor management innovations in developing country firms. Analyzing
data on labor management practices and performance of Vietnamese apparel firms, we jointly test for
(1) the presence of cross-firm HR managerial heterogeneity and (2) the conjecture that firms with
inferior managerial capital engage in harsher labor management practices and deceptive pay practices.
Evidence that sweatshop-like conditions are the consequence of a deficit in labor management capital is
provided if firms that choose harsh and deceptive labor management practices are also less profitable.
We then turn to isolate the causal link between working conditions and profits by analyzing the
contribution of labor practices to productivity, wages and supply chain position.
The data used in this analysis is based on factory manager and workers surveys on HR systems,
working conditions and firm performance undertaken by Better Work Vietnam between January 2010
and December 2013. The empirical results provide evidence of cross-firm heterogeneity in managerial
quality and that higher quality managers choose more humane labor management practices and
manage more profitable firms.
The theoretical foundation for the empirical analysis is presented in Section 2. The data is
described in Section 3 and results are presented in Section 4. Conclusions and directions for further
research are detailed in Section 5.

4
2. THEORETICAL MODEL We begin with a simple model of firm behavior as it relates to the choice of HR system. Firms are
assumed to be price-takers in the goods market. However, they may have some market power in the
factors markets. The firm, then, maximizes profits:
[ ] ZPZgWZgepf Z−−=∏ ))(())(( (1)
where
Z is the vector of the firm’s actions relating to the choice of HR system,
g is the transmission function relating the firm’s actions to improve working conditions as perceived by
the workers,
e is labor force work effort,
f is an unknown production function
W is wage bill for the firm and
ZPZ is the total cost of implementing working conditions Z.
Each working condition action Z is taken to be either pecuniary or nonpecuniary. If the action is
pecuniary, Z increases the wage bill, implying that W’ > 0, but is costless for the firm to implement,
implying that ZP = 0. For example, clarifying the relationship between work effort and compensation
may limit the deceptive pay practices in which the firm can engage. Thus, the firm’s wage bill increases,
implying that W’ is positive.
Alternatively, an action Z may involve providing a non-pecuniary benefit such as a workplace
amenity. In such cases, workers may accept a lower wage but the factory must incur cost ZP Z > 0 to
provide the amenity. As a consequence, the wage bill may shrink but firm expenditure on amenities
may increase, implying that W’ < 0 and ZPZ > 0.
As usual, f’ > 0. The production function is increasing in labor force effort. Labor force effort
itself increases with improved working conditions, implying that e’ > 0. However, an employee’s
5
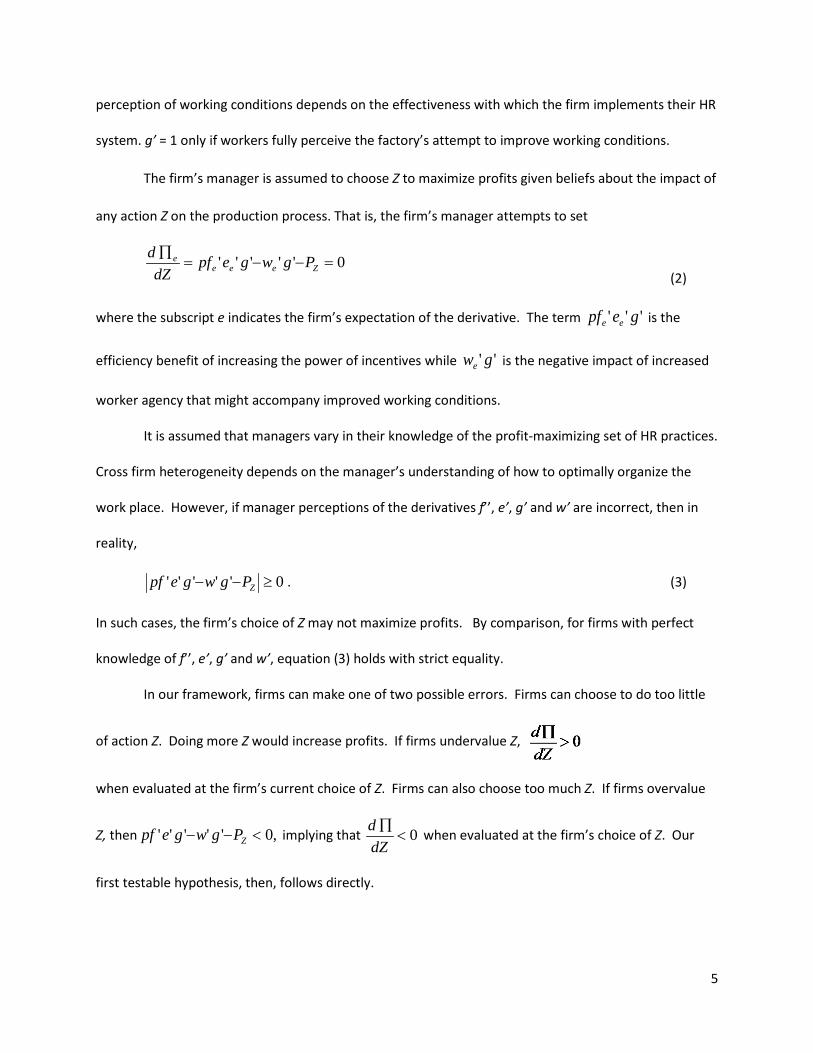
perception of working conditions depends on the effectiveness with which the firm implements their HR
system. g’ = 1 only if workers fully perceive the factory’s attempt to improve working conditions.
The firm’s manager is assumed to choose Z to maximize profits given beliefs about the impact of
any action Z on the production process. That is, the firm’s manager attempts to set
0''''' =−−=∏
Zeeee Pgwgepf
dZd
(2)
where the subscript e indicates the firm’s expectation of the derivative. The term ''' gepf ee is the
efficiency benefit of increasing the power of incentives while '' gwe is the negative impact of increased
worker agency that might accompany improved working conditions.
It is assumed that managers vary in their knowledge of the profit-maximizing set of HR practices.
Cross firm heterogeneity depends on the manager’s understanding of how to optimally organize the
work place. However, if manager perceptions of the derivatives f’’, e’, g’ and w’ are incorrect, then in
reality,
0''''' ≥−− ZPgwgepf . (3)
In such cases, the firm’s choice of Z may not maximize profits. By comparison, for firms with perfect
knowledge of f’’, e’, g’ and w’, equation (3) holds with strict equality.
In our framework, firms can make one of two possible errors. Firms can choose to do too little
of action Z. Doing more Z would increase profits. If firms undervalue Z,
when evaluated at the firm’s current choice of Z. Firms can also choose too much Z. If firms overvalue
Z, then ,0''''' <−− ZPgwgepf implying that 0<∏
dZd
when evaluated at the firm’s choice of Z. Our
first testable hypothesis, then, follows directly.
6
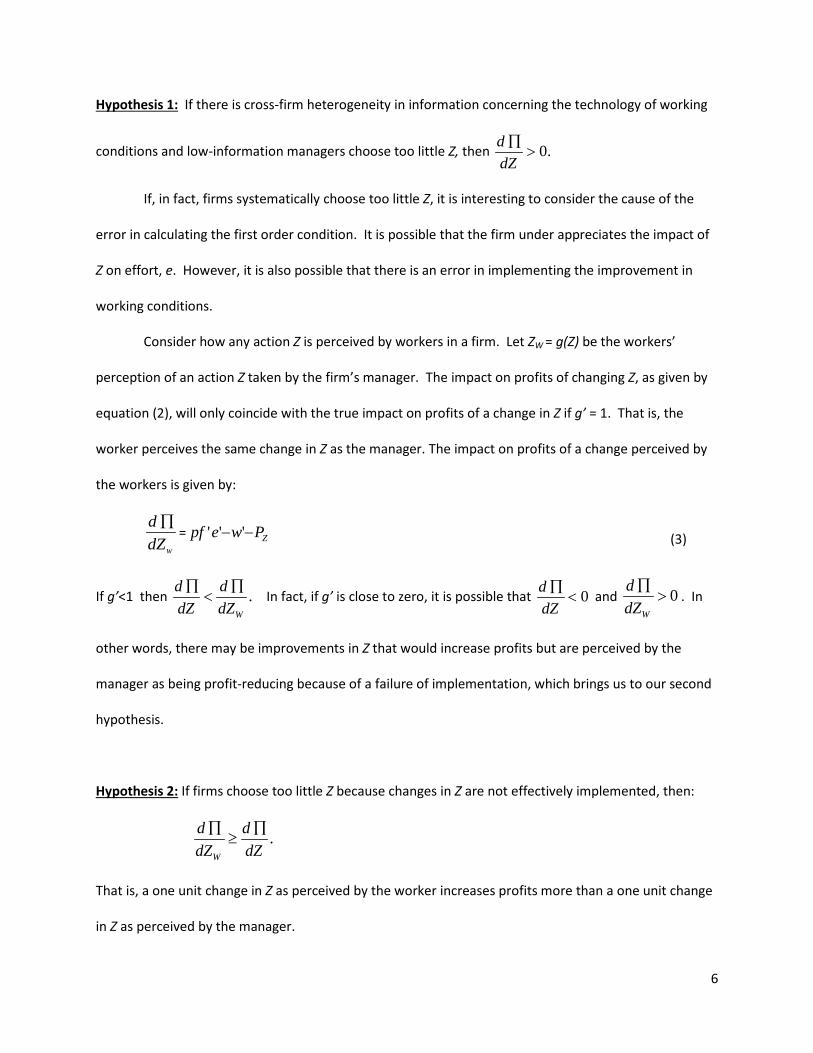
Hypothesis 1: If there is cross-firm heterogeneity in information concerning the technology of working
conditions and low-information managers choose too little Z, then .0>∏
dZd
If, in fact, firms systematically choose too little Z, it is interesting to consider the cause of the
error in calculating the first order condition. It is possible that the firm under appreciates the impact of
Z on effort, e. However, it is also possible that there is an error in implementing the improvement in
working conditions.
Consider how any action Z is perceived by workers in a firm. Let ZW = g(Z) be the workers’
perception of an action Z taken by the firm’s manager. The impact on profits of changing Z, as given by
equation (2), will only coincide with the true impact on profits of a change in Z if g’ = 1. That is, the
worker perceives the same change in Z as the manager. The impact on profits of a change perceived by
the workers is given by:
WdZd ∏
= ZPwepf −− ''' (3)
If g’<1 then .WdZ
ddZd ∏
<∏
In fact, if g’ is close to zero, it is possible that 0<∏
dZd
and 0>∏
WdZd
. In
other words, there may be improvements in Z that would increase profits but are perceived by the
manager as being profit-reducing because of a failure of implementation, which brings us to our second
hypothesis.
Hypothesis 2: If firms choose too little Z because changes in Z are not effectively implemented, then:
.dZd
dZd
W
∏≥
∏
That is, a one unit change in Z as perceived by the worker increases profits more than a one unit change
in Z as perceived by the manager.
7
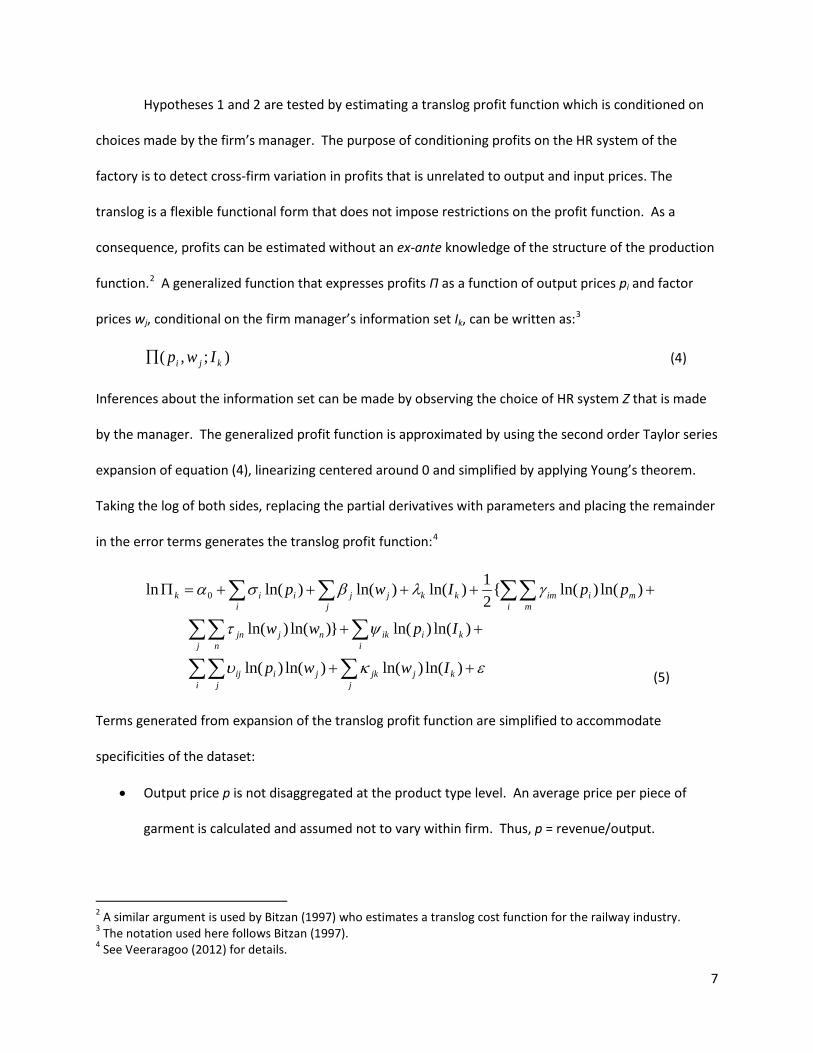
Hypotheses 1 and 2 are tested by estimating a translog profit function which is conditioned on
choices made by the firm’s manager. The purpose of conditioning profits on the HR system of the
factory is to detect cross-firm variation in profits that is unrelated to output and input prices. The
translog is a flexible functional form that does not impose restrictions on the profit function. As a
consequence, profits can be estimated without an ex-ante knowledge of the structure of the production
function.2 A generalized function that expresses profits Π as a function of output prices pi and factor
prices wj, conditional on the firm manager’s information set Ik, can be written as:3
);,( kji Iwp∏ (4)
Inferences about the information set can be made by observing the choice of HR system Z that is made
by the manager. The generalized profit function is approximated by using the second order Taylor series
expansion of equation (4), linearizing centered around 0 and simplified by applying Young’s theorem.
Taking the log of both sides, replacing the partial derivatives with parameters and placing the remainder
in the error terms generates the translog profit function:4
εκυ
ψτ
γλβσα
++
++
+++++=Π
∑∑∑
∑∑∑
∑∑∑∑
)ln()ln()ln()ln(
)ln()ln(})ln()ln(
)ln()ln({21)ln()ln()ln(ln 0
kjj
jki
jij
ij
kii
ikj
njn
jn
imi
mimkkj
jji
iik
Iwwp
Ipww
ppIwp
Terms generated from expansion of the translog profit function are simplified to accommodate
specificities of the dataset:
• Output price p is not disaggregated at the product type level. An average price per piece of
garment is calculated and assumed not to vary within firm. Thus, p = revenue/output.
2 A similar argument is used by Bitzan (1997) who estimates a translog cost function for the railway industry. 3 The notation used here follows Bitzan (1997). 4 See Veeraragoo (2012) for details.
(5)

8
• Wages vary across employee positions but this is not reflected in the regression equations as the
objective of this research is to determine whether exploitation of workers, regardless of their
position within the firm, is profitable.
Hence, the regression equation is of the form:
εµυψ
τγλβσα
+++++
+++++=∏
XwwpIp
wpIwp
kkk
kkk
)ln()ln()ln()ln()ln(
)][ln(21)][ln(
21)ln()ln()ln(ln 22
0
where X is a vector of firm controls including the type of product being manufactured, the reputation
sensitivity of firm’s customer, the position of the firm along the supply chain and a measure of
economies of scale.
The choice of human resource management system Z is the realization of the information set Ik
of the firm’s manager. Z is measured along n dimensions, Z1 – Zn. The manner in which workers
perceive the actions of the firm’s manager is captured by the variables ZW1 to ZWn. Estimating the
information set I by the HR variables, equation (6) then becomes:
ευ
µψφ
τγλβσα
++
++++
++++++=∏
∑ ∑
∑
= =
=
Xwp
wZZpZZ
wpZwp
iiiijiij
n
i
n
j
ii
n
i
)]ln()ln(
)ln()ln()ln()ln()]ln()ln([[21
)][ln(21)][ln(
21)ln()ln()ln(ln
1 1
22
10
The hypotheses are tested for each of the three HR components. The linear combination of parameters
which makes up Hypothesis 1 for HR1 is presented below. This can easily be extended to HR2 and HR3:
0)ln()ln()]ln(..)ln([21
0:1
1112121
1
>+++++⇒
>∏
wpZZ
dZdHypothesis
nn µψφφλ
where the overbar on variables Z, p and w indicates that the mean value of those variables is used in the
hypothesis test.
(6)
(7)
9
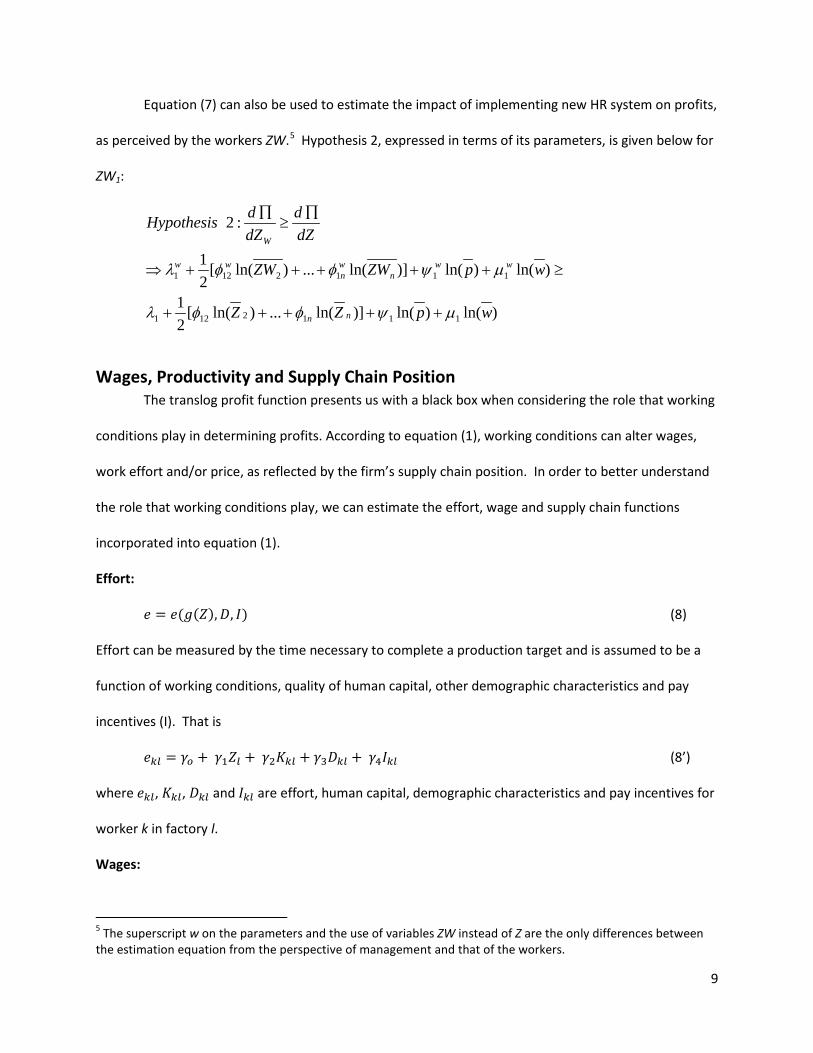
Equation (7) can also be used to estimate the impact of implementing new HR system on profits,
as perceived by the workers ZW.5 Hypothesis 2, expressed in terms of its parameters, is given below for
ZW1:
)ln()ln()]ln(...)ln([21
)ln()ln()]ln(...)ln([21
:2
1112121
1112121
wpZZ
wpZWZW
dZd
dZdHypothesis
nn
wwn
wn
ww
W
µψφφλ
µψφφλ
+++++
≥+++++⇒
∏≥
∏
Wages, Productivity and Supply Chain Position The translog profit function presents us with a black box when considering the role that working
conditions play in determining profits. According to equation (1), working conditions can alter wages,
work effort and/or price, as reflected by the firm’s supply chain position. In order to better understand
the role that working conditions play, we can estimate the effort, wage and supply chain functions
incorporated into equation (1).
Effort:
𝑒 = 𝑒(𝑔(𝑍),𝐷, 𝐼) (8)
Effort can be measured by the time necessary to complete a production target and is assumed to be a
function of working conditions, quality of human capital, other demographic characteristics and pay
incentives (I). That is
𝑒𝑘𝑙 = 𝛾𝑜 + 𝛾1𝑍𝑙 + 𝛾2𝐾𝑘𝑙 + 𝛾3𝐷𝑘𝑙 + 𝛾4𝐼𝑘𝑙 (8’)
where 𝑒𝑘𝑙, 𝐾𝑘𝑙, 𝐷𝑘𝑙 and 𝐼𝑘𝑙 are effort, human capital, demographic characteristics and pay incentives for
worker k in factory l.
Wages:
5 The superscript w on the parameters and the use of variables ZW instead of Z are the only differences between the estimation equation from the perspective of management and that of the workers.

10
𝑊 =w(g(Z), H,K,D) (9)
Similarly, weekly pay can be taken as a function of work hours, capital and demographic characteristics,
yielding
𝑊𝑘𝑙 = 𝛿𝑜 + 𝛿1𝑍𝑙 + 𝛿2𝐾𝑘𝑙 + 𝛿3𝐷𝑘𝑙 + 𝛿4𝐻𝑘𝑙 (9’)
Supply chain position:
𝑃𝑍 = 𝑃(𝑍, 𝑒,𝐷) (10)
Supply chain position is a function of working conditions, productivity and human capital which can be
estimated as
𝑃𝑙 = 𝜌𝑜 + 𝜌1𝑍𝑙 + 𝜌2𝑒𝑙 + 𝜌3𝐷𝑙 (10’)
3. DATA When a factory enters the Better Work Program, Better Work Enterprise Advisors visit the
factory to collect information about the factory’s compliance with labor standards and working
conditions before implementing any other program elements or training. At some point after
enrollment, an independent research team visits the factory from Better Work’s impact evaluation
program. The data used in the analysis below were collected during compliance assessments and the
independent worker and manager surveys undertaken in Vietnamese apparel factories from January
2010 to December 2013.
More than 5100 workers were surveyed at over 185 factories. In each factory, 30 randomly
selected workers and four factory managers undertake a self-interview via computer program using a PC
tablet.
The population surveyed is not a random sample of workers in the Vietnamese apparel industry.
Firm enrollment in Better Work Vietnam is voluntary and workers who are randomly selected have the
option to refuse to participate. Limiting analysis to a self-selected group of apparel factories focuses

11
specifically on those factories that are attempting to achieve a competitive advantage by developing a
record of compliant behavior.
The worker survey asks questions about worker demographics including information about
households and family composition, health, compensation, benefits, training, working conditions,
workplace concerns, mental wellbeing and life satisfaction. The human resource manager survey asks
questions about the factory’s human resource practices including hiring, compensation and training.
This survey also asks about the manager’s perception of workers concerns with factory conditions and
practices.
Coding the Worker and Manager Data All responses to questions for the worker and manager surveys were fitted to a scale that ranges
from 0 to 1. This process differed slightly for each question depending on the type of question. However
for all questions, answers nearer to 1 reflect a more desirable working condition.
There are four different types of questions on the surveys: binary yes or no questions, multiple
choice questions with mutually exclusive answers, questions where the participant is prompted to check
all that apply, and finally open ended questions. Each of these was coded as follows:
Yes/No questions. The more desirable response was coded as a 1 and the other as a 0.
Multiple Choice questions. Responses were first ordered from least desirable to most desirable and then
divided by the number of possible responses. Note this category includes all questions pertaining to
concerns despite the fact that they were “chose all that apply.” The reason is that the possible
responses could still be rated from least severe to most severe and thus the most severe response given
is the most relevant.
Multiple Response questions. The number of responses selected by the participant was divided by the
total number of possible responses. The score was then subtracted from 1 if the responses were
negative aspects of working conditions.

12
Open Ended questions. These questions solely dealt with wages, and hence each worker’s reported
wage was divided by the highest paid worker’s wages.
Missing Data Missing data is an issue since workers may either not know the answer or not want to answer one or
more questions. Missing data is addressed through multiple imputation by chained equations (MICE)
with regression. The procedure involves imputing the data several times in order to create several
complete data sets. The analysis is repeated on each data set and the results are averaged.6
Heuristic Aggregate Construction Working conditions aggregates are constructed from individual questions on the worker and manager
surveys and the Assessment tool. Heuristic categories of questions were derived from the preexisting
cluster and sub-cluster delineations in the Enterprise Assessment tool. Categories and their compliance
points are detailed in the Appendix.
Compliance data are stratified into 8 clusters that are further divided into 38 sub-clusters. All of
the compliance questions are simple yes/no questions; hence the compliance score is the mean of all
the questions that belonged to a specific sub-cluster. The mean of all the sub-clusters within a cluster
are calculated to obtain that cluster’s score. Sub-cluster means were excluded due to missing data or
zero variance across all factories. For example, there was little data with variance among the child labor
sub-clusters; hence only the broad cluster of child labor was included when performing the analysis on
the sub-clusters.
The sub-clusters identified by Better Work were used as a guideline for creating the heuristic
aggregates from the worker and manager surveys. Questions on the worker and manager surveys were
matched to the various sub-clusters and compliance questions within them. Then, as with the
6 For more information about multiple imputation see Azur (2011) for an intuitive explanation and Rubin (1996) for a more rigorous explanation.
13
compliance aggregates, the mean of the questions that belonged within and aggregate was taken to be
the score for that aggregate.
This procedure yielded 21 aggregates from the worker survey and 16 aggregates for the
managers. Note that there are fewer aggregates for the worker and manager surveys than the
compliance data. The reason is that there are several points that are covered on the compliance data
that are not covered in the surveys. These include issues related to child labor, paid leave, and
contracting procedures.
Control variables include worker demographics and an index controlling for the size of the
factory. The index controlling for the size of the factory is composed of questions pertaining to how
many full time and part time workers are in a factory.
Principal Component Analysis Assessing working conditions based on the heuristic indexes provides an indication of the impact of
individual working conditions on firm performance. However, given the limit on the sample size, it is
necessary to further aggregate working conditions before estimating the profit function. Principal
components analysis is typically used to identify underlying factors.
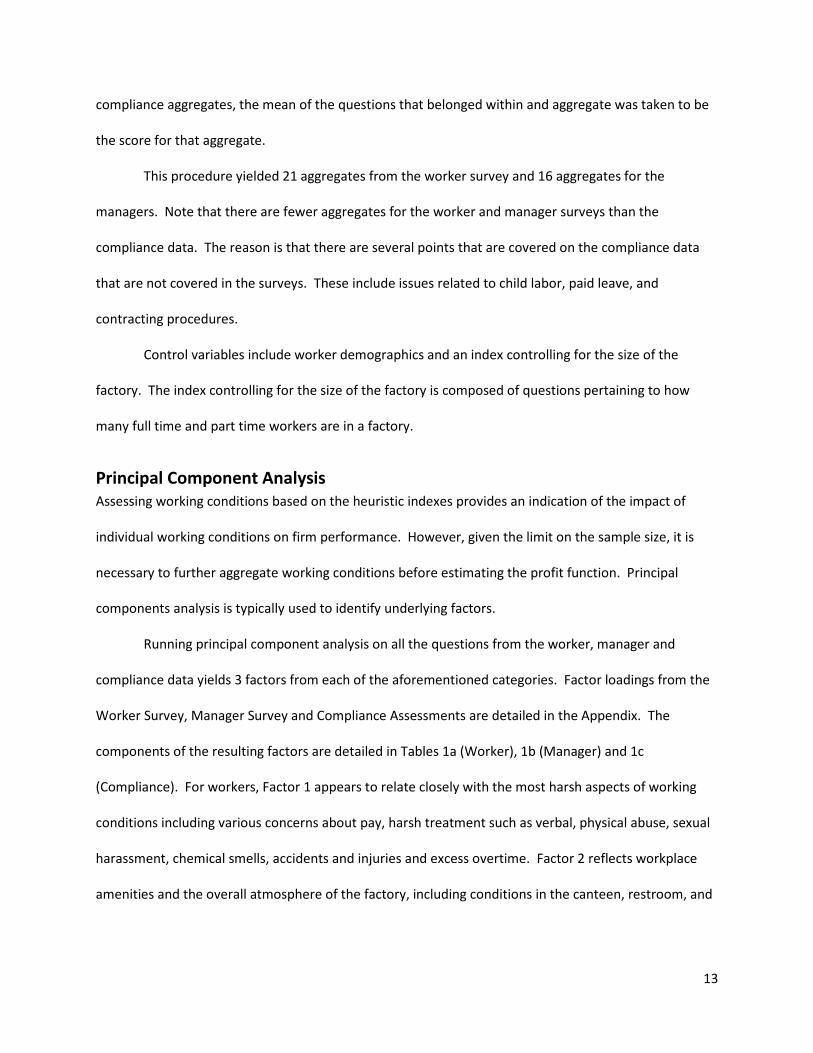
Running principal component analysis on all the questions from the worker, manager and
compliance data yields 3 factors from each of the aforementioned categories. Factor loadings from the
Worker Survey, Manager Survey and Compliance Assessments are detailed in the Appendix. The
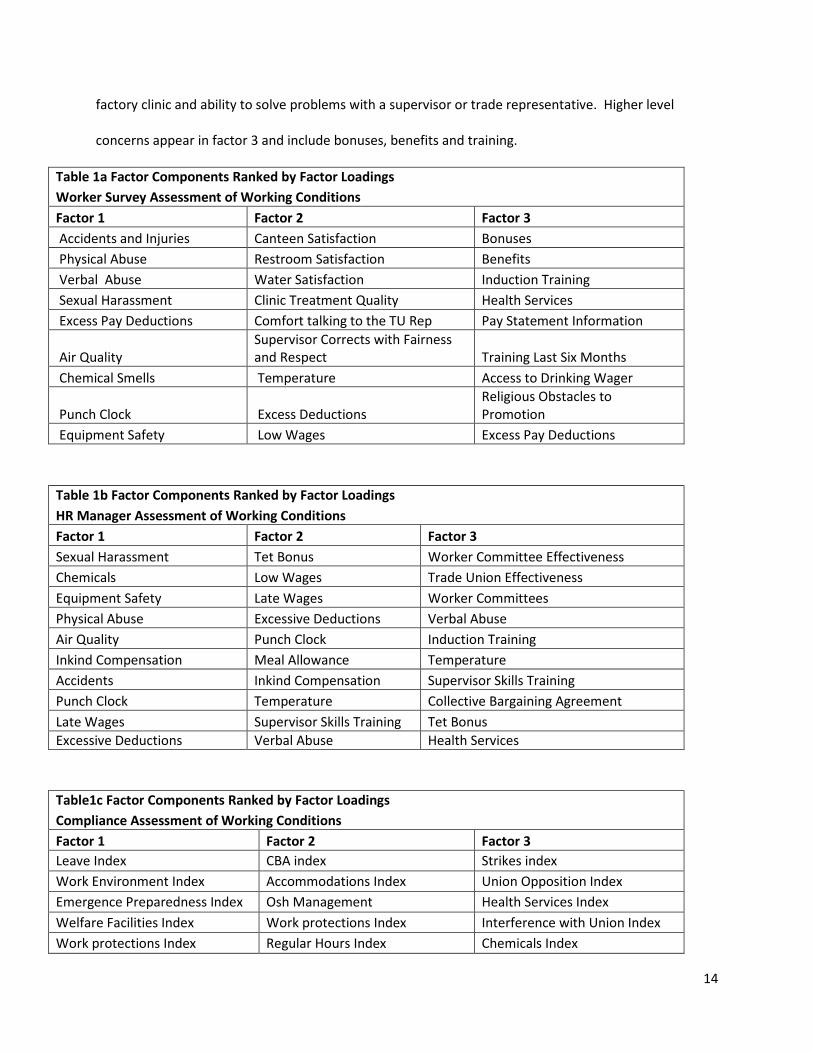
components of the resulting factors are detailed in Tables 1a (Worker), 1b (Manager) and 1c
(Compliance). For workers, Factor 1 appears to relate closely with the most harsh aspects of working
conditions including various concerns about pay, harsh treatment such as verbal, physical abuse, sexual
harassment, chemical smells, accidents and injuries and excess overtime. Factor 2 reflects workplace
amenities and the overall atmosphere of the factory, including conditions in the canteen, restroom, and
14
factory clinic and ability to solve problems with a supervisor or trade representative. Higher level
concerns appear in factor 3 and include bonuses, benefits and training.
Table 1a Factor Components Ranked by Factor Loadings Worker Survey Assessment of Working Conditions Factor 1 Factor 2 Factor 3 Accidents and Injuries Canteen Satisfaction Bonuses Physical Abuse Restroom Satisfaction Benefits Verbal Abuse Water Satisfaction Induction Training Sexual Harassment Clinic Treatment Quality Health Services Excess Pay Deductions Comfort talking to the TU Rep Pay Statement Information
Air Quality Supervisor Corrects with Fairness and Respect Training Last Six Months
Chemical Smells Temperature Access to Drinking Wager
Punch Clock Excess Deductions Religious Obstacles to Promotion
Equipment Safety Low Wages Excess Pay Deductions
Table 1b Factor Components Ranked by Factor Loadings HR Manager Assessment of Working Conditions Factor 1 Factor 2 Factor 3 Sexual Harassment Tet Bonus Worker Committee Effectiveness Chemicals Low Wages Trade Union Effectiveness Equipment Safety Late Wages Worker Committees Physical Abuse Excessive Deductions Verbal Abuse Air Quality Punch Clock Induction Training Inkind Compensation Meal Allowance Temperature Accidents Inkind Compensation Supervisor Skills Training Punch Clock Temperature Collective Bargaining Agreement Late Wages Supervisor Skills Training Tet Bonus Excessive Deductions Verbal Abuse Health Services
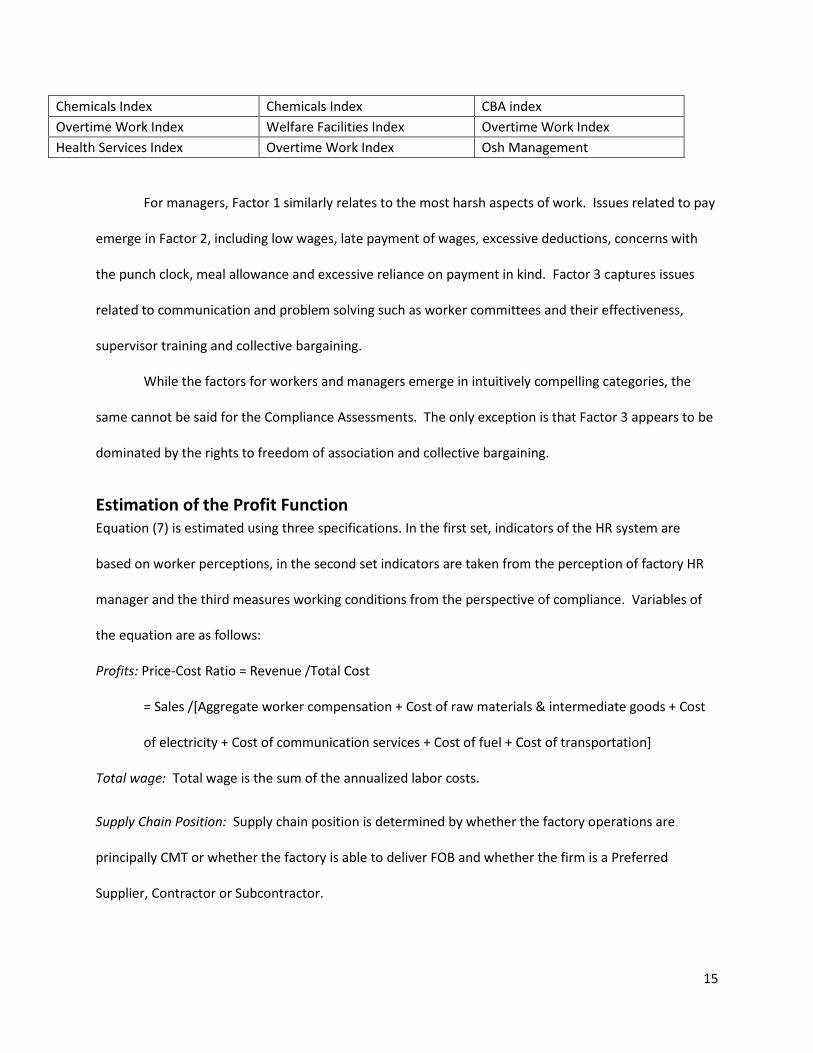
Table1c Factor Components Ranked by Factor Loadings Compliance Assessment of Working Conditions Factor 1 Factor 2 Factor 3 Leave Index CBA index Strikes index Work Environment Index Accommodations Index Union Opposition Index Emergence Preparedness Index Osh Management Health Services Index Welfare Facilities Index Work protections Index Interference with Union Index Work protections Index Regular Hours Index Chemicals Index
15
Chemicals Index Chemicals Index CBA index Overtime Work Index Welfare Facilities Index Overtime Work Index Health Services Index Overtime Work Index Osh Management
For managers, Factor 1 similarly relates to the most harsh aspects of work. Issues related to pay
emerge in Factor 2, including low wages, late payment of wages, excessive deductions, concerns with
the punch clock, meal allowance and excessive reliance on payment in kind. Factor 3 captures issues
related to communication and problem solving such as worker committees and their effectiveness,
supervisor training and collective bargaining.
While the factors for workers and managers emerge in intuitively compelling categories, the
same cannot be said for the Compliance Assessments. The only exception is that Factor 3 appears to be
dominated by the rights to freedom of association and collective bargaining.
Estimation of the Profit Function Equation (7) is estimated using three specifications. In the first set, indicators of the HR system are
based on worker perceptions, in the second set indicators are taken from the perception of factory HR
manager and the third measures working conditions from the perspective of compliance. Variables of
the equation are as follows:
Profits: Price-Cost Ratio = Revenue /Total Cost
= Sales /[Aggregate worker compensation + Cost of raw materials & intermediate goods + Cost
of electricity + Cost of communication services + Cost of fuel + Cost of transportation]
Total wage: Total wage is the sum of the annualized labor costs.
Supply Chain Position: Supply chain position is determined by whether the factory operations are
principally CMT or whether the factory is able to deliver FOB and whether the firm is a Preferred
Supplier, Contractor or Subcontractor.
16
Estimation of the Effort Equation. From the work survey, participants are asked to report their
typical work start and stop times each day and the time they typically finish their production target on
Monday, Friday, Saturday and Sunday. Time to complete the production target, after controlling for the
length of the work day, is taken as our measure of work effort. In addition to working conditions, we
also include work incentives, including whether the worker is paid by the hour, the piece or some
combination and whether the worker receives a productivity or annual bonus.
Estimation of the Wage Equation. From the worker survey, participants are asked to report
their last pay amount in VND, how often they are paid and the hours they worked for each day in the
past week. Pay amounts are first adjusted for the length of the pay period and then converted to U.S.
dollars. The dependent variable is taken to be log of total pay, 𝑇𝑃𝑘𝑙, and weekly hours, 𝐻𝑘𝑙, is added as
a regressor.
Adjustments are made for clear data entry errors, as in cases in which the participant entered
pay values in terms of thousands or millions. Observations are also dropped for participants who report
not being paid regularly.
Demographic and factory characteristics include, gender, age, education, employment duration,
times promoted, skills training and number of nearby competitors. Workers are asked whether they
received basic skills training when they first started working in this factory. Additional controls include
contract type (training, subcontract, fixed-term and open-ended) and factory position.
The Supply Position Equation. The supply chain position is indicated by whether a factory’s
relationship with its most important customer is as a preferred supplier, contractor or subcontractor
and whether the firm produced FOB as an alternative to or in addition to CMT. Supply chain position is
estimated as a probit with factory size, worker effort, wages and working conditions as explanatory
variables.

17
Dependent variables are described in Table 2a with summary statistics provided in Table 2b.
Independent variables are described in Table 3a with summary statistics in Table 3b.
Table 2b: Dependent Variables Summary Statistics Variable Obs Mean Std. Dev. Min Max Weekly Pay USD 1405 48.35938 52.97944 0 1142.857 Time to Target Friday 1428 10.09482 1.479006 6 19 FOB 1399 0.407434 0.491533 0 1 CMT 1399 0.91351 0.281187 0 1 Preferred Supplier 1428 0.462885 0.498795 0 1
Table 2a: Dependent Variables Variable Definition Variable Type Code Effort What time do you complete your
production target on Monday/Friday/Saturday/Sunday What time do you usually start work on Monday/Friday/Saturday/Sunday Limited to workers who have a daily production quota, start work before 12:00 p.m. and complete their target after 12:00 p.m.
Real Hours
logHourlyPayUSD logWeeklyPayUSD
How often are you paid? How much did money did you receive the last time you were paid?
Real USD
Average Hourly Wage (Employee Compensation + Contributions)/Employment
Real USD
Supply Chain Position How would you characterize your business relationship with your most important customer?
Categorical Relationship1
1= Sub-contractor 2=Contractor 3= Preferred Supplier
Binary prefsup
1=Preferred Supplier 0=Contractor or Subcontractor
What production activities occur in this factory?
Binary FOB
1=FOB 0=CMT
How would you characterize your business relationship with your second most important customer?
Categorical Relationship2
1= Sub-contractor 2=Contractor 3= Preferred Supplier
Total Sales FOB CMT
Real FOB/(FOB+CMT)
18
Contractor 1428 0.328431 0.469807 0 1 Subcontractor 1428 0.152661 0.359787 0 1
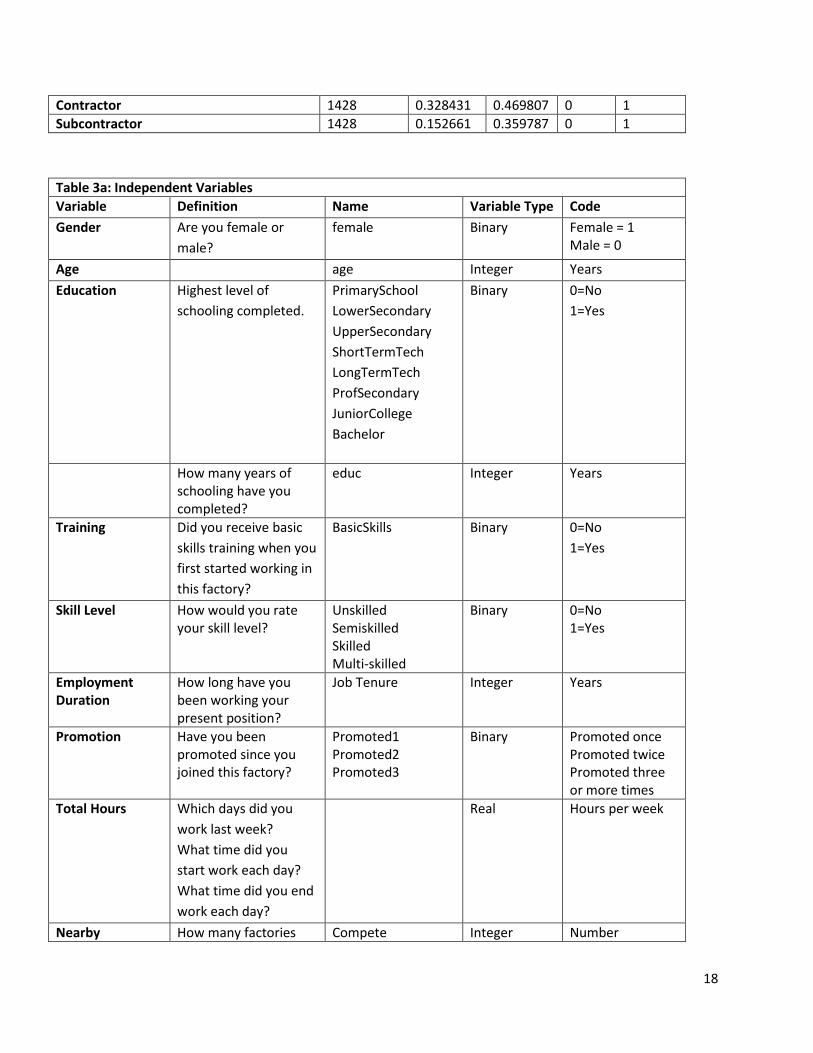
Table 3a: Independent Variables Variable Definition Name Variable Type Code Gender Are you female or
male? female Binary Female = 1
Male = 0
Age age Integer Years Education Highest level of
schooling completed. PrimarySchool LowerSecondary UpperSecondary ShortTermTech LongTermTech ProfSecondary JuniorCollege Bachelor
Binary
0=No 1=Yes
How many years of schooling have you completed?
educ Integer Years
Training Did you receive basic skills training when you first started working in this factory?
BasicSkills Binary
0=No 1=Yes
Skill Level How would you rate your skill level?
Unskilled Semiskilled Skilled Multi-skilled
Binary
0=No 1=Yes
Employment Duration
How long have you been working your present position?
Job Tenure Integer
Years
Promotion Have you been promoted since you joined this factory?
Promoted1 Promoted2 Promoted3
Binary
Promoted once Promoted twice Promoted three or more times
Total Hours Which days did you work last week? What time did you start work each day? What time did you end work each day?
Real Hours per week
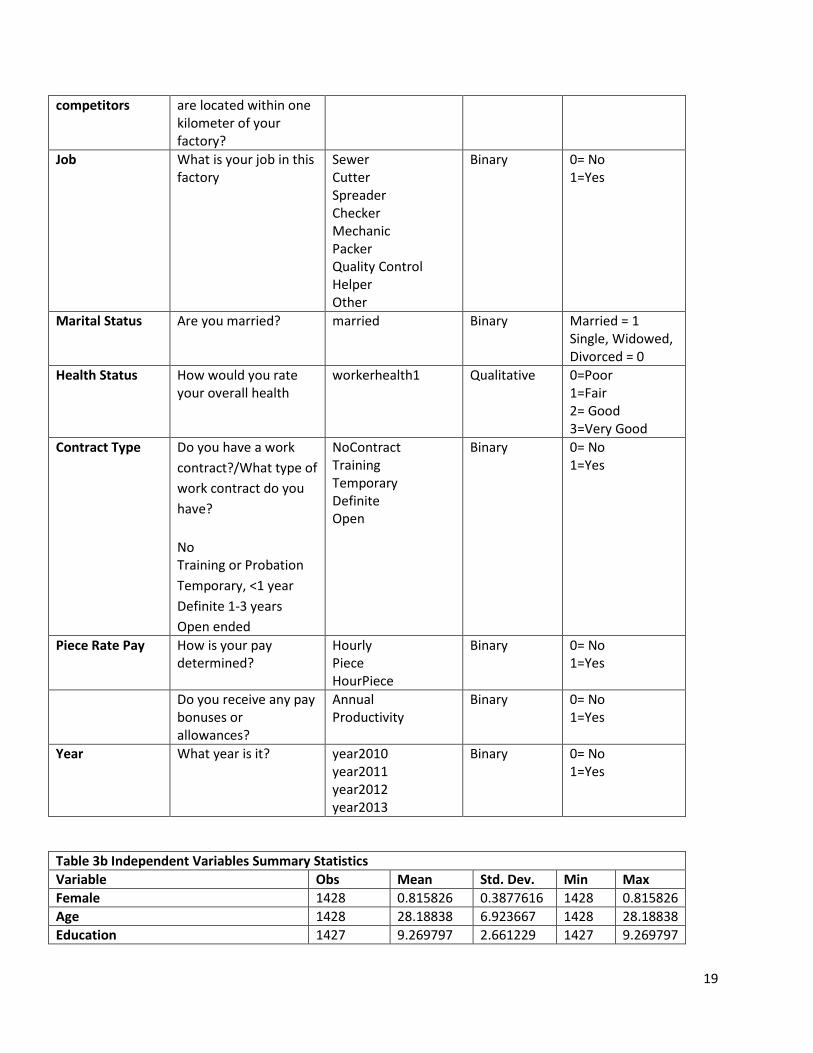
Nearby How many factories Compete Integer Number
19
competitors are located within one kilometer of your factory?
Job What is your job in this factory
Sewer Cutter Spreader Checker Mechanic Packer Quality Control Helper Other
Binary
0= No 1=Yes
Marital Status Are you married? married Binary
Married = 1 Single, Widowed, Divorced = 0
Health Status How would you rate your overall health
workerhealth1 Qualitative
0=Poor 1=Fair 2= Good 3=Very Good
Contract Type Do you have a work contract?/What type of work contract do you have? No Training or Probation Temporary, <1 year Definite 1-3 years Open ended
NoContract Training Temporary Definite Open
Binary
0= No 1=Yes
Piece Rate Pay How is your pay determined?
Hourly Piece HourPiece
Binary 0= No 1=Yes
Do you receive any pay bonuses or allowances?
Annual Productivity
Binary 0= No 1=Yes
Year What year is it? year2010 year2011 year2012 year2013
Binary
0= No 1=Yes
Table 3b Independent Variables Summary Statistics Variable Obs Mean Std. Dev. Min Max Female 1428 0.815826 0.3877616 1428 0.815826 Age 1428 28.18838 6.923667 1428 28.18838 Education 1427 9.269797 2.661229 1427 9.269797

20
Married 1405 0.569395 0.4953372 1405 0.569395 Worker health 1428 1.771709 0.6951514 1428 1.771709 No Contract 1428 0.008403 0.0913158 1428 0.008403 Training 1428 0.029412 0.1690169 1428 0.029412 Temporary 1428 0.044118 0.2054284 1428 0.044118 Definite 1428 0.37395 0.48402 1428 0.37395 Open 1428 0.522409 0.4996726 1428 0.522409 Basic Skills 1427 1.213034 0.4095953 1427 1.213034 Unskilled 1428 0.019608 0.138697 1428 0.019608 Semiskilled 1428 0.345238 0.4756124 1428 0.345238 Skilled 1428 0.405462 0.4911533 1428 0.405462 Multi-skilled 1428 0.073529 0.261095 1428 0.073529 Job Tenure 1426 4.603086 3.371016 1426 4.603086 Promoted1 1428 0.131653 0.3382312 1428 0.131653 Promoted2 1428 0.028712 0.1670529 1428 0.028712 Promoted3 1428 0.020308 0.1411015 1428 0.020308 Total Hours 1428 58.95357 9.720414 1428 58.95357 Nearby Competitors 1399 2.577555 1.424127 1399 2.577555 Hourly Pay 1421 0.636875 0.4810696 1421 0.636875 Piece Rate Pay 1421 0.270232 0.444236 1421 0.270232 Hour & Piece 1421 0.12456 0.3303358 1421 0.12456 Annual Bonus 1420 0.360563 0.4803331 1420 0.360563 Productivity Bonus 1420 0.274648 0.4464939 1420 0.274648
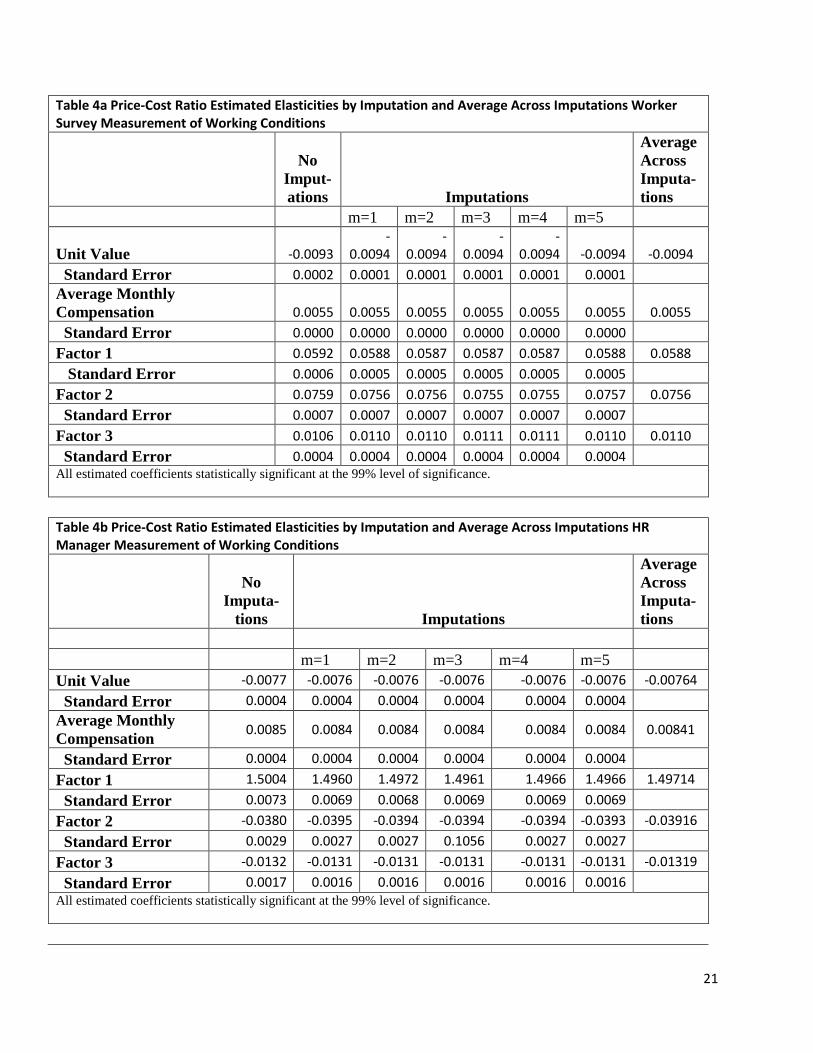
4. EMPIRICAL RESULTS Price-Cost Markup. Estimated elasticities for the price-cost markup are reported in Tables 4a
(worker), 4b (manager) and 4c (compliance). The coefficient on the Unit Value is negative and
statistically significant. One might expect that average price would be positively correlated with profits,
though such an outcome is not necessarily the case. While the potential profit exists from selling high
unit value products, this potential will be realized only if a firm’s comparative advantage lies at the top
of the value chain. Many Vietnamese factories have the capacity to deliver FOB, yet, we have found
considerable evidence of factories attempting FOB, performing poorly, and then retreating to CMT.
21
Table 4a Price-Cost Ratio Estimated Elasticities by Imputation and Average Across Imputations Worker Survey Measurement of Working Conditions
No Imput-ations Imputations
Average Across Imputa-tions
m=1 m=2 m=3 m=4 m=5
Unit Value -0.0093 -
0.0094 -
0.0094 -
0.0094 -
0.0094 -0.0094 -0.0094 Standard Error 0.0002 0.0001 0.0001 0.0001 0.0001 0.0001
Average Monthly Compensation 0.0055 0.0055 0.0055 0.0055 0.0055 0.0055 0.0055 Standard Error 0.0000 0.0000 0.0000 0.0000 0.0000 0.0000
Factor 1 0.0592 0.0588 0.0587 0.0587 0.0587 0.0588 0.0588 Standard Error 0.0006 0.0005 0.0005 0.0005 0.0005 0.0005
Factor 2 0.0759 0.0756 0.0756 0.0755 0.0755 0.0757 0.0756 Standard Error 0.0007 0.0007 0.0007 0.0007 0.0007 0.0007
Factor 3 0.0106 0.0110 0.0110 0.0111 0.0111 0.0110 0.0110 Standard Error 0.0004 0.0004 0.0004 0.0004 0.0004 0.0004
All estimated coefficients statistically significant at the 99% level of significance.
Table 4b Price-Cost Ratio Estimated Elasticities by Imputation and Average Across Imputations HR Manager Measurement of Working Conditions
No Imputa-
tions Imputations
Average Across Imputa-tions
m=1 m=2 m=3 m=4 m=5 Unit Value -0.0077 -0.0076 -0.0076 -0.0076 -0.0076 -0.0076 -0.00764 Standard Error 0.0004 0.0004 0.0004 0.0004 0.0004 0.0004 Average Monthly Compensation 0.0085 0.0084 0.0084 0.0084 0.0084 0.0084 0.00841
Standard Error 0.0004 0.0004 0.0004 0.0004 0.0004 0.0004 Factor 1 1.5004 1.4960 1.4972 1.4961 1.4966 1.4966 1.49714 Standard Error 0.0073 0.0069 0.0068 0.0069 0.0069 0.0069 Factor 2 -0.0380 -0.0395 -0.0394 -0.0394 -0.0394 -0.0393 -0.03916 Standard Error 0.0029 0.0027 0.0027 0.1056 0.0027 0.0027 Factor 3 -0.0132 -0.0131 -0.0131 -0.0131 -0.0131 -0.0131 -0.01319 Standard Error 0.0017 0.0016 0.0016 0.0016 0.0016 0.0016 All estimated coefficients statistically significant at the 99% level of significance.
22
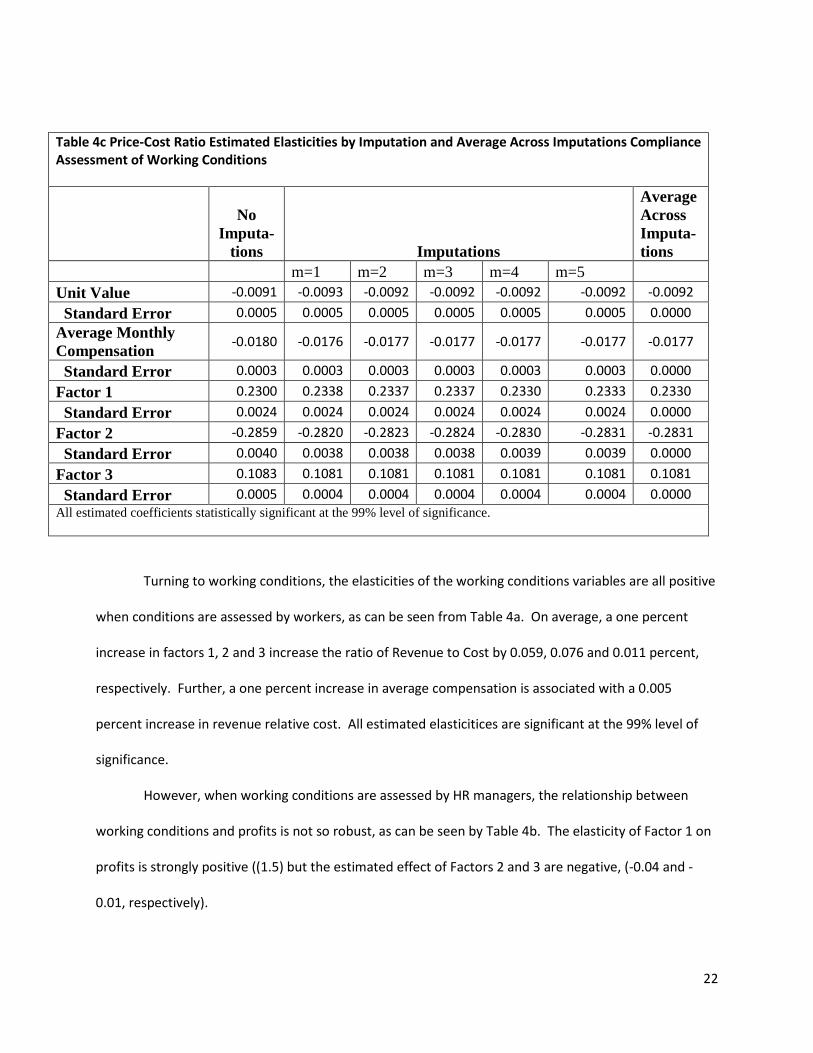
Table 4c Price-Cost Ratio Estimated Elasticities by Imputation and Average Across Imputations Compliance Assessment of Working Conditions
No Imputa-
tions Imputations
Average Across Imputa-tions
m=1 m=2 m=3 m=4 m=5 Unit Value -0.0091 -0.0093 -0.0092 -0.0092 -0.0092 -0.0092 -0.0092 Standard Error 0.0005 0.0005 0.0005 0.0005 0.0005 0.0005 0.0000 Average Monthly Compensation -0.0180 -0.0176 -0.0177 -0.0177 -0.0177 -0.0177 -0.0177
Standard Error 0.0003 0.0003 0.0003 0.0003 0.0003 0.0003 0.0000 Factor 1 0.2300 0.2338 0.2337 0.2337 0.2330 0.2333 0.2330 Standard Error 0.0024 0.0024 0.0024 0.0024 0.0024 0.0024 0.0000 Factor 2 -0.2859 -0.2820 -0.2823 -0.2824 -0.2830 -0.2831 -0.2831 Standard Error 0.0040 0.0038 0.0038 0.0038 0.0039 0.0039 0.0000 Factor 3 0.1083 0.1081 0.1081 0.1081 0.1081 0.1081 0.1081 Standard Error 0.0005 0.0004 0.0004 0.0004 0.0004 0.0004 0.0000 All estimated coefficients statistically significant at the 99% level of significance.
Turning to working conditions, the elasticities of the working conditions variables are all positive
when conditions are assessed by workers, as can be seen from Table 4a. On average, a one percent
increase in factors 1, 2 and 3 increase the ratio of Revenue to Cost by 0.059, 0.076 and 0.011 percent,
respectively. Further, a one percent increase in average compensation is associated with a 0.005
percent increase in revenue relative cost. All estimated elasticitices are significant at the 99% level of
significance.
However, when working conditions are assessed by HR managers, the relationship between
working conditions and profits is not so robust, as can be seen by Table 4b. The elasticity of Factor 1 on
profits is strongly positive ((1.5) but the estimated effect of Factors 2 and 3 are negative, (-0.04 and -
0.01, respectively).

23
Thus, firms may perceive a positive payoff to eliminating the most harsh conditions of work such
as sexual harassment, physical abuse and exposure the dangerous chemicals. However, they see a
negative relationship between improvement in their perceptions of pay practices and unions, and firm
profits. A positive relationship between working conditions and profits only emerges when workers’
reports conform with manager perceptions of compliance.
When working conditions are assessed from the perspective of compliance assessments, the
relationship between profits and working conditions is positive for two of the three factors.
Communications and union rights (Factor 3) have a positive relationship with profits. The failure to
clearly characterize Factors 1 and 2 likely lie at the apparent contraction in the relationship between
profits and working conditions.
Productivity. Having established a positive relationship between working conditions as
measured by compliance and overall firm performance, we turn now to attempt to determine the
channel through which the positive effect occurs. Are profits positively correlated with working
conditions because productivity rises, because firms provide workers with a more desirable mix
between overall working conditions and wages and/or because suppliers reward firms that have
attractive working conditions with a more remunerative contracting relationship?
Given the smaller number of regressors at this stage of the analysis, we expand the number of
factors to four. As explained above, estimation of the translog price-cost equation requires interacting
all working conditions variables, causing the number of regressors to rise geometrically with the number
of factors. However, in the estimation of the productivity, wage and supply chain position equations, no
such interactive terms are required. The four factors are characterized in Table 5.

24
Table 5 Four Factors Factor 1 Factor 2 Factor 3 Factor 4 CBA CBA CBA CBA Union Interference Health Services Union Interference Union Interference Chemicals Welfare Strikes Union Opposition Emergency Preparedness Work Environment OSH Management Chemicals Health Services Leave Accommodations Health Services OSH Management Overtime Regulations Worker Protections Welfare Regular Hours Worker Protections Work Environment Leave
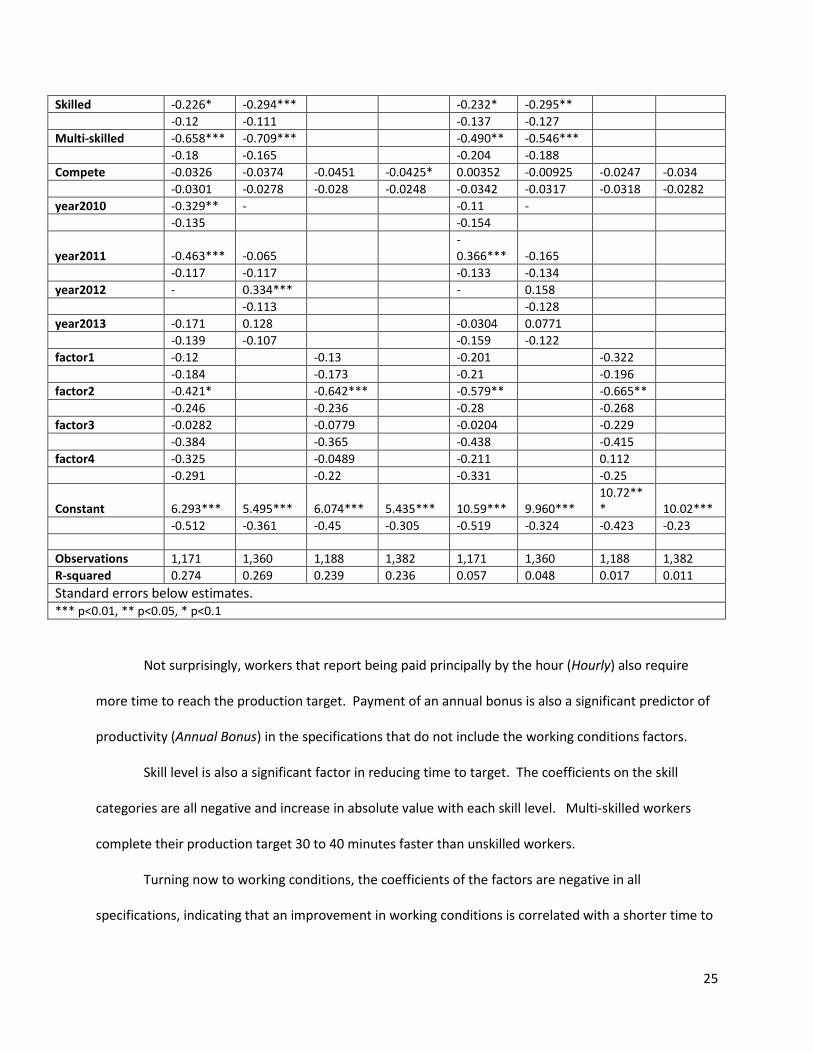
Estimates of the Time to Production Target Friday variable are reported in Table 6. Eight
variations of equation (8’) are reported. A comparison of each pair of results indicates the marginal
contribution of the working conditions variables. Results reported in columns (1) and (2) include Total
Hours as a control, while columns (3) and (4) do not. For each specification, one version includes all
demographic and job controls and the other does not. As is clear in all specifications, the coefficient is
positive and significant, indicating that factories with longer work days also require more time to
complete the production target.
Table 6 Productivity: Time to Production Target Friday (1) (2) (3) (4)
Demo/Job Controls No Demo/Job Controls Demo/Job Controls No Demo/Job Controls
Total Hours 0.0777*** 0.0792*** 0.0772*** 0.0788*** -0.00423 -0.00395 -0.00419 -0.00393 Hourly 0.292** 0.309** 0.117 0.151 0.299* 0.331** 0.137 0.179 -0.135 -0.125 -0.132 -0.123 -0.154 -0.143 -0.15 -0.14 Annual Bonus -0.0995 -0.138* -0.115 -0.147** -0.0549 -0.106 -0.076 -0.125 -0.0829 -0.0758 -0.0822 -0.0748 -0.0944 -0.0864 -0.0933 -0.085 Productivity Bonus 0.174* 0.126 0.157* 0.107 0.144 0.131 0.139 0.117 -0.0897 -0.0814 -0.0895 -0.0815 -0.102 -0.0928 -0.102 -0.0927 Unskilled -0.361 -0.434 -0.409 -0.428 -0.296 -0.279 -0.337 -0.318 Semiskilled -0.0806 -0.197* -0.0595 -0.155 -0.12 -0.11 -0.136 -0.125
25
Skilled -0.226* -0.294*** -0.232* -0.295** -0.12 -0.111 -0.137 -0.127 Multi-skilled -0.658*** -0.709*** -0.490** -0.546*** -0.18 -0.165 -0.204 -0.188 Compete -0.0326 -0.0374 -0.0451 -0.0425* 0.00352 -0.00925 -0.0247 -0.034 -0.0301 -0.0278 -0.028 -0.0248 -0.0342 -0.0317 -0.0318 -0.0282 year2010 -0.329** - -0.11 - -0.135 -0.154
year2011 -0.463*** -0.065 -0.366*** -0.165
-0.117 -0.117 -0.133 -0.134 year2012 - 0.334*** - 0.158 -0.113 -0.128 year2013 -0.171 0.128 -0.0304 0.0771 -0.139 -0.107 -0.159 -0.122 factor1 -0.12 -0.13 -0.201 -0.322 -0.184 -0.173 -0.21 -0.196 factor2 -0.421* -0.642*** -0.579** -0.665** -0.246 -0.236 -0.28 -0.268 factor3 -0.0282 -0.0779 -0.0204 -0.229 -0.384 -0.365 -0.438 -0.415 factor4 -0.325 -0.0489 -0.211 0.112 -0.291 -0.22 -0.331 -0.25
Constant 6.293*** 5.495*** 6.074*** 5.435*** 10.59*** 9.960*** 10.72*** 10.02***
-0.512 -0.361 -0.45 -0.305 -0.519 -0.324 -0.423 -0.23 Observations 1,171 1,360 1,188 1,382 1,171 1,360 1,188 1,382 R-squared 0.274 0.269 0.239 0.236 0.057 0.048 0.017 0.011 Standard errors below estimates. *** p<0.01, ** p<0.05, * p<0.1
Not surprisingly, workers that report being paid principally by the hour (Hourly) also require
more time to reach the production target. Payment of an annual bonus is also a significant predictor of
productivity (Annual Bonus) in the specifications that do not include the working conditions factors.
Skill level is also a significant factor in reducing time to target. The coefficients on the skill
categories are all negative and increase in absolute value with each skill level. Multi-skilled workers
complete their production target 30 to 40 minutes faster than unskilled workers.
Turning now to working conditions, the coefficients of the factors are negative in all
specifications, indicating that an improvement in working conditions is correlated with a shorter time to

26
target, or more work effort. The effect is strongest for factor 2 which is dominated by compliance
related to overtime work and regular hours. However, work environment, welfare facilities and health
are also significant contributors.
One might suspect, given the importance of work hours in factor 2, that we have a case of
reverse causality. Factories that have come into compliance on work hours find that compliance
requires a shorter work day and a smaller production target that can be reached in a shorter amount of
time. Indeed, it is the case that the impact of compliance with factor 2 when we do not control for Total
Hours (columns 3 and 4) is larger than when Total Hours is excluded from the equation (columns 1 and
2).
However, the fact that factor 2 is large and statistically significant, even after controlling for the
length of the work day, indicates that there is an effect of factor 2 on the time to target that goes above
and beyond the impact on the length of the work day. An alternative explanation that is consistent with
the significance of factor 2 after controlling for the length of the work day is that firms forced by
compliance to shorten the work day must find efficiencies in the production process. The possibility
that complying with worker hours limitations has efficiency effects is corroborated by the impact of
compliance on wages.
Turning to wages, our second possible source of gain in profits due to compliance might arise if
workers prefer to trade off wages for improved working conditions. Firms that choose more compliance
may be able to offer workers a reduced wage without adverse firm effect. In such a case, factories with
higher compliance may also pay a lower average wage. However, wages will be positively correlated
with compliance if there is a productivity gain associated with compliance that is shared with workers.
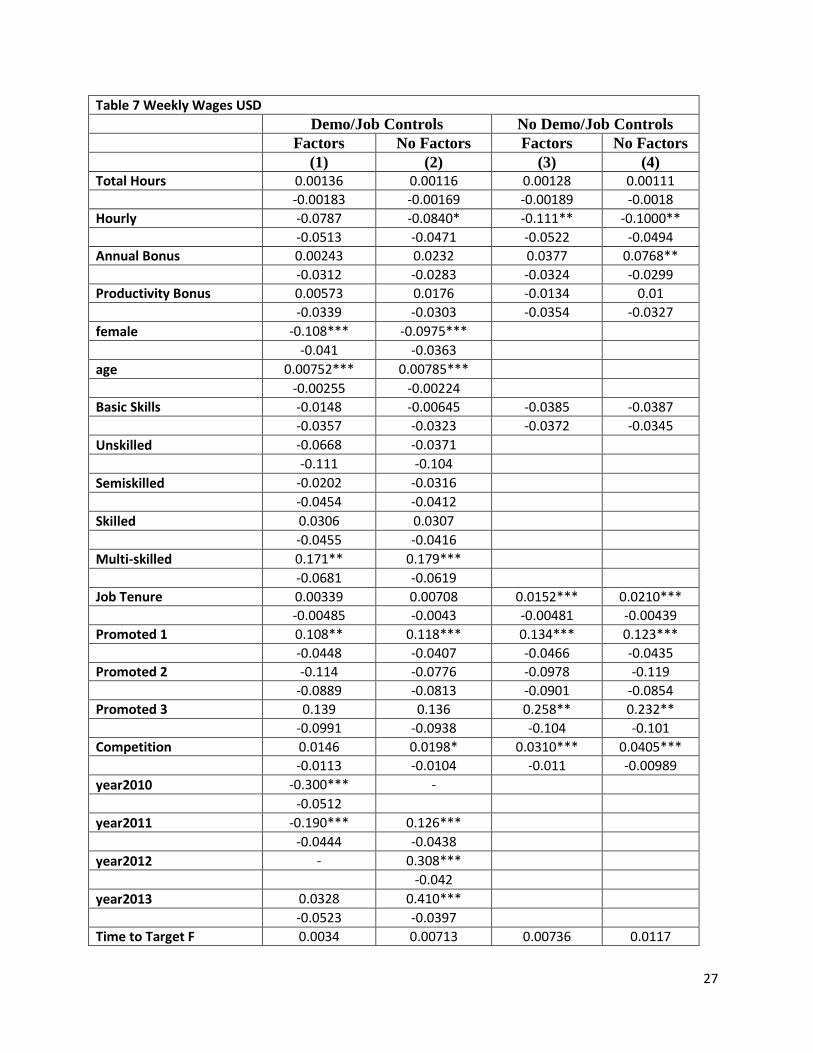
Estimates of the wage equation are reported in Table 7. Four variants are estimated. Columns
(1) and (2) report estimates with job and demographic controls. Columns (3) and (4) are limited to the
basic model. For each set of results, the first column (1 or 3) includes the working conditions factors.
27
Table 7 Weekly Wages USD Demo/Job Controls No Demo/Job Controls Factors No Factors Factors No Factors (1) (2) (3) (4) Total Hours 0.00136 0.00116 0.00128 0.00111 -0.00183 -0.00169 -0.00189 -0.0018 Hourly -0.0787 -0.0840* -0.111** -0.1000** -0.0513 -0.0471 -0.0522 -0.0494 Annual Bonus 0.00243 0.0232 0.0377 0.0768** -0.0312 -0.0283 -0.0324 -0.0299 Productivity Bonus 0.00573 0.0176 -0.0134 0.01 -0.0339 -0.0303 -0.0354 -0.0327 female -0.108*** -0.0975*** -0.041 -0.0363 age 0.00752*** 0.00785*** -0.00255 -0.00224 Basic Skills -0.0148 -0.00645 -0.0385 -0.0387 -0.0357 -0.0323 -0.0372 -0.0345 Unskilled -0.0668 -0.0371 -0.111 -0.104 Semiskilled -0.0202 -0.0316 -0.0454 -0.0412 Skilled 0.0306 0.0307 -0.0455 -0.0416 Multi-skilled 0.171** 0.179*** -0.0681 -0.0619 Job Tenure 0.00339 0.00708 0.0152*** 0.0210*** -0.00485 -0.0043 -0.00481 -0.00439 Promoted 1 0.108** 0.118*** 0.134*** 0.123*** -0.0448 -0.0407 -0.0466 -0.0435 Promoted 2 -0.114 -0.0776 -0.0978 -0.119 -0.0889 -0.0813 -0.0901 -0.0854 Promoted 3 0.139 0.136 0.258** 0.232** -0.0991 -0.0938 -0.104 -0.101 Competition 0.0146 0.0198* 0.0310*** 0.0405*** -0.0113 -0.0104 -0.011 -0.00989 year2010 -0.300*** - -0.0512 year2011 -0.190*** 0.126*** -0.0444 -0.0438 year2012 - 0.308*** -0.042 year2013 0.0328 0.410*** -0.0523 -0.0397 Time to Target F 0.0034 0.00713 0.00736 0.0117
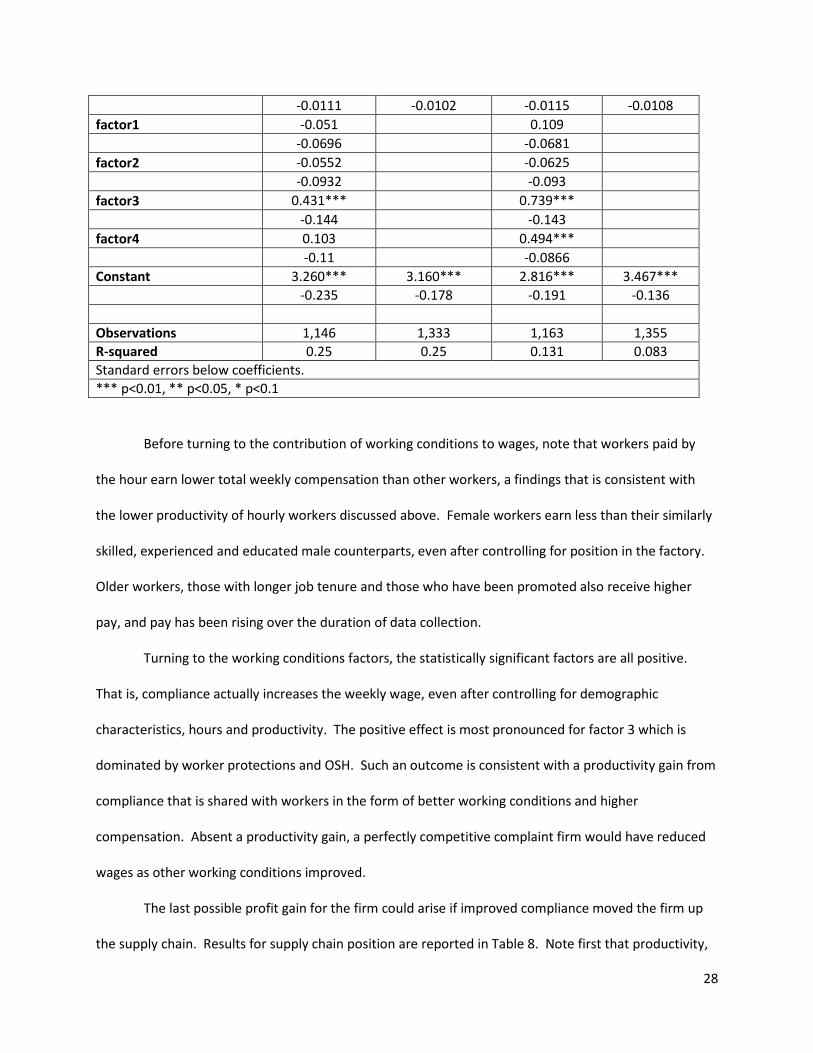
28
-0.0111 -0.0102 -0.0115 -0.0108 factor1 -0.051 0.109 -0.0696 -0.0681 factor2 -0.0552 -0.0625 -0.0932 -0.093 factor3 0.431*** 0.739*** -0.144 -0.143 factor4 0.103 0.494*** -0.11 -0.0866 Constant 3.260*** 3.160*** 2.816*** 3.467*** -0.235 -0.178 -0.191 -0.136 Observations 1,146 1,333 1,163 1,355 R-squared 0.25 0.25 0.131 0.083 Standard errors below coefficients. *** p<0.01, ** p<0.05, * p<0.1
Before turning to the contribution of working conditions to wages, note that workers paid by
the hour earn lower total weekly compensation than other workers, a findings that is consistent with
the lower productivity of hourly workers discussed above. Female workers earn less than their similarly
skilled, experienced and educated male counterparts, even after controlling for position in the factory.
Older workers, those with longer job tenure and those who have been promoted also receive higher
pay, and pay has been rising over the duration of data collection.
Turning to the working conditions factors, the statistically significant factors are all positive.
That is, compliance actually increases the weekly wage, even after controlling for demographic
characteristics, hours and productivity. The positive effect is most pronounced for factor 3 which is
dominated by worker protections and OSH. Such an outcome is consistent with a productivity gain from
compliance that is shared with workers in the form of better working conditions and higher
compensation. Absent a productivity gain, a perfectly competitive complaint firm would have reduced
wages as other working conditions improved.
The last possible profit gain for the firm could arise if improved compliance moved the firm up
the supply chain. Results for supply chain position are reported in Table 8. Note first that productivity,

29
as indicated by time to target, significantly predicts supply chain position. The time to target negatively
predicts firm status as a preferred supplier or contractor, is not a significant predictor of FOB and is a
positive predictor of sub-contracting and CMT. That is, improvements in productivity move a firm up
the supply chain.
Table 8 Supply Chain Position VARIABLES Preferred Supplier Contractor Subcontractor FOB CMT
(1) (2) (3) (4) (5) Time Target F -0.0681*** -0.0673** 0.109*** 0.026 0.249*** -0.0256 -0.0272 -0.0313 -0.026 -0.0439 lnWeekly Pay USD 0.00905 0.0759 -0.223** 6.47E-02 0.000330*** -7.19E-02 -7.66E-02 -9.17E-02 -7.23E-02 -7.51E-05 Employment -9.06e-05*** 0.000114*** -9.63e-05*** 3.59E-05 0.142 -2.58E-05 -2.54E-05 -3.37E-05 -2.53E-05 -0.102 factor1 -0.800*** 0.557*** 0.936*** -1.415*** 0.256 -0.169 -0.18 -0.232 -0.171 -0.239 factor2 0.945*** -1.683*** 1.567*** 0.938*** -0.36 -0.232 -0.248 -0.324 -0.238 -0.349 factor3 0.566 -1.307*** 2.604*** 0.0151 -1.553** -0.354 -0.364 -0.727 -0.341 -0.613 factor4 -1.531*** 1.626*** -0.452 -0.813*** 0.0736 -0.224 -0.232 -0.289 -0.223 -0.309 Constant 0.886* 0.672 -4.461*** -0.254 -0.849 0.4642781 0. 6722784 -1.7533174 0.4657299 -0.757 Observations 1,163 1,163 1,163 1,163 1,163 Standard errors below estimates. *** p<0.01, ** p<0.05, * p<0.1
However, the impact of compliance independent of its impact on productivity is ambiguous.
Therefore, there is no evidence that buyers are rewarding firms for compliance performance with more
attractive work contracts. To the extent that compliance matters for contracting relationship, the
channel is through improved productivity. Higher productivity improves supply chain position.

30
5. CONCLUSION AND DIRECTIONS FOR FUTURE RESEARCH Our central question is whether innovations in working conditions increase firm profits. That is,
are exploitative practices profitable? The empirical results presented above show that no, exploitive
practices are not profitable. We find evidence consistent with the hypotheses that there is cross-firm
heterogeneity in managerial quality and that higher quality managers choose more humane and
profitable labor management practices.
Further, the challenges of implementing HR innovations are a significant factor in deterring their
adoption. Labor management innovations that HR managers believe they are introducing have a larger
impact on profits when workers perceive a change in working conditions. That is, a one unit change in
working conditions as perceived by the worker on firm profits is larger than a one unit change in working
conditions as perceived by the manager. As a consequence, most innovations require effective
implementation at the factory floor to improve profitability.
The regression results indicate a markedly different perspective of the managers relative to that
of the workers. For several dimensions of the HR system, workers apparently fail to perceive
innovations implemented by management.
The analysis presented above, while suggestive, is not definitive. It remains possible that profits
and the HR system are jointly determined by a third factor not included in the analysis. A second
possible limitation is the fidelity with which managers and workers report on their workplace
perspectives.
Perhaps more importantly, the small number of factories limits the conclusions that can be
drawn from the analysis. The number of factors identified was limited to three. When estimating the
translog profit function, the number of variables grows geometrically with the number of factors due to
the need to interact each factor with all other variables in the equation. Thus, the number of factors is
limited by the size of the data set. However, evidence from Domat et al. suggests that there are, in fact,

31
four to eight underlying factors. The failure of the data to reveal underlying factors may be limiting our
ability to fully disentangle the relationship between working conditions and profits.
The question then becomes, what is the causal mechanism? Why do improved working
conditions improve firm performance? Do improved working conditions raise productivity, lower the
wage that workers will accept to work in a less hostile environment or do compliant firms move up the
value chain?
We find that the principle mechanism is increased work effort. The time to complete the
production target is shorter in compliant factories even after controlling for the length of the workday.
Factories share this higher productivity with workers rather than substituting lower pay for improved
conditions of work. Such findings support the conclusion that the productivity cost of monopsonistic
exploitation is greater than the gain from lower wages. In fact, we find evidence that firms forced to
comply with working hours compliance find innovative strategies to improve productivity such as the
use of pay incentives.
Finally, we find that compliance has a positive effect on productivity and productivity gains
improve supply chain position. Thus, there appears to be a win-win-win in that compliance has a
positive impact on productivity which is shared with workers in the form of higher wages, increases firm
profits and delivers higher productivity to international buyers.
32
REFERENCES
Adler, P. S. 1988. “Managing Flexible Automation.” California Management Review, 30(3): 34-56. Bandiera, O. I. Barankay and I. Rasul. 2007. “Incentives for Managers and Inequality Among Workers: Evidence from a Firm-Level Experiment,” Quarterly Journal of Economics, 122(2), 729-773.
Bloom, Nicholoas, Benn Eifertb, Aprajit Mahajan, David McKenzie and John Roberts. 2012. “Does Management Matter? Evidence from India.” April 18th. Freeman, Richard B. and Kleiner, Morris M. 2005. “The Last American Shoe Manufacturers: Decreasing Productivity and Increasing Profits in the Shift from Piece Rates to Continuous Flow Production.” Industrial Relations, Vol. 44, No. 2, pp. 307-330, April.
Harrison, Ann E and Jason Scorse. 2010. “Multinationals and Anti-Sweatshop Activism”, American Economic Review, 100(1): 247–73. Ichniowski, Casey, Shaw, Kathryn L. and Prennushi, Giovanna. 1995. The Effects of Human Resource Management Practices on Productivity (November). NBER Working Paper Series, Vol. w5333. Lazear, Edward P. and Oyer, Paul. 2009. “Personnel Economics” Retrieved from http://faculty-gsb.stanford.edu/oyer/wp/handbook.pdf on 14 April 2014
Lazear, Edward P. and Shaw, Kathryn L. 2007. “Personnel Economics: The Economist’s View of Human Resources”, NBER Working Paper #13,653. Melitz, Marc. 2003. “The Impact of Trade on Intra-Industry Reallocations and Aggregate Industry Productivity,” Econometrica, LXXI, 1695–1725.
Reich, R. B. 1991. The Work of Nations: Preparing Ourselves for 21st-Century Capitalism. New York: Knopf. Sabel, Charles, Dara O'Rourke and Archon Fung. 2000. Ratcheting Labor Standards: Regulation for Continuous Improvement in the Global Workplace, Washington, D.C.: The World Bank, Social Protection Discussion Paper No.11
Sachs, Jeffrey. 2005. The End of Poverty: Economic Possibilities for our Time. Penguin Group, USA.
Veeraragoo, Selven. 2012. Does Exploitation Pay? Evidence from Better Work Vietnam. MA Thesis, Tufts University.

33
APPENDIX Appendix Factor Loadings Worker Survey Assessment of Working Conditions Factor 1 Factor 2 Factor 3 Uniqueness payoften 0.9936 latewage 0.483 0.7505 lowwage 0.5658 0.3208 0.5753 bonuses 0.6821 0.5243 tetconcern 0.4985 0.2579 0.6846 inkindconcern 0.5426 0.7045 benefits 0.6102 0.5958 statementinfo 0.3702 0.8426 piecerateex 0.354 0.2657 0.7951 deductions 0.3919 -0.4083 0.6681 deducconcern 0.6176 0.6052 faircorrect 0.5084 0.7074 verbal 0.6598 0.5412 physical 0.6786 0.5309 toilet 0.945 induction 0.5499 0.6858 trainingsix 0.359 0.802 promgender 0.98 sexharass 0.6284 0.5935 promethnicity/national origin 0.9876
promreligion -0.2296 0.9237 clock 0.6043 0.6317 cba 0.2184 0.952 tucomfort 0.273 0.5104 0.6646 chemicals 0.608 0.5906 healthservices 0.4592 0.7635 treatquality 0.5641 0.6765 watersatis 0.6768 0.5305 canteensatis 0.7081 0.4795 bathsatis 0.6912 0.5063 oftendrink 0.2165 0.9511 equipment 0.6012 0.6243 accidents 0.7019 0.5059 temperature 0.4837 0.396 0.6075 air quality 0.6134 0.2987 0.5287 overtime 0.3837 0.8158 sunday 0.4402 0.8036 (blanks represent abs(loading)<.2)

34
Appendix Factor Loadings HR Manager Assessment of Working Conditions Factor 1 Factor 2 Factor 3 Uniqueness Age Verification
-0.3393
0.8668
Late Wages 0.6759 0.5115
0.259 Low Wages 0.4776 0.5618
0.4297
Tet Bonus 0.646 0.5839 0.2838 0.1611 Inkind Compensation 0.7804 0.3722
0.2517
Meal Allowance
0.4728
0.721 Benefits
-0.3256
0.8676
Pay Statement Information
-0.4748
0.7341 Excessive Deductions 0.6759 0.5115
0.259
Verbal Abuse 0.5074 0.225 0.4628 0.4777 Physical Abuse 0.9502
0.0859
Induction Training
-0.449 0.4575 0.5845 Supervisor Skills Training 0.2 0.2716 0.3326 0.7756 Sewer Skills Training
0.9367
Sexual Harassment 0.9606
0.0691 Punch Clock 0.6868 0.4799
0.0691
Collective Bargaining Agreement 0.2038 -0.491 0.3091 0.6219 Worker Committees
0.2043 0.5569 0.6353
Worker Committee Effectiveness
0.7805 0.3666 Trade Union Effectiveness
0.7303 0.4352
Chemicals 0.9606
0.0691 Health Services
-0.2718 0.2549 0.8611
Equipment Safety 0.9606
0.0691 Accidents 0.6921
0.5209
Temperature 0.5206 0.3009 0.3525 0.5142 Air Quality 0.8403
0.2896
Appendix Factor Loadings Compliance Assessment of Working Conditions Factor 1 Factor 2 Factor 3 Uniqueness CBA index
0.5787 0.2479 0.5973
Interference with Union Index
0.5171 0.6881 Strikes index
0.8094 0.3107
Unionop Index
0.8094 0.3107 Chemicals Index 0.4678 0.3299 0.5101 0.4121 Emergence Preparedness Index 0.6435
0.5382
Health Services Index 0.4286
0.6321 0.3879 Osh Management 0.3639 0.4637 0.2232 0.6028 Welfare Facilities Index 0.5155 0.2431
0.6549
Accommodations Index
0.537 -0.4047 0.5409

35
Work protections Index 0.502 0.4592 0.2135 0.4916 Work Environment Index 0.6499
0.573
Leave Index 0.6569
0.5535 Overtime Work Index 0.4514 0.2128 0.2374 0.6946 Regular Hours Index 0.2659 0.4553 0.7215 (blanks represent abs(loading)<.2)
Compliance Index Components Index Compliance Point Components
CBA index cbaindexI = rowmean(q_4039 q_4044 q_4050 q_4053 q_4059 q_4074 q_4076 q_4070)
Interference with Union Index interferenceindexI = rowmean(q_4010 q_3960 q_4001 q_4004 q_4010 q_4018 q_4023 q_4027 q_4032 q_3968 q_3974)
Strikes index strikesindexI = rowmean(q_4081 q_4084 q_4087 q_4090 q_4093)
Unionop Index unionopsindexI = rowmean(q_1256 q_3931 q_2848 q_2849 q_3937 q_3945)
Chemicals Index chemicalsindexI = rowmean(q_4006 q_4034 q_2887 q_4012 q_4015 q_4022 q_4029 q_4034 q_4037)
Emergence Preparedness Index emergprepareindexI = rowmean(q_139 q_4182 q_4171 q_4173 q_4178 q_4174 q_4176 q_4178 q_4181 q_4182 q_4183)
Health Services Index healthservicesindexI = rowmean(q_4158 q_4153 q_4156 q_4152 q_4153 q_4155 q_4156 q_4157 q_4158 q_4159)
Osh Management oshmanageindexI = rowmean(q_3983 q_89 q_3983 q_2882 q_2883 q_3973 q_3983 q_3997)
Welfare Facilities Index welfarefacilitiesindexI = rowmean(q_124 q_4162 q_4161 q_4162 q_4163 q_4164 q_4166 q_4167)
Accommodations Index accommodationindexI = rowmean(q_1275 q_2919 q_2920 q_2921 q_2922 q_2923 q_2924 q_2925 q_2926 q_2927 q_2928 q_3384 q_3385)
Work protections Index workprotectindexI = rowmean(q_4067 q_4069 q_4054 q_4049 q_4054 q_4057 q_4061 q_4064 q_4067 q_4069 q_4073 q_4108 q_4131 q_4132 q_4136 q_4139 q_4141)
Work Environment Index workenvironindexI = rowmean(q_4145 q_4147 q_4148 q_4149
Leave Index leaveindexI= rowmean(q_4111 q_4105 q_4107 q_4114 q_4116 q_4118 q_4120 q_4121 q_4123 q_4125)
Overtime Work Index overtimeworkingindexI= rowmean(q_4091 q_4094 q_4096 q_4098 q_4099)
Regular Hours Index regularhoursindexI = rowmean(q_4078 q_4079 q_4082 q_4085 q_4086 q_4088)

The Better Work Discussion Paper Series is an original, peer-reviewed series that presents rigorous, work-in-progress research material for comment and feedback. It is addressed to researchers, policymakers and development practitioners to generate comments and encourage discussion.
Core donors to Better Work are: Netherlands Ministry of Foreign Affairs Swiss State Secretariat for Economic Affairs Ministry of Foreign Affairs of Denmark The US Department of Labor
Funding is also provided by DFID, Government of France, Government of Canada, Irish Aid, GMAC, Royal Government of Cambodia and private sector donors,including The Walt Disney Company, Levi Strauss Foundation, Gap Inc. and FUNG (1937) Management Ltd