best value granular material for road foundations value granular material for road foundations ......
TRANSCRIPT

Best Value Granular Material Best Value Granular Material for Road Foundationsfor Road Foundations
MnMn/DOT FY09 /DOT FY09 H09PS07 Research Project TAP MeetingH09PS07 Research Project TAP Meeting
PI: PI: ErolErol TutumluerTutumluer
RA: RA: YuanjieYuanjie XiaoXiao
August 28, 2009 August 28, 2009

Research Need StatementsAggregate base materials are becoming increasingly Aggregate base materials are becoming increasingly expensive in expensive in many parts of Minnesotamany parts of Minnesota
gravel mines & rock quarries gravel mines & rock quarries are being lost are being lost to other land usesto other land uses
Aggregate Aggregate specification, production & placement are based specification, production & placement are based on testing techniques & design procedures that are several on testing techniques & design procedures that are several decades olddecades oldThere There is likely significant opportunity for better value to is likely significant opportunity for better value to be achievedbe achieved
by implementing new mechanistic design procedures & testing by implementing new mechanistic design procedures & testing techniques, road construction can better optimize material use techniques, road construction can better optimize material use & & reduce reduce wastewaste
Mechanistic pavement design and the field & lab tests Mechanistic pavement design and the field & lab tests required would be needed to implementrequired would be needed to implement
A granular material best value software tool to be added to A granular material best value software tool to be added to MnPAVEMnPAVE to further encourage implementation of mechanistic designto further encourage implementation of mechanistic design

Research Objective
Demonstrate Demonstrate that locally available materials can be that locally available materials can be economically efficient in the implementation of the economically efficient in the implementation of the available mechanistic based design procedures in available mechanistic based design procedures in Minnesota through Minnesota through
MnPAVEMnPAVE MechanisticMechanistic--Empirical Pavement Design Empirical Pavement Design MethodMethod
DDevelop the components of evelop the components of a new granular material a new granular material best value software module to be added to the best value software module to be added to the MnPAVEMnPAVE programprogram
Provide pavement designers with Provide pavement designers with index aggregate index aggregate properties linked to modulus & strength characteristics properties linked to modulus & strength characteristics and include and include example pavement designsexample pavement designs

Expected Benefits
(i)(i) Proper Proper material material selection & selection & utilization utilization according to aggregate according to aggregate properties properties
(ii)(ii) Aggregate Aggregate layer thickness optimizations layer thickness optimizations during the design during the design process based on process based on cost and mechanistic cost and mechanistic material properties material properties related to related to performance, and as a result;performance, and as a result;
(iii)(iii) More More economical economical use of the locally available aggregate materials use of the locally available aggregate materials in in MinnesotaMinnesota
The The benefits & costs benefits & costs of implementing of implementing new mechanistic new mechanistic design procedures & material testing techniques design procedures & material testing techniques would would be demonstrated by these designsbe demonstrated by these designs
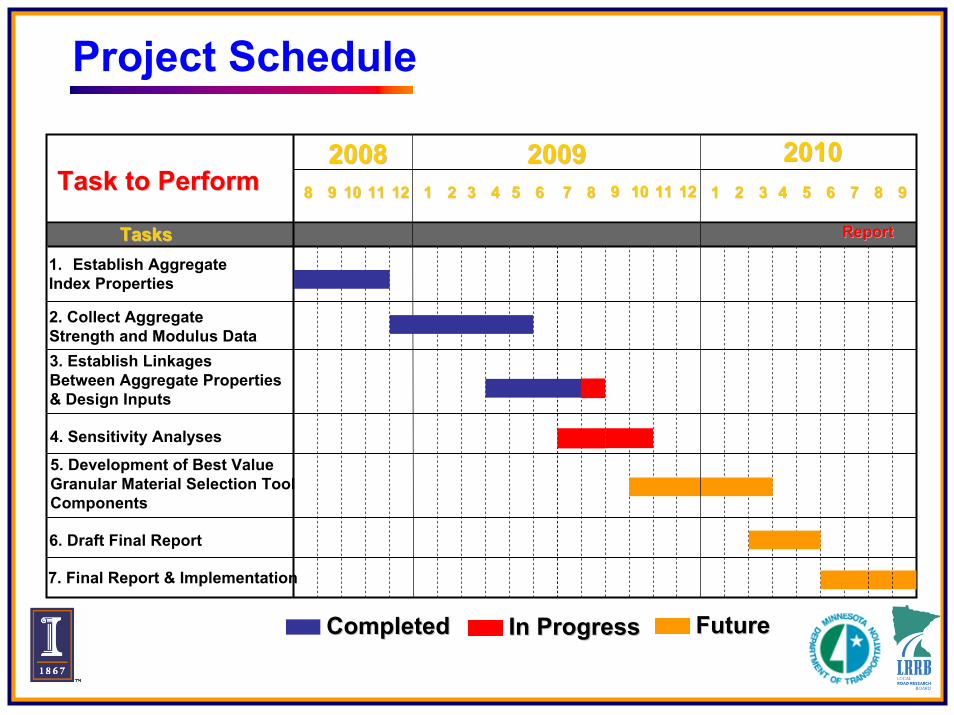
Project Schedule
Task to PerformTask to Perform
1. Establish Aggregate Index Properties
88 99 1010
ReportReport
20102010
TasksTasks
In ProgressIn ProgressCompletedCompleted
2. Collect Aggregate Strength and Modulus Data3. Establish Linkages Between Aggregate Properties & Design Inputs
4. Sensitivity Analyses
5. Development of Best Value Granular Material Selection ToolComponents
20082008
6. Draft Final Report
7. Final Report & Implementation
1111 1212 11 22 33 44 55 66 77 88 99 1010 1111 1212 11 22 33 44 55 66 77
2009200988 99
FutureFuture

Project Tasks
Task Task 1 1 -- Overview:Overview:
Establish Establish Index Properties Index Properties of Minnesota Aggregates of Minnesota Aggregates Used for Aggregate Base/Subbase CoursesUsed for Aggregate Base/Subbase Courses
Work with Mn/DOT engineers to identify & categorize Work with Mn/DOT engineers to identify & categorize the the types, sources, & properties types, sources, & properties of locally available of locally available aggregates in Minnesota and obtain aggregates in Minnesota and obtain typical coststypical costs. . This is an essential task for:This is an essential task for:
•• Identifying types & qualities of aggregates to establish Identifying types & qualities of aggregates to establish mechanistic strength & resilient modulus (Mmechanistic strength & resilient modulus (MRR) properties) properties
•• Conducting a benefit/cost study to demonstrate life cycle Conducting a benefit/cost study to demonstrate life cycle benefits & costs of these aggregate materials typically benefits & costs of these aggregate materials typically used to construct road foundations throughout Minnesotaused to construct road foundations throughout Minnesota

Project Tasks
Files received from Mn/DOTFiles received from Mn/DOTDate File Name Description
Sep.-19-08 MNagg pits utmZone15N.xlsProspectLimsMNmap.pdf
UTM Coordinates for Prospect pits
Oct.-8-08 ProspectedPits_LimsRawResnames.xls Designation explanationfor Agg tests
Oct.-16-08MnDOT agg
pit_samid_gradations_ps_tname.xlsall_pit_lims111408.xls
Agg gradation for all pits
Jan.-30-09 MnDOT MAP Agg pricesCL.pdfAggregate prices for
MnDOT owned & leased Gravel pits
Aggregate Source Information System Aggregate Source Information System (ASIS)(ASIS)http://www.mrrapps.dot.state.mn.us/gisweb/viewer.htm?activelayerhttp://www.mrrapps.dot.state.mn.us/gisweb/viewer.htm?activelayer=8=8
Task Task 1 1 –– Data Sources:Data Sources:

Project Tasks
ASIS Online Interface
ASIS Database Spreadsheets
Task Task 1 1 –– Data Sources (ContData Sources (Cont’’d):d):••Aggregate source data Aggregate source data for MN countiesfor MN counties•• Limited agg propertiesLimited agg properties•• Merged with reliable Merged with reliable data submitted data submitted

Project Tasks
Task Task 1 1 –– Data Sources (ContData Sources (Cont’’d):d):
ProspectLimsMNmap.pdf(Map of prospect pits)
MNagg pits utmZone15N.xls(UTM Coordinates of prospect pits)

Project Tasks
ProspectedPits_LimsRawResnames.xls(Designations of other aggregate tests – only gradation and Proctor data were useful)
Task Task 1 1 –– Data Sources (ContData Sources (Cont’’d):d):
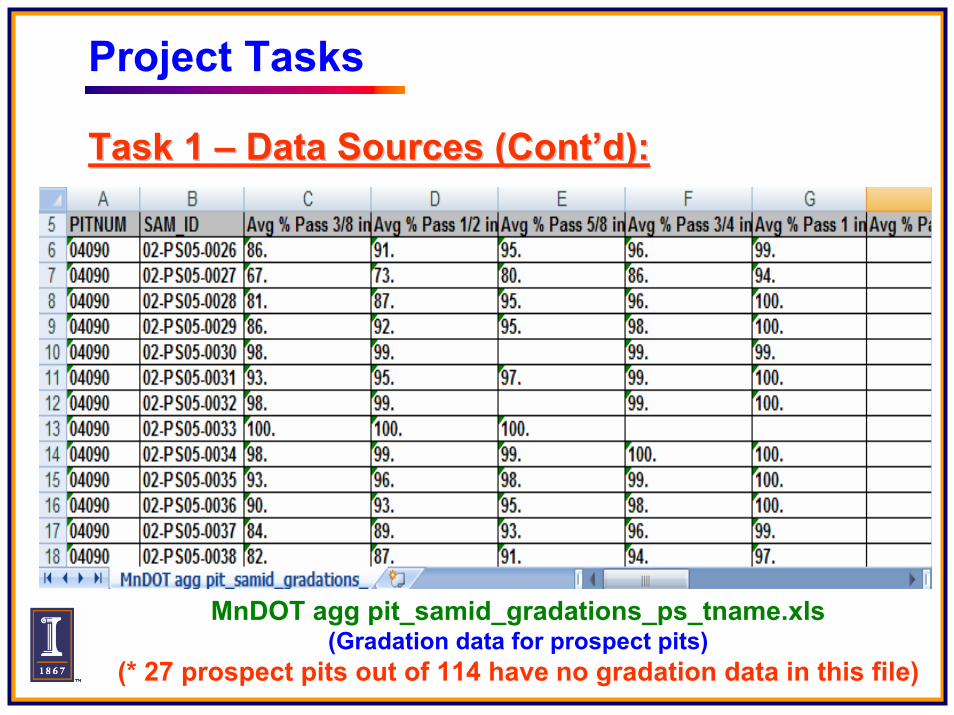
Project Tasks
MnDOT agg pit_samid_gradations_ps_tname.xls(Gradation data for prospect pits)
(* 27 prospect pits out of 114 have no gradation data in this file)
Task Task 1 1 –– Data Sources (ContData Sources (Cont’’d):d):
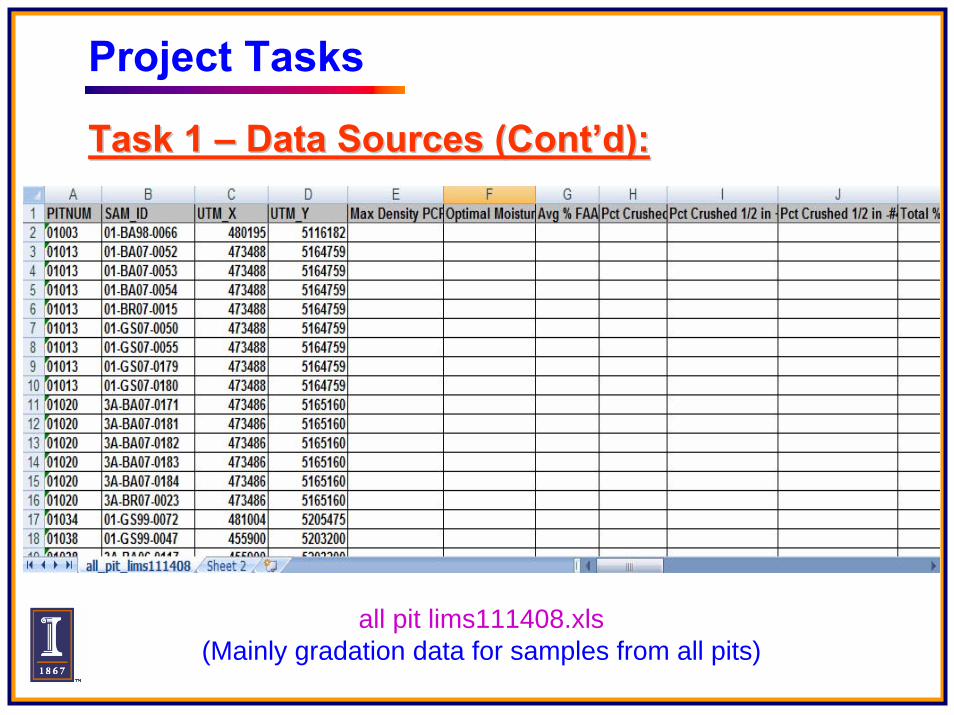
Project Tasks
Task Task 1 1 –– Data Sources (ContData Sources (Cont’’d):d):
all pit lims111408.xls(Mainly gradation data for samples from all pits)

Project Tasks
MnDOT MAP Agg pricesCL.pdf(Aggregate price reference
and hauling cost information for cost estimation)
Task Task 1 1 –– Data SourcesData Sources(Cont(Cont’’d):d):

Project Tasks
Task Task 1 1 –– Methodology:Methodology:Considering the fact that prospect pits have the most Considering the fact that prospect pits have the most reliable gradation, it was decided to use prospect pits to reliable gradation, it was decided to use prospect pits to demonstrate the research methodologydemonstrate the research methodology
MnDOT agg pit_samid_gradations_ps_tname.xls MnDOT agg pit_samid_gradations_ps_tname.xls for Gradationfor GradationMNagg pits utmZone15N.xls MNagg pits utmZone15N.xls for UTM Coordinatesfor UTM Coordinates
87 prospect pits from 34 counties were primarily 87 prospect pits from 34 counties were primarily consideredconsidered
Merged Merged gradation data gradation data of prospect pits (reliable) & other of prospect pits (reliable) & other pits with pits with ASIS database spreadsheetsASIS database spreadsheets, and included , and included other aggregate index propertiesother aggregate index properties

Project Tasks
Task Task 1 1 –– Methodology (ContMethodology (Cont’’d):d):Of those 87 prospect pits, Of those 87 prospect pits, 5656 had no cost information had no cost information recorded in ASIS database; recorded in ASIS database; default costs were thus default costs were thus estimated using the known costs of the closest pits estimated using the known costs of the closest pits
MnDOT MAP Agg pricesCL.pdf MnDOT MAP Agg pricesCL.pdf for default cost informationfor default cost information
Aggregate location, property and cost data for 87 Aggregate location, property and cost data for 87 prospect pits were all collected and built into a prospect pits were all collected and built into a GIS GIS based databasebased database for further analysis for further analysis
The typical functions of this GIS based database include The typical functions of this GIS based database include searching, storing, retrieving, and displaying datasearching, storing, retrieving, and displaying data

Task 1 – Selected Prospect Pits
• 87 prospect pits with most reliable gradation selected for demonstrating the methodology
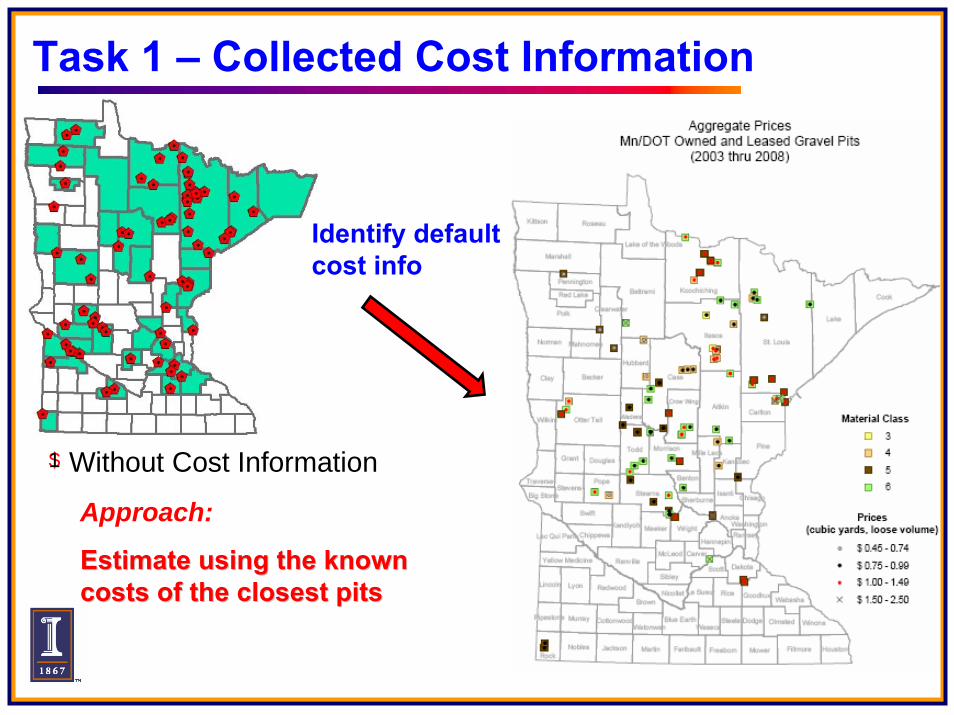
Task 1 – Collected Cost Information
$1 Without Cost Information
Identify default cost info
Approach:
Estimate using the known Estimate using the known costs of the closest pitscosts of the closest pits

Task 1 – Collected Aggregate Data• CLASS • MCLASS1
• QUAN1
• COSTCYM1
• YRPRICECL1
• MCLASS2
• QUAN2
• COSTCYM2
• YRPRICECL2
From / to ASIS
Reliable Gradations
Aggregate Location, Property & Cost Data
FromMnDOT agg pit_samid_gradations_ps_tname.xls
FromMnDOT MAPAgg pricesCL.pdf
Default Costs
FromMNagg pits utmZone15N.xls
UTM Coordinates

Task 1 – Aggregate Database Illustration
GIS based Aggregate Index Property Database
ArcGIS Functions:
• Search
• Store
• Retrieve
• Display
ArcGIS based Database Management System (DBMS) was developed for storing, retrieving and displaying aggregate index properties

Task 1 – Aggregate Database Illustration (Cont’d)
• Search for features

Passnum2001
2.5
5
7.5
10
Graphical representation of Percent Passing #200 property distribution
Task 1 – Aggregate Database Illustration (Cont’d)
• Example feature display

Costcym10.1
0.25
0.5
0.75
1
Task 1 – Aggregate Database Illustration (Cont’d)
Graphical representation of Cost per Cubic Yard property distribution
• Example feature display

Project Tasks
Task Task 1 1 -- Summary:Summary:
Details of the techniques used to establish aggregate Details of the techniques used to establish aggregate index property database will be given in final reportindex property database will be given in final report
Deliverables that have been sent include:Deliverables that have been sent include:•• Spreadsheet & Map of 87 selected prospect pitsSpreadsheet & Map of 87 selected prospect pits•• ASIS database spreadsheets for 87 Minnesota Counties ASIS database spreadsheets for 87 Minnesota Counties
merged with reliable prospect pit gradationsmerged with reliable prospect pit gradations

Project Tasks
Task Task 2 2 -- Overview:Overview:
Collect mechanistic pavement analysis & design inputs Collect mechanistic pavement analysis & design inputs as the strength & Mas the strength & MRR for unbound aggregate pavement for unbound aggregate pavement base/subbase applications, together with corresponding base/subbase applications, together with corresponding aggregate index properties aggregate index properties
LRBB Investigation 828 report (Chadbourn, 2007), LRBB Investigation 828 report (Chadbourn, 2007), Davich et al. (2004) study, Kim & Labuz (2007) report, Davich et al. (2004) study, Kim & Labuz (2007) report, other related research studies; other related research studies; a large database of a large database of previous Mprevious MRR test results by test results by the PI the PI & & data from the data from the current current Illinois DOT research project on three different Illinois DOT research project on three different types & qualities of aggregate materialstypes & qualities of aggregate materials
•• This task does not include conducting This task does not include conducting new laboratory or field new laboratory or field aggregate testsaggregate tests
Project Tasks
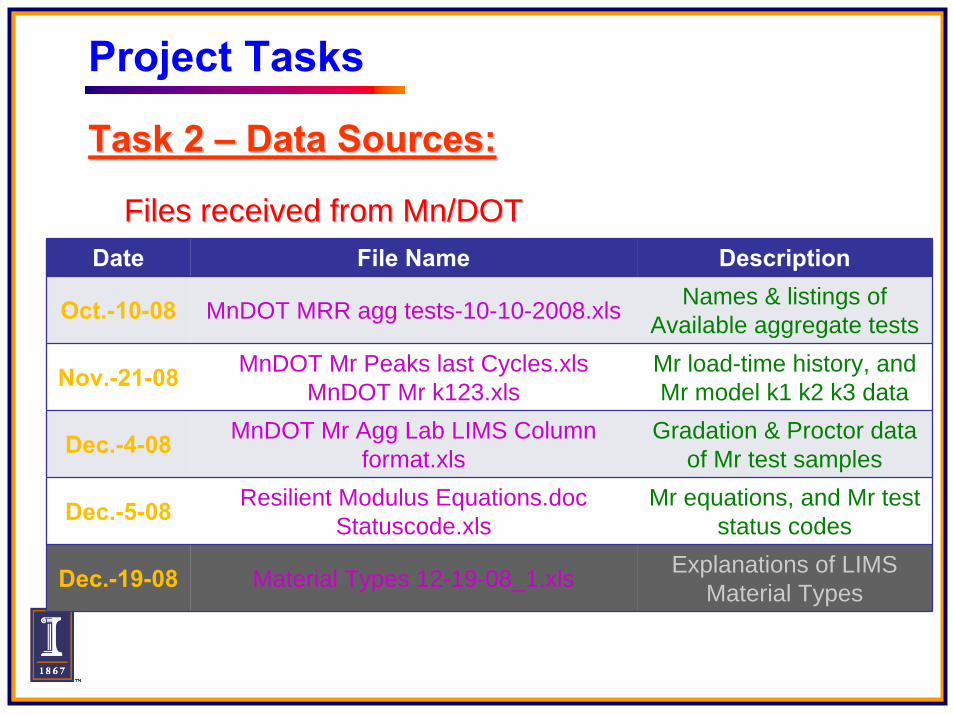
Task Task 2 2 –– Data Sources:Data Sources:
Files received from Mn/DOTFiles received from Mn/DOTDate File Name Description
Oct.-10-08 MnDOT MRR agg tests-10-10-2008.xls Names & listings of Available aggregate tests
Nov.-21-08 MnDOT Mr Peaks last Cycles.xlsMnDOT Mr k123.xls
Mr load-time history, and Mr model k1 k2 k3 data
Dec.-4-08 MnDOT Mr Agg Lab LIMS Column format.xls
Gradation & Proctor data of Mr test samples
Dec.-5-08 Resilient Modulus Equations.docStatuscode.xls
Mr equations, and Mr test status codes
Dec.-19-08 Material Types 12-19-08_1.xls Explanations of LIMS Material Types

Project Tasks
Task Task 2 2 –– Data Sources (ContData Sources (Cont’’d):d):
Resilient Modulus Equations.doc
Material Types 12-19-08_1.xls(Material type explanations)

Project Tasks
Task Task 2 2 –– Data Sources (ContData Sources (Cont’’d):d):
Statuscode.xls(Mr test status codes)

Project Tasks
Task Task 2 2 –– Data Sources (ContData Sources (Cont’’d):d):
MnDOT Mr Agg Lab LIMS Column format.xls(Gradation and Proctor data of Mr test samples)

Project Tasks
Task Task 2 2 –– Data Sources (ContData Sources (Cont’’d):d):
MnDOT Mr Peaks last Cycles.xls(Load-time history data of last 4 or 5 cycles)

Project Tasks
Task Task 2 2 –– Data Sources (ContData Sources (Cont’’d):d):
MnDOT Mr k123.xls(k values of Mr equations)

Project Tasks
Task Task 2 2 –– Data Sources (ContData Sources (Cont’’d):d):
Actual Moisture Content & Dry Density for Mr Samples

Project Tasks
Task Task 2 2 –– Data Sources (ContData Sources (Cont’’d):d):
The template for reporting Mr load-time history data

Project Tasks
Task Task 2 2 –– Data Sources (ContData Sources (Cont’’d):d):
The template for reporting index properties of Mr samples

Project Tasks
Task Task 2 2 –– Mn/DOT Database Analysis:Mn/DOT Database Analysis:
Grouped index property data by Aggregate Maximum Grouped index property data by Aggregate Maximum Sieve Size, Gradation Type (dense or gap), Percent Sieve Size, Gradation Type (dense or gap), Percent Passing No. 200 sieve, Density, etc.Passing No. 200 sieve, Density, etc.
Performed statistical analyses on MPerformed statistical analyses on MRR data with an aim data with an aim to get typical Mto get typical MRR ranges for different index property ranges for different index property groupsgroups

Project Tasks
Task Task 2 2 –– Mn/DOT Database Analysis Mn/DOT Database Analysis (Cont(Cont’’d):d):
63mm & 50mm

Project Tasks
Task Task 2 2 –– Mn/DOT Database Analysis Mn/DOT Database Analysis (Cont(Cont’’d):d):
37.5 mm

Project Tasks
Task Task 2 2 –– Mn/DOT Database Analysis Mn/DOT Database Analysis (Cont(Cont’’d):d):
31.5 mm

Project Tasks
Task Task 2 2 –– Mn/DOT Database Analysis Mn/DOT Database Analysis (Cont(Cont’’d):d):
25 mm

Project Tasks
Task 2 Task 2 –– UI Database Brief Introduction:UI Database Brief Introduction:
Databases collected from U of I previous research studiesDatabases collected from U of I previous research studies
•• RecentlyRecently--completed ICT R27completed ICT R27--1 Project:1 Project:Characterization of Illinois Aggregates for Subgrade ReplacementCharacterization of Illinois Aggregates for Subgrade Replacement and Subbaseand Subbase
•• NCHRP 4NCHRP 4--23 Project:23 Project:Performance Related Tests of Aggregates for Use in Unbound PavemPerformance Related Tests of Aggregates for Use in Unbound Pavement Layersent Layers
•• FAA P209 & P154 Granular Base Materials StudyFAA P209 & P154 Granular Base Materials StudyInvestigation of the Behavior of the FAA NAPTF P209/P154 Base/SuInvestigation of the Behavior of the FAA NAPTF P209/P154 Base/Subbase bbase
MaterialsMaterials
•• IDOT CAIDOT CA--6 & CA6 & CA--11 Materials & Effect of Fines Content 11 Materials & Effect of Fines Content StudiesStudies
Characterization of Anisotropic Granular Layer Behavior in FlexiCharacterization of Anisotropic Granular Layer Behavior in Flexible Pavementsble Pavements

Project Tasks
Task Task 2 2 –– UI Database Brief Introduction:UI Database Brief Introduction:
Studied a Studied a Laboratory Aggregate Test Matrix with typical Laboratory Aggregate Test Matrix with typical midrange midrange IDOT IDOT CACA--66 gradations for constructing aggregate gradations for constructing aggregate layers as subgrade replacement & subbaselayers as subgrade replacement & subbase
•• Aggregate type: (1) Aggregate type: (1) dolomite, dolomite, (2)(2) limestone, limestone, (3)(3) gravelgravel•• Gradation:Gradation: Midrange CAMidrange CA--66•• Fines content: Fines content: 4%, 8%, 12%, & 16% passing No. 200 sieve size4%, 8%, 12%, & 16% passing No. 200 sieve size•• PI or plasticity of fines: PI or plasticity of fines: 0% (non0% (non--plastic mineral filler) & 10% plastic mineral filler) & 10% ––
should be conducted on material passing the No. 40 sieve to be cshould be conducted on material passing the No. 40 sieve to be consistent with onsistent with IDOT procedureIDOT procedure
•• MoistureMoisture--density (compaction) condition: density (compaction) condition: At optimum moisture At optimum moisture content (OMC), 2% dry of OMC, and 2% wet of content (OMC), 2% dry of OMC, and 2% wet of OMCOMC
ICT R27-1 Project

ICT R27-1 Project: Engineered Gradations
(3)(3) gravelgravel
(1)(1) dolomitedolomite
(2)(2) limestonelimestone
4%, 8%, 12%, & 16% 4%, 8%, 12%, & 16% passing No. 200 sieve sizepassing No. 200 sieve size
Project Tasks
Task Task 2 2 -- Summary:Summary:
Collecting MCollecting MRR and strength data for establishing a and strength data for establishing a comprehensive database will be continued in the comprehensive database will be continued in the subsequent taskssubsequent tasks
Task 2 Deliverables include:Task 2 Deliverables include:•• Aggregate strength and modulus database spreadsheetsAggregate strength and modulus database spreadsheets•• Corresponding index property database spreadsheetsCorresponding index property database spreadsheets

Project Tasks
Task Task 3 3 -- Overview:Overview:
Establish Establish linkages linkages between collected field and between collected field and laboratory aggregate strength and Mlaboratory aggregate strength and MRR data and data and aggregate physical aggregate physical properties for identifying mechanistic properties for identifying mechanistic design moduli ranges design moduli ranges
•• gradation gradation •• shape, texture and angularity shape, texture and angularity •• fines contentfines content•• PI of fines, and PI of fines, and •• moisture state in relation to optimum moisture state in relation to optimum moisture (OMC) moisture (OMC)
OR density achieved in relation to maximum Proctor OR density achieved in relation to maximum Proctor density (MDD)density (MDD)

Project Tasks
Task Task 3 3 –– Data Sources:Data Sources:
File received from Mn/DOTFile received from Mn/DOT
Date File Name Description
Feb.-06-09 MnDOT samples image testing Illinois.xlsExplanation of Mn/DOT samples used for image
analysis

Project Tasks
Task Task 3 3 –– Data Sources Received:Data Sources Received:
MnDOT samples image testing Illinois.xls(Information about Mn/DOT samples for Image Analysis)

Project Tasks
Task Task 3 3 –– Data Sources Used:Data Sources Used:
Gradation and Proctor data of Mr test samples(Independent Variables)

Project Tasks
Task Task 3 3 –– Data Sources Used (ContData Sources Used (Cont’’d):d):
Actual Moisture Content & Dry Density for Mr Samples(Independent Variables)

Project Tasks
Task Task 3 3 –– Data Sources Used (ContData Sources Used (Cont’’d):d):
k parameters of MR modulus models(Dependent Variables)
Project Tasks
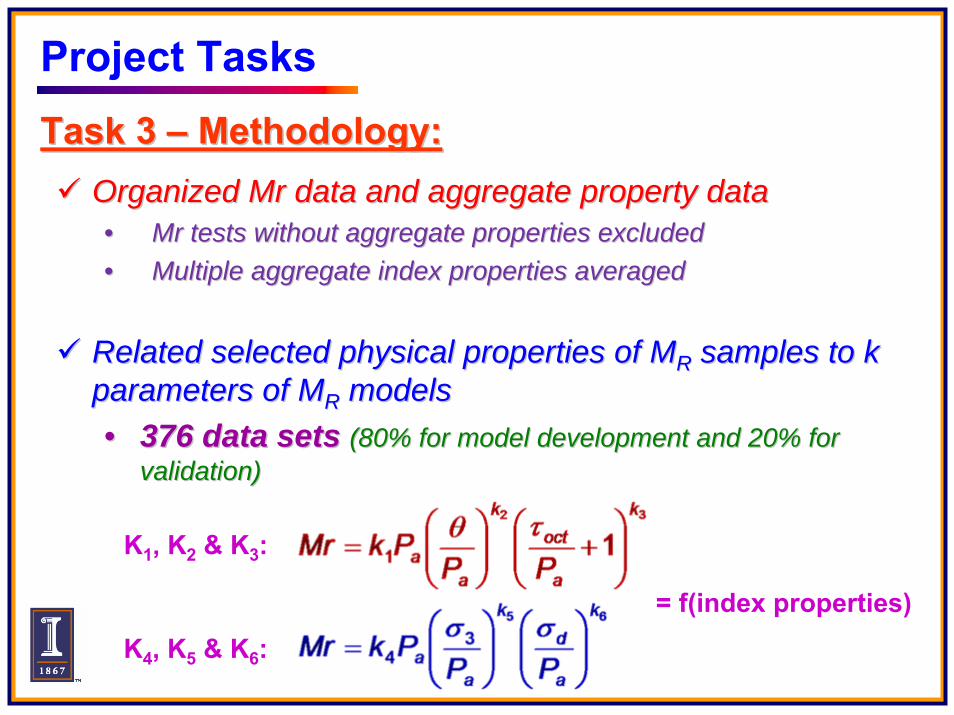
Task Task 3 3 –– Methodology:Methodology:Organized Mr data and aggregate property dataOrganized Mr data and aggregate property data•• Mr tests without aggregate properties excluded Mr tests without aggregate properties excluded •• Multiple aggregate index properties averagedMultiple aggregate index properties averaged
Related selected physical properties of MRelated selected physical properties of MRR samples to k samples to k parameters of Mparameters of MRR models models •• 376 data sets 376 data sets (80% for model development and 20% for (80% for model development and 20% for
validation)validation)
K1, K2 & K3:
K4, K5 & K6:= f(index properties)

Project Tasks
Task Task 3 3 –– Methodology (ContMethodology (Cont’’d):d):
Both Both stepwise regression analysis stepwise regression analysis and and Artificial Neural Artificial Neural Network (ANN) modeling Network (ANN) modeling techniques were appliedtechniques were applied
Results from both techniques were comparedResults from both techniques were compared

Project Tasks
Task Task 3 3 –– Stepwise Regression:Stepwise Regression:Dependent Variable Independent Variables NoteK1 X1 - OMC Optimum Moisture Content
K2 X2 - MDD Maximum Dry Density
K3 X3 - Cu Coefficient of uniformity
X4 - Cc Coefficient of curvature
X5 – PP_3" Percent passing 75mm sieve
X6 – PP_2-1/2" Percent passing 63mm sieve
X7 – PP_2" Percent passing 50mm sieve
X8 – PP_1-1/2" Percent passing 37.5mm sieve
X9 – PP_1-1/4" Percent passing 31.5mm sieve
X10 – PP_1" Percent passing 25mm sieve
X11 – PP_3/4" Percent passing 19mm sieve
X12 – PP_5/8" Percent passing 16mm sieve
X13 – PP_1/2" Percent passing 12.5mm sieve
X14 – PP_3/8" Percent passing 9.5mm sieve
X15 – PP_#4 Percent passing 4.75mm sieve
X16 – PP_#8 Percent passing 2.36mm sieve
X17 – PP_#10 Percent passing 2mm sieve
X18 – PP_#16 Percent passing 1.18mm sieve
X19 – PP_#30 Percent passing 600um sieve
X20 – PP_#40 Percent passing 425um sieve
X21 – PP_#50 Percent passing 300um sieve
X22 – PP_#100 Percent passing 150um sieve
X23 – PP_#200 Percent passing 75um sieve
SelectedIndependent
Variables
Project Tasks
Task Task 3 3 –– Stepwise Regression (ContStepwise Regression (Cont’’d):d):
RegressionResults
K1 X2 X13 X14 X15 X20 X23
K2 X2 X3 X8 X10 X18
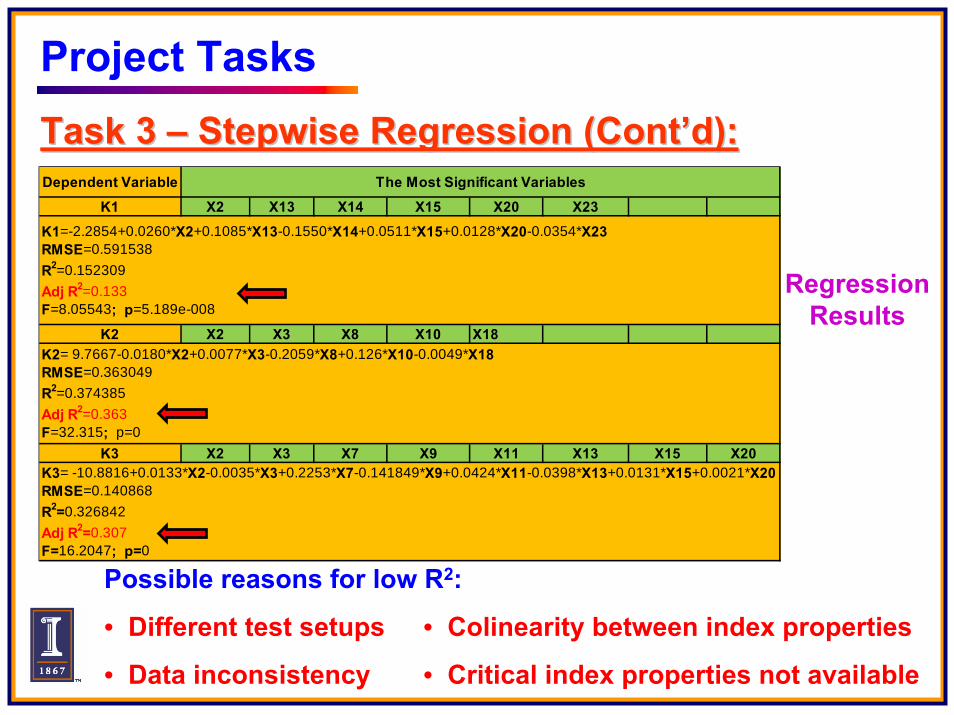
K3 X2 X3 X7 X9 X11 X13 X15 X20K3= -10.8816+0.0133*X2-0.0035*X3+0.2253*X7-0.141849*X9+0.0424*X11-0.0398*X13+0.0131*X15+0.0021*X20RMSE=0.140868R2=0.326842Adj R2=0.307F=16.2047; p=0
The Most Significant Variables
K2= 9.7667-0.0180*X2+0.0077*X3-0.2059*X8+0.126*X10-0.0049*X18RMSE=0.363049R2=0.374385Adj R2=0.363F=32.315; p=0
Dependent Variable
K1=-2.2854+0.0260*X2+0.1085*X13-0.1550*X14+0.0511*X15+0.0128*X20-0.0354*X23RMSE=0.591538R2=0.152309Adj R2=0.133F=8.05543; p=5.189e-008
Possible reasons for low R2:
• Different test setups
• Data inconsistency
• Colinearity between index properties
• Critical index properties not available

ANN Models:
K1 X1 X2 X3 X5 X7 X9 X10 X11 X12 X14 X16 X18 X24 X25 X26
K2 X2 X5 X13 X17
K3 X3 X4 X5 X6 X8 X11 X17 X18 x19 X21 X23K3= 0.4168+0.0005*X3-0.0047*X4+0.7884*X5-0.0519*X6-2.1530*X8+0.1303*X11-0.1126*X17+0.1962*X18-0.1297*X19+0.0639*X21-0.0152*X23RMSE=0.302675R2=0.574822Adj R2=0.557F=32.4469; p=0
Dependent Variable
K1=-12.5519+0.7116*X1+0.1226*X2-0.0049*X3-1.6067*X5-0.2152*X7+26.4846*X9-13.1223*X10+0.6112*X11-0.0186*X12-0.2993*X14+0.0905*X16-0.1093*X18+0.0496*X24-0.0770*X25+0.1913*X26RMSE=0.533932R2=0.332Adj R2=0.294F=8.63339; p=4.44089e-016
The Most Significant Variables
K2= -0.9477+0.0141*X2-0.2363*X5+1.2853*X13-0.0095*X17RMSE=0.146541R2=0.260615Adj R2=0.2497F=23.8802; p=1.11022e-016
R2
ANN Models (27 input Variables):
• Slightly better R2 Values
• Different covariates identified
Project Tasks
Task Task 3 3 –– Stepwise Regression vs. ANN:Stepwise Regression vs. ANN:

Project Tasks
Task Task 3 3 –– Important Aggregate Physical Properties:Important Aggregate Physical Properties:
Previous research at UIUC indicated shape properties to Previous research at UIUC indicated shape properties to have a significant impact on aggregate modulus & strengthhave a significant impact on aggregate modulus & strength
γd & %Crushed(Tutumluer, E. & Seyhan, U., 1998)
AI & ST(Tutumluer, E. & Pan, T., 2007)

Project Tasks
Task Task 3 3 –– Imaging based Shape Indices:Imaging based Shape Indices:
The University of Illinois Aggregate Image Analyzer (UIAIA) SystThe University of Illinois Aggregate Image Analyzer (UIAIA) Systemem

Project Tasks
Task Task 3 3 –– Image based Shape Indices (ContImage based Shape Indices (Cont’’d):d):
Typical Ranges and Mean Values of AI and ST Typical Ranges and Mean Values of AI and ST (Pan and Tutumluer, 2005)(Pan and Tutumluer, 2005)
2.202.201.801.80--2.902.90550550500500--650650Crushed GraniteCrushed Granite
1.601.601.201.20--1.801.80475475400400--550550Crushed Crushed LimestoneLimestone
1.201.201.001.00--1.501.50400400300300--450450Crushed GravelCrushed Gravel
0.900.900.50.5--1.201.20300300250250--350350Uncrushed GravelUncrushed Gravel
MeanMeanRangeRangeMeanMeanRangeRange
Surface Texture (Surface Texture (STST) Index) IndexAngularity Index (Angularity Index (AIAI))
Aggregate TypeAggregate Type

Project Tasks
Task Task 3 3 –– Image based Shape Indices:Image based Shape Indices:
12 samples receivedfrom Mn/DOT for Image Analysis
Very fine-graded (< 2mm)TH 47 SGB
Dark coloredTH 52 Taconite Tailings
All analyzed to develop imaging shape indices except for

Project Tasks
Task Task 3 3 –– Image based Shape Indices (ContImage based Shape Indices (Cont’’d):d):
Image Analysis Results of Mn/DOT Samples Processed using UIAIAImage Analysis Results of Mn/DOT Samples Processed using UIAIA
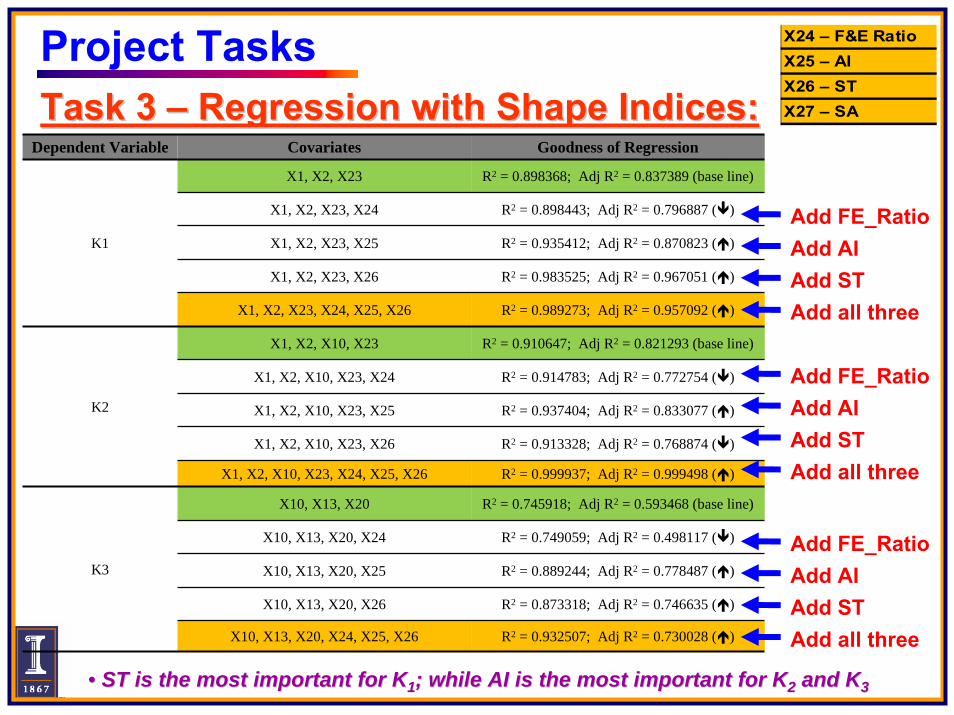
Task Task 3 3 –– Regression with Shape Indices:Regression with Shape Indices:
Add FE_Ratio
Dependent Variable Covariates Goodness of Regression
X1, X2, X23 R2 = 0.898368; Adj R2 = 0.837389 (base line)
X1, X2, X23, X24 R2 = 0.898443; Adj R2 = 0.796887 ( )
X1, X2, X23, X25 R2 = 0.935412; Adj R2 = 0.870823 ( )
X1, X2, X23, X26 R2 = 0.983525; Adj R2 = 0.967051 ( )
K1
X1, X2, X23, X24, X25, X26 R2 = 0.989273; Adj R2 = 0.957092 ( )
X1, X2, X10, X23 R2 = 0.910647; Adj R2 = 0.821293 (base line)
X1, X2, X10, X23, X24 R2 = 0.914783; Adj R2 = 0.772754 ( )
X1, X2, X10, X23, X25 R2 = 0.937404; Adj R2 = 0.833077 ( )
X1, X2, X10, X23, X26 R2 = 0.913328; Adj R2 = 0.768874 ( )
K2
X1, X2, X10, X23, X24, X25, X26 R2 = 0.999937; Adj R2 = 0.999498 ( )
X10, X13, X20 R2 = 0.745918; Adj R2 = 0.593468 (base line)
X10, X13, X20, X24 R2 = 0.749059; Adj R2 = 0.498117 ( )
X10, X13, X20, X25 R2 = 0.889244; Adj R2 = 0.778487 ( )
X10, X13, X20, X26 R2 = 0.873318; Adj R2 = 0.746635 ( )
K3
X10, X13, X20, X24, X25, X26 R2 = 0.932507; Adj R2 = 0.730028 ( )
Add AIAdd STAdd all three
Add FE_RatioAdd AIAdd STAdd all three
Add FE_RatioAdd AIAdd STAdd all three
•• ST is the most important for KST is the most important for K11; while AI is the most important for K; while AI is the most important for K22 and Kand K33
Project Tasks X24 – F&E RatioX25 – AIX26 – STX27 – SA

Project Tasks
Stepwise regression equations for KStepwise regression equations for K1 1 KK2 2 andand KK3 3 without without shape properties have low Rshape properties have low R22 valuesvaluesPredictive equations have high RPredictive equations have high R22 values only when values only when shape properties are includedshape properties are included
Typical trends in K values can be estimated for different Typical trends in K values can be estimated for different group Mgroup MRR data groups for the conditions:data groups for the conditions:
DenseDense(Achieved density>=125 pcf)(Achieved density>=125 pcf)/ loose/ loose(Achieved density<125 pcf)(Achieved density<125 pcf)
CrushedCrushed(Angularity Index AI>=400)(Angularity Index AI>=400)// uncrusheduncrushed(AI<400)(AI<400)
CoarseCoarse(Max. size>=#4)(Max. size>=#4)/ / finefine(Max. size<#4)(Max. size<#4)
CleanClean(Percent passing #200<8%)(Percent passing #200<8%)/ dirty/ dirty(Percent passing #200>=8%)(Percent passing #200>=8%)
Task Task 3 3 –– Methodology (ContMethodology (Cont’’d):d):

110.00 120.00 130.00 140.00
Density
-10.00
-5.00
0.00
5.00
10.00
K3
Project TasksTask Task 3 3 –– Grouping results (ContGrouping results (Cont’’d):d):
Dense/ LooseDense/ Loose
110.00 120.00 130.00 140.00
Density
-10.00
0.00
10.00
20.00
K1
110.00 120.00 130.00 140.00
Density
-5.00
-2.50
0.00
2.50
5.00
K2
Select 125 pcfSelect 125 pcfas density thresholdas density threshold

Project Tasks
Task Task 3 3 –– Grouping results (ContGrouping results (Cont’’d):d):
Dense/ LooseDense/ Loose 1 psi = 6.89 kPa1 psi = 6.89 kPa
NNdensedense = 136= 136NNlooseloose = 55= 55Total = 191 Total = 191
(for (for 1515 Sequences)Sequences)

Project Tasks
Task Task 3 3 –– Grouping results:Grouping results:
300.00 350.00 400.00 450.00 500.00
AI
0.00
1.00
2.00
3.00
K1
300.00 350.00 400.00 450.00 500.00
AI
0.40
0.60
0.80
1.00
K2
300.00 350.00 400.00 450.00 500.00
AI
-1.50
-1.00
-0.50
0.00
K3
K1, k2, k3 vs. AIK1, k2, k3 vs. AI(AI values from imaging of Mn/DOT samples) (AI values from imaging of Mn/DOT samples)
••43 Mr tests with AI < 400; 43 Mr tests with AI < 400;
••72 Mr tests with AI >= 400; 72 Mr tests with AI >= 400;
••Total = 115 Total = 115
Crushed/ UncrushedCrushed/ Uncrushed
Project Tasks
Task Task 3 3 –– Grouping results (ContGrouping results (Cont’’d):d):
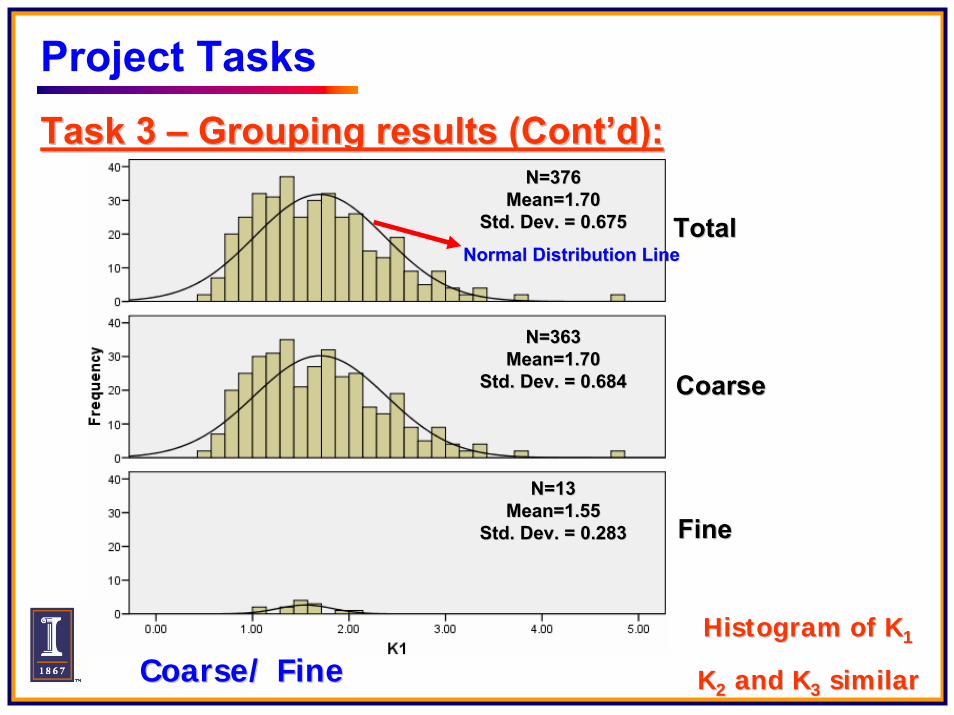
Histogram of KHistogram of K11
KK22 and Kand K33 similarsimilar
Coarse/ FineCoarse/ FineTotalTotal
CoarseCoarse
FineFine
Coarse/ FineCoarse/ Fine
N=376N=376Mean=1.70Mean=1.70
Std. Dev. = 0.675Std. Dev. = 0.675
N=363N=363Mean=1.70Mean=1.70
Std. Dev. = 0.684Std. Dev. = 0.684
N=13N=13Mean=1.55Mean=1.55
Std. Dev. = 0.283Std. Dev. = 0.283
Normal Distribution LineNormal Distribution Line

Project Tasks
Task Task 3 3 –– Grouping results (ContGrouping results (Cont’’d):d):
K1, K2, K3 vs. PP#200 (%)K1, K2, K3 vs. PP#200 (%)•• 257 Mr tests with PP#200 < 8%; 257 Mr tests with PP#200 < 8%;
•• 119 Mr tests with PP#200 >= 8%; 119 Mr tests with PP#200 >= 8%;
••Total = 376Total = 376
Clean/ DirtyClean/ Dirty
5.00 10.00 15.00 20.00
-2.00
-1.00
0.00
1.00
2.00
5.00 10.00 15.00 20.00
-4.00
-2.00
0.00
2.00
4.00
5.00 10.00 15.00 20.00
-4.00
0.00
4.00
8.00
PP#200 (%)PP#200 (%)PP#200 (%)PP#200 (%)PP#200 (%)PP#200 (%)

For ICT R27For ICT R27--1 project results, two primary procedures 1 project results, two primary procedures were conducted using were conducted using SASSASRR (Statistical Analysis Software) (Statistical Analysis Software) to to develop the best models for predicting Kdevelop the best models for predicting K--parametersparameters::
ANOVA (Analysis of Variance) ANOVA (Analysis of Variance) Stepwise regressionStepwise regression
The ANOVA is a common method to study the effect of The ANOVA is a common method to study the effect of treatments or independent variables treatments or independent variables (aggregate properties (aggregate properties in the test matrix herein) in the test matrix herein) on some dependent variables on some dependent variables (K(K11, K, K22, , ……, K, K66 herein)herein)
Task 3 – ICT R27-1 SASR ANOVA Results:

From the plot, it can be seen that the mean K1 values are different for different AI values.
The p-value (<0.0001) from ANOVA is less than 0.05 (alpha level selected at this stage)
Therefore, AI value has a significant effect on K1
α = 0.05 probability of Type –I error
Task 3 – ICT R27-1 SASR ANOVA Results:

α = 0.05 probability of Type –I error
Source DF Type I SS Mean Square
F Value Pr > F
ST 2 1.33096 0.6654799 18.29 <.0001
From the plot, it can be seen that the mean K1 values are different for different ST values.
The p-value (<0.0001) from ANOVA is less than 0.05 (alpha level selected at this stage)
Therefore, ST value does have a significant effect on K1
Task 3 – ICT R27-1 SASR ANOVA Results:

Task 3 – ICT R27-1 IDOT Project ResultsST for LimestoneST for Limestone ST for GravelST for Gravel
AI for LimestoneAI for Limestone AI for GravelAI for Gravel

α = 0.05 probability of Type –I error
From the plot, it can be seen that the mean K1 values corresponding to each optimum moisture content, demonstrate a roughly increasing pattern
The p-value (=0.0001) from ANOVA is less than 0.05 (alpha level selected at this stage)
Therefore, Optimum Moisture Content (OMC) has a significant effect on K1
Task 3 – ICT R27-1 SASR ANOVA Results:

α = 0.05 probability of Type –I error
From the plot, it can be seen that the mean K1 values corresponding to each Cu, demonstrate a roughly decreasing pattern
The p-value (=0.0009) from ANOVA is less than 0.05 (alpha level selected at this stage)
Therefore, coefficient of uniformity (Cu) has a significant effect on K1
Task 3 – ICT R27-1 SASR ANOVA Results:

α = 0.05 probability of Type –I error
From the plot, it can be seen that the mean K1 values corresponding to each fines content, demonstrate a roughly decreasing pattern
The p-value (=0.0009) from ANOVA is less than 0.05 (alpha level selected at this stage)
Therefore, fines content (passing #200 sieve) has a significant effect on K1
Task 3 – ICT R27-1 SASR ANOVA Results:

α = 0.05 probability of Type –I error
From the plot, it can be seen that the mean K1 values corresponding to Plastic/Non-Plastic, do not demonstrate any particular pattern.
The p-value (=0.2773) from ANOVA is greater than 0.05
Therefore, Plastic/Non-Plastic fines categories do not have a significant effect on the value of K1
Task 3 – ICT R27-1 SASR ANOVA Results:
Project Tasks
Task Task 3 3 -- Summary:Summary:
Correlations developed between collected laboratory Correlations developed between collected laboratory MMRR data and aggregate index properties. Certain trends data and aggregate index properties. Certain trends were verified with ICT R27were verified with ICT R27--1 project findings.1 project findings.
Task 3 Deliverables include:Task 3 Deliverables include:•• Developed stepwise regression equations for predicting Developed stepwise regression equations for predicting
K model parameters from aggregate physical propertiesK model parameters from aggregate physical properties•• Image analysis results and improved correlations for 12 Image analysis results and improved correlations for 12
samples received from Mn/DOTsamples received from Mn/DOT•• Comparisons between stepwise regression equations and Comparisons between stepwise regression equations and
LTPP equationsLTPP equations
Project TasksTask Task 4 4 -- Overview:Overview:
Conduct sensitivity analyses for mechanistic design Conduct sensitivity analyses for mechanistic design moduli inputs & seasonal pore suction resistance moduli inputs & seasonal pore suction resistance factors for different Mn/DOT aggregate classes using factors for different Mn/DOT aggregate classes using the MnPAVE program to generate pavement life the MnPAVE program to generate pavement life expectanciesexpectancies
Relative importance of all Relative importance of all pavement pavement design input design input parameters will be better understoodparameters will be better understood
•• guidelines will be established to choose a range of design guidelines will be established to choose a range of design moduli for different Mn/DOT aggregate classes moduli for different Mn/DOT aggregate classes
•• target values for strength, modulus & thickness will be target values for strength, modulus & thickness will be recommended for different design scenarios involving recommended for different design scenarios involving various types & qualities of locally available aggregate various types & qualities of locally available aggregate materialsmaterials

Project TasksTask Task 4 4 -- Methodology:Methodology:
Aggregate properties that may significantly affect MAggregate properties that may significantly affect MRRwere identified from both Mn/DOT & ICT R27were identified from both Mn/DOT & ICT R27--1 data:1 data:
•• AI &/ or ST AI &/ or ST •• Optimum moisture content (OMC)Optimum moisture content (OMC)•• Maximum Dry Density (MDD)Maximum Dry Density (MDD)•• Coefficient of Uniformity (CCoefficient of Uniformity (Cuu))•• Percent Passing #200 (% fines)Percent Passing #200 (% fines)
Different design scenarios considered for Mn/DOT:Different design scenarios considered for Mn/DOT:•• Dense & Loose (Achieved Dense & Loose (Achieved γγdd))•• AI/ ST or Crushed & Uncrushed (AI/ ST or Crushed & Uncrushed (find Kfind K1,2,31,2,3 trendstrends))•• Clean & Dirty (PP#200)Clean & Dirty (PP#200)•• Coarse & FineCoarse & Fine•• Dry, Opt. and Wet of OMCDry, Opt. and Wet of OMC

Project TasksTask Task 4 4 –– Methodology (ContMethodology (Cont’’d):d):
For those cases developed, effects of changing For those cases developed, effects of changing aggregate properties on Kaggregate properties on K11, K, K22 , K, K33 and hence Mand hence MRRmechanistic design inputs will be investigatedmechanistic design inputs will be investigated
Default values of KDefault values of K11, K, K22 , and K, and K33 will be recommended; will be recommended; MMRR values at typical stress states suggested by NCHRP values at typical stress states suggested by NCHRP 11--28A will be predicted28A will be predicted
Comprehensive matrix of design moduli and seasonal Comprehensive matrix of design moduli and seasonal pore suction resistance factors will be used to conduct pore suction resistance factors will be used to conduct MnPAVE analyses and identify the sensitivity of the MnPAVE analyses and identify the sensitivity of the design inputs to pavement life expectanciesdesign inputs to pavement life expectancies

Project Tasks
Task Task 5 5 -- Overview:Overview:
Develop a best value software tool to incorporate into Develop a best value software tool to incorporate into the MnPAVE program and the MnPAVE program and implement implement mechanistic mechanistic pavement design concepts in aggregate pavement design concepts in aggregate selection/utilizationselection/utilization
Aggregate MaterialAggregate MaterialResource Resource Map similar to Map similar to Soil Class MapSoil Class Map
•• sourcesource•• type type •• qualityquality•• impact on Mimpact on M--E designE design

Project Deliverables
A A Final ReportFinal Report will be prepared at the end of the will be prepared at the end of the 22--year study to include all research findingsyear study to include all research findings
Revised MnPAVE Manual Revised MnPAVE Manual pages will be prepared pages will be prepared for for The Best Value Software Tool The Best Value Software Tool by giving by giving examples on how to use the developed correlations examples on how to use the developed correlations and mechanistic design moduli inputsand mechanistic design moduli inputs
The ultimate benefit:The ultimate benefit: More economical use More economical use of the locally available aggregate materials in of the locally available aggregate materials in MinnesotaMinnesota

Thank you!..Thank you!..