bern h-axis washing study
TRANSCRIPT

������������
�������� �
�����������
������������
����������������������������
����� �
!�"�������������#������
(
$��% �&''- i -

- ii -
This report has been reproduced directly from the best availablecopy.
Available to DOE and DOE contractors from the Office of Scientificand Technical Information, P.O. Box 62 Oak Ridge, TN 37831;prices available from (423) 576-8401, FTS 626-8401.
Available to the public from the National Technical InformationService, U.S. Department of Commerce, 5285 Port Royal Rd.,Springfield, VA 22161.
Report is also available on the internet at address:www.energystar.gov.
This report was prepared as an account of work sponsored by anagency of the United States Government. Neither the United StatesGovernment nor any agency thereof, nor any of their employees,makes any warranty, express or implied, or assumes any legalliability or responsibility for the accuracy, completeness, orusefulness of any information, apparatus, product, or processdisclosed, or represents that its use would not infringe privatelyowned rights. Reference herein to any specific commercial product,process, or service by trade name, trademark, manufacturer, orotherwise, does not necessarily constitute or imply its endorsement,recommendation, or favoring by the United States Government orany agency thereof. The views and opinions of authors expressedherein do not necessarily state or reflect those of the United StatesGovernment or any agency thereof.
The Oak Ridge National Laboratory is operated by LockheedMartin Energy Research Corp. for the U.S. Department of Energyunder Contract No. DE-AC05-96OR22464.
- iii -
ACKNOWLEDGEMENTS
The authors would like to acknowledge Karen Aeschliman, Melvin Ahlquist, the Lik-HomeApartments, Wilfred Strahm, Jeff and Kim Baumgartner, John and Lori Baumgartner, Jay andHeidi Baumgartner, the Bern Meat Plant, Mr. and Ms. Ralph Bucher, Phillip Cepuran, Ron andLinda Creed, Pauline Curless, Ferne Cutshall, Julia and Richard Dawdy, Jocelyn Dunmire, JudithEdelman, Elizabeth Ehrsam, Tom Eisenbarth, Lois Enneking, Arlene Esslinger, Dennis and GertyEsslinger, Jan and Jay Fankhauser, Theresa Feldkamp, Randy and Cindy Frey, Jim and Kay Frey,Robert Griffith, Joyce Grose, Betty Grossenbacher, Steve and K'Lynne Gugelman, Ben J. Hall,Roger Hanni, Steve and Lois Hartter, Neil and Evelyn Hartter, Chris Hartter, Jeff and MelindaHass, Leon Haverkamp, Franci Haverkamp, Alan and Ronda Haverkamp, Marie Heiniger, MavisHeiniger, Ken and Karla Hildebrand, James Huls, John Hundley, Harold A. Hunzeker, Roger andRowena Kaster, Eldon Kaster, David and Lulu Korber, Tim and Yvonne Krehbiel, Leata Kuenzi,Ardena Kuenzi, Joyce and Dale Dorsch, Pearl Lear, Loyd Lockhart, Mike Lockhart, David andMarjorie Lortscher, Gary and Betty Lortscher, Theodore and Marci Rottinghaus, RobertMarthaler, Robert and Mary Haverkamp, Jr., Sara Meier, Robert and Janet Meyer, Larry Meyer,Holly Meyer, Jim and Kristin Meyer, Steve and Kaye Meyer, Dennis Meyer, Ms. Keith Meyer,Earl and Darlene Meyer, Terry and Nancy Miller, Steve Montgomery, Leon and Karen Mosteller,Eleanor Mosteller, Robert and Cindy Myers, Kathy Nissen, Lyn and Dean Parkinson, Nita Peretti,Dema Ralston, Roy Ralston, Jeannie Rosengarten, Valerie A. Rick, Mr. and Ms. Bill Saville, theBern High School, Sheila Huls, Manager of the Bern Hair Shack, James and Margie Sheik, Billand Terry Sheik, Randy and Sondra Badertscher, Donald Young, Sr., Dan Stallbaumer, Wilfredand Verona Strahm, Mr. and Ms. Elwin Strahm, Lynette and Ed Strathman, Marvin and SherriStreit, Arnold Streit III, Jim and Betty Sudbeck, Eugenia Swart, Patty Thomason, the Bern-Sabetha Vet Clinic, Orville Walker, Pamela Walker, Mary Weaver, Darryl and Lori Wetzel, GaryWilson, and Laurie Wilson for their participation in the study. Without their commitment togathering data on each load of laundry done through this 5-month data collection period, thisstudy could not have been possible. Three Bern residents Betty Lortscher, Diane Fitzgarrald, andTim Krehbiel deserve special recognition, for they provided an important liaison between theproject managers and the study participants. We would also like to thank the Kansas Rural WaterAssociation and its executive director, Mr. Elmer Ronnebaum for suggesting Bern as anappropriate site for the field study and for working with the project principals on many occasionsto make the project a success.
The authors would also like to express gratitude to Maytag Appliances for providing thehorizontal-axis washers (Neptune models) for use in phase II of the study. Maytag contributedthese washers along with other items needed for the field study as part of a Cooperative Researchand Development Agreement (CRADA) between Maytag and Lockheed Martin Energy ResearchCorporation, manager of Oak Ridge National Laboratory.
The authors would also like to thank Marc LaFrance and Bill Noel of the U.S. Department ofEnergy for their help and support in this project.
Finally, we would like to thank the U.S. Bureau of Reclamation, in particular Cliff Pugh and JoeLyons for helping with the design of the experiment, providing some of the instrumentationneeded by the participants, and for metering and evaluating Bern’s water use during the twoSuperWash Saturdays.
Without the help and assistance of these organizations and individuals, the project would not havebeen possible.
- iv -
CONTENTS
ACKNOWLEDGEMENTS ........................................................................................................... iiiLIST OF FIGURES..........................................................................................................................vLIST OF TABLES ..........................................................................................................................vi
EXECUTIVE SUMMARY............................................................................................................viiABSTRACT....................................................................................................................................ixGLOSSARY.....................................................................................................................................x
1. OVERVIEW AND OBJECTIVE OF THE FIELD STUDY ..............................................1
2. HOW THE STUDY WAS CONDUCTED.........................................................................2
3. INITIATING THE PROJECT ............................................................................................23.1 SITE SELECTION CRITERIA .............................................................................23.2 SITE SELECTION PROCESS ..............................................................................33.3 BERN, KANSAS ...................................................................................................33.4 PARTICIPANT SELECTION ...............................................................................73.5 EXPERIMENTAL DESIGN................................................................................10
3.5.1 Instrumentation .......................................................................................113.5.2 Schedule ..................................................................................................13
3.6 DATA COLLECTION AND ANALYSIS PROCEDURE..................................13
4. OVERALL FINDINGS AND IMPACTS.........................................................................164.1 IMPACTS ON LOAD SIZE ................................................................................164.2 WATER CONSUMPTION..................................................................................174.3 ENERGY CONSUMPTION................................................................................194.4 DETERGENT USE AND CONSUMPTION ......................................................234.5 IMPACTS ON USE OF OTHER ADDITIVES...................................................264.6 IMPACTS ON LAUNDRY HABITS..................................................................264.7 IMPACTS ON WASHER SETTINGS................................................................264.8 CLEANING PERFORMANCE ..........................................................................274.9 IMPACTS ON LOAD DAMPNESS ..................................................................284.10 IMPACTS ON DRYING HABITS......................................................................304.11 MUNICIPAL UTILITY IMPACTS.....................................................................30
5. ANALYSES OF FINDINGS AND IMPACTS ................................................................355.1 WATER CONSUMPTION..................................................................................355.2 CLEANING PERFORMANCE...........................................................................385.3 MOISTURE REMOVAL PERFORMANCE ......................................................44
6. CONCLUSIONS...............................................................................................................49
APPENDIX A. WATER METER MODIFICATION .................................................................A.1APPENDIX B. EXAMPLES OF REPORTS TO PARTICIPANTS ...........................................A.2
Initial Phase I Report .............................................................................................................A.3Interim Phase II Report..........................................................................................................A.5Phase I and II Comparison Report (third page of).................................................................A.7Letter Accompanying Comparison Report ............................................................................A.8
APPENDIX C. INTEGRITY AND QUALITY OF DATA.......................................................A-11

- v -
FIGURES
3.1 Panorama view of Bern, Kansas (from grain elevator) ............................................................. 43.2 H-axis washer with study participant Jill Meyer....................................................................... 53.3 Washer manufacturer representative: Mike Cox....................................................................... 53.4 Bern study liaison team: Betty Lortscher, Tim Krehbiel, Diane Fitzgarrald ............................ 53.5 Downtown area and local industries in Bern ............................................................................ 63.6 Dependence of loads washed per week on household size (pre-study estimates)..................... 83.7 Clothes washer market in the U.S. and in Bern ........................................................................ 93.8 Typical clothes washer ages....................................................................................................103.9 Datasheets for phase I (in background) and phase II (foreground) of the study ..................... 124.1 Distribution of load weights in phase I and II ......................................................................... 164.2 Average water consumption by participant for phases I and II............................................... 184.3 Distribution of water use in phases I and II............................................................................. 194.4 Average washer energy use by participant for phases I and II................................................ 214.5 Distribution of energy use in phases I and II........................................................................... 224.6 Average water and energy consumed by phase I and II washers ............................................ 224.7 Distribution of detergent brands A-F and Tide HE in phases I and II..................................... 244.8 Detergent use by load.............................................................................................................. 254.9 Changes in detergent concentration ........................................................................................ 254.10 Distribution of wash loads through the week.......................................................................... 274.11 Temperature utilization factors for phases I and II ................................................................. 274.12 Overall satisfaction with cleaning performance...................................................................... 294.13 Overall satisfaction with dampness......................................................................................... 294.14 How loads were dried.............................................................................................................. 304.15 Bern’s 50,000-gallon tank....................................................................................................... 314.16 Rural water district standpipe (Nemaha County) .................................................................... 314.17 Water utilization in Bern during first superwash Saturday, 6/28/97 for phase I washers ....... 334.18 Water utilization in Bern and RWD during first superwash Saturday, 6/28/97 for phase I
washers.................................................................................................................................... 334.19 Collective water consumption of participants’ washers during both SWSs............................ 345.1 Washing factors that determine water consumption ............................................................... 365.2 Impact of load weight on water consumption and savings produced...................................... 375.3 Impact of detergent type/concentration on average water use ................................................ 375.4 Washing factors that affect customer satisfaction................................................................... 385.5 Dependence of cleaning satisfaction of phase I washer on its vintage.................................... 405.6 Dependence of cleaning satisfaction of phase II washer based on experience with phase I
washer (by vintage) ................................................................................................................. 405.7 Relative cleaning performance of phase I washers versus initial soiled level of laundry....... 425.8 Relative cleaning performance of phase II washers versus initial soiled level of laundry...... 435.9 Dependence of cleaning satisfaction on detergent in phase II ................................................ 445.10 Changes in satisfaction with cleaning performance of phase I and II washers ....................... 455.11 Washing factors that affect customer satisfaction................................................................... 455.12 Dependence of dampness satisfaction with load weight for phase II...................................... 465.13 Dependence of dampness satisfaction with load weight for phase I ....................................... 475.14 Dependence of dampness satisfaction on max. extract and extra rinse cycles (phase II
washers) .................................................................................................................................. 475.15 Dependence of remaining moisture content on load weight ................................................... 486.1 Projected impact of washer replacement on water consumption ............................................ 506.2 Projected impact of washer replacement on energy consumption .......................................... 51
- vi -
TABLES
3.5.2 Project Schedule for Bern Study ........................................................................................ 134.1 Average Energy and Water Consumption in Phases I and II ............................................. 23C.1 Completeness of Phase I and II Data Records ................................................................A.12C.2 Quality (percent of total records) of Phase I and II Hot and Cold Water Calculations...A.13C.3 Quality (percent of total records) of Phase I and II Pre-Wash and Post-Wash Weight
Calculations.....................................................................................................................A.14
- vii -
EXECUTIVE SUMMARY
It comes as a surprise to many that conventional domestic clothes washers use about 40 gallons ofwater – water weighing more than 300 pounds – to wash a load of clothes which typically mayweigh only 7 pounds. This fact combined with knowledge that, on average, U.S. homes washabout one wash load each day, makes automatic clothes washers one of the highest end-uses ofwater in today’s homes. About 35 billion loads of laundry are washed annually in the U.S. andthis consumes 2.6% of the total residential energy use1. Only a relatively small amount of energyis used by the clothes washer itself to operate the motor and controls. A much larger componentis in the energy needed to heat the water used by the washer and in the energy needed to dryclothes once they have been washed. Consequently, washers that have low hot waterrequirements and have effective spin cycles to remove moisture from the clothing therebyreducing the energy needed by the dryer, tend to be efficient and as long as the laundrythroughput (load size) is not compromised, will use less water and energy.
Most clothes washers produced for the U.S. consumer are vertical axis (v-axis) washers with acentral agitator. While there are variations, most v-axis washers suspend the clothes in a tub ofwater for washing and rinsing. As an alternative, the horizontal axis (h-axis) washer tumbles thewash load repeatedly through a small pool of water at the bottom of the tub to produce the neededagitation. This tends to reduce the need for both hot and cold water. The h-axis washer, popularin Europe, has a very limited market share in the U.S. at present. Yet, estimates have shown thata large quantity of energy and water could be saved through the replacement of conventional v-axis washers with the h-axis design. The objectives of this project were:
• to evaluate the energy and water savings of high-efficiency, h-axis washers in acommunity which has been converted to the new design,
• to demonstrate the findings, and• to develop information helpful to utilities (energy and water) and others with an
eye towards moving the current clothes washer market to higher efficiencyoptions. This project is a key element under the DOE ENERGY STAR markettransformation program.
The small town of Bern, Kansas (population approximately 200) was selected for this project.During phase I of the study, 103 clothes washers in the town and surrounding Rural WaterDistrict were instrumented so that data on customer profiles, laundry habits, laundry throughput(loads and load weight), and energy and water consumption could be measured. Following atwo-month data collection period, all of the washers were replaced by new, h-axis clotheswashers, and the experiment continued for an additional three-month period. Overall, detaileddata were collected and analyzed on more than 20,000 loads and nearly 70 tons of wash done byall of the participants over a wide range of real-world conditions.
Overall, it was found that the changeover to the h-axis washer reduced the average waterconsumption from 41.5 gallons/load to 25.8 gallons/load – a water savings of about 38%. The h-axis washer’s energy consumption including washer energy and hot water energy fell by 58% dueto hot water savings and the impact of a highly efficient motor in the h-axis. The remainingmoisture content of damp loads removed from the h-axis washers was, on average, 7% lower thanfor loads removed from participants’ phase I v-axis washers, and this would tend to improve theenergy savings from the changeover still further. 1 “Revolution, Not Agitation: A New Spin on Clothes Washing”, Home Energy, Vol. 13, No. 6,November/December 1996, pp. 7-8.

- viii -
The data and subsequent analyses also showed that across all loads, temperature settings, use ofdetergent and other additives, participants found the cleaning performance of the h-axistechnology to be generally superior to their phase I v-axis washer irrespective of its age.Participants seemed to adapt easily to the h-axis design, and laundry habits (average load weights,detergent use, how loads were dried, when loads were washed during the week, wash/rinsetemperatures and other factors) remained largely unchanged from phase I to phase II.
These findings demonstrate convincingly that the tumble-action technology (h-axis design) ismuch more energy and water-efficient than the technology present in clothes washers found in thefield today. Taken together, these findings suggest that a changeover to h-axis technologydelivers large savings in energy and water to the customer with an improvement in cleaningperformance and utility.
- ix -
ABSTRACT
The U.S. market for domestic clothes washers is currently dominated by conventional, verticalaxis washers, which typically require about 40 gallons of water for each load. Although small foran individual load, the fact that 35 billion loads of laundry are washed annually in the U.S. resultsin a substantial quantity of water and energy use. Although much smaller, today=s market forhigh-efficiency clothes washers which use much less water and energy is growing albeit slowly asmanufacturers are making washers based around tumble-action, horizontal axis designs available,information about their performance and benefits is being developed, and consumers are madeaware of these benefits.
To help build awareness of these benefits and to accelerate markets for high-efficiency washers,DOE, under its Energy Star Program and in cooperation with Maytag Appliances, conducted afield-evaluation of high-efficiency washers using Bern, Kansas (population approximately 200)as a test bed. Baseline washer performance data as well as customer washing behavior wereobtained from data collected on the existing washers of more than 100 participants in thisinstrumented study. Following a 2-month initial study period, all conventional washers werereplaced by high-efficiency, tumble action washers, and the experiment continued for another 3-month period. Based on measured data from over 20,000 loads of laundry, the impact of thewasher replacement on (1) individual customers= energy and water consumption, (2) customers=laundry habits and perceptions, and (3) the community=s water supply and waste water systemswere determined and are reported.
- x -
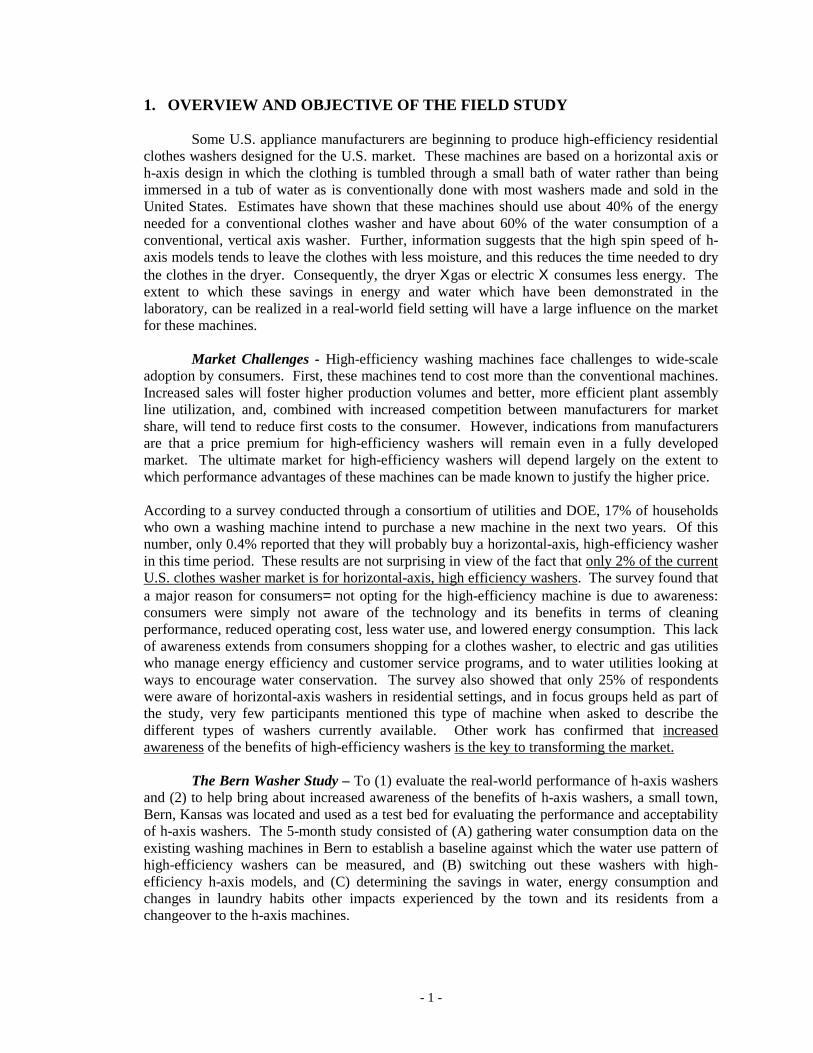
GLOSSARY
btu British thermal unit or 3.6 million joules of energyC/C Temperature setting of washer set on cold water wash and cold water
rinseCold Cold water use of washerCRADA Cooperative research and development agreementDOE U.S. Department of EnergyField Field data or data collected in a “real world” setting such as a
person’s home rather than in a tightly-controlled laboratory settinggal or gals A measure of water use in gallons. One gallon is equivalent to
3.7854 litersGallons/load Gallons of water use per number of loads by the washergpm Gallons per minute refers to the rate of water use (gallons) over a
minute time periodH/C Temperature setting of washer set on hot water wash and cold water
rinseH-axis Horizontal-axis washer design in which the axis of rotation of the
washer drum is horizontal to the floor on which the washer sitsHot Hot water use of washerI.D. Identification number or customer number assigned to each
participant in the studykWh Kilowatt-hour of energy use equivalent to 3413 BtuLb or lbs A pound which is a measurement of weight equal to 2.2046
kilogramsLoad or load cycle orcycle
A complete wash/rinse/spin cycle of a washer or a complete cleaningof dirty clothes
ORNL Oak Ridge National Laboratory, Oak Ridge, Tennessee, managed byLockheed Martin Energy Research Corp. for the U.S. DOE
oz Ounce or a unit of weight equal to one-sixteenth of a pound orapproximately 28.35 grams.
Phase I First two months of the Bern Washer Study using conventional v-axis washers
Phase II Last three months of the Bern Washer Study using new h-axiswashers
RMC Remaining moisture content or moisture remaining in the cleanedlaundry after completing the washer’s final spin cycle
RWD Rural water districtSWS Superwash Saturdays which were two high impact wash days
conducted on June 28th for phase I and September 13th for phase IITotal water Hot plus cold water use of washer combinedTUF Temperature utilization factor which refers to the percent of loads
washed at various wash/rinse washer temperature settingsV-axis Vertical axis (conventional washer design) in which the axis of
rotation of the washer agitator is vertical to the floorW/C Temperature setting of washer set on warm water wash and cold
water rinseW/W Temperature setting of washer set on warm water wash and warm
water rinse
- 1 -
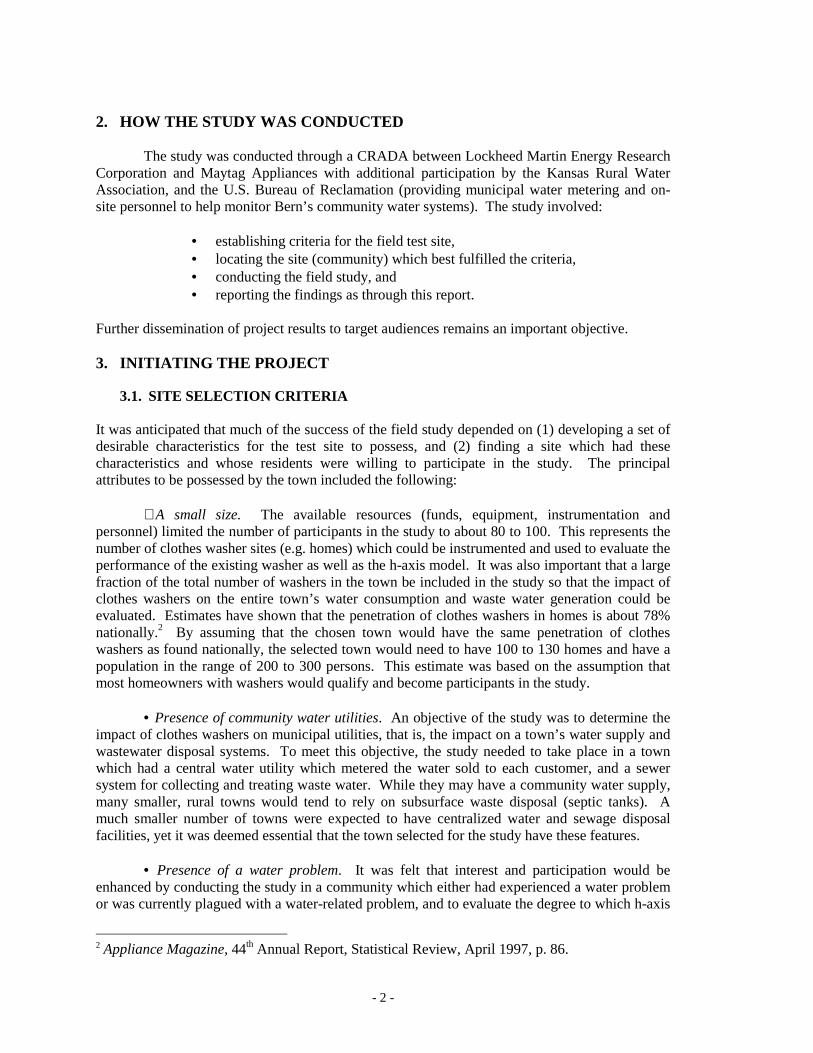
1. OVERVIEW AND OBJECTIVE OF THE FIELD STUDY
Some U.S. appliance manufacturers are beginning to produce high-efficiency residentialclothes washers designed for the U.S. market. These machines are based on a horizontal axis orh-axis design in which the clothing is tumbled through a small bath of water rather than beingimmersed in a tub of water as is conventionally done with most washers made and sold in theUnited States. Estimates have shown that these machines should use about 40% of the energyneeded for a conventional clothes washer and have about 60% of the water consumption of aconventional, vertical axis washer. Further, information suggests that the high spin speed of h-axis models tends to leave the clothes with less moisture, and this reduces the time needed to drythe clothes in the dryer. Consequently, the dryer Χgas or electric Χ consumes less energy. Theextent to which these savings in energy and water which have been demonstrated in thelaboratory, can be realized in a real-world field setting will have a large influence on the marketfor these machines.
Market Challenges - High-efficiency washing machines face challenges to wide-scaleadoption by consumers. First, these machines tend to cost more than the conventional machines.Increased sales will foster higher production volumes and better, more efficient plant assemblyline utilization, and, combined with increased competition between manufacturers for marketshare, will tend to reduce first costs to the consumer. However, indications from manufacturersare that a price premium for high-efficiency washers will remain even in a fully developedmarket. The ultimate market for high-efficiency washers will depend largely on the extent towhich performance advantages of these machines can be made known to justify the higher price.
According to a survey conducted through a consortium of utilities and DOE, 17% of householdswho own a washing machine intend to purchase a new machine in the next two years. Of thisnumber, only 0.4% reported that they will probably buy a horizontal-axis, high-efficiency washerin this time period. These results are not surprising in view of the fact that only 2% of the currentU.S. clothes washer market is for horizontal-axis, high efficiency washers. The survey found thata major reason for consumers= not opting for the high-efficiency machine is due to awareness:consumers were simply not aware of the technology and its benefits in terms of cleaningperformance, reduced operating cost, less water use, and lowered energy consumption. This lackof awareness extends from consumers shopping for a clothes washer, to electric and gas utilitieswho manage energy efficiency and customer service programs, and to water utilities looking atways to encourage water conservation. The survey also showed that only 25% of respondentswere aware of horizontal-axis washers in residential settings, and in focus groups held as part ofthe study, very few participants mentioned this type of machine when asked to describe thedifferent types of washers currently available. Other work has confirmed that increasedawareness of the benefits of high-efficiency washers is the key to transforming the market.
The Bern Washer Study – To (1) evaluate the real-world performance of h-axis washersand (2) to help bring about increased awareness of the benefits of h-axis washers, a small town,Bern, Kansas was located and used as a test bed for evaluating the performance and acceptabilityof h-axis washers. The 5-month study consisted of (A) gathering water consumption data on theexisting washing machines in Bern to establish a baseline against which the water use pattern ofhigh-efficiency washers can be measured, and (B) switching out these washers with high-efficiency h-axis models, and (C) determining the savings in water, energy consumption andchanges in laundry habits other impacts experienced by the town and its residents from achangeover to the h-axis machines.
- 2 -
2. HOW THE STUDY WAS CONDUCTED
The study was conducted through a CRADA between Lockheed Martin Energy ResearchCorporation and Maytag Appliances with additional participation by the Kansas Rural WaterAssociation, and the U.S. Bureau of Reclamation (providing municipal water metering and on-site personnel to help monitor Bern’s community water systems). The study involved:
• establishing criteria for the field test site,• locating the site (community) which best fulfilled the criteria,• conducting the field study, and• reporting the findings as through this report.
Further dissemination of project results to target audiences remains an important objective.
3. INITIATING THE PROJECT
3.1. SITE SELECTION CRITERIA
It was anticipated that much of the success of the field study depended on (1) developing a set ofdesirable characteristics for the test site to possess, and (2) finding a site which had thesecharacteristics and whose residents were willing to participate in the study. The principalattributes to be possessed by the town included the following:
∃ A small size. The available resources (funds, equipment, instrumentation andpersonnel) limited the number of participants in the study to about 80 to 100. This represents thenumber of clothes washer sites (e.g. homes) which could be instrumented and used to evaluate theperformance of the existing washer as well as the h-axis model. It was also important that a largefraction of the total number of washers in the town be included in the study so that the impact ofclothes washers on the entire town’s water consumption and waste water generation could beevaluated. Estimates have shown that the penetration of clothes washers in homes is about 78%nationally.2 By assuming that the chosen town would have the same penetration of clotheswashers as found nationally, the selected town would need to have 100 to 130 homes and have apopulation in the range of 200 to 300 persons. This estimate was based on the assumption thatmost homeowners with washers would qualify and become participants in the study.
• Presence of community water utilities. An objective of the study was to determine theimpact of clothes washers on municipal utilities, that is, the impact on a town’s water supply andwastewater disposal systems. To meet this objective, the study needed to take place in a townwhich had a central water utility which metered the water sold to each customer, and a sewersystem for collecting and treating waste water. While they may have a community water supply,many smaller, rural towns would tend to rely on subsurface waste disposal (septic tanks). Amuch smaller number of towns were expected to have centralized water and sewage disposalfacilities, yet it was deemed essential that the town selected for the study have these features.
• Presence of a water problem. It was felt that interest and participation would beenhanced by conducting the study in a community which either had experienced a water problemor was currently plagued with a water-related problem, and to evaluate the degree to which h-axis
2 Appliance Magazine, 44th Annual Report, Statistical Review, April 1997, p. 86.
- 3 -
washers could contribute to the solution. The communities “water problem” could have takenmany forms such as: chronic seasonal droughts, inadequate waste water treatment facilities, apopulation growth which is outstripping the capacity of the water providers, or lack of availabilityof fresh water – all were candidate considerations in the site selection.
• Participant willingness and enthusiasm. The conventional approach to field studies ofthis type involves instrumentation and data collection that does not involve the participant anddoes not require assistance by participants. In this study, it was essential that the participants bewilling to help gather the data from instrumentation placed on their washer and to provideinformation on each load of laundry washed. This approach was taken because the expense ofdistributed automatic data acquisition systems was far beyond the study’s resources, and becausesome of the information needed for the study required input from the participants.
3.2. SITE SELECTION PROCESS
Anticipating that small, rural towns would be likely to satisfy the criteria for the study, wecontacted the National Rural Water Association to get their assistance in identifying candidatesites, communities or towns. Through this association and with the assistance of other groups, wecontacted all of the state rural water associations and/or state environmental agencies requesting alisting of sites, which met the criteria for the study. A list of potential sites was screened, andwhere information was missing, calls to the appropriate state agency or town official were made.In some cases, site visits were made. The town of Bern, Kansas was selected based on a highranking of all of the criteria mentioned.
3.3. BERN KANSAS
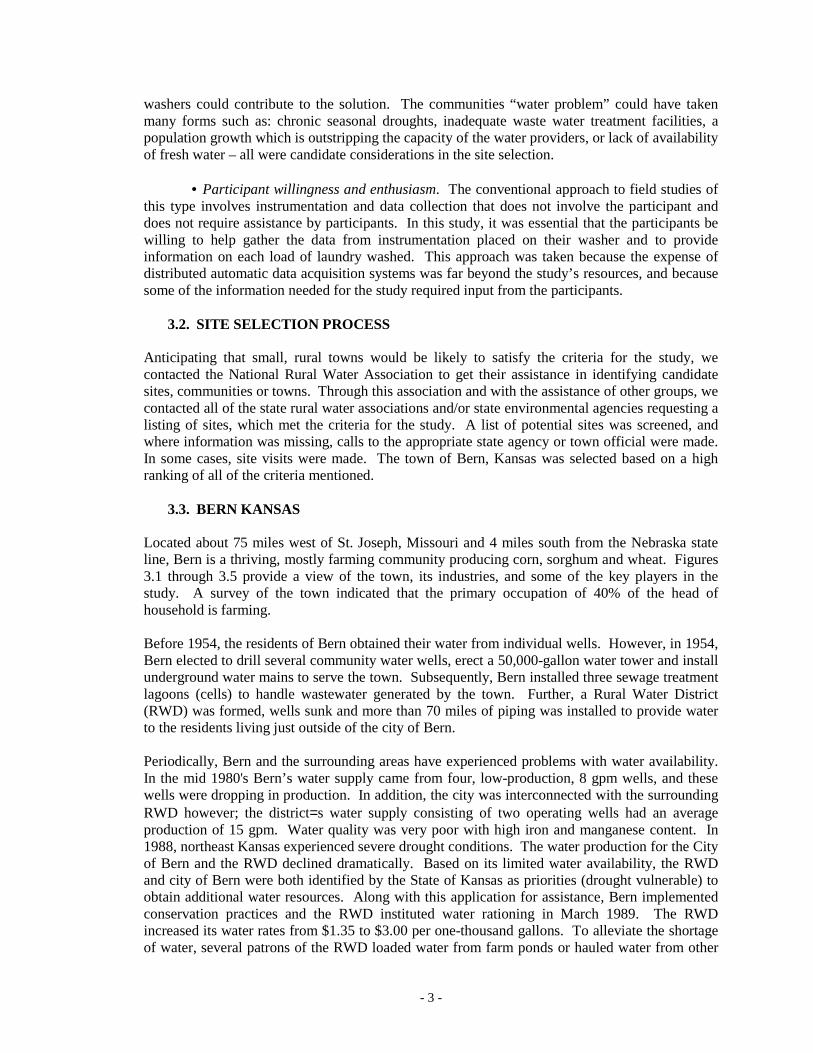
Located about 75 miles west of St. Joseph, Missouri and 4 miles south from the Nebraska stateline, Bern is a thriving, mostly farming community producing corn, sorghum and wheat. Figures3.1 through 3.5 provide a view of the town, its industries, and some of the key players in thestudy. A survey of the town indicated that the primary occupation of 40% of the head ofhousehold is farming.
Before 1954, the residents of Bern obtained their water from individual wells. However, in 1954,Bern elected to drill several community water wells, erect a 50,000-gallon water tower and installunderground water mains to serve the town. Subsequently, Bern installed three sewage treatmentlagoons (cells) to handle wastewater generated by the town. Further, a Rural Water District(RWD) was formed, wells sunk and more than 70 miles of piping was installed to provide waterto the residents living just outside of the city of Bern.
Periodically, Bern and the surrounding areas have experienced problems with water availability.In the mid 1980's Bern’s water supply came from four, low-production, 8 gpm wells, and thesewells were dropping in production. In addition, the city was interconnected with the surroundingRWD however; the district=s water supply consisting of two operating wells had an averageproduction of 15 gpm. Water quality was very poor with high iron and manganese content. In1988, northeast Kansas experienced severe drought conditions. The water production for the Cityof Bern and the RWD declined dramatically. Based on its limited water availability, the RWDand city of Bern were both identified by the State of Kansas as priorities (drought vulnerable) toobtain additional water resources. Along with this application for assistance, Bern implementedconservation practices and the RWD instituted water rationing in March 1989. The RWDincreased its water rates from $1.35 to $3.00 per one-thousand gallons. To alleviate the shortageof water, several patrons of the RWD loaded water from farm ponds or hauled water from other
- 4 -
locations to supplement their livestock water needs. To meet demand and improve water supplysources, Bern initiated a project to obtain water from neighboring Nebraska. Project costs toinstall 2 new wells in the neighboring state of Nebraska approximately 4 miles from any existingrural water transmission line, connecting pipeline and a booster station were estimated at$233,500. Funding came in the form of $23,800 by the City of Bern, the RWD contributed$47,600, and a neighboring community of Oneida paid $7,600. An emergency grant of $154,000was awarded by special appropriation by the Kansas Department of Commerce & Housing.Rates were increased by the city of Bern as a result of the increased debt and need to conservewater. This was in November 1990. Monthly rates adopted then remain in force today for theresidents of Bern:
Monthly Min. $8.50 for first 2000 gallons,$2.75 per 1000 for the next 4,000 gallons,$1.60 per 1000 for the next 6,000 gallons,$1.40 per 1000 for all water over 12,000 gallons.
Rates in the RWD, which uses much more water per user, were increased more dramatically tocurtail use:
Monthly Min. (Debt Service) is $12.50, no water,$3.00 per 1000 gallons for all water use.
Fig. 3.1 Panorama view of Bern, Kansas (from grain elevator).
- 5 -
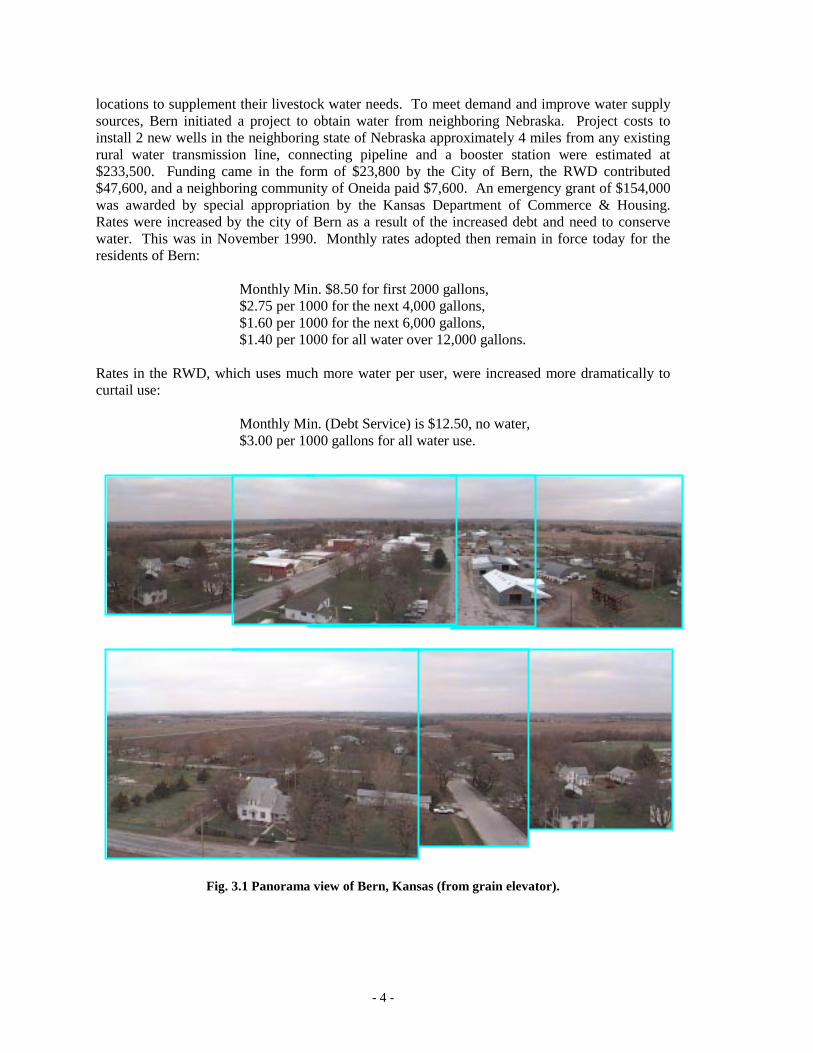
Fig. 3.2 H-axis washer with studyparticipant Jill Meyer .
Fig. 3.3 Washer manufacturerrepresentative: Mike Cox.
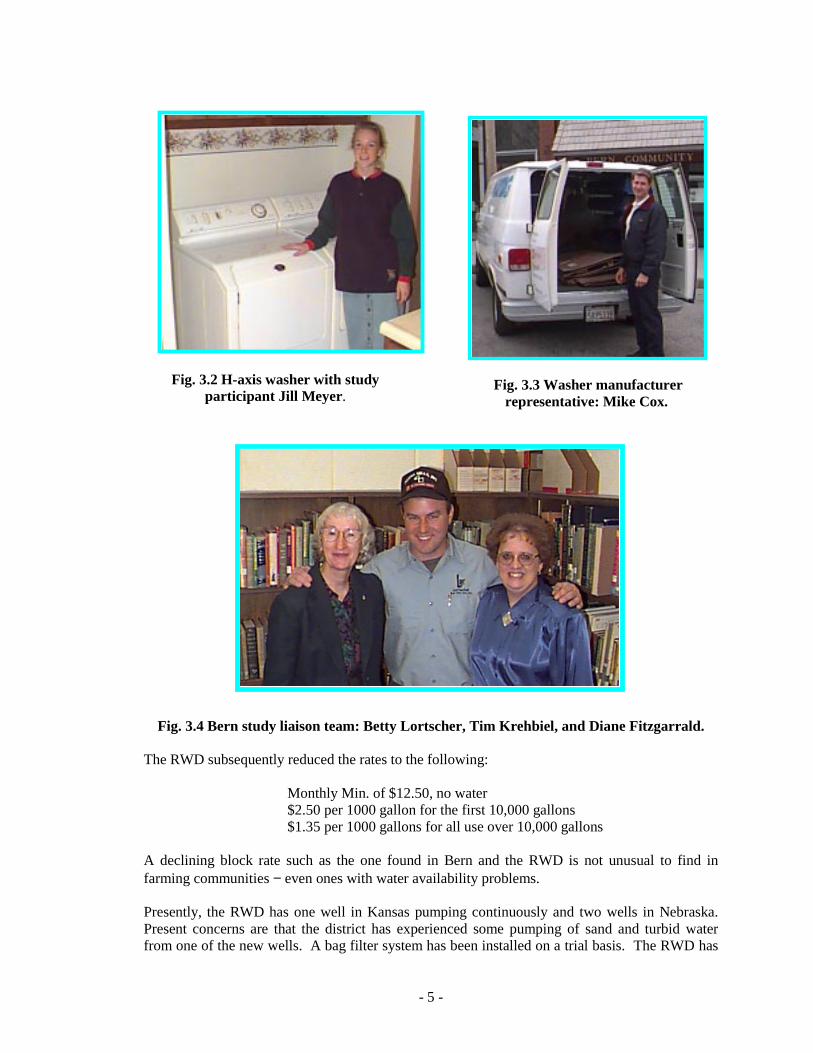
Fig. 3.4 Bern study liaison team: Betty Lortscher, Tim Krehbiel, and Diane Fitzgarrald.
The RWD subsequently reduced the rates to the following:
Monthly Min. of $12.50, no water$2.50 per 1000 gallon for the first 10,000 gallons$1.35 per 1000 gallons for all use over 10,000 gallons
A declining block rate such as the one found in Bern and the RWD is not unusual to find infarming communities − even ones with water availability problems.
Presently, the RWD has one well in Kansas pumping continuously and two wells in Nebraska.Present concerns are that the district has experienced some pumping of sand and turbid waterfrom one of the new wells. A bag filter system has been installed on a trial basis. The RWD has
- 6 -
also experienced problems with inadequate water pressure and, to alleviate these problems, hasrecently installed an additional storage standpipe at a cost of $90,000. The city of Bern continuesto operate three wells. The city and RWD water lines, which surround the city, are tied togetherso that the city and RWD can share water resources if needed.
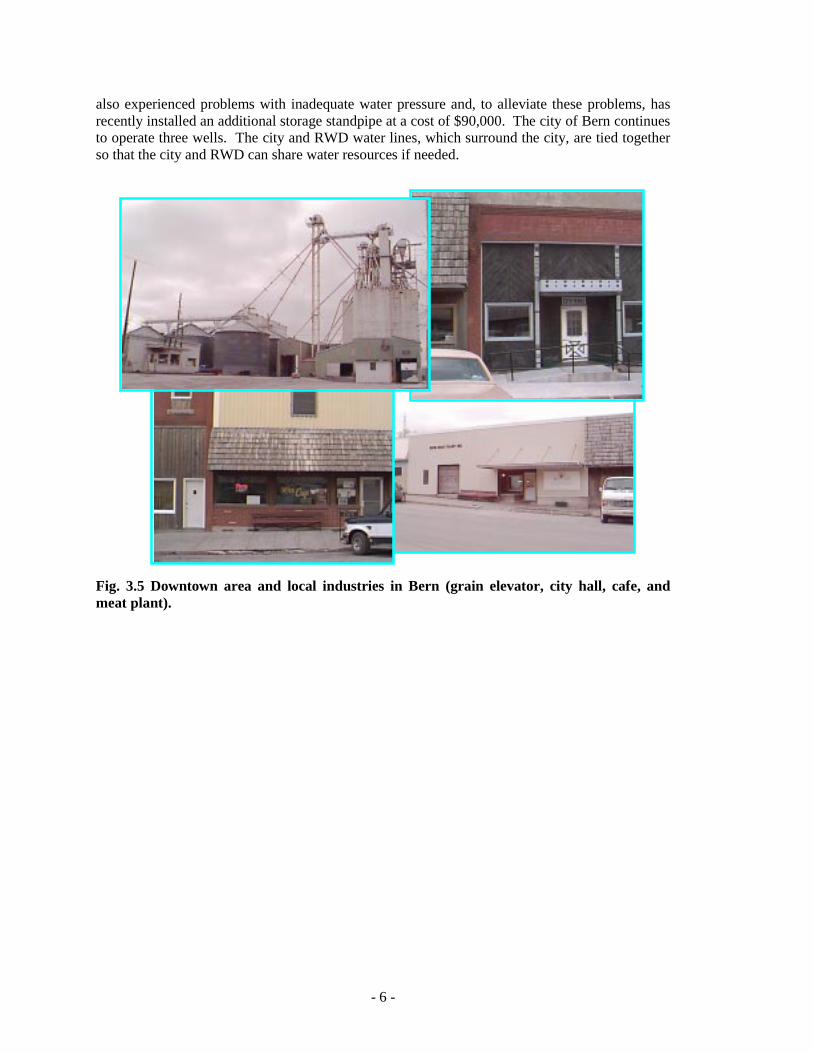
Fig. 3.5 Downtown area and local industries in Bern (grain elevator, city hall, cafe, andmeat plant).
- 7 -
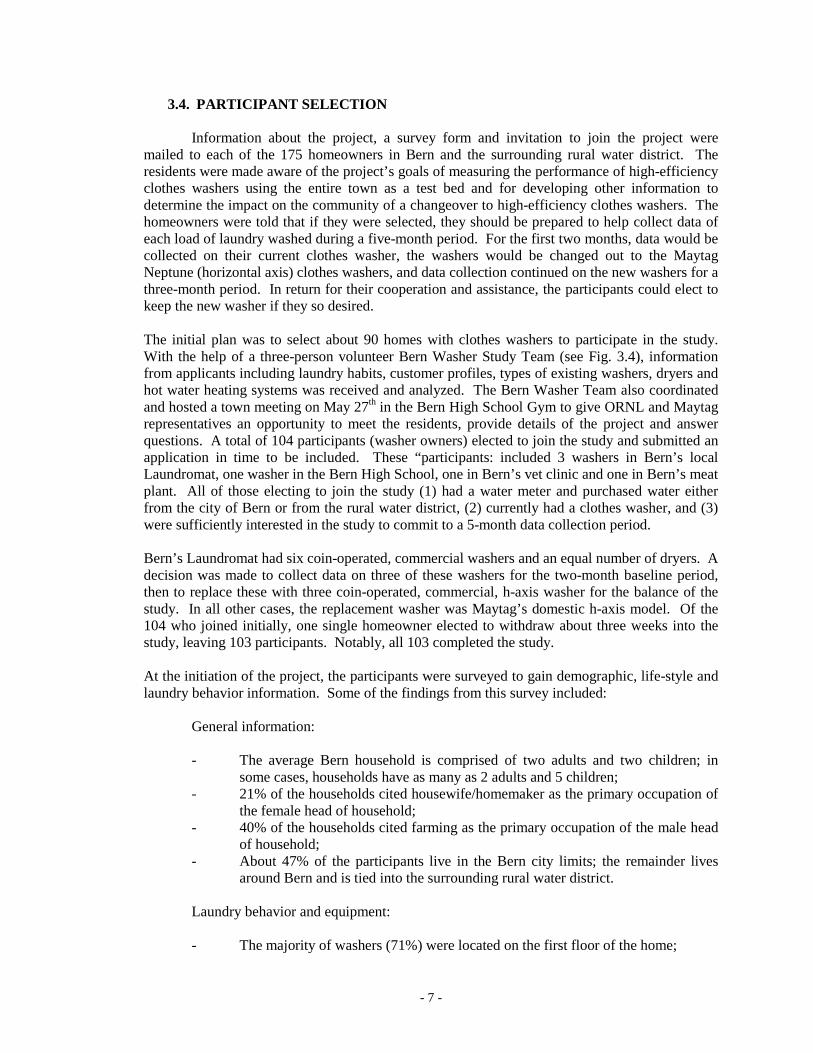
3.4. PARTICIPANT SELECTION
Information about the project, a survey form and invitation to join the project weremailed to each of the 175 homeowners in Bern and the surrounding rural water district. Theresidents were made aware of the project’s goals of measuring the performance of high-efficiencyclothes washers using the entire town as a test bed and for developing other information todetermine the impact on the community of a changeover to high-efficiency clothes washers. Thehomeowners were told that if they were selected, they should be prepared to help collect data ofeach load of laundry washed during a five-month period. For the first two months, data would becollected on their current clothes washer, the washers would be changed out to the MaytagNeptune (horizontal axis) clothes washers, and data collection continued on the new washers for athree-month period. In return for their cooperation and assistance, the participants could elect tokeep the new washer if they so desired.
The initial plan was to select about 90 homes with clothes washers to participate in the study.With the help of a three-person volunteer Bern Washer Study Team (see Fig. 3.4), informationfrom applicants including laundry habits, customer profiles, types of existing washers, dryers andhot water heating systems was received and analyzed. The Bern Washer Team also coordinatedand hosted a town meeting on May 27th in the Bern High School Gym to give ORNL and Maytagrepresentatives an opportunity to meet the residents, provide details of the project and answerquestions. A total of 104 participants (washer owners) elected to join the study and submitted anapplication in time to be included. These “participants: included 3 washers in Bern’s localLaundromat, one washer in the Bern High School, one in Bern’s vet clinic and one in Bern’s meatplant. All of those electing to join the study (1) had a water meter and purchased water eitherfrom the city of Bern or from the rural water district, (2) currently had a clothes washer, and (3)were sufficiently interested in the study to commit to a 5-month data collection period.
Bern’s Laundromat had six coin-operated, commercial washers and an equal number of dryers. Adecision was made to collect data on three of these washers for the two-month baseline period,then to replace these with three coin-operated, commercial, h-axis washer for the balance of thestudy. In all other cases, the replacement washer was Maytag’s domestic h-axis model. Of the104 who joined initially, one single homeowner elected to withdraw about three weeks into thestudy, leaving 103 participants. Notably, all 103 completed the study.
At the initiation of the project, the participants were surveyed to gain demographic, life-style andlaundry behavior information. Some of the findings from this survey included:
General information:
- The average Bern household is comprised of two adults and two children; insome cases, households have as many as 2 adults and 5 children;
- 21% of the households cited housewife/homemaker as the primary occupation ofthe female head of household;
- 40% of the households cited farming as the primary occupation of the male headof household;
- About 47% of the participants live in the Bern city limits; the remainder livesaround Bern and is tied into the surrounding rural water district.
Laundry behavior and equipment:
- The majority of washers (71%) were located on the first floor of the home;

- 8 -
- The majority of washers (65%) had a fabric softener dispenser although 49% ofhouseholds with the dispenser indicated that they never use it;
- The majority of washers (60%) also have a bleach dispenser; of this fraction,48% of the participants sometimes use the dispenser, and 45% indicated that theynever use the dispenser;
- 88% of the participants used an electric dryer; 11% used a gas dryer and 1% didnot own a dryer; the average age of a Bern dryer is 12 years;
- 64% of the participants used propane for water heating; 36% used electricity;natural gas is not available;
- Twice as many participants use powder detergent as use liquid detergent, and25% had both types of detergent on hand;
- The number of loads washed per week depended on the household size; estimatesmade by Bern residents indicated that the average Bern household washed 11loads/week – see Fig. 3.6.
Fig. 3.6 Dependence of loads washed per week on household size (pre-study estimates).
0
5
10
15
20
25
30
0 1 2 3 4 5 6 7 8
Number of Persons in Household
Was
h Lo
ads
per
Wee
k
Individual participant estimates are shown
11.2 Average Loads Per Week3.5 Average Persons in Household
Note: The averages are based on a survey that was conducted prior to data collection.
Best fit
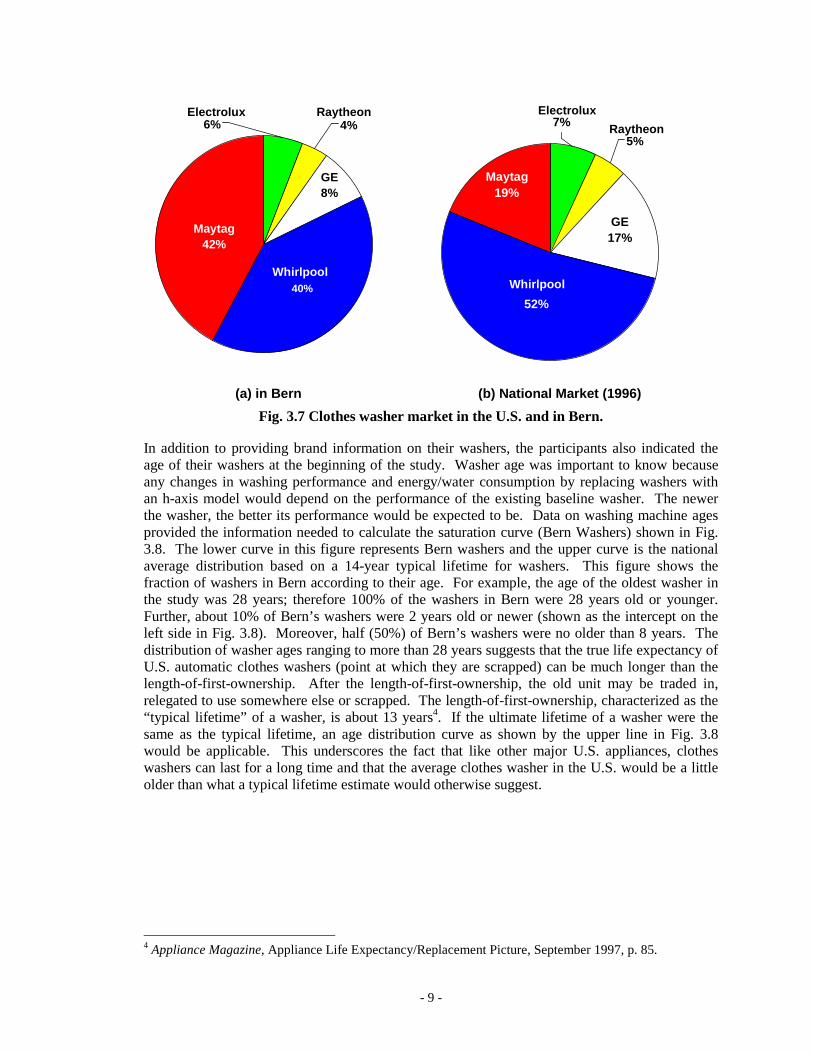
The age and brand of clothes washer owned by the participants were also determined andcompared with available information on national averages. The pie chart at the left in Fig. 3.7shows the distribution of washer brands owned by the study participants at the outset of theproject, and the pie chart at the right, shows the distribution of washer brands on a national basis3.The distribution of washers by brand in Bern follows the national market share for some brands,while for others, the distribution of washer brands is different. These differences may beattributed to differences between local markets in Bern and the average U.S. market as well asmanufacturer/distributor retailing efforts in larger towns surrounding Bern as compared toaverage market conditions on a nationwide basis. Importantly, all major national brands wererepresented in the study, and this provided a good cross-section of vertical axis washers forcomparison. 3 Appliance Magazine, 44th Annual Report, Statistical Review, April 1997.
- 9 -
(a) in Bern
Maytag42%
6% 4%
GE8%
40%
Whirlpool
Electrolux Raytheon
(b) National Market (1996)
52%
GE17%
Maytag19%
7%
5%
Whirlpool
Electrolux
Raytheon
Fig. 3.7 Clothes washer market in the U.S. and in Bern.
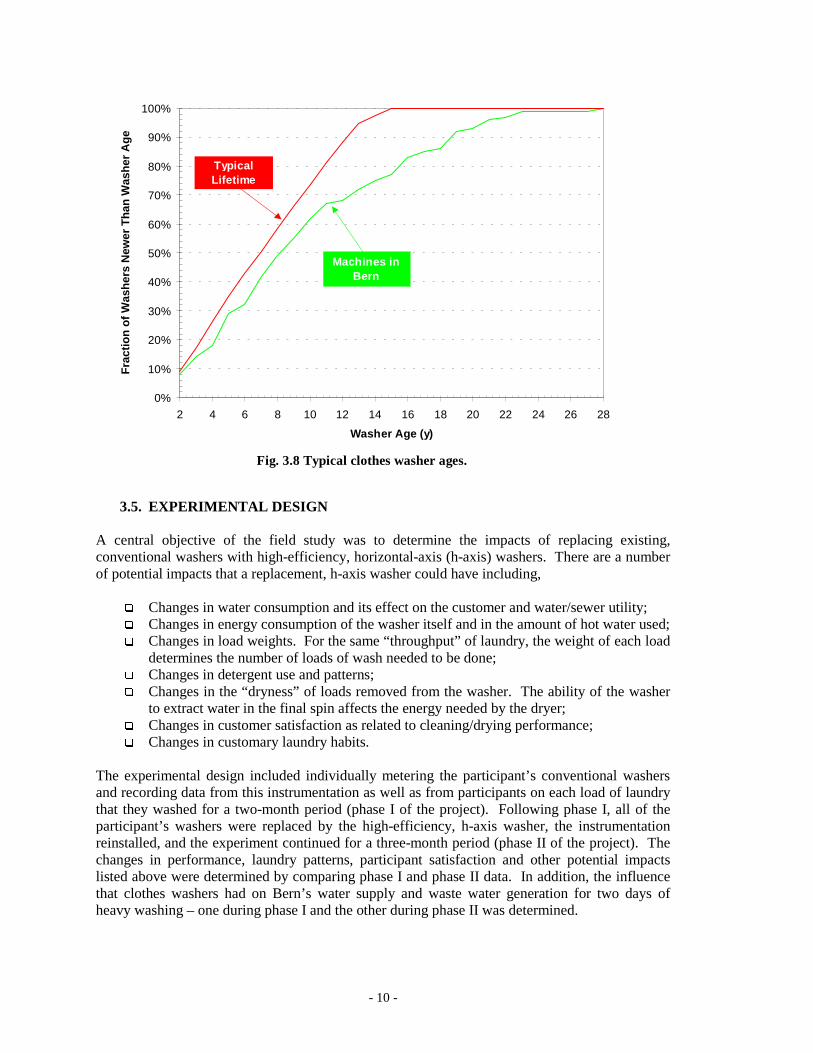
In addition to providing brand information on their washers, the participants also indicated theage of their washers at the beginning of the study. Washer age was important to know becauseany changes in washing performance and energy/water consumption by replacing washers withan h-axis model would depend on the performance of the existing baseline washer. The newerthe washer, the better its performance would be expected to be. Data on washing machine agesprovided the information needed to calculate the saturation curve (Bern Washers) shown in Fig.3.8. The lower curve in this figure represents Bern washers and the upper curve is the nationalaverage distribution based on a 14-year typical lifetime for washers. This figure shows thefraction of washers in Bern according to their age. For example, the age of the oldest washer inthe study was 28 years; therefore 100% of the washers in Bern were 28 years old or younger.Further, about 10% of Bern’s washers were 2 years old or newer (shown as the intercept on theleft side in Fig. 3.8). Moreover, half (50%) of Bern’s washers were no older than 8 years. Thedistribution of washer ages ranging to more than 28 years suggests that the true life expectancy ofU.S. automatic clothes washers (point at which they are scrapped) can be much longer than thelength-of-first-ownership. After the length-of-first-ownership, the old unit may be traded in,relegated to use somewhere else or scrapped. The length-of-first-ownership, characterized as the“typical lifetime” of a washer, is about 13 years4. If the ultimate lifetime of a washer were thesame as the typical lifetime, an age distribution curve as shown by the upper line in Fig. 3.8would be applicable. This underscores the fact that like other major U.S. appliances, clotheswashers can last for a long time and that the average clothes washer in the U.S. would be a littleolder than what a typical lifetime estimate would otherwise suggest.
4 Appliance Magazine, Appliance Life Expectancy/Replacement Picture, September 1997, p. 85.
- 10 -
Fig. 3.8 Typical clothes washer ages.
0%
10%
20%
30%
40%
50%
60%
70%
80%
90%
100%
2 4 6 8 10 12 14 16 18 20 22 24 26 28
Washer A ge (y)
Fra
ctio
n of
Was
hers
New
er T
han
Was
her
Age
Typical Lifetime
Machines in Bern
3.5. EXPERIMENTAL DESIGN
A central objective of the field study was to determine the impacts of replacing existing,conventional washers with high-efficiency, horizontal-axis (h-axis) washers. There are a numberof potential impacts that a replacement, h-axis washer could have including,
� Changes in water consumption and its effect on the customer and water/sewer utility;� Changes in energy consumption of the washer itself and in the amount of hot water used;� Changes in load weights. For the same “throughput” of laundry, the weight of each load
determines the number of loads of wash needed to be done;� Changes in detergent use and patterns;� Changes in the “dryness” of loads removed from the washer. The ability of the washer
to extract water in the final spin affects the energy needed by the dryer;� Changes in customer satisfaction as related to cleaning/drying performance;� Changes in customary laundry habits.
The experimental design included individually metering the participant’s conventional washersand recording data from this instrumentation as well as from participants on each load of laundrythat they washed for a two-month period (phase I of the project). Following phase I, all of theparticipant’s washers were replaced by the high-efficiency, h-axis washer, the instrumentationreinstalled, and the experiment continued for a three-month period (phase II of the project). Thechanges in performance, laundry patterns, participant satisfaction and other potential impactslisted above were determined by comparing phase I and phase II data. In addition, the influencethat clothes washers had on Bern’s water supply and waste water generation for two days ofheavy washing – one during phase I and the other during phase II was determined.
- 11 -
3.5.1. Instrumentation
Water Meters - Two water meters were installed on each washer in the project – one to measurethe hot water consumption and the other for the cold. These meters (Badger Model 50) had beenmodified and adapted to work with a remote digital readout. The meter modification detailed inAppendix I, provided the readout with a measurement precision of almost 1/200 of a gallon.Participants simply recorded the readings from the hot and cold readouts after each load oflaundry was completed, and the conversion of these readings into gallons of water was doneduring the data analysis phase of the project. Each meter also had the conventional analogregister from which cumulative hot and cold water consumption could be determined. Theseregisters were read periodically by project staff and used to check digital readout recordings madeby participants.
Weighing Scale - Each participant was given a scale for weighing wash loads. For most of thestudy, the scales with a measurement precision of ±1 oz., were used twice for each load: first, forobtaining the pre-wash weight of each load and a second time for determining the post-wash loadweight which was the weight of the load after washing but before drying. All recorded weightsincluded the weight of the clothes and the laundry basket. As part of the analysis, load weightswere determined by subtracting the weight of the basket from recorded weights.
Laundry Basket - Each participant was given a standard laundry basket to use for weighing theloads. This simplified determination of load weights across the participants.
Measuring Cup - Each participant was given a standard detergent cup to meter detergent use foreach load. As before, participants recorded detergent use on individual load data sheets.
Temperature Measurements - Water meters were installed on each washer during the first weekof the study, and at this time, hot and cold water temperatures were carefully measured by theinstallation team and used in the analysis for both phases of the study. These temperatures weremeasured once again during the changeover to the h-axis washer.
Washer Energy Consumption – The electrical energy consumption (kWh required to operate awasher’s motor and controls for a cycle) of most of the original phase I washers in the study wasdetermined from available data based on brand and model number. In those cases where awasher was too old and energy consumption information was unknown, washer energyconsumption was taken to be the average of the washer energy consumption of the remainingphase I washers. This provided a conservative (lower energy use) estimate for the older washers.The average washer energy consumption from prior field experiments on the h-axis washer wasused in phase II of the Bern Study.
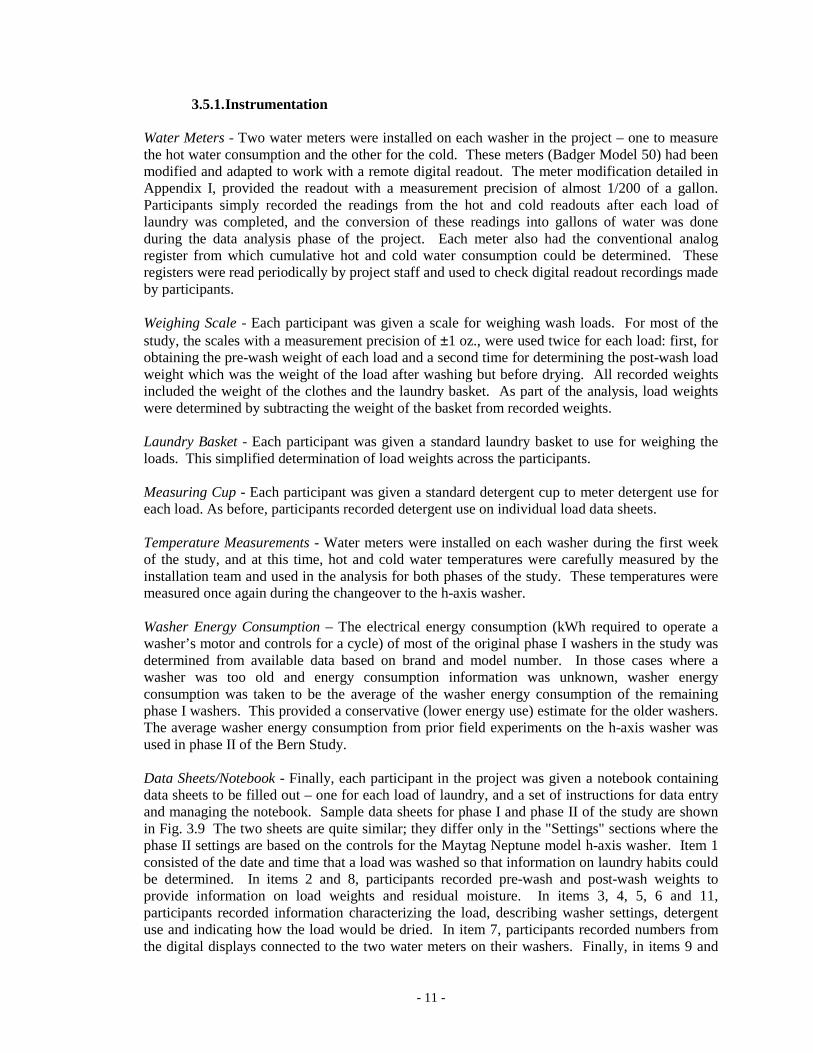
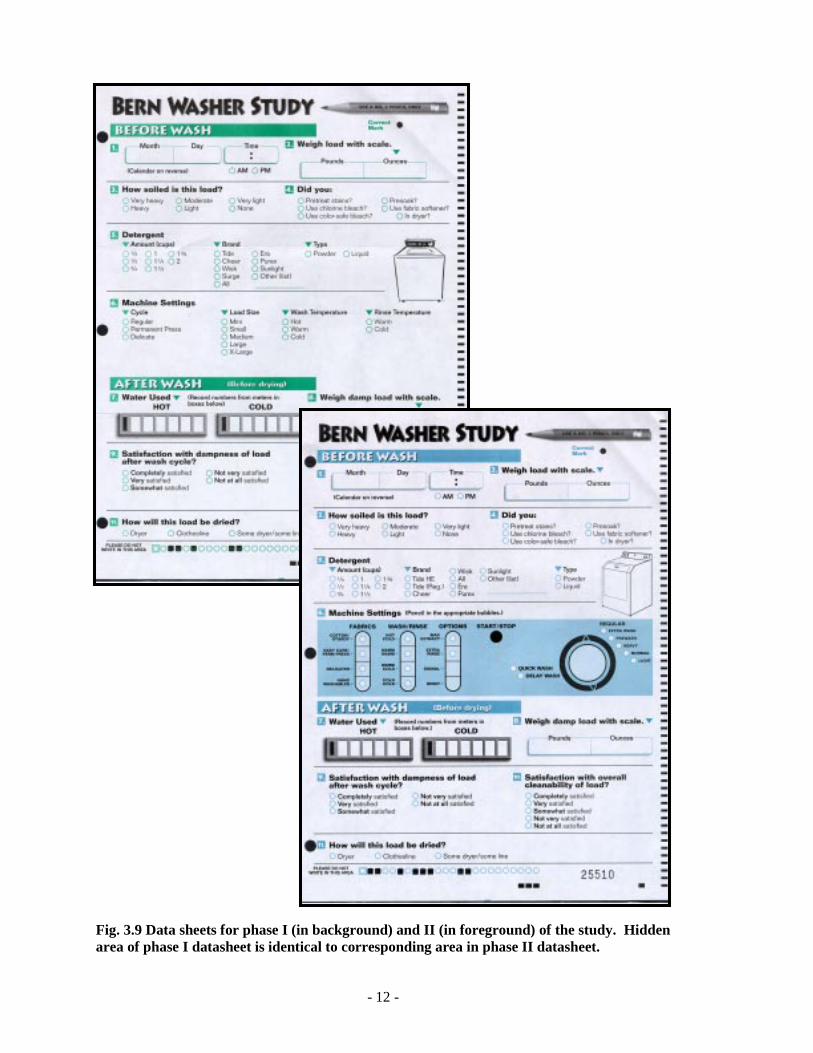
Data Sheets/Notebook - Finally, each participant in the project was given a notebook containingdata sheets to be filled out – one for each load of laundry, and a set of instructions for data entryand managing the notebook. Sample data sheets for phase I and phase II of the study are shownin Fig. 3.9 The two sheets are quite similar; they differ only in the "Settings" sections where thephase II settings are based on the controls for the Maytag Neptune model h-axis washer. Item 1consisted of the date and time that a load was washed so that information on laundry habits couldbe determined. In items 2 and 8, participants recorded pre-wash and post-wash weights toprovide information on load weights and residual moisture. In items 3, 4, 5, 6 and 11,participants recorded information characterizing the load, describing washer settings, detergentuse and indicating how the load would be dried. In item 7, participants recorded numbers fromthe digital displays connected to the two water meters on their washers. Finally, in items 9 and
- 12 -
Fig. 3.9 Data sheets for phase I (in background) and II (in foreground) of the study. Hiddenarea of phase I datasheet is identical to corresponding area in phase II datasheet.

- 13 -
10, participants could indicate satisfaction with the dampness and cleanliness of the load afterwashing.
3.5.1. Schedule
The schedule for the study is given in Table 3.5.2.
Table 3.5.2 Project Schedule for Bern Study.
Project Schedule
May 23, 1997 Selection and notification of study participants in Bern
May 28 Town meeting – Bern High School Gym
June 2 - 6 Installation of instrumentation on current washers; distribution ofnotebooks; initiation of phase I data collection
June 27 Installation of metering on Bern water tanks and wastewater treatmentlagoons to measure community water use/disposal patterns on thefollowing day
June 28 First “Superwash” Saturday – a day when participants concentratedtheir washing into a window of 10:00 a.m. to 4:00 p.m. to determine theimpacts of a heavy washday on the community’s water use.
July 28 – August 1 Removal of current washer; Neptune washer installation; re-installationof instrumentation; initiation of phase II data collection
September 13 Second “SuperWash” Saturday; a repeat of the first SWS so thatchanges in community water use could be determined and comparedwith impacts from first SWS. Also, announcement of preliminaryfindings on energy/water consumption found at that point in the study.
October 31 - November 4 Removal of instrumentation
November 4 – December 31 Data analysis
January 15, 1998 Final study draft report completed; to be followed by published finalreport
Recognizing that the key element of the project was continued interest and participation by thepeople of and surrounding Bern, an aggressive schedule was set for the project so that the datacould be collected quickly and analyses conducted. At intervals during both phases, individuallytailored reports, citing results from each participant in the study, were prepared and sent to eachparticipant as one way of providing relevant and important feedback to participants. A sample ofone of these reports is provided in Appendix B.
3.6. DATA COLLECTION AND ANALYSIS PROCEDURE
The overall approach to data collection and analysis was to create database tables of projectinformation and link these databases according to information queries. The information in these
- 14 -
tables included recorded experimental information, detailed participant information, informationabout phase I washer characteristics and other information which were recorded on the datasheets and submitted to Oak Ridge National Laboratory (ORNL) for analysis. These individualtables of information were joined together as needed for analysis and for reporting results toindividual participants. The key to the approach lay in the development of a normalized databasein which all tables of information and data were linked through a single parameter, a uniquenumber assigned to each datasheet.
The tools used to build the databases and to process data from the study included MicrosoftAccess 97 and Microsoft Excel 97. Access is a relational database management system thatprovides features for importing data and for creating tables, queries, forms and reports. InAccess, data are represented as a table (a matrix of data in rows and columns). Access provides anumber of routines for operating on the data such as queries, macros, visual Basic modules, formsand reports. Queries and reports were the two main components used in the study. The queriescould be either created in a graphical view or by writing Sequential Query Language (SQL)statements. Queries were used to filter, sort, and screen the data from the study as well as toperform calculations such as sum and average the data. Access was linked to Excel as needed toperform histograms, create full-page graphics and to perform calculations which otherwise wouldhave required extensive programming using Access. An example of this flexibility was the use ofExcel to create pre-wash water meter readings from the ending water meter readings of the priorwasher cycle. The ability to do this eliminated the need for participants to record the readingsfrom both water meters twice in a single load.
At the outset of the study, each participant was assigned a unique number or I.D., and a databaseof participant information and I.D. code was prepared. Second, on every data sheet for theproject was printed a unique five-digit code which had been lithographed at the lower right-handcorner of the form. As sets of these blank data sheets were periodically distributed toparticipants, ORNL kept track of the lithocodes assigned to each participant as well as thelithocodes on datasheets returned by each participant for analysis. Although Fig. 3.9 shows thefront page of typical datasheets, there was a reverse side where the cumulative gallons of water asread from the register of each water meter could be entered. This was done twice (beginning andend) for each phase of the study. The datasheets have bubbles, which were shaded in, and blankboxes for handwritten data entries. The bubbled entries limit the data to discrete values. Forexample, in item 5, detergent use, the amount of detergent in a cycle could be specified in ¼-cupincrements up to 2 cups. Examples of handwritten data fields are date, time and load weights.
Each of the phase I data records consisted of 21 data fields. Each of the phase II data recordsoriginally consisted of 21 data fields, but this was further subdivided into 26 separate fieldsbecause of the possibility of more than one selection in some categories. As the projectproceeded, every couple of weeks or so, participants mailed completed data sheets to ORNL foranalysis. Once received, the lithocodes were logged and checked to ensure that they had beencorrectly assigned to a participant. The data sheets were subsequently delivered to the TennesseeState Testing & Evaluation Center where an optical scanner read them and the handwritten datawere entered by a keypunch operator. As records were read and prepared, State Testing alsoassigned a sequence number to each data record as it was entered into the scanner. A softwareprogram, which was prepared especially for the study, was used to assemble the recorded datainto an Excel spreadsheet file and e-mailed to ORNL for analysis.
Once received by ORNL, the data were converted into comma-delimited files that could beimported into Access. The Access import engine provided the ability to create a specification filefor comma delimited files. The specification file assigned a data type for each data field: either as

- 15 -
date/time, text or number, and specification files were created once for the phase I data recordsand once for the phase II records. Further work automated this process so that as more and moredata were received through periodic mailings from participants, and pre-processed by StateTesting & Evaluation, the specification file automatically assigned the correct data type to eachfield in a record as the data records were imported into Access.
Some of the tables of data and information also contained a listing of participant number. Othertables, e.g. the body of data produced by the participants as they washed clothes throughoutphases I and II also contained a column listing the lithocodes for each data record. The tables,which allowed all of the information to be tied together, were the lithocode/participant I.D. tableand the sequence number/participant I.D. table. Using the later table gave the fastest response toqueries.
Summarizing, the overall process for assembling a database of information for the study consistedof the following six steps:
� Data entry by the Bern participants on pre-formatted data sheets;� Optical scanning of the data sheets supplemented by keyboard entries to generate a data
table;� Formatting and importing the data table into Excel;� Conversion of the spreadsheet to comma-delimited ASCII file;� Importing this file into Access;� Creating SQL queries to assign data records to participants;� Creating SQL queries to sort, filter and screen all data and to perform calculations and
analyses needed to address the study objectives.
Based on this process, data from over 7,000 washer loads in phase I and over 13,000 loads inphase II were analyzed to address the objectives of the study, and the results are reported in thenext section of this report.
The integrity and quality of the data collected from the Bern participants during both phases I andII of the study is discussed in Appendix C.
- 16 -
4. OVERALL FINDINGS AND IMPACTS
The tumble-action principle of the h-axis washer and design of the h-axis washer based on thisprinciple represents a major design change from the conventional, v-axis washers. Therefore, itwas reasonable to expect that in the Bern Study, there could be significant impacts resulting froma changeover from conventional, v-axis washers to the h-axis design. These impacts include, forexample, changes in average load sizes and weights, changes in detergent use patterns, changes inenergy and water consumption, changes in cleaning performance and changes in the post-washmoisture content of loads. In the following sections of this report, we examine first some of theoverall impacts and findings between phases I and II of the study, and second, a more detailedexamination of the influence of individual parameter differences on these overall results.
4.1. IMPACTS ON LOAD SIZE
The size of loads washed with each cycle can be an important measure of the “throughput” oflaundry because it can determine the number of loads washed by a customer. More loads takemore time and can consume more energy and water than fewer loads. This is particularly the caseon laundry days when loads are done one after another. Its volume or its weight or perhaps somecombination of the two could characterize the size of a load of laundry. Although the weight ofany wash load and its volume are linked, the relation between the two depends on the type ofclothing in the load, e.g. a laundry basket full of cotton towels, sweatshirts, bedding, etc. mayweigh more than one filled with permanent-press shirts or delicates. A participant’s lifestylewould likely determine the type of clothing worn and washed most often, and over the course ofthe study, the lifestyles for most of the participants remained fixed. This meant that load weightsused in the study, were a good indicator of load size.
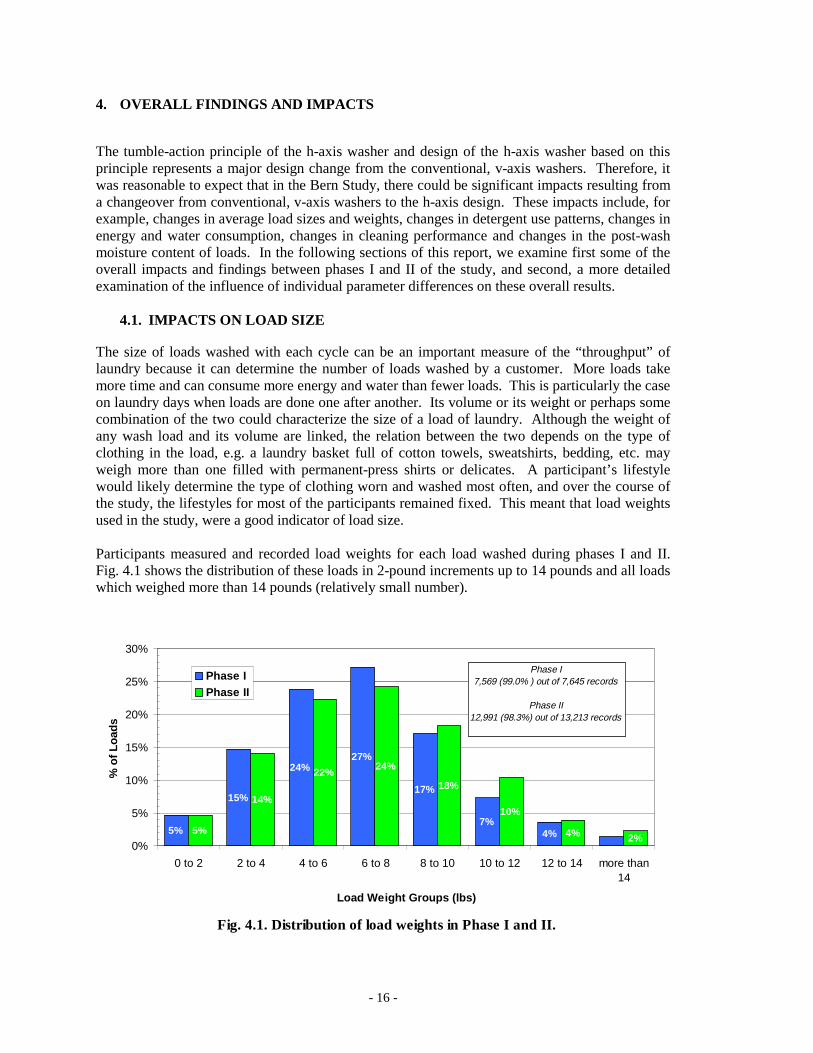
Participants measured and recorded load weights for each load washed during phases I and II.Fig. 4.1 shows the distribution of these loads in 2-pound increments up to 14 pounds and all loadswhich weighed more than 14 pounds (relatively small number).
Fig. 4.1. Distribution of load weights in Phase I and II.
5%
15%
24%27%
17%
7%4%5%
14%
22%24%
18%
10%
4% 2%0%
5%
10%
15%
20%
25%
30%
0 to 2 2 to 4 4 to 6 6 to 8 8 to 10 10 to 12 12 to 14 more than14
Load Wei ght Groups (lbs)
% o
f Loa
ds
Phase IPhase II
Phase I7,569 (99.0% ) out of 7,645 records
Phase II12,991 (98.3%) out of 13,213 records

- 17 -
In phases I and II, most of the loads weighed between 6 and 8 pounds, and about as many loadsweighed less than 2 pounds as weighed more than 14 pounds. Across all washers andparticipants, the average load weight in phase I was 6.65 pounds and the average for loads donein phase II was 6.98 pounds. Interestingly, Fig. 4.1 shows that a larger fraction of loads weredone by the phase I washers in each load category less than 8 pounds than were done by the phaseII washers in those same load weight categories. During phase II and as the summer progressedinto the fall, participants tended to wash heavier loads (those weighing more than 8 pounds) moreoften than they did in phase I. These results are based on average pre-wash weight measurementsfrom 7,523 loads (50,035 pounds) of laundry done in phase I and 12,759 loads (89,063 pounds)done in phase II.
We found that as the study progressed, the average load weight increased slightly for each weekof the study and throughout both phases at a rate of about 0.04 lb/load per week. Consequently,the average load weight for the first two months of the study (phase I) is a little smaller than theaverage load weight for the last three months of the study (phase II). The finding that the averageload weight tended to increase throughout the study suggests that the increase in average loadweight between the two phases is not necessarily due to the type of washer. Instead, it appears tobe timing related and results from differences in the type of laundry being washed by theparticipants as the study progressed through the Summer and into the Fall. Measurable changesup or down in laundry “throughput” (weight per load) as a result of washer type were not found.
4.2. WATER CONSUMPTION
The water consumed by each washer in both phases of the study was determined throughindividual, positive displacement (nutating disk) water meters applied to the hot and cold waterlines to each clothes washer. After each load was washed, the digital display affixed to eachmeter was read and recorded by each participant. These readings simply indicated “counts”, andduring the data analysis phase of the study, these “counts” were converted to gallons through aconversion factor. The water consumed during one cycle was determined during analysis bysubtracting the meter reading from the prior wash cycle from the reading for the current washcycle. In each case, the difference in meter readings was converted into gallons of water.
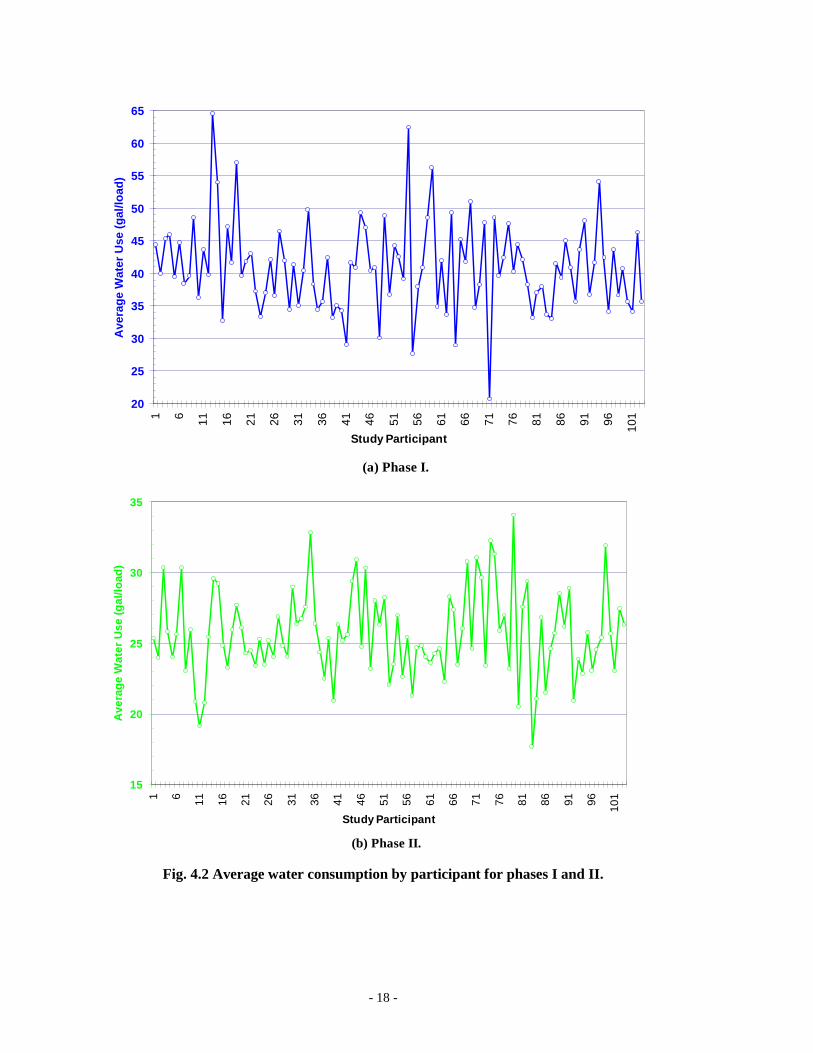
Figure 4.2 shows the average water (hot and cold) consumption during phase I and II for eachindividual participant in the study. A count of the water use over all participants in 1 gallon bingroupings (such as 0 to 1 gallon) yields the distribution curves for phase I and II shown in Figure4.3. In phase I, the average total water use ranged from about 18 gallons to more than 60 gallonsper load with an average of 41.5 gallons/load. In phase II, the total water consumption rangedfrom 17 gallons/load to about 37 gallons/load with an average of 25.8 gallons/load. Across allstudy participants, this represents an average per load water savings of 15.7 gallons, or 37.8%.
- 18 -
(a) Phase I.
20
25
30
35
40
45
50
55
60
65
1 6 11 16 21 26 31 36 41 46 51 56 61 66 71 76 81 86 91 96 101
Study Participant
Ave
rage
Wat
er U
se (
gal/l
oad)
(b) Phase II.
15
20
25
30
35
1 6 11 16 21 26 31 36 41 46 51 56 61 66 71 76 81 86 91 96 101
Study Participant
Ave
rage
Wat
er U
se (
gal/l
oad)
Fig. 4.2 Average water consumption by participant for phases I and II.

- 19 -
Fig. 4.3 Distribution of water use in phases I and II.
0%
2%
4%
6%
8%
10%
12%
14%
10 13 16 19 22 25 28 31 34 37 40 43 46 49 52 55 58 61 64 67 70
Water Use (gallons) in 1 gal bins
% o
f Loa
ds
Phase I (vertical-axis washers)
Phase II (horizontal-axis washers)
Average of 25.8 for Phase II
Average of 41.5 for Phase I
4.3. ENERGY CONSUMPTION
Washers consume energy through two main mechanisms: first, energy is needed to produce hotwater used by the washer, and second, the washer itself uses energy to operate the motor andcontrols. In this analysis, the hot water energy was taken to be the thermal energy in the hotwater used by the washer. This energy was determined by measuring the temperature of the hotand cold water (see Appendix D) at a sink or faucet after the water had run for a time so that thetemperatures were stable. This was done on three separate visits to each participant during theprogress of the experiment. The hot and cold water temperatures were entered into a spreadsheetto be included in the analyses. The amount of hot water consumed was measured by the watermeters described earlier, and based on the volume of hot water consumed and the temperaturedifference between the hot and cold water, the energy content of the hot water to the washer wasdetermined (Btu/gallon). It should be noted that although this procedure puts the energycontained in hot water on a consistent footing to compare washer performance, it understates theactual amount of energy purchased by the participants to heat the water used by these washers.From the survey administered to participants at the outset of the project, 64% of the participantsheated water using propane and the rest used electricity. By applying national averages for theefficiency of water heaters5 (52% for gas/propane and 85% for electric), ignoring any heat lossesfrom the hot water distribution piping in homes and standby losses, it can be shown that onlyabout 64% of the energy purchased for water heating actually ends up as hot water.
A comparison of the average total energy (hot water and washer) consumption of the phase Iwashers and the energy consumption of phase II washers on an individual participant basis isshown in Fig. 4.4. A count of the energy use over all participants in 0.1 kWh bin groupings (such
5 BTS Core Databook, version 2, U.S. Department of Energy, Office of Building Technology, State andCommunity Programs. For copy or information, contact Bill Zwack, 301/588-9387.
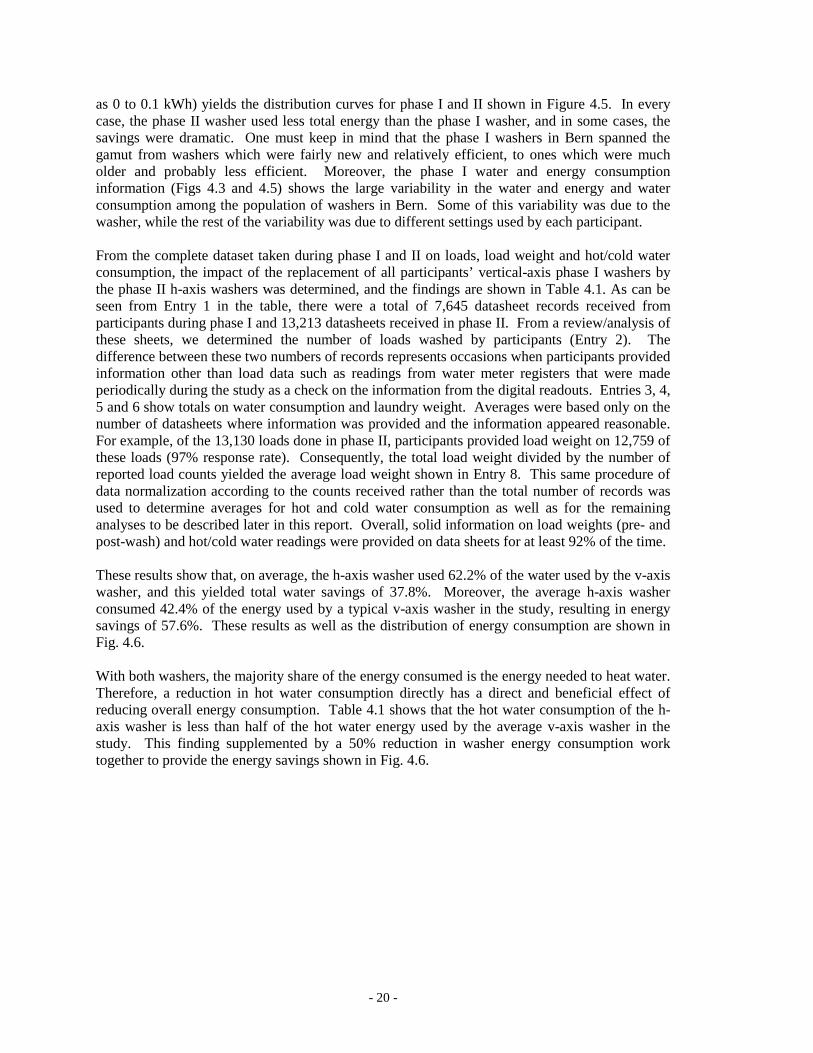
- 20 -
as 0 to 0.1 kWh) yields the distribution curves for phase I and II shown in Figure 4.5. In everycase, the phase II washer used less total energy than the phase I washer, and in some cases, thesavings were dramatic. One must keep in mind that the phase I washers in Bern spanned thegamut from washers which were fairly new and relatively efficient, to ones which were mucholder and probably less efficient. Moreover, the phase I water and energy consumptioninformation (Figs 4.3 and 4.5) shows the large variability in the water and energy and waterconsumption among the population of washers in Bern. Some of this variability was due to thewasher, while the rest of the variability was due to different settings used by each participant.
From the complete dataset taken during phase I and II on loads, load weight and hot/cold waterconsumption, the impact of the replacement of all participants’ vertical-axis phase I washers bythe phase II h-axis washers was determined, and the findings are shown in Table 4.1. As can beseen from Entry 1 in the table, there were a total of 7,645 datasheet records received fromparticipants during phase I and 13,213 datasheets received in phase II. From a review/analysis ofthese sheets, we determined the number of loads washed by participants (Entry 2). Thedifference between these two numbers of records represents occasions when participants providedinformation other than load data such as readings from water meter registers that were madeperiodically during the study as a check on the information from the digital readouts. Entries 3, 4,5 and 6 show totals on water consumption and laundry weight. Averages were based only on thenumber of datasheets where information was provided and the information appeared reasonable.For example, of the 13,130 loads done in phase II, participants provided load weight on 12,759 ofthese loads (97% response rate). Consequently, the total load weight divided by the number ofreported load counts yielded the average load weight shown in Entry 8. This same procedure ofdata normalization according to the counts received rather than the total number of records wasused to determine averages for hot and cold water consumption as well as for the remaininganalyses to be described later in this report. Overall, solid information on load weights (pre- andpost-wash) and hot/cold water readings were provided on data sheets for at least 92% of the time.
These results show that, on average, the h-axis washer used 62.2% of the water used by the v-axiswasher, and this yielded total water savings of 37.8%. Moreover, the average h-axis washerconsumed 42.4% of the energy used by a typical v-axis washer in the study, resulting in energysavings of 57.6%. These results as well as the distribution of energy consumption are shown inFig. 4.6.
With both washers, the majority share of the energy consumed is the energy needed to heat water.Therefore, a reduction in hot water consumption directly has a direct and beneficial effect ofreducing overall energy consumption. Table 4.1 shows that the hot water consumption of the h-axis washer is less than half of the hot water energy used by the average v-axis washer in thestudy. This finding supplemented by a 50% reduction in washer energy consumption worktogether to provide the energy savings shown in Fig. 4.6.
- 21 -
(a) Phase I.
0.5
1
1.5
2
2.5
3
3.5
4
4.5
5
5.5
1 6 11 16 21 26 31 36 41 46 51 56 61 66 71 76 81 86 91 96 101
Stud y Participant
Ave
rage
Ene
rgy
Use
(kw
h/lo
ad)
(b) Phase II.
0
0.5
1
1.5
2
2.5
3
1 6 11 16 21 26 31 36 41 46 51 56 61 66 71 76 81 86 91 96 101
Study Participant
Ave
rage
Ene
rgy
Use
(kw
h/lo
ad)
Fig. 4.4 Average washer energy use by participant for phases I and II.

- 22 -
Fig. 4.5 Distribution of energy use in phase I and II.
0%
2%
4%
6%
8%
10%
12%
14%
0.4
0.7 1
1.3
1.6
1.9
2.2
2.5
2.8
3.1
3.4
3.7 4
4.3
4.6
4.9
5.2
5.5
5.8
6.1
6.4
Energy Use (kWh) in 0.1 kWh bins
% o
f Loa
ds
Phase I (vertical-axis washers)
Phase II (horizontal-axis washers)
Average of 0.96 for Phase II
Average of 2.26 for Phase I
(a) Average hot and cold water consumption.
81%72%
19%
28%
05
1015202530354045
Phase I vertical axiswashers
Phase II horizontal axiswashers
Wat
er U
se (
gal/l
oad)
Average HotWaterAverage ColdWater
(b) Average energy consumption.
89%
90% 11%
10%
0
1000
2000
3000
4000
5000
6000
7000
8000
Phase I vertical axiswashers
Phase II horizontal axiswashers
Ene
rgy
Use
(B
tu/lo
ad) Average Machine
EnergyAverage ThermalEnergy
Fig. 4.6 Average water and energy consumed by phase I and II washers.

- 23 -
Table 4.1 Average Energy and Water Consumption in Phases I and II.
Phase I Phase II# Calculation Units Data Records Data Records1 Total Records 7645 7645 13213 132132 Number of Loads 7633 7633 13130 131303 Total Hot Water Use gallons 81405 7033 58000 120114 Total Cold Water Use gallons 209286 7002 250462 119505 Total Water Use gallons 290691 3084626 Total Laundry Weight pounds 50035 7523 89063 127597 No. of Participants Reporting 103 1038 Average Load Weight lb/load 6.65 6.989 Number of wash days days 61 10510 Average Hot Water Temperature
Difference*°F 72 72
11 Average Washer Energy Use kWh/load 0.23 0.1112 Average Hot Water Use gallons/load 11.57 4.8313 Average Cold Water Use gallons/load 29.89 20.9614 Average Total Water Use gallons/load 41.46 25.7915 Average Total Energy Use Btu/load 7710 327216 Average load/day per Participant loads/day 1.21 1.21
% Water Savings** 37.8% Energy Savings** 57.6
*The temperature differences for each participant are given in Appendix D.**Comparison of items 14 and 15, respectively, for water and energy.
4.4. DETERGENT USE AND CONSUMPTION
Changes in detergent use by participants were also evaluated in the study. The survey conductedat the beginning of the study determined the distribution of detergent brands used by theparticipants, and as the study progressed, participants used the measuring cup which wasprovided as part of the experimental equipment to measure and record the amount of detergentused with each load. Participants were noted to use varying amounts of detergents to completetheir wash. Cases were found where participants used as much as 2 cups of detergent to washsmall loads. However, the average detergent use for the phase I washers was about a ½ cup/load.
A heavy concentration of ordinary detergent may not be desired for an h-axis washer because ofthe high degree of tumbling present that can lead to oversudsing. There are three ways in whichany tendency for oversudsing can be minimized. One approach would be for the h-axis washer tobe designed to sense any oversudsing condition and to alter its cycle, perhaps using an extra rinse,to eliminate it. The Maytag Neptune washer used in phase II of the study was designed to detectand handle problems with oversudsing. However, this may cause the washer to use more waterthan would ordinarily be used. The second approach would be to use a low-sudsing detergent.The market for low-sudsing detergents is anticipated to grow as h-axis washers gain market shareand the demand for low sudsing detergents grows. In conjunction with the phase II part of thestudy, participants were allowed to continue to use their customary brand and type of detergent inthe new, h-axis washer, or they could use a new detergent formulated expressly for use in tumbleaction washers. This formulation, Tide HE (high-efficiency) was provided free to those

- 24 -
participants who were interested. Figure 4.7 indicates the distribution of detergent brands A-Fused in phase I of the study and how the participants responded in phase II to the availability ofthe new detergent, Tide HE. Clearly, many of the participants took advantage of the newdetergent; however, there was also a substantial number who elected to continue to use the brandto which they were accustomed.
(a) Phase I
Other23%
E44%
F6%
A3%
B8%
C10%
D6%
(b) Phase II
F1%E
11%
Tide HE77%
C2%
Other7%
D0.2%
B2%
Fig. 4.7 Distribution of detergent brands A-F and Tide HE in phases I and II.
The amount of detergent used by participants depended on the individual, the weight of the washload and there were some differences as well between phases I and II. Figure 4.8 shows thedistribution of loads for both phases according to the amount of detergent used with each load.Since the smallest division on the laundry cup was ¼ cup, detergent use in ¼ cup increments wasused to produce this figure. It can be seen that about 30% of loads were washed using ¼ cup ofdetergent and that about 80% of all loads were washed using ½ cup of detergent or less. In phaseII, participants tended to favor using ½ cup of detergent rather than ¼ or ¾ cup, whereas in phaseI, the distinction is less sharp. Surprisingly, there were some (albeit few) loads washed using 2cups of detergent.
The relation between detergent concentration (cups of detergent relative to load size) and thedistribution of loads is shown in Fig. 4.9. As expected, this histogram is similar in shape to theone in Fig. 4.8. The most frequently found detergent concentration in phase I ranged from 0.06 to0.08 cups of detergent per pound of load weight. With the phase II washer, the most frequentlyused detergent concentration was somewhat less at 0.04 to 0.06 cups/pound. One of the moreinteresting points from this Figure is the fact that that detergent concentration varied fivefoldacross about 80% of all wash loads. These differences are reflective of the individual washinghabits of each of the participants (some use less, some more detergent for a given load size).

- 25 -
Fig. 4.8 Detergent use by load.
34%
43%
16%
6%
25%
10%6%
58%
0%
10%
20%
30%
40%
50%
60%
0.25 0.5 0.75 1 1.25 1.5 1.75 2
Detergent Amount (Cups/Load)
% o
f Loa
ds
Phase I
Phase II
Phase I7,061 (92.4%) out of 7,645 records
Phase II12,393 (93.8%) out of 13,213 records
Fig. 4.9 Changes in detergent concentration.
0.3%
13.5
%
21.2
%
22.3
%
15.5
%
9.7%
5.3%
3.7%
2.1%
1.4%
1.2% 3.
0%
0.3%
10.8
%
25.4
%
22.6
%
15.1
%
9.9%
4.8%
3.5%
1.9%
1.2%
1.2% 2.
6%
0.6%
0.7%
0%
5%
10%
15%
20%
25%
30%
0 to
0.0
2
0.02
to 0
.04
0.04
to 0
.06
0.06
to 0
.08
0.08
to 0
.1
0.1
to 0
.12
0.12
to 0
.14
0.14
to 0
.16
0.16
to 0
.18
0.18
to 0
.2
0.2
to 0
.22
0.22
to 0
.24
0.24
to M
ore
Detergent Concentration (Cups/Lb) Groups
% o
f Loa
ds
Phase I
Phase II
Phase I6,979 (91.3%) out of 7,645 records
Phase II
12,336 (93.4%) out of 13,213 records
- 26 -
4.5. IMPACTS ON USE OF OTHER ADDITIVES
In addition to detergent use, there are a variety of additives which can be used to help launderclothes. Heavily soiled clothing can be pretreated with a stain removal agent, bleach in solid orliquid form can be used to oxidize stains and improve brightness, and fabric softeners can also beused in the final rinse or in the dryer. Study participants used none of these additives inapproximately 30% of all loads washed, and there was no significant difference in non-usebetween phases I and II. Chlorine bleach was used for about 5% of all loads, and color-safebleach was used for about 5% of all loads, and there was little difference in use of bleach betweenphases. A fabric softener was used for about 60% of the loads on phase II and for as many as43% of loads in phase I. It remains unclear as to why there is this difference in fabric softeneruse. It may be attributed to the availability of a dispenser on all of the phase II washers toautomatically dispense softener at the appropriate time in the system, whereas an automaticdispenser would likely be present on a smaller number of phase I washers due to their age. Forthe most part, differences in how wash additives were used were more a function of habits andcustoms of the individual participants and less a function of the phase of the study.
4.6. IMPACTS ON LAUNDRY HABITS
The wash cycle of the h-axis washer is a little longer than the wash cycle for a typical v-axiswasher. To determine whether this made much difference in when participants washed loads, weanalyzed the distribution of loads according to day of the week. If the somewhat longer cycletimes made much of a difference, it might be seen through this distribution. Saturdays followedby Mondays as shown in Fig. 4.10 continued to be the days of the week when most loads werewashed. Although slightly fewer loads were washed on Saturdays and slightly more loads werewashed on Sundays during phase II than during phase I, there does not appear to be an indicationthat phase II washing had to be continued into days of the week when fewer loads wouldordinarily have been done. Tuesday through Thursdays continued to be light laundry days duringboth phases of the study.
4.7. IMPACTS ON WASHER SETTINGS
The phase I as well as the phase II clothes washers had the ability to set the water temperatureused during the wash and rinse cycles. In both study phases, participants continued to set thesetemperatures according to their customary laundry habits and custom, and to record settinginformation on the load datasheets. From these data, temperature utilization factors (TUFs) weredetermined as shown in Fig. 4.11. The wash/rinse temperature settings (H = hot, W = warm, C =cold) are shown along the horizontal axis, and the fraction of loads washed by participants usingeach of these settings is shown at the left. The TUFs used in both phases of the study were closeto the TUFs defined and used in the DOE Test Procedure for rating clothes washers and shown inthe figure for comparison. Most of the wash load cycles were done using W/C temperaturesettings, and about 94% of the loads were rinsed in cold water. In the DOE Test Procedure6, thecombined TUFs for cold water wash is 82%. Apparently, the participants were generally moreconserving of hot water and washed a larger fraction of the loads in warm water. Based on thefact that farming is a principal vocation in Bern, it is reasonable to expect that warm water rinseswould be used to the extent shown. Hot water was used for the wash cycle more often in phase IIthan in phase I, and warm water was used for washing more frequently in phase I than in phase II.
6 Federal Register, Rules and Regulations, Vol. 62, No. 166, August 27, 1997. p. 45507

- 27 -
Fig. 4.10 Distribution of wash loads through the week.
10%
15%14% 13% 12% 13%
23%
12%15%
12%13% 13%
14%
20%
0%
5%
10%
15%
20%
25%
Sun Mon Tue Wed Thu Fri Sat
% o
f Tot
al L
oad
Wei
ght
Phase 1Phase 2
Phase I6,851 (89.6%) out of 7,645 records
Phase II11,764 (89.0%)out of 13,213 records
Fig. 4.11 Temperature utilization factors for phases I and II.
10%17%
67%
6%9%
25%
58%
8%
15%12%
55%
18%
0%
10%
20%
30%
40%
50%
60%
70%
CC HC WC WW
Wash and Rinse Settings
% o
f Loa
ds
Phase 1
Phase 2
DOE Test Procedures
Phase I7,199 (94.2%) out of 7,645 records
Phase II12,827 (97.1%)out of 13,213 records
4.8. CLEANING PERFORMANCE
From a customer’s perspective, the cleaning performance of a clothes washer is paramountamong the other attributes. In general, customers are unwilling to compromise cleaning
- 28 -
performance in exchange for savings in energy and water or for added features on a washer. Aswasher technologies and qualities have improved and markets have remained competitive,customers have come to expect a high degree of cleaning performance from any washerpurchased. In the study, the issue of cleaning performance was evaluated by participants basedon visual inspection of laundry loads removed from the washers. Visual inspection of loads tojudge how well the load was cleaned is a useful tool for determining “cleanability” particularlysince it is based on the experience, familiarity with individual articles of clothing and laundryhabits of each of the individual participants. Moreover, the 5-month duration of the studyincluding both phases made it likely that a participant would likely wash the same articles anumber of times and would be aware of any substantive changes in cleaning. The “cleanabilty”index used in the study was indicative of participants’ reaction to the overall cleanliness of eachload without reference to individual cleaning features such as stain type and removal, brightness,soil removal, and other specific measures.
With each load washed, participants were requested to indicate their satisfaction with the cleaningperformance of the washer on a scale of five choices ranging from “Completely satisfied” to Notat all satisfied.” The results for phase I and for phase II are shown in Fig. 4.12. These resultsare based on information on the datasheets received (94% response rate for phase I and 93% forphase II). Overall, it appears that participants were at least reasonably satisfied with theirwashers’ performance in phase I as well as in phase II. There were, however, significantimprovements in cleaning satisfaction levels as participants moved to the phase II washer. Themost significant change is in the fraction of loads in which participants were “completelysatisfied.” This fraction rose from 15% in phase I to 45% in phase II. Moreover, the fraction ofloads in which participants were “somewhat satisfied” decreased. Dissatisfaction with cleaningperformance (generally indicated by participants either “not very” or “not at all” satisfied) wasnot seen very often in either phase I or in phase II. It appears that the differences shown in Fig.4.12 are significant between the two phases. These results show that, in general, the overallsatisfaction level for the entire population of participants in the cleaning performance of theirwashers increased significantly as a result of the changeover to the phase II washer. Details onthe relative influence of factors such as the phase I washer vintage on cleaning satisfaction aregiven in Section 5.2.
4.9. IMPACTS ON LOAD DAMPNESS
In a manner similar to the data gathered on cleaning performance, participants were asked toindicate how satisfied they were with how dry the loads felt as they were removed from thewasher at the conclusion of a wash cycle. An indication of “not at all satisfied” would mean thatat the end of the wash cycle, the load was much wetter than anticipated indicating that the spincycle was not as effective as participants believed it should have been. The dryness of a loadafter washing also affects the energy used for the final drying process. If a load with a lowmoisture level is placed into a dryer, less energy would be needed to dry the load and the dryingtime would be shortened. This is the usual case particularly if the dryer is controlled by a sensorwhich detects either the moisture or temperature of the air exiting the dryer. Information onsatisfaction with load dampness was submitted for 94% of the total records reported in the study,and the overall results are shown in Fig. 4.13. Apparently, there was noted improvement insatisfaction levels from the changeover to the phase II washer. The largest improvement wasfound in the category “completely satisfied” in which the fraction of loads meeting thissatisfaction level increased nearly five-fold. Noticeably too was the reduction in the number ofloads in the category “somewhat satisfied.” In both phases, although more markedly in phase I,there were loads for which participants expressed some degree of dissatisfaction with dampness.
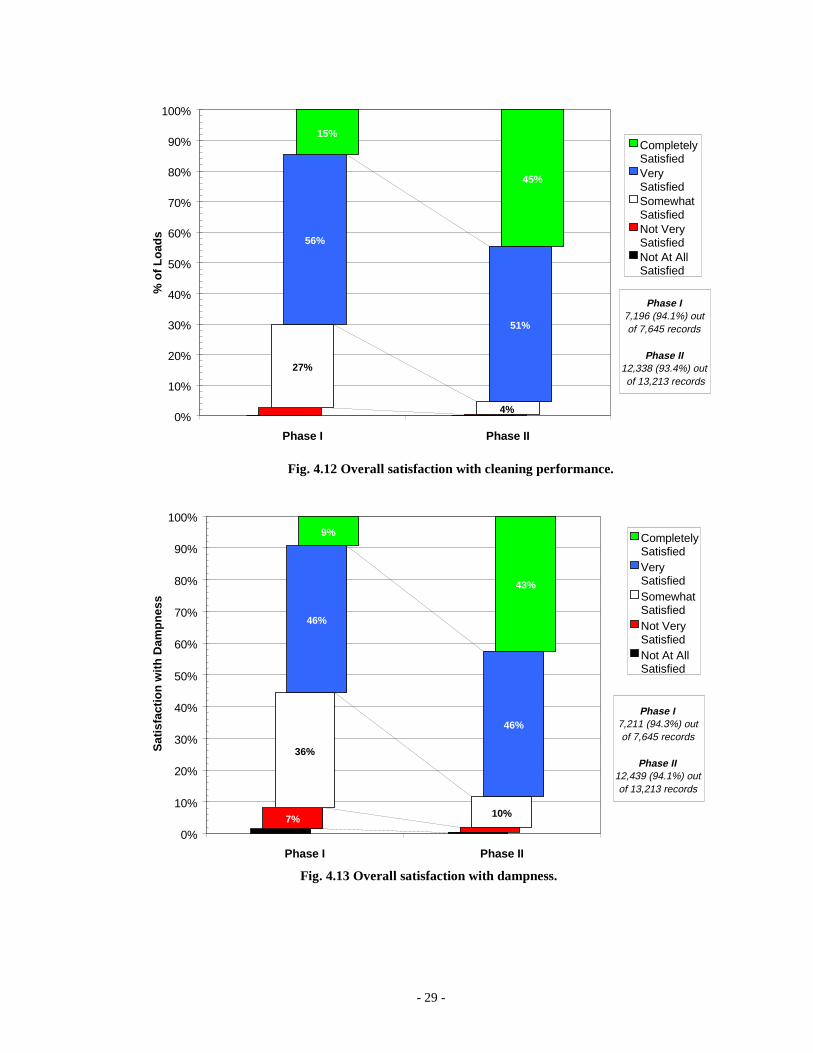
- 29 -
Fig. 4.12 Overall satisfaction with cleaning performance.
27%
56%
51%
15%
45%
4%0%
10%
20%
30%
40%
50%
60%
70%
80%
90%
100%
Phase I Phase II
% o
f Loa
dsCompletelySatisfiedVerySatisfiedSomewhatSatisfiedNot VerySatisfiedNot At AllSatisfied
Phase I 7,196 (94.1%) outof 7,645 records
Phase II 12,338 (93.4%) out of 13,213 records
Fig. 4.13 Overall satisfaction with dampness.
7%
36%
10%
46%
46%
9%
43%
0%
10%
20%
30%
40%
50%
60%
70%
80%
90%
100%
Phase I Phase II
Sat
isfa
ctio
n w
ith D
ampn
ess
CompletelySatisfiedVerySatisfiedSomewhatSatisfiedNot VerySatisfiedNot At AllSatisfied
Phase I7,211 (94.3%) out of 7,645 records
Phase II12,439 (94.1%) out of 13,213 records

- 30 -
4.10. IMPACTS ON DRYING HABITS
Dryer energy consumption was not measured in the study; however, after each wash, participantsindicated how each load would be dried, whether in the dryer, on a clothesline or some of each.The distribution of loads and how they were to be dried is shown in Fig. 4.14. About 70% of allloads washed during phase I and II were dried at least partially in the dryer. About 20% weredried only on the clothesline, and there were no significant differences between phases I and II.Based on this information, the customary habits of participants did not change as a result of thechangeover to the h-axis washer. This information could be useful in determining any savings indryer energy consumption if there were differences in the remaining moisture content (RMC)between the v-axis and h-axis washers. Since the dryer was not used at all for about 18−26% ofthe loads depending on the study phase, any savings due to lower RMC should be lowered by thatsame decrement.
Fig. 4.14 How loads were dried.
59%
26%
11%
66%
18%10%
4% 5%0%
10%
20%
30%
40%
50%
60%
70%
Dryer only Clothesline only Dryer and Clothesline Not Indicated byParticipant
% o
f Loa
ds
Phase 1
Phase 2
Phase I100 % of 7,645 records
Phase II100 % of 13,213 records
4.11. MUNICIPAL UTILITY IMPACTS
The water used by clothes washers comes from the same source as all of the drinking water to ahouse. After each wash/rinse cycle, most of the water that is used ends up going down the drain;only the small portion bound up in the wet clothes passes into the air during the drying process.Consequently, the amount of water used by clothes washers has an impact on the serviceproviding the water to washers as well as the service for treating an equal amount of wastewaterfrom the washer. In the study, the systems for supplying water and disposing of waste water weredifferent depending on whether a participant lived in Bern proper or in the region whichsurrounds the city. Both water and sewer services are provided to residents who live in the town.Water is provided from a few community wells, some far away. One large (50,000-gallon) watertower located inside the city limits is used to provide most of the capacity needed by the town.This tower, shown in Fig. 4.15 has also served Bern faithfully as a landmark since its erection in1953.

- 31 -
Wastewater from the city is carried through underground sewer lines to a wastewater treatmentfacility at the edge of town. This facility consists of a small number of lagoons that allowevaporation of water and biological breakdown of wastes.
In the area surrounding Bern itself, water comes to residents in two ways: through their individualwells and/or through the community water supply system or Rural Water District (RWD). TheRWD consists of distributed water piping to each of the homes in the District along with twostandpipes (one shown in Fig. 4.16 to maintain adequate water pressure at critical points in thewater distribution system.
Fig. 4.15 Bern's 50,000-gallon tank.Figure 4.16 Rural Water District
standpipe (Nemaha County).
Wastewater from residents of the RWD is treated with individual septic systems as are commonthroughout much of the rural areas of the nation. Many households located in the RWD usedindividual wells to meet agricultural and farming water needs and used the water from the RWDfor domestic needs such as clothes washing. For a household in the RWD to qualify as aparticipant in the study, it was required that its domestic water be provided through the RWDutility.
The impacts of clothes washers on the water utilities (supply and wastewater) in and around Bernwere evaluated through two “Superwash Saturdays.” The first Superwash Saturday (SWS) wasconducted on June 28, 1997, when the original washers were still in place, and the second SWSwas held on September 13, 1997, with the h-axis washers up and operating. The objective onboth occasions was to measure the delivery flowrate water to the city and to the RWD, and thewastewater flowrate from the city throughout the day. These data, combined with informationfrom the datasheets filled out by participants would allow the impacts of clothes washing on thecommunity’s water infrastructures to be determined. On each Saturday, valves on the waterpiping in Bern and the RWD were used to stop the water flow to Bern’s water tower, and toisolate water flow to both standpipes in the RWDs so that water input could be determined. The
- 32 -
water discharge from each tank was determined by monitoring the water level inside the tank as itdropped throughout the day. Tank water levels were measured indirectly through use of pressuretransducers that had been installed in the water lines at the base of each water tower. The waterpressure at the location of the transducer is directly proportional to the height of the water in thetank. The amount of water discharged from the tank over any time interval was determined fromchanges in pressure sensed by the transducer over this same time interval and the diameter of thetank. Based on this procedure, the volume of water supplied to the city of Bern as well as to theRWD was determined throughout the day on each of the SWSs.
The flowrate of wastewater from Bern was determined through instrumentation that was installedat the lagoon. This instrumentation consisted of a sensor to measure the height of wastewaterupstream and downstream of a v-notch weir through which wastewater flowed just beforeemptying into the lagoon. The difference in height at these two points is proportional to thevolume flowrate of water passing through the weir. This instrumentation was connected to abattery-powered datalogger, and data on the rate of wastewater generation on both SWSs werecollected and compared with the rate of fresh water consumption of the city of Bern.
There were two main objectives of the SWS concept. The first was to determine the impacts thatclothes washers have on water utilities as compared with all of the other water uses present inhouseholds. The idea was to encourage participants to postpone most of their week’s washinguntil Saturday when many loads would be done signifying a large wash day. The secondobjective of the Superwash concept was to determine the differences in water consumption of thecollection of washers between phases I and II. This gives an idea of the impact that a large-scalechangeover to h-axis washers can have on a community’s water utilities.
The impact of a heavy wash day on the Bern’s water supply and wastewater disposal system fromthe first SWS is shown in Fig. 4.17. On this day, data on water flow from Bern’s water tank andwastewater flow into the lagoon began to be collected about 9:30 a.m. The figure shows that overthe day about 16,000 gallons of water were used and discharged down the drains of the residentsof the city. The total flows to the lagoon and from the water tank were about the same, and thisindicates that there was no outside watering done. The source of noise in the signal from the citywater tank beginning about 2:00 p.m. is unknown. The collective water consumption of themetered clothes washers in the city has been added to this plot as shown in the Figure. Althoughsome participants started loads early in the morning, most began about the time that utility waterdata collection began. Figure 4.17 shows the clothes washer water consumption with a beginningtime of 9:30 a.m. It can be seen that over the day, the 48 v-axis washers in the city used about18-20% of the total water used by the town. Moreover, these washers accounted for the samefraction of total wastewater generated by the town. It should be pointed out that Saturdays arenormally heavy wash days already and that participants were encouraged to concentrate theirweek’s laundry on the 6/28/97 SWS. Records show that on that day, study participants who livedinside Bern washed 164 loads of clothes weighing 1,027 pounds using 72 cups of detergent.
Similar information was obtained for the water consumed by the surrounding RWD and the loadsof clothes done by washers located in the rural water district. This information was used tosupplement the information developed for the city to arrive at the total impact of SWS on thecommunity. This summary information, shown in Figure 4.18 indicates that the city and RWDtogether used 55,000 gallons of water, and that clothes washers, based on measurements from the103 individual washers, used about 12,000 gallons of water (22% of the total). During that time,all 103 participants in the study washed 503 loads weighing 3,336 pounds with 225 cups ofdetergent. On average, participants in the rural water district washed 68% of the total number ofloads done that day.

- 33 -
0
4,000
8,000
12,000
16,000
20,000
9:00 AM 11:00 AM 1:00 PM 3:00 PM 5:00 PM
Time of Day
Gallons
From cit y water tank
To lagoon
Used byclothes washers
in city
Fig. 4.17 Water utilization in Bern during first Superwash Saturday, 6/28/97 for phase Iwashers.
0
10,000
20,000
30,000
40,000
50,000
60,000
9:00 AM 11:00 AM 1:00 PM 3:00 PM 5:00 PM
Time of Day
Gallons
From city andrural water tanks
Used by allclothes washers
in study
Fig. 4.18 Water utilization in Bern and RWD during first Superwash Saturday, 6/28/97 forphase I washers.
It can be concluded from this analysis that on a heavy laundry day (e.g. 6/28/97 for Bern), acommunity like Bern could be expected to use 18 – 22% of its total water consumption in clotheswashing. The fraction of wastewater generated by clothes washers would be at least this much –
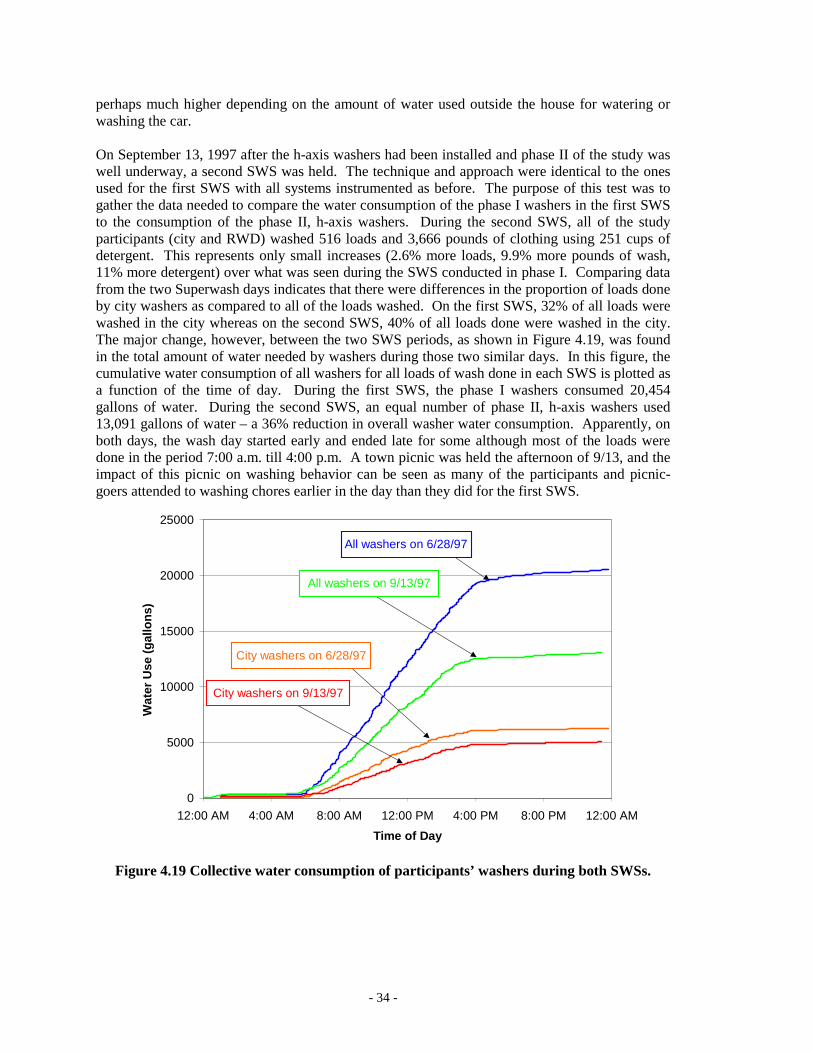
- 34 -
perhaps much higher depending on the amount of water used outside the house for watering orwashing the car.
On September 13, 1997 after the h-axis washers had been installed and phase II of the study waswell underway, a second SWS was held. The technique and approach were identical to the onesused for the first SWS with all systems instrumented as before. The purpose of this test was togather the data needed to compare the water consumption of the phase I washers in the first SWSto the consumption of the phase II, h-axis washers. During the second SWS, all of the studyparticipants (city and RWD) washed 516 loads and 3,666 pounds of clothing using 251 cups ofdetergent. This represents only small increases (2.6% more loads, 9.9% more pounds of wash,11% more detergent) over what was seen during the SWS conducted in phase I. Comparing datafrom the two Superwash days indicates that there were differences in the proportion of loads doneby city washers as compared to all of the loads washed. On the first SWS, 32% of all loads werewashed in the city whereas on the second SWS, 40% of all loads done were washed in the city.The major change, however, between the two SWS periods, as shown in Figure 4.19, was foundin the total amount of water needed by washers during those two similar days. In this figure, thecumulative water consumption of all washers for all loads of wash done in each SWS is plotted asa function of the time of day. During the first SWS, the phase I washers consumed 20,454gallons of water. During the second SWS, an equal number of phase II, h-axis washers used13,091 gallons of water – a 36% reduction in overall washer water consumption. Apparently, onboth days, the wash day started early and ended late for some although most of the loads weredone in the period 7:00 a.m. till 4:00 p.m. A town picnic was held the afternoon of 9/13, and theimpact of this picnic on washing behavior can be seen as many of the participants and picnic-goers attended to washing chores earlier in the day than they did for the first SWS.
0
5000
10000
15000
20000
25000
12:00 AM 4:00 AM 8:00 AM 12:00 PM 4:00 PM 8:00 PM 12:00 AM
Time of Day
Wat
er U
se (
gallo
ns)
All washers on 6/28/97
All washers on 9/13/97
City washers on 6/28/97
City washers on 9/13/97
Figure 4.19 Collective water consumption of participants’ washers during both SWSs.
- 35 -
5. ANALYSES OF FINDINGS AND IMPACTS
In this study, phase I washers spanning a range of ages, brands, and features were replaced by asingle type, brand and model washer (Maytag’s h-axis Neptune model). The impacts reported inthe previous sections of this report were based on the “average” phase I washer in the Bern Study.This “average” washer was found to be about 8 years old, to consume 11.6 gallons of hot waterand 29.9 gallons of cold water per load, and to have the other average characteristics shown inTable 4.1. In this section of the report, we analyzed relationships between several of theparameters to determine their influence on the findings. Although there are a number of analysesthat could be conducted from information provided in the study, we chose to perform a limitednumber of analyses. These analyses were designed to answer some key questions posed in thestudy as well as to evaluate some performance-related issues associated with the h-axis washersuch as:
- How does water savings depend on the load size?- How does the cleaning performance (cleanability) depend on the age of the phase
I baseline washer?- What were the impacts of using the conventional detergent vs. the high-
efficiency detergent in the h-axis washer?- Other than the washer itself, how did other factors affect the cleaning
performance?
In the following sections, we explore some of these questions.
5.1. WATER CONSUMPTION
The amount of water consumed by a washer is determined by a number of factors as shown inFig. 5.1. Some of these factors are fixed and depend on the design of the washer itself whileothers depend on how the washer is used and operated by customers.
• Machine. Three principal characteristics of a washer affect its water consumption,and these include the type of washer (v-axis or h-axis), the age of the washer (olderwashers may be less water-efficient than newer ones), and the washer settings usedby customers.
• Load. The load type and size affects the water consumption of a washer. Many v-axis washers have a load size setting (switch or knob) that can be used to regulate thewater level inside the tub. It is not clear how many actually use this switch to adjusttheir water use with load size. However, there is also the chance that small loadscould be washed using a large load-size setting, and this would require more water tobe used than is necessary. These washers also have a water level sensor that controlsthe level of water in the tub for the washing and deep rinse cycles. Since clothes tendto displace water in the tub of a v-axis washer during a fill cycle, the water needed toreach each water level setting depends on the size and makeup of the load in the tub.The h-axis washer is designed to operate without using a switch for setting thewasher according to load size, i.e. the washer regulates the amount of water needed towash and rinse each load – less water for smaller loads and more water for largerones. Therefore, for both types of washer, v- or h-axis, load size should affect waterconsumption.

- 36 -
• Detergent. The type and amount of detergent can affect a washer’s waterconsumption. The vigorous tumbling action of the h-axis washer can causeoversudsing if too much of a conventional, high sudsing detergent is used. TheNeptune was designed to sense any oversudsing condition, and if found wouldautomatically call for extra water to eliminate the condition as part of a sudsmanagement protocol. The extent to which extra water was required depends on theamount of detergent that participants used for each load and the type of detergent:their normal brand or the low sudsing Tide HE.
Typ e Ag e Settin gs
Machine
Size
Load
Typ e Amount
Deter gent
WaterConsum ption
Fig. 5.1 Washing factors that determine water consumption
In a prior section of this report (Section 4), we looked at the influence of washer type on waterconsumption. We found that the v-axis washers of phase I tended to use more water (on average15 gallons more) than the h-axis washers of phase II. In the current section of this report, weexplore the two remaining factors (load size and detergent type/amount) to determine how theyaffect water consumption. Throughout both phases of the study, participants washed loadsranging in size from a pound or so to much larger weights. From these data, relations betweenload weight and water consumption per unit load weight were developed by performing astatistical analysis (best fit) of the load weight/water consumption data. The results of thisanalysis are shown in Fig. 5.2. The trends for phase I and II are similar showing that as loadweight increases, the ratio of water consumption to load weight decreases. This means that bothtypes of washers, h-axis and v-axis tend to use water more efficiently at higher load weights.Across the load weights shown, the h-axis model used less water per pound of load than did thev-axis model and this relative improvement in performance increases with load weight. The noteson the curves for the h-axis and v-axis washers shows the equations developed for a single-parameter fit of water consumption to load weight. The notes further indicate that much of thewater consumption for either washer can be explained by this single parameter model.
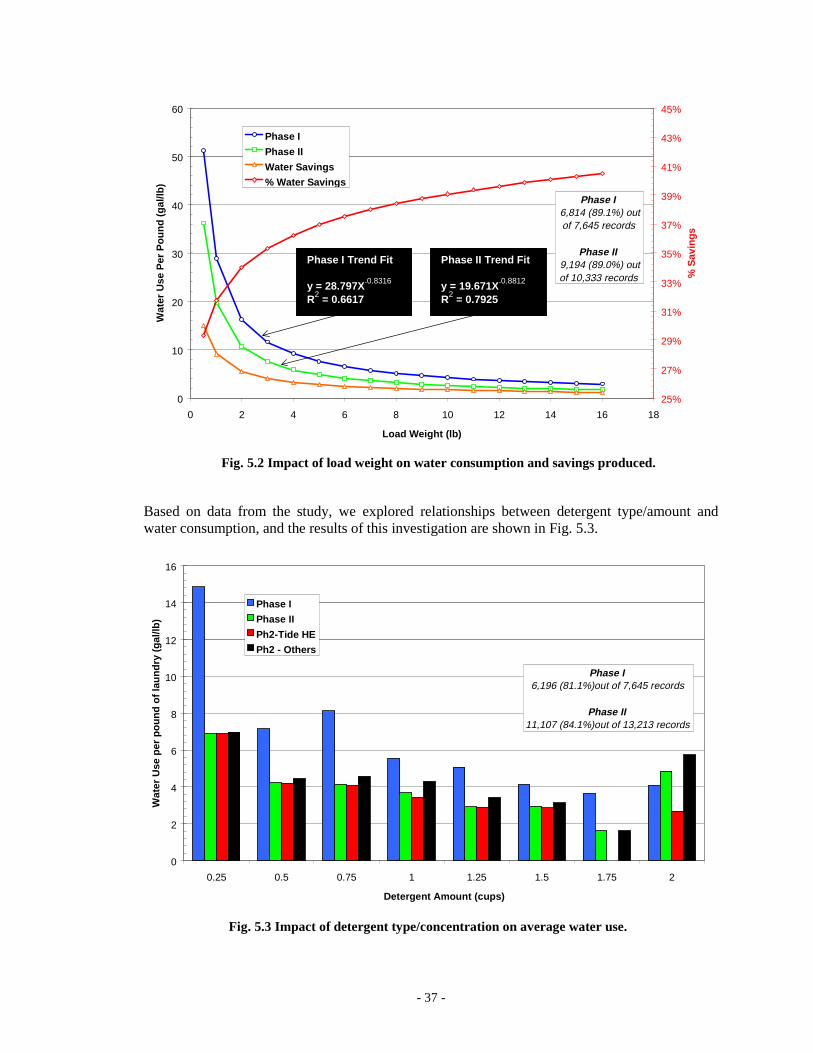
- 37 -
Fig. 5.2 Impact of load weight on water consumption and savings produced.
0
10
20
30
40
50
60
0 2 4 6 8 10 12 14 16 18
Load Weight (lb)
Wat
er U
se P
er P
ound
(ga
l/lb)
25%
27%
29%
31%
33%
35%
37%
39%
41%
43%
45%
% S
avin
gs
Phase I
Phase II
Water Savings
% Water Savin gs
Phase I 6,814 (89.1%) out of 7,645 records
Phase II 9,194 (89.0%) out of 10,333 records
Based on data from the study, we explored relationships between detergent type/amount andwater consumption, and the results of this investigation are shown in Fig. 5.3.
Fig. 5.3 Impact of detergent type/concentration on average water use.
0
2
4
6
8
10
12
14
16
0.25 0.5 0.75 1 1.25 1.5 1.75 2
Detergent Amount (cups)
Wat
er U
se p
er p
ound
of l
aund
ry (
gal/l
b)
Phase I
Phase II
Ph2-Tide HE
Ph2 - Others
Phase I6,196 (81.1%)out of 7,645 records
Phase II11,107 (84.1%)out of 13,213 records
Phase I Trend Fit
y = 28.797X-0.8316
R2 = 0.6617
Phase II Trend Fit
y = 19.671X-0.8812
R2 = 0.7925
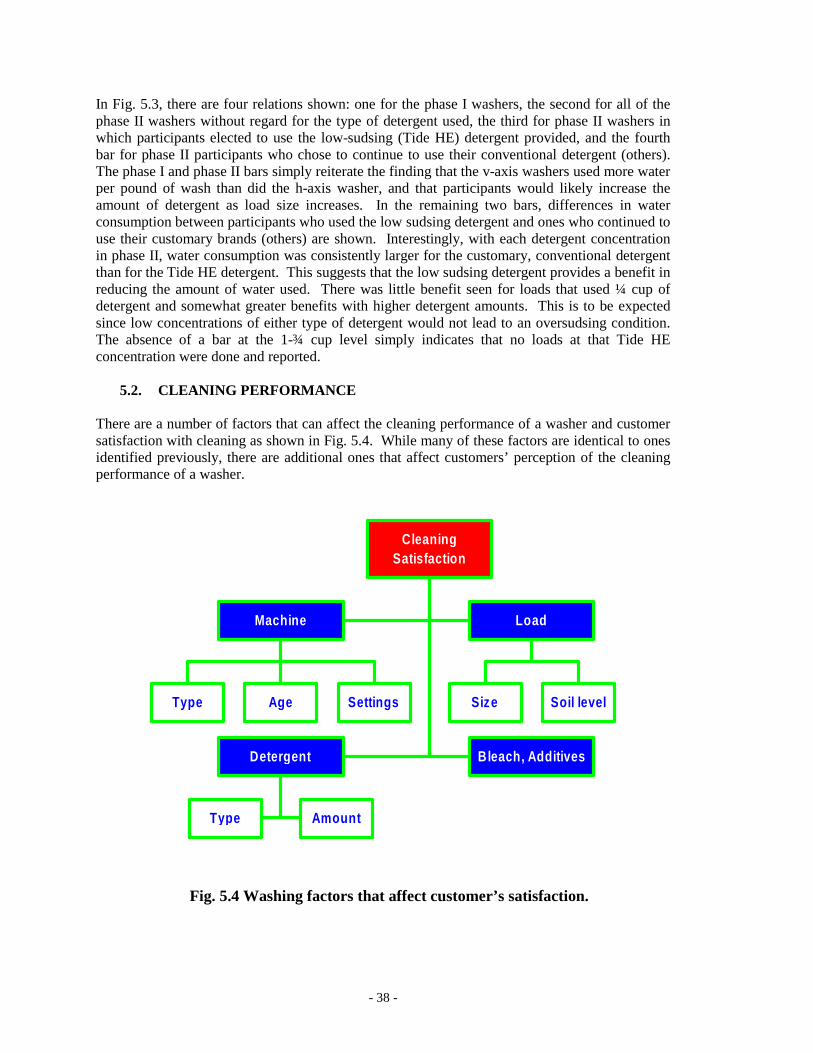
- 38 -
In Fig. 5.3, there are four relations shown: one for the phase I washers, the second for all of thephase II washers without regard for the type of detergent used, the third for phase II washers inwhich participants elected to use the low-sudsing (Tide HE) detergent provided, and the fourthbar for phase II participants who chose to continue to use their conventional detergent (others).The phase I and phase II bars simply reiterate the finding that the v-axis washers used more waterper pound of wash than did the h-axis washer, and that participants would likely increase theamount of detergent as load size increases. In the remaining two bars, differences in waterconsumption between participants who used the low sudsing detergent and ones who continued touse their customary brands (others) are shown. Interestingly, with each detergent concentrationin phase II, water consumption was consistently larger for the customary, conventional detergentthan for the Tide HE detergent. This suggests that the low sudsing detergent provides a benefit inreducing the amount of water used. There was little benefit seen for loads that used ¼ cup ofdetergent and somewhat greater benefits with higher detergent amounts. This is to be expectedsince low concentrations of either type of detergent would not lead to an oversudsing condition.The absence of a bar at the 1-¾ cup level simply indicates that no loads at that Tide HEconcentration were done and reported.
5.2. CLEANING PERFORMANCE
There are a number of factors that can affect the cleaning performance of a washer and customersatisfaction with cleaning as shown in Fig. 5.4. While many of these factors are identical to onesidentified previously, there are additional ones that affect customers’ perception of the cleaningperformance of a washer.
Typ e Age Settin gs
Machine
Size Soil level
Load
Typ e Amount
Deter gent B leach, Additives
Cleanin gSatisfaction
Fig. 5.4 Washing factors that affect customer’s satisfaction.
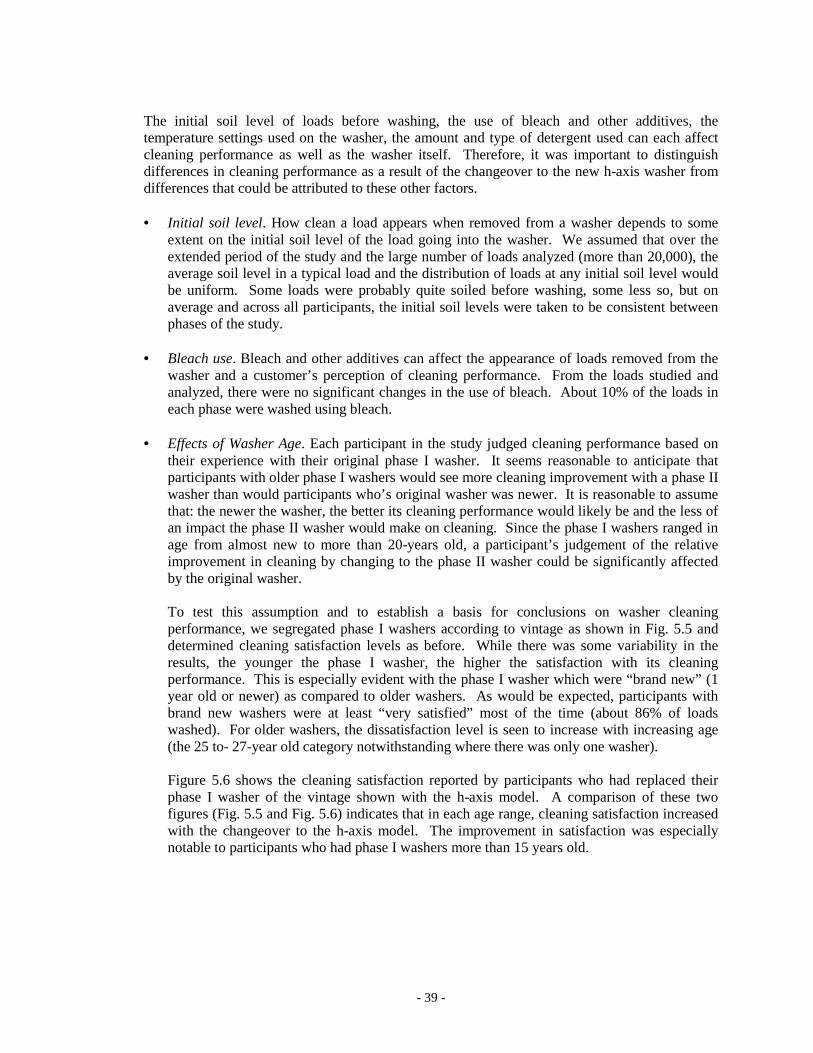
- 39 -
The initial soil level of loads before washing, the use of bleach and other additives, thetemperature settings used on the washer, the amount and type of detergent used can each affectcleaning performance as well as the washer itself. Therefore, it was important to distinguishdifferences in cleaning performance as a result of the changeover to the new h-axis washer fromdifferences that could be attributed to these other factors.
• Initial soil level. How clean a load appears when removed from a washer depends to someextent on the initial soil level of the load going into the washer. We assumed that over theextended period of the study and the large number of loads analyzed (more than 20,000), theaverage soil level in a typical load and the distribution of loads at any initial soil level wouldbe uniform. Some loads were probably quite soiled before washing, some less so, but onaverage and across all participants, the initial soil levels were taken to be consistent betweenphases of the study.
• Bleach use. Bleach and other additives can affect the appearance of loads removed from thewasher and a customer’s perception of cleaning performance. From the loads studied andanalyzed, there were no significant changes in the use of bleach. About 10% of the loads ineach phase were washed using bleach.
• Effects of Washer Age. Each participant in the study judged cleaning performance based ontheir experience with their original phase I washer. It seems reasonable to anticipate thatparticipants with older phase I washers would see more cleaning improvement with a phase IIwasher than would participants who’s original washer was newer. It is reasonable to assumethat: the newer the washer, the better its cleaning performance would likely be and the less ofan impact the phase II washer would make on cleaning. Since the phase I washers ranged inage from almost new to more than 20-years old, a participant’s judgement of the relativeimprovement in cleaning by changing to the phase II washer could be significantly affectedby the original washer.
To test this assumption and to establish a basis for conclusions on washer cleaningperformance, we segregated phase I washers according to vintage as shown in Fig. 5.5 anddetermined cleaning satisfaction levels as before. While there was some variability in theresults, the younger the phase I washer, the higher the satisfaction with its cleaningperformance. This is especially evident with the phase I washer which were “brand new” (1year old or newer) as compared to older washers. As would be expected, participants withbrand new washers were at least “very satisfied” most of the time (about 86% of loadswashed). For older washers, the dissatisfaction level is seen to increase with increasing age(the 25 to- 27-year old category notwithstanding where there was only one washer).
Figure 5.6 shows the cleaning satisfaction reported by participants who had replaced theirphase I washer of the vintage shown with the h-axis model. A comparison of these twofigures (Fig. 5.5 and Fig. 5.6) indicates that in each age range, cleaning satisfaction increasedwith the changeover to the h-axis model. The improvement in satisfaction was especiallynotable to participants who had phase I washers more than 15 years old.
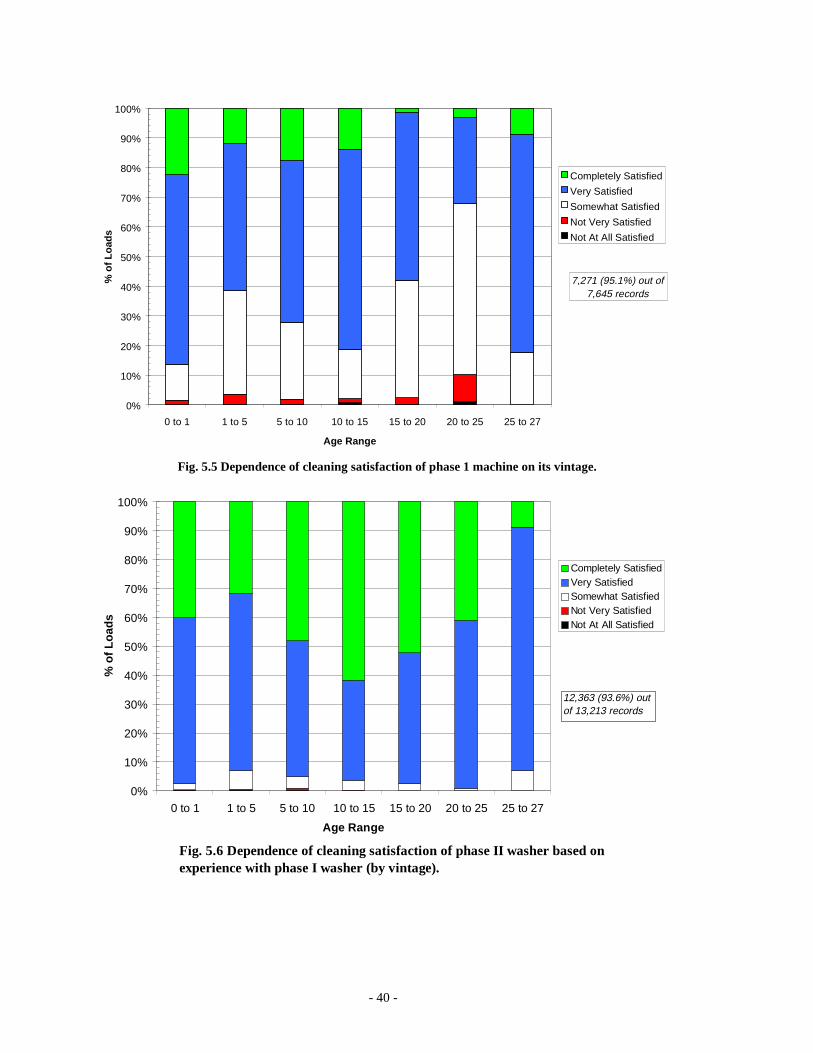
- 40 -
Fig. 5.5 Dependence of cleaning satisfaction of phase 1 machine on its vintage.
0%
10%
20%
30%
40%
50%
60%
70%
80%
90%
100%
0 to 1 1 to 5 5 to 10 10 to 15 15 to 20 20 to 25 25 to 27
Age Range
% o
f Loa
ds
Completely Satisfied
Very Satisfied
Somewhat Satisfied
Not Very Satisfied
Not At All Satisfied
7,271 (95.1%) out of7,645 records
Fig. 5.6 Dependence of cleaning satisfaction of phase II washer based on experience with phase I washer (by vintage).
0%
10%
20%
30%
40%
50%
60%
70%
80%
90%
100%
0 to 1 1 to 5 5 to 10 10 to 15 15 to 20 20 to 25 25 to 27
Age Range
% o
f Loa
ds
Completely SatisfiedVery SatisfiedSomewhat SatisfiedNot Very SatisfiedNot At All Satisfied
12,363 (93.6%) out of 13,213 records
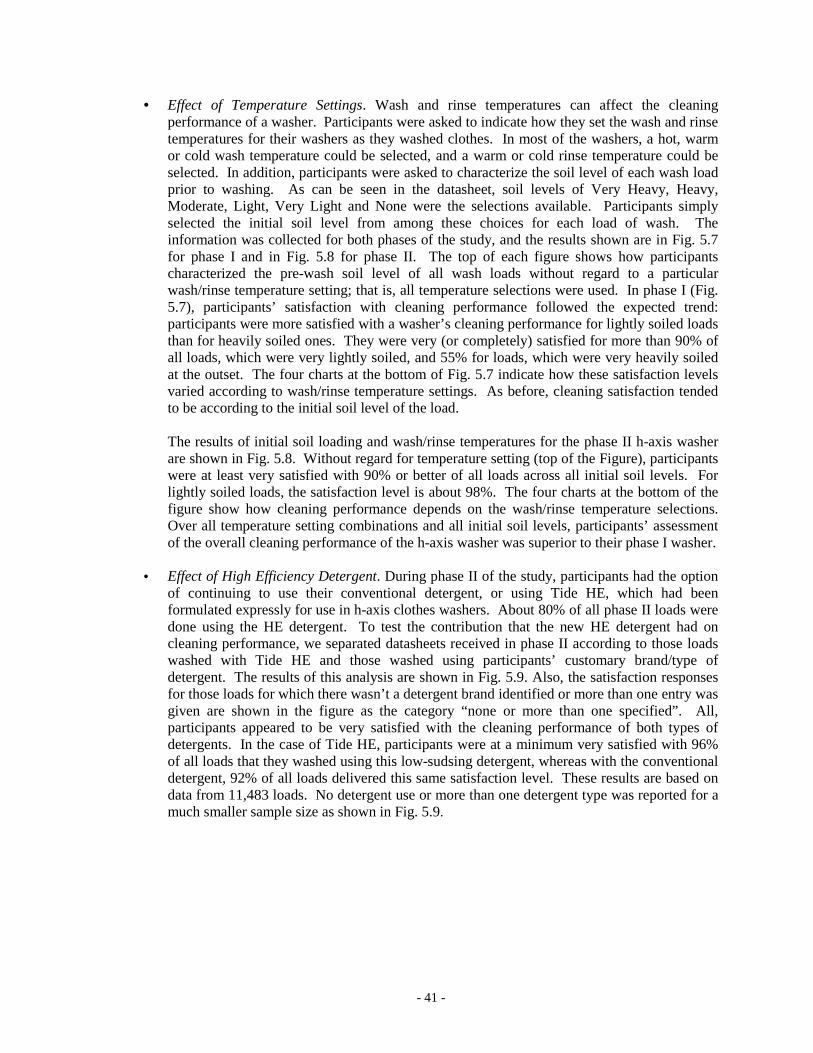
- 41 -
• Effect of Temperature Settings. Wash and rinse temperatures can affect the cleaningperformance of a washer. Participants were asked to indicate how they set the wash and rinsetemperatures for their washers as they washed clothes. In most of the washers, a hot, warmor cold wash temperature could be selected, and a warm or cold rinse temperature could beselected. In addition, participants were asked to characterize the soil level of each wash loadprior to washing. As can be seen in the datasheet, soil levels of Very Heavy, Heavy,Moderate, Light, Very Light and None were the selections available. Participants simplyselected the initial soil level from among these choices for each load of wash. Theinformation was collected for both phases of the study, and the results shown are in Fig. 5.7for phase I and in Fig. 5.8 for phase II. The top of each figure shows how participantscharacterized the pre-wash soil level of all wash loads without regard to a particularwash/rinse temperature setting; that is, all temperature selections were used. In phase I (Fig.5.7), participants’ satisfaction with cleaning performance followed the expected trend:participants were more satisfied with a washer’s cleaning performance for lightly soiled loadsthan for heavily soiled ones. They were very (or completely) satisfied for more than 90% ofall loads, which were very lightly soiled, and 55% for loads, which were very heavily soiledat the outset. The four charts at the bottom of Fig. 5.7 indicate how these satisfaction levelsvaried according to wash/rinse temperature settings. As before, cleaning satisfaction tendedto be according to the initial soil level of the load.
The results of initial soil loading and wash/rinse temperatures for the phase II h-axis washerare shown in Fig. 5.8. Without regard for temperature setting (top of the Figure), participantswere at least very satisfied with 90% or better of all loads across all initial soil levels. Forlightly soiled loads, the satisfaction level is about 98%. The four charts at the bottom of thefigure show how cleaning performance depends on the wash/rinse temperature selections.Over all temperature setting combinations and all initial soil levels, participants’ assessmentof the overall cleaning performance of the h-axis washer was superior to their phase I washer.
• Effect of High Efficiency Detergent. During phase II of the study, participants had the optionof continuing to use their conventional detergent, or using Tide HE, which had beenformulated expressly for use in h-axis clothes washers. About 80% of all phase II loads weredone using the HE detergent. To test the contribution that the new HE detergent had oncleaning performance, we separated datasheets received in phase II according to those loadswashed with Tide HE and those washed using participants’ customary brand/type ofdetergent. The results of this analysis are shown in Fig. 5.9. Also, the satisfaction responsesfor those loads for which there wasn’t a detergent brand identified or more than one entry wasgiven are shown in the figure as the category “none or more than one specified”. All,participants appeared to be very satisfied with the cleaning performance of both types ofdetergents. In the case of Tide HE, participants were at a minimum very satisfied with 96%of all loads that they washed using this low-sudsing detergent, whereas with the conventionaldetergent, 92% of all loads delivered this same satisfaction level. These results are based ondata from 11,483 loads. No detergent use or more than one detergent type was reported for amuch smaller sample size as shown in Fig. 5.9.
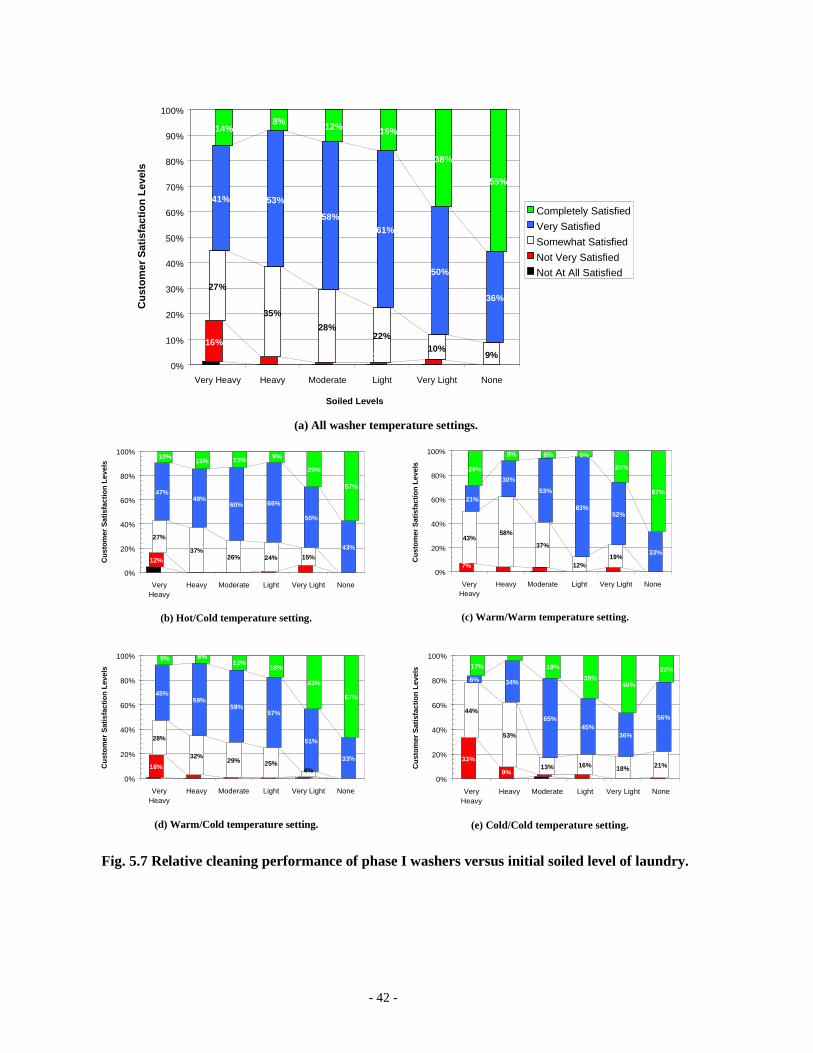
- 42 -
(a) All washer temperature settings.
16%
27%
35%
28%22%
41% 53%
58%61%
50%
36%
14%8% 12% 16%
38%
55%
1%10%
9%0%
10%
20%
30%
40%
50%
60%
70%
80%
90%
100%
Very Heavy Heavy Moderate Light Very Light None
Soiled Levels
Cus
tom
er S
atis
fact
ion
Leve
ls
Completely Satisfied
Very Satisfied
Somewhat Satisfied
Not Very Satisfied
Not At All Satisfied
(b) Hot/Cold temperature setting.
12%
27%
37%26% 24% 15%
47%48%
60% 66%
50%
43%
10%15% 13% 9%
29%
57%
0%
20%
40%
60%
80%
100%
VeryHeavy
Heavy Moderate Light Very Light None
Cus
tom
er S
atis
fact
ion
Leve
ls
(c) Warm/Warm temperature setting.
7%
43%58%
37%
12%19%
21%
30%
53%
83%52%
33%
29%
8%
26%
67%
5%6%
0%
20%
40%
60%
80%
100%
VeryHeavy
Heavy Moderate Light Very Light None
Cus
tom
er S
atis
fact
ion
Leve
ls
(d) Warm/Cold temperature setting.
18%
28%
32%29% 25%
4%
45%59%
59%57%
51%
33%
8% 6%
43%
67%
18%12%
0%
20%
40%
60%
80%
100%
VeryHeavy
Heavy Moderate Light Very Light None
Cus
tom
er S
atis
fact
ion
Leve
ls
(e) Cold/Cold temperature setting.
33%
44%
53%
13% 16% 18%
34%
65%45%
36%
56%
17%
46%
22%
9%21%
6% 35%
19%
0%
20%
40%
60%
80%
100%
VeryHeavy
Heavy Moderate Light Very Light None
Cus
tom
er S
atis
fact
ion
Leve
ls
Fig. 5.7 Relative cleaning performance of phase I washers versus initial soiled level of laundry.

- 43 -
(a) All washer temperature settings.
6%
51%54% 55%
42%
25% 24%
41% 41% 41%
52%
73% 73%
5%4%3%0%
10%
20%
30%
40%
50%
60%
70%
80%
90%
100%
Very Heavy Heavy Moderate Light Very Light None
Soiled Levels
Cus
tom
er S
atis
fact
ion
Leve
ls
Completely Satisfied
Very Satisfied
Somewhat Satisfied
Not Very Satisfied
Not At All Satisfied
(b) Hot/Cold temperature setting.
1%
48% 47%56% 47%
20%
45% 47%39% 44%
79%92%
7%4%4%5% 8%
0%
20%
40%
60%
80%
100%
Very Heavy Heavy Moderate Light Very Light None
Cus
tom
er S
atis
fact
ion
Leve
ls
(c) Warm/Warm temperature setting.
2%
35%49%
60%
14%
50%
54%44%
33%
81%
46%
64%
4%6%7%6%9%
36%
0%
20%
40%
60%
80%
100%
Very Heavy Heavy Moderate Light Very Light None
Cus
tom
er S
atis
fact
ion
Leve
ls
(d) Warm/Cold temperature setting.
59%61% 53%
42%
25%
33% 36%43%
52%
73% 69%
6%7% 5%
25%
0%
20%
40%
60%
80%
100%
Very Heavy Heavy Moderate Light Very Light None
Cus
tom
er S
atis
fact
ion
Leve
ls
(e) Cold/Cold temperature setting.
44%
48%59%
38%29%
24%
33%
49%38%
60%70%
22%
76%
0%
20%
40%
60%
80%
100%
Very Heavy Heavy Moderate Light Very Light None
Cus
tom
er S
atis
fact
ion
Leve
ls
Fig. 5.8 Relative cleaning performance of phase II washers versus initial soiled level of laundry.
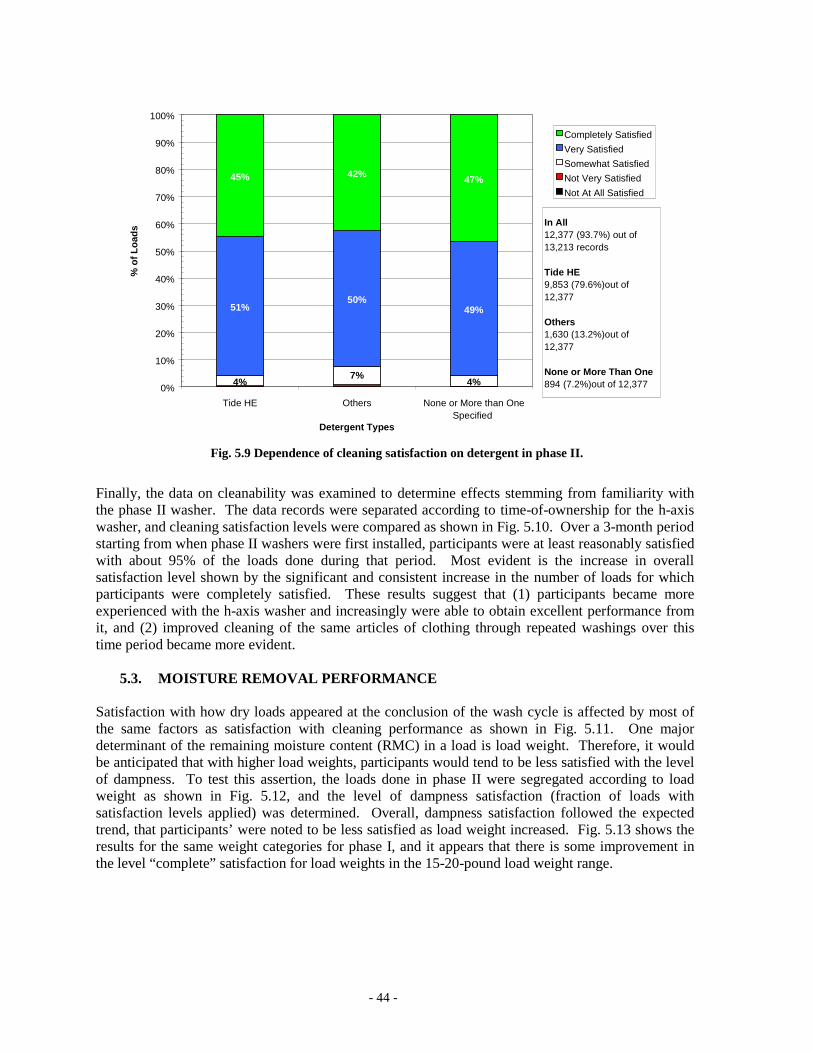
- 44 -
Fig. 5.9 Dependence of cleaning satisfaction on detergent in phase II.
7%
51%50%
49%
45% 42%47%
4% 4%0%
10%
20%
30%
40%
50%
60%
70%
80%
90%
100%
Tide HE Others None or More than OneSpecified
Detergent Types
% o
f Loa
dsCompletely Satisfied
Very Satisfied
Somewhat Satisfied
Not Very Satisfied
Not At All Satisfied
In All12,377 (93.7%) out of 13,213 records
Tide HE9,853 (79.6%)out of 12,377
Others1,630 (13.2%)out of 12,377
None or More Than One894 (7.2%)out of 12,377
Finally, the data on cleanability was examined to determine effects stemming from familiarity withthe phase II washer. The data records were separated according to time-of-ownership for the h-axiswasher, and cleaning satisfaction levels were compared as shown in Fig. 5.10. Over a 3-month periodstarting from when phase II washers were first installed, participants were at least reasonably satisfiedwith about 95% of the loads done during that period. Most evident is the increase in overallsatisfaction level shown by the significant and consistent increase in the number of loads for whichparticipants were completely satisfied. These results suggest that (1) participants became moreexperienced with the h-axis washer and increasingly were able to obtain excellent performance fromit, and (2) improved cleaning of the same articles of clothing through repeated washings over thistime period became more evident.
5.3. MOISTURE REMOVAL PERFORMANCE
Satisfaction with how dry loads appeared at the conclusion of the wash cycle is affected by most ofthe same factors as satisfaction with cleaning performance as shown in Fig. 5.11. One majordeterminant of the remaining moisture content (RMC) in a load is load weight. Therefore, it wouldbe anticipated that with higher load weights, participants would tend to be less satisfied with the levelof dampness. To test this assertion, the loads done in phase II were segregated according to loadweight as shown in Fig. 5.12, and the level of dampness satisfaction (fraction of loads withsatisfaction levels applied) was determined. Overall, dampness satisfaction followed the expectedtrend, that participants’ were noted to be less satisfied as load weight increased. Fig. 5.13 shows theresults for the same weight categories for phase I, and it appears that there is some improvement inthe level “complete” satisfaction for load weights in the 15-20-pound load weight range.
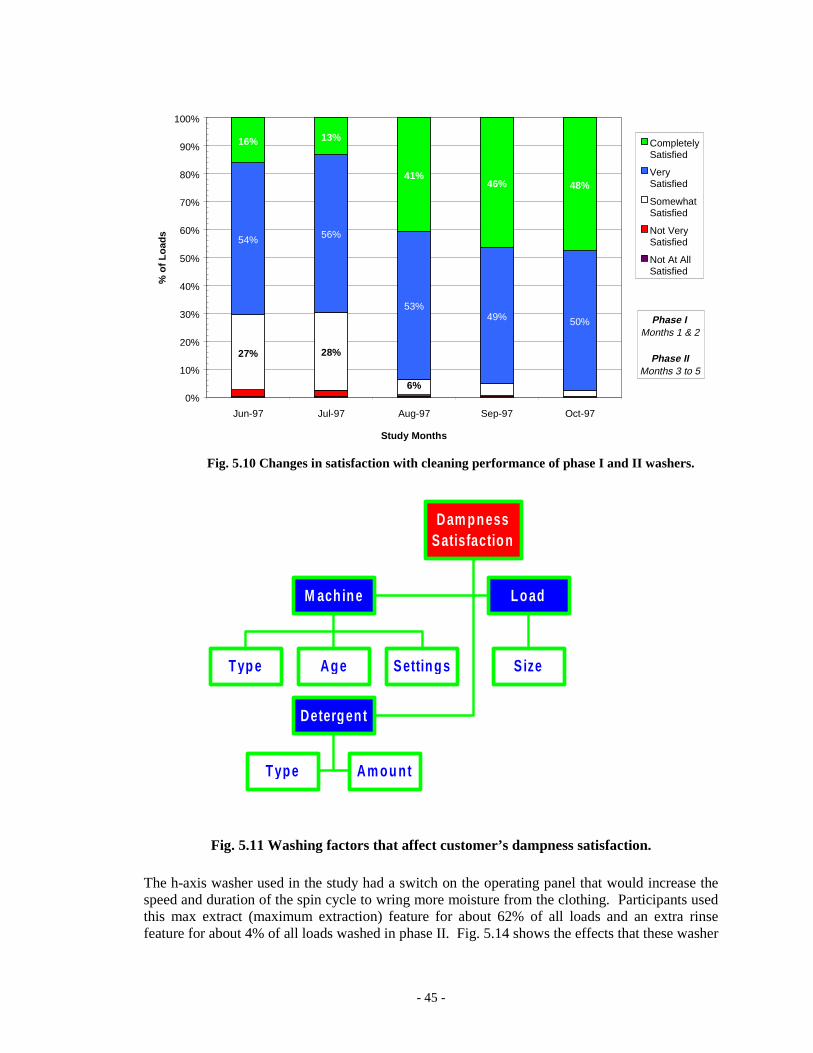
- 45 -
27% 28%
6%
54% 56%
53%49% 50%
16% 13%
41%46% 48%
0%
10%
20%
30%
40%
50%
60%
70%
80%
90%
100%
Jun-97 Jul-97 Aug-97 Sep-97 Oct-97
Study Months
% o
f Loa
ds
CompletelySatisfied
VerySatisfied
SomewhatSatisfied
Not VerySatisfied
Not At AllSatisfied
Phase IMonths 1 & 2
Phase II Months 3 to 5
Fig. 5.10 Changes in satisfaction with cleaning performance of phase I and II washers.
T yp e A g e Settin g s
M ach in e
S ize
L o ad
T yp e Am o u n t
Deter g en t
Dam p n essSatisfactio n
Fig. 5.11 Washing factors that affect customer’s dampness satisfaction.
The h-axis washer used in the study had a switch on the operating panel that would increase thespeed and duration of the spin cycle to wring more moisture from the clothing. Participants usedthis max extract (maximum extraction) feature for about 62% of all loads and an extra rinsefeature for about 4% of all loads washed in phase II. Fig. 5.14 shows the effects that these washer

- 46 -
features had on the dampness satisfaction index. There seems to be little in terms of a trendexcept for the point that participants’ satisfaction levels were lower where the extra rinse alonewas used. Beyond this, there were only minor differences in satisfaction levels.
Fig. 5.12 Dependence of dampness satisfaction with load weight for phase II.
1% 1% 1%5%11%
15%
10%
43%
47%
48%
43%57% 46%
51%41%
32%40%
29%43%
3% 4%
13%
0%
10%
20%
30%
40%
50%
60%
70%
80%
90%
100%
0 to 5 5 to 10 10 to 15 15 to 20 20 to 27 All
Load Weight (lb)
% o
f Loa
ds
CompletelySatisfied
VerySatisfied
SomewhatSatisfied
Not VerySatisfied
Not At AllSatisfied
12,943 (94.1%) out of 13,213 records
Fig. 5.13 Dependence of dampness satisfaction with load weight for phase I.
5% 0%6% 7%7%
7%
34%38% 35%
36%
48%46% 45%
45%
50%
46%
11% 9% 9%15%
0%
9%
4%
50%33%
0%
10%
20%
30%
40%
50%
60%
70%
80%
90%
100%
0 to 5 5 to 10 10 to 15 15 to 20 20 to 27 All
Load Weight (lb)
% o
f Loa
ds
CompletelySatisfied
VerySatisfied
SomewhatSatisfied
Not VerySatisfied
Not At AllSatisfied
7,211 (94.3%) out of 7,645 records

- 47 -
Fig. 5.14 Dependence of dampness satisfaction on max. extract and extra rinse cycles (phase II machines).
10% 10%
46% 43%
67%
39%
53%
43% 45%
27%
48%
33%
9% 11%5%
0%
10%
20%
30%
40%
50%
60%
70%
80%
90%
100%
All
Max
Extr
act O
nly
Extra
Rinse
Only
Max
& E
xtra
Rinse
No M
ax &
No
Extra
Rinse
Settings
% o
f Loa
ds
Completely Satisfied
Very Satisfied
Somewhat Satisfied
Not Very Satisfied
Not At All Satisfied
Out of 13,213 records
All12,439 (94%)
Max Extract8,206 (62%)
Extra Rinse522 (4%)
Max & Extra Rinse1,293 (10%)
No Max or Extra Rinse2,418 (18.3% )
It is much more efficient to dry clothes by spinning them in a spin cycle than by using thermalenergy to evaporate the moisture. Consequently, the effectiveness of the final spin in removingmoisture can be important in saving dryer energy. The measure of how dry a load is after aprocess (e.g. final spin) is the remaining moisture content. RMC (as a fraction) is the weight ofthe moisture retained in a load divided by the dry weight of the same load. Lower RMCs aredesirable from an energy-efficiency standpoint. From the pre-wash and post-wash load weightdata, a “field” RMC value could be obtained, and this was done for phase I, and for phase II withthe max extract feature enabled and without max extract. Fig. 5.15 shows the trends producedfrom this analysis. In phase I, RMC values ranged from about 68% for a 2-pound load to about50% for a 20-lb load. In phase II, lower RMCs were produced by the h-axis washer operatingwithout the max. extract feature on, and still lower RMCs with the max. extract feature on. TheRMC for the class of washers in phase I was particularly sensitive to the dry load weight, andwith higher load weights, both machines were able to leave loads with RMC values of 50% orless. For the 6-7 pound average load weight in phase II, the RMC of the h-axis machine using themax. extract setting was about 48%. It should be noted that these RMC values were measured inthe field and were based on the condition of loads as they were prepared for washing. Laboratorymeasurements of RMC are based on pre-wash conditions where the clothes are bone-dry.
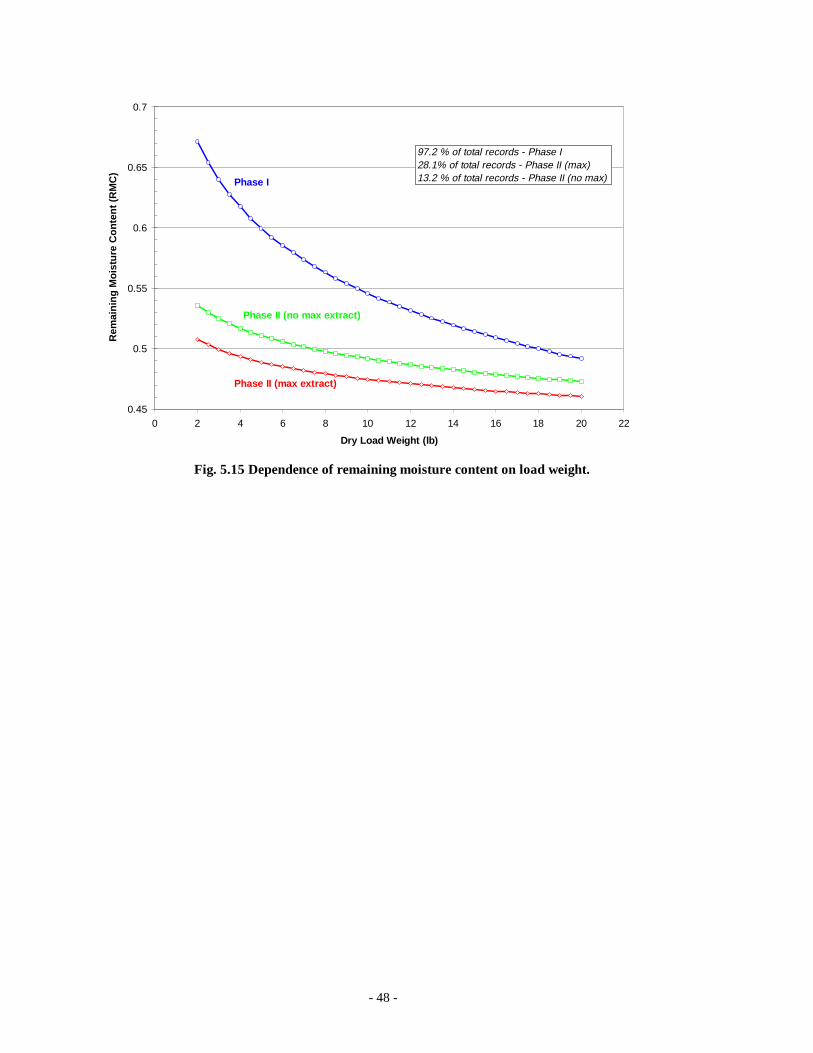
- 48 -
Fig. 5.15 Dependence of remaining moisture content on load weight.
0.45
0.5
0.55
0.6
0.65
0.7
0 2 4 6 8 10 12 14 16 18 20 22
Dry Load Weight (lb)
Rem
aini
ng M
oist
ure
Con
tent
(R
MC
)
Phase I
Phase II (no max extract)
Phase II (max extract)
97.2 % of total records - Phase I28.1% of total records - Phase II (max)13.2 % of total records - Phase II (no max)

- 49 -
6. CONCLUSIONS
The major impetus of this study was quantifying the water and energy savings offered by a largeconcentration in a community of horizontal-axis (h-axis) washers over conventional vertical-axis(v-axis) washers. Close to 35 billion loads of laundry are washed annually nationwide in the U.Sconsuming 2.6% of the total residential end-use energy7. The results of this study indicate that v-axis washers on average use over 40 gallons of water and over 7,700 Btu or 2.25 kWh of end-useenergy per load of wash and that h-axis washers provide close to 38% water and 58% energysavings over these v-axis washers. Based on these averages, close to 1.4 trillion gallons of waterand 270 trillion Btu of energy are used by these v-axis washers annually nationwide and completereplacement of these washers with h-axis washers could save over 500 billion gallons of waterand over 150 trillion Btu of energy annually.
In addition to demonstrating the h-axis washer as an extremely efficient technology, this studyevaluated and quantified many of the potential impacts of a changeover to high-efficiency clotheswashers. These include impacts on customer habits and behavior patterns with respect tolaundering tasks, impacts on the energy and water used by customers, and impacts of washers onthe utilities that supply water. Overall, the study showed that the changeover to the h-axis washerhad little impact on the way in which customers washed and dried clothes. Customer laundrypatterns such as days of the week when laundry is done, detergent use, how loads are dried, anduse of additives did not change in the switchover to the h-axis model. In addition, customersmade minor changes in their washer’s wash/rinse temperature settings between study phases: 9%more loads were washed using a W/C temperature setting and 9% less loads were washed using aH/C temperature setting in phase II than in phase I.
The study showed that, on average, participants’ overall satisfaction with the cleaningperformance of the h-axis washer over their original v-axis washer was much improved. Thefraction of loads in which participants were “completely satisfied” with the cleaning performanceincreased threefold from 15 to 45% in the changeover from the average v-axis washer to the h-axis washer in the study. In cases where v-axis washers that were 1-year old or newer werereplaced by the h-axis washer, the improvement in cleaning performance was notable: the numberof loads in which participants were completely or very satisfied rose from 86% to 97% of allloads washed. There was only a marginal improvement in cleaning satisfaction as a result of theuse of the high-efficiency detergent over the conventional detergent in phase II of the study.With either type detergent, participants appeared to be well pleased.
The results from measurements of the “wetness” of loads removed from the washers wereconsistent in the study. Participants appeared to be much more satisfied with the dryness of loadsremoved from the h-axis washer than from the typical, phase I v-axis washer. Participantsappeared to be completely satisfied with the level of dryness in 9% of the phase I loads and 43%of the phase II, h-axis loads. This subjective measurement was corroborated by calculations ofremaining moisture content which showed that the h-axis washer – particularly if aided by thehigh-speed spin setting – performed a better job of moisture removal for typical loads than theaverage v-axis washer from phase I of the study. With higher load weights, however, theimprovement (reduction) in remaining moisture content between the two washer types becameless noticeable.
7 “Revolution, Not Agitation: A New Spin on Clothes Washing”, Home Energy, Vol. 13, No. 6,November/December 1996, pp. 7-8.
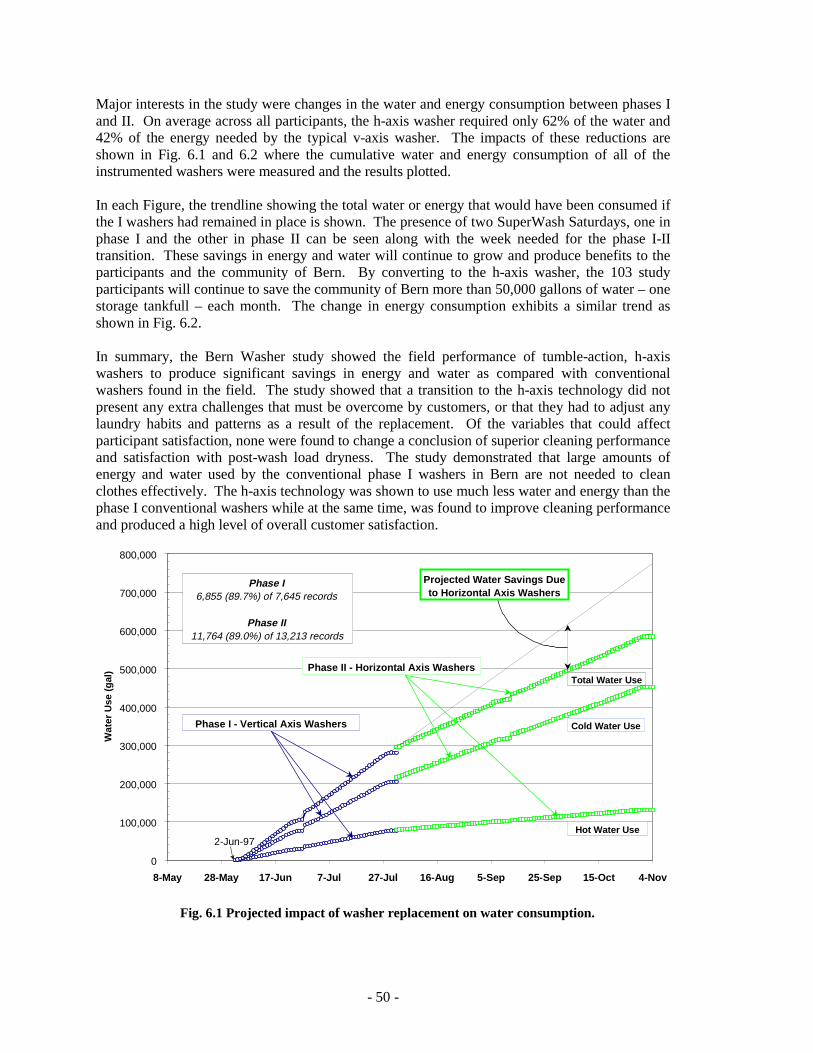
- 50 -
Major interests in the study were changes in the water and energy consumption between phases Iand II. On average across all participants, the h-axis washer required only 62% of the water and42% of the energy needed by the typical v-axis washer. The impacts of these reductions areshown in Fig. 6.1 and 6.2 where the cumulative water and energy consumption of all of theinstrumented washers were measured and the results plotted.
In each Figure, the trendline showing the total water or energy that would have been consumed ifthe I washers had remained in place is shown. The presence of two SuperWash Saturdays, one inphase I and the other in phase II can be seen along with the week needed for the phase I-IItransition. These savings in energy and water will continue to grow and produce benefits to theparticipants and the community of Bern. By converting to the h-axis washer, the 103 studyparticipants will continue to save the community of Bern more than 50,000 gallons of water – onestorage tankfull – each month. The change in energy consumption exhibits a similar trend asshown in Fig. 6.2.
In summary, the Bern Washer study showed the field performance of tumble-action, h-axiswashers to produce significant savings in energy and water as compared with conventionalwashers found in the field. The study showed that a transition to the h-axis technology did notpresent any extra challenges that must be overcome by customers, or that they had to adjust anylaundry habits and patterns as a result of the replacement. Of the variables that could affectparticipant satisfaction, none were found to change a conclusion of superior cleaning performanceand satisfaction with post-wash load dryness. The study demonstrated that large amounts ofenergy and water used by the conventional phase I washers in Bern are not needed to cleanclothes effectively. The h-axis technology was shown to use much less water and energy than thephase I conventional washers while at the same time, was found to improve cleaning performanceand produced a high level of overall customer satisfaction.
Fig. 6.1 Projected impact of washer replacement on water consumption.
0
100,000
200,000
300,000
400,000
500,000
600,000
700,000
800,000
8-May 28-May 17-Jun 7-Jul 27-Jul 16-Aug 5-Sep 25-Sep 15-Oct 4-Nov
Wat
er U
se (
gal)
Projected Water Savings Dueto Horizontal Axis Washers
Phase I - Vertical Axis Washers
Hot Water Use
Cold Water Use
Total Water Use
Phase I6,855 (89.7%) of 7,645 records
Phase II11,764 (89.0%) of 13,213 records
2-Jun-97
Projected Water Savings Dueto Horizontal Axis Washers
Phase II - Horizontal Axis Washers

- 51 -
Fig. 6.2 Projected impact of washer replacement on energy consumption.
0
5,000
10,000
15,000
20,000
25,000
30,000
35,000
40,000
45,000
8-May 28-May 17-Jun 7-Jul 27-Jul 16-Aug 5-Sep 25-Sep 15-Oct 4-Nov
Ene
rgy
Use
(kW
h)
Projected Energy Savings Dueto Horizontal Axis Washers
Phase I - Vertical Axis Washers
Phase II - Horizontal Axis Washers
Phase I6,855 (89.7%) out of 7,645 records
Phase II11,764 (89.0%) out of 13,213 records
2-Jun-97
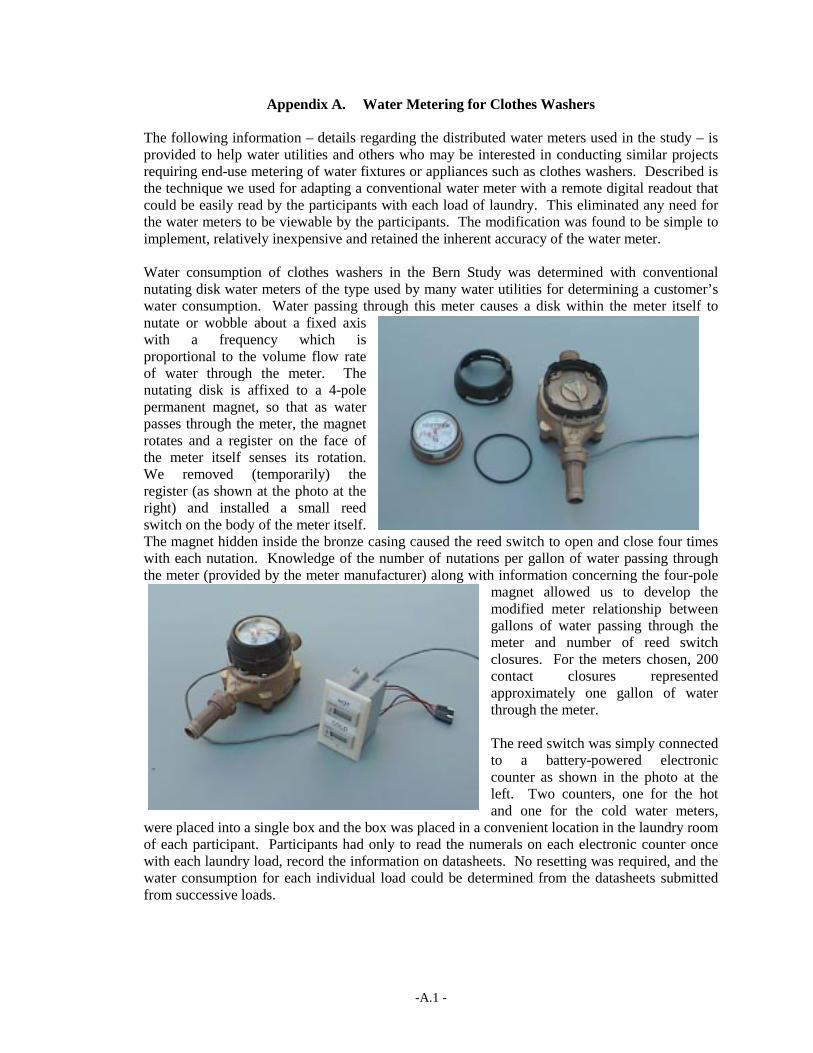
-A.1 -
Appendix A. Water Metering for Clothes Washers
The following information – details regarding the distributed water meters used in the study – isprovided to help water utilities and others who may be interested in conducting similar projectsrequiring end-use metering of water fixtures or appliances such as clothes washers. Described isthe technique we used for adapting a conventional water meter with a remote digital readout thatcould be easily read by the participants with each load of laundry. This eliminated any need forthe water meters to be viewable by the participants. The modification was found to be simple toimplement, relatively inexpensive and retained the inherent accuracy of the water meter.
Water consumption of clothes washers in the Bern Study was determined with conventionalnutating disk water meters of the type used by many water utilities for determining a customer’swater consumption. Water passing through this meter causes a disk within the meter itself tonutate or wobble about a fixed axiswith a frequency which isproportional to the volume flow rateof water through the meter. Thenutating disk is affixed to a 4-polepermanent magnet, so that as waterpasses through the meter, the magnetrotates and a register on the face ofthe meter itself senses its rotation.We removed (temporarily) theregister (as shown at the photo at theright) and installed a small reedswitch on the body of the meter itself.The magnet hidden inside the bronze casing caused the reed switch to open and close four timeswith each nutation. Knowledge of the number of nutations per gallon of water passing throughthe meter (provided by the meter manufacturer) along with information concerning the four-pole
magnet allowed us to develop themodified meter relationship betweengallons of water passing through themeter and number of reed switchclosures. For the meters chosen, 200contact closures representedapproximately one gallon of waterthrough the meter.
The reed switch was simply connectedto a battery-powered electroniccounter as shown in the photo at theleft. Two counters, one for the hotand one for the cold water meters,
were placed into a single box and the box was placed in a convenient location in the laundry roomof each participant. Participants had only to read the numerals on each electronic counter oncewith each laundry load, record the information on datasheets. No resetting was required, and thewater consumption for each individual load could be determined from the datasheets submittedfrom successive loads.

-A.2 -
Appendix B. Examples of Reports to Participants
The following pages are colorized examples of the individualized study reports sent to the 103Bern Study participants during phases I and II of the study and at the end (comparison of phases Iand II). Each report includes six graphics on the first page (first two pages in the case of thecomparison report), which provide percentages on:
(1) load frequency by day of the week,(2) load frequency by hour of the day,(3) initial soil level of the laundry prior to washing,(4) methods used to dry the cleaned laundry,(5) hot water use by machine temperature setting, and(6) cold water used by machine temperature setting.
Only the actual temperature settings used by the participant are shown for (5) and (6). Therefore,not all of the possible five temperature settings (H/C, H/W, W/W, W/C and C/C) are necessarilyshown for each report.
The second page of the separate phase I and II reports and third page of the phase I and IIcomparison report include a summary table on the totals and averages for the loads washed by theparticipant. The totals include:
• number of loads or cycles washed by participant• weight of these loads• amount of water used• amount of energy used (calculated from thermal and machine energy)• amount of moisture that would have to be removed by dryer or other drying method
The averages include:
• weight of laundry or washed clothes per load cycle• water used per load or cycle• washer energy in kilowatt-hours used per cycle• ratio of load weight to water use in pounds per gallon• ratio of load weight to energy use in pounds per kilowatt-hours
Only one report was issued to the study participants for phase I (vertical-axis washers) since mostof the data was collected by the time the report was issued. Pages A.3 to A.4 provide an exampleof the initial report on phase I customer #1, Karen Aeschliman. Both an initial (after the first twoweeks) and an interim report (after the first month) were issued to the study participants for phaseII (horizontal-axis washers). Pages A.5 to A.6 provide an example of the interim report on phaseII for the customer #1. Final individual reports comparing phases I and II for all of the datacollected during both phases was issued along with this Bern washer study final report. Page A.7shows the third page of the final report that was sent out comparing phases I and II. The contentsof the letter that accompanied the final individual report is on pages A.8 to A.10. The letterprovides a description of all the calculated values given in the comparison table of the third pageof the individual report. The first two pages of the final report aren’t shown since their layout isthe same as the first pages of the Phase I and II reports.

Bern Washer Study - Initial Phase 1 ResultsMonday, August 25, 1997
Fig. 2. Your Load Timin g Durin g The Day
0%5%
10%15%20%25%30%35%
Midnigh
t to 6
AM
6 to
9 AM
9 AM to
Noo
n
Noon t
o 3 P
M
3 to
6 PM
6 PM to
Midn
ight
% O
f Loa
ds W
ash
ed
Name: Karen Aeschliman
Customer Number: 1
Fig. 3. How Soiled Your Laundry Looked Before
Washin g
0%10%20%30%40%50%
None
Very Lig
htly
Lightl
y
Mediu
m
Heavily
Very H
eavily
% O
f Loa
ds W
ashe
d
Page 1 of 2
Fig. 4. How You Dried Your Laundry
0%20%40%60%80%
100%120%
In Drye
r
On Clot
hesli
ne
Some
of Eac
h
% O
f Loa
ds D
ried
Fig. 1. Your Daily Load Frequency
0%
5%
10%
15%
20%
Sun Mon Tue
Wed Thu Fri Sat
% O
f Loa
ds W
ashe
d
Fig. 5a. Machine Hot Water Consumption
05
10152025
W/C H/C
W/W H/W
Unkno
wn
Machine Setting
Ave
rage
Wat
er
Use
d P
er C
ycle
(g
allo
ns)
Fig. 5b. Machine Cold Water Consumption
01020304050
W/C H/C
W/W H/W
Unkno
wn
Machine Setting
Ave
rage
Wat
er
Use
d P
er C
ycle
(g
allo
ns)
- A.3 -
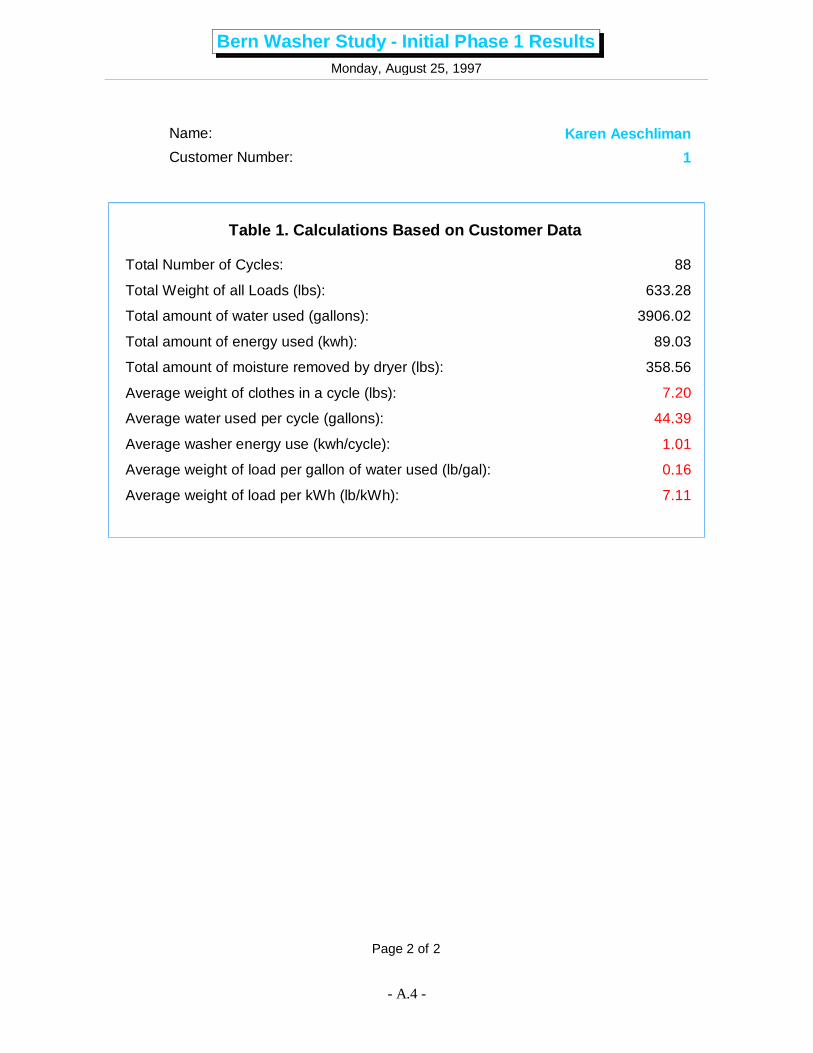
Bern Washer Study - Initial Phase 1 ResultsMonday, August 25, 1997
Total Number of Cycles: 88
Total Weight of all Loads (lbs): 633.28
Total amount of water used (gallons): 3906.02
Total amount of energy used (kwh): 89.03
Total amount of moisture removed by dryer (lbs): 358.56
Average washer energy use (kwh/cycle): 1.01
Average weight of clothes in a cycle (lbs): 7.20
Average water used per cycle (gallons): 44.39
Average weight of load per gallon of water used (lb/gal): 0.16
Average weight of load per kWh (lb/kWh): 7.11
Table 1. Calculations Based on Customer Data
Page 2 of 2
Name: Karen Aeschliman
Customer Number: 1
- A.4 -
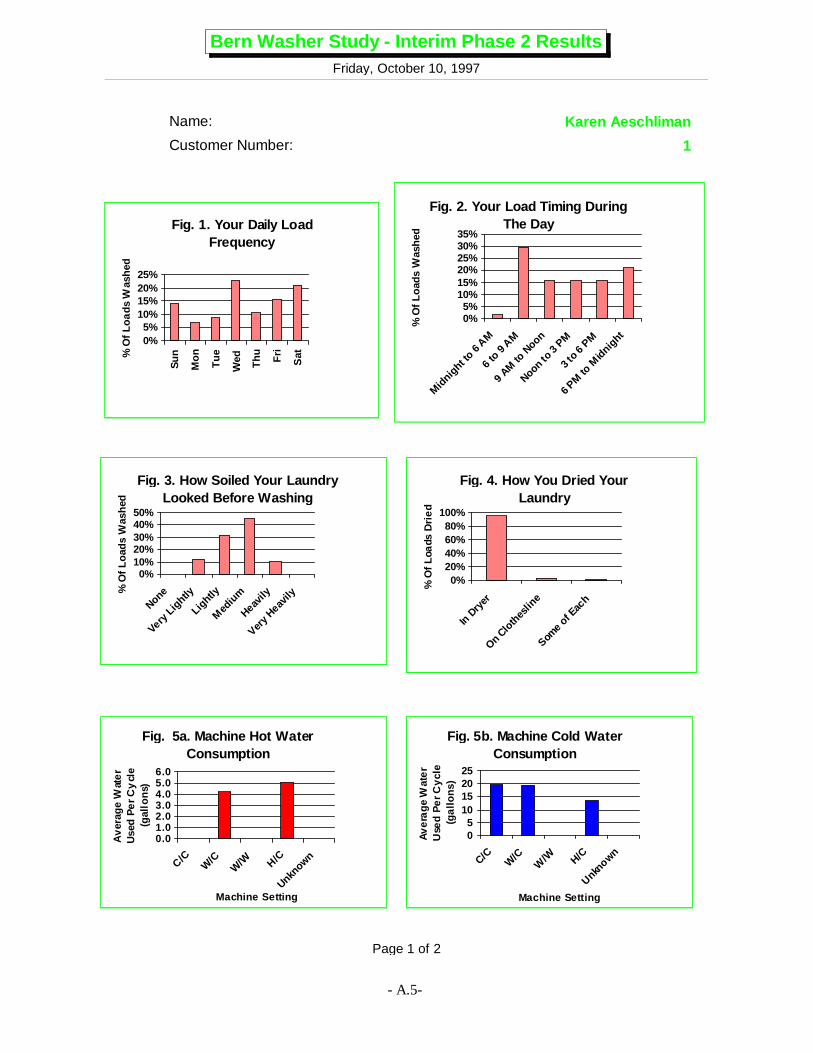
Bern Washer Study - Interim Phase 2 ResultsFriday, October 10, 1997
Fig. 2. Your Load Timin g Durin g The Day
0%5%
10%15%20%25%30%35%
Midn
ight to
6 A
M
6 to
9 AM
9 AM
to N
oon
Noon t
o 3 P
M
3 to 6
PM
6 PM to
Midn
ight
% O
f Loa
ds W
ashe
d
Name: Karen Aeschliman
Customer Number: 1
Page 1 of 2
Fig. 4. How You Dried Your Laundry
0%20%40%60%80%
100%
In Drye
r
On Clot
hesli
ne
Some of
Eac
h
% O
f Loa
ds D
ried
Fig. 3. How Soiled Your Laundry Looked Before Washin g
0%10%20%30%40%50%
None
Very Lig
htly
Lightl
y
Med
ium
Heavily
Very H
eavily
% O
f Loa
ds W
ashe
d
Fig. 5b. Machine Cold Water Consumption
05
10152025
C/CW
/CW
/W H/C
Unkno
wn
Machine Setting
Ave
rage
Wat
er
Use
d P
er C
ycle
(g
allo
ns)
Fig. 5a. Machine Hot Water Consumption
0.01.02.03.04.05.06.0
C/CW
/CW
/W H/C
Unkno
wn
Machine Setting
Ave
rage
Wat
er
Use
d P
er C
ycl
e
(gal
lons
)
Fig. 1. Your Daily Load Frequency
0%5%
10%15%20%25%
Sun
Mon
Tue
Wed Thu Fri
Sat%
Of L
oads
Was
hed
- A.5-
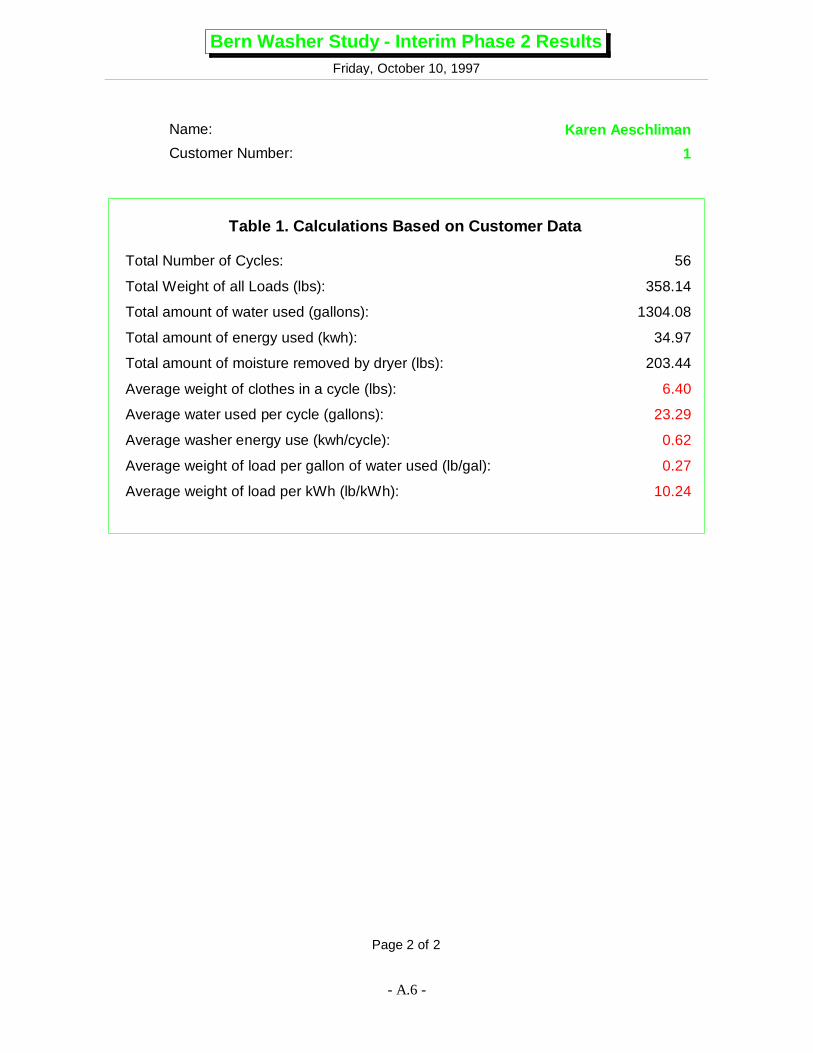
Bern Washer Study - Interim Phase 2 ResultsFriday, October 10, 1997
Total Number of Cycles: 56
Total Weight of all Loads (lbs): 358.14
Total amount of water used (gallons): 1304.08
Total amount of energy used (kwh): 34.97
Total amount of moisture removed by dryer (lbs): 203.44
Average washer energy use (kwh/cycle): 0.62
Average weight of clothes in a cycle (lbs): 6.40
Average water used per cycle (gallons): 23.29
Average weight of load per gallon of water used (lb/gal): 0.27
Average weight of load per kWh (lb/kWh): 10.24
Table 1. Calculations Based on Customer Data
Page 2 of 2
Name: Karen Aeschliman
Customer Number: 1
- A.6 -

Bern Washer Stud y - Comparison of Phase I and II ResultsTuesday, March 17, 1998
Name: Karen Aeschliman
Customer Number: 1
Phase IJune & July 1997
Phase IIAugust, September,
& October 1997
Your Savin gs or
Page 3 of 3
Difference
Study'sAverageSavings
- A.7 -
656.2
3,232.9
3,889.1
Water Use (gallons or gal)
594.2
3,368.7
3,962.9
6.6 4.3 2.3
37.9 21.1 16.7
44.5 25.4 19.1
86.2 51.9 34.3
440.3 259.3 181.1
62.0
135.9
73.8
Total Hot:
Total Cold:
Total Hot & Cold:
6.2
8.7
14.9
38.7
120.0
Average Hot Per Load:
Average Cold Per Load:
Average Load Hot + Cold:
Average Daily Hot + Cold:
Average Weekly Hot + Cold:
100.6
0.7
1.3
Energy Use (kilowatt-hours or kwh )
94.9
1.1
2.1
10.5 6.7 3.8
0.7
0.4
5.8Total Energy:
Average Energy Per Load:
Average Daily Energy Use:
Average Weekly Energy Use:
1.2
3.0
9.9
1,092.1
6.9
Load Wei ghts (pounds or lb )
667.0
7.2
14.5 14.6 0.1
74.1 72.8 1.3
0.3
425.1Total Weight of Loads:
Average Load Weight:
Average Daily Weight:
Average Weekly Weight:
376.8 641.8 265.0Total Remaining Moisture:(wet minus dry weight)
0.6 0.6 0.0Average Moisture Content:(ratio [wet minus dry]/[dry])
0.1
160
Loads and Efficienc y
93
0.2 0.3 0.1
7.0 10.9 3.8
67
0.1
4.4
Total Number of Loads:
Average lb/gal:
Average lb/kwh:

-A.8 -
Contents of Letter to Participants enclosed with Ph I and II Comparison Report
Dear Ms. Aeschiliman,
We have completed the analysis of the data collected by you during the Bern Washer Study.Close to five months worth of data were collected during the study: two months during phase I(old vertical-axis washer) and three-months during phase II (new horizontal-axis washer). AgainJohn Tomlinson and I wish to thank you for your participation in the study and for your diligenteffort at writing data on the datasheets each time you performed a load of wash. Enclosed withthis letter are two documents that provide you with the findings of the study. The first is the finalOak Ridge National Laboratory report that covers the results of all of the data and discusses thewater used and saved, the energy used and saved, customer satisfaction, dampness satisfaction,and many other issues. The second is an individualized report similar to what you have receivedbefore.
Your own individual report shows how much water and energy you saved by switching from yourold washer to the new washer along with other information. The first two pages of the reportprovide information on the use patterns for phases I and II, respectively. They show your usagepatterns for the time of the day and day of the week, how soiled your clothes were beforewashing, how you dried your clothes, and water used with the different temperature settings ofthe washer. You can compare these two pages to see differences between phases I and II. Thethird page provides a comparison of the water and energy use, and efficiency of the old washers(phase I) versus the new washers (phase II). Each page has been colorized to better distinguishphase I (in blue) from phase II (in green) results.
With regard to the third page of the individual report, information for phases I and II is given inthe first and second columns, respectively. Your savings (or average differences) provided by thenew washer is given in the third column and is shown in black (or red). The savings (in black)are based on averages per load, day, week, or average efficiency and represent water or energysavings with the new washer. The differences (in red) do not necessarily represent savings andcan vary from participant to participant based on the number of loads washed. Typically, thesevalues represent differences in totals and cannot be compared to other participants. The averagesavings for all participants are given in the fourth column and are shown in gold. This column isincluded so that you can see how your savings compare with the other study participants. Thereare twenty-one calculations given on this page and, for easy reading, they have been broken downinto four major categories of information: water use, energy use, load weights, and loads &efficiency.
Water Use
Total Hot, Total Cold, and Total Hot + Cold: The values in the first two columns show the totalgallons of water (hot, cold, and hot plus cold) used during each phase of the study. The value inthe third column is the difference between these two totals, which may or may not representsavings. These two values should only be compared if they are divided by the number of washloads (shown near the end of the first two columns) performed during each phase of the study.See below.
Average Hot and Average Cold Per Load, and Average Load Hot + Cold: The values in the firsttwo columns show the average gallons of water (hot, cold, or hot plus cold) used for each load ofwash for the two phases. They were calculated by dividing the total water used (given above) bythe total number of wash loads (given later). These values are good indicators of how much hot,
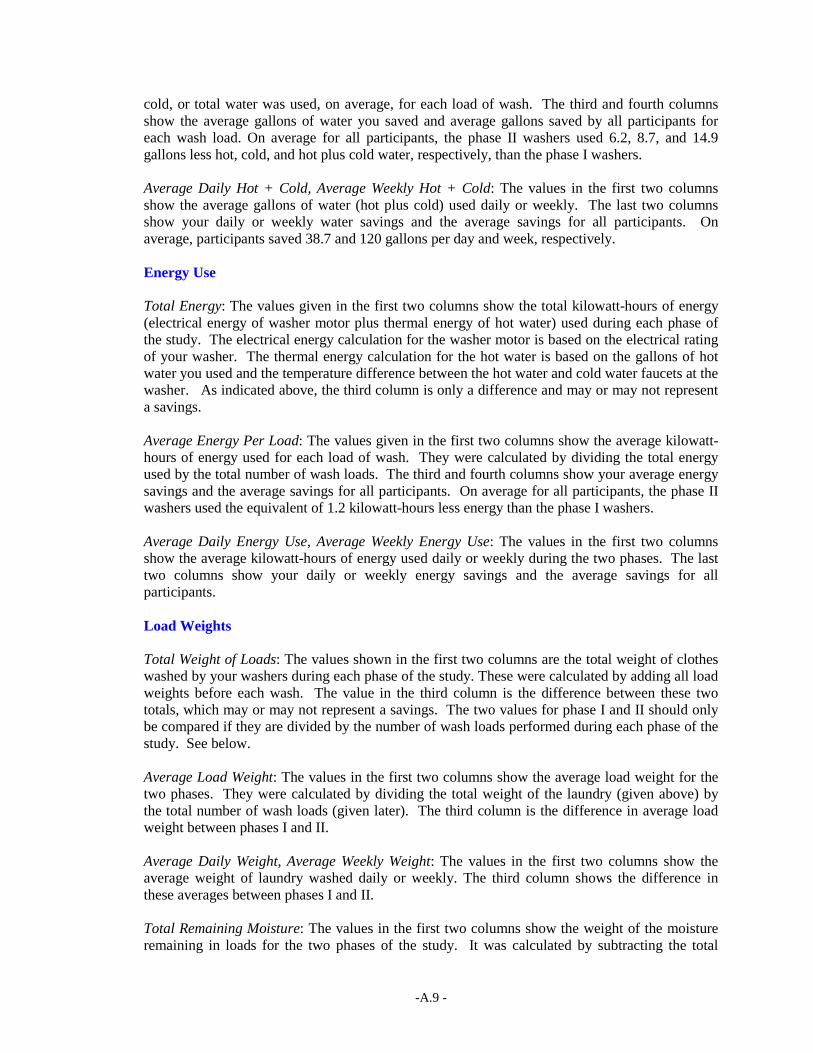
-A.9 -
cold, or total water was used, on average, for each load of wash. The third and fourth columnsshow the average gallons of water you saved and average gallons saved by all participants foreach wash load. On average for all participants, the phase II washers used 6.2, 8.7, and 14.9gallons less hot, cold, and hot plus cold water, respectively, than the phase I washers.
Average Daily Hot + Cold, Average Weekly Hot + Cold: The values in the first two columnsshow the average gallons of water (hot plus cold) used daily or weekly. The last two columnsshow your daily or weekly water savings and the average savings for all participants. Onaverage, participants saved 38.7 and 120 gallons per day and week, respectively.
Energy Use
Total Energy: The values given in the first two columns show the total kilowatt-hours of energy(electrical energy of washer motor plus thermal energy of hot water) used during each phase ofthe study. The electrical energy calculation for the washer motor is based on the electrical ratingof your washer. The thermal energy calculation for the hot water is based on the gallons of hotwater you used and the temperature difference between the hot water and cold water faucets at thewasher. As indicated above, the third column is only a difference and may or may not representa savings.
Average Energy Per Load: The values given in the first two columns show the average kilowatt-hours of energy used for each load of wash. They were calculated by dividing the total energyused by the total number of wash loads. The third and fourth columns show your average energysavings and the average savings for all participants. On average for all participants, the phase IIwashers used the equivalent of 1.2 kilowatt-hours less energy than the phase I washers.
Average Daily Energy Use, Average Weekly Energy Use: The values in the first two columnsshow the average kilowatt-hours of energy used daily or weekly during the two phases. The lasttwo columns show your daily or weekly energy savings and the average savings for allparticipants.
Load Weights
Total Weight of Loads: The values shown in the first two columns are the total weight of clotheswashed by your washers during each phase of the study. These were calculated by adding all loadweights before each wash. The value in the third column is the difference between these twototals, which may or may not represent a savings. The two values for phase I and II should onlybe compared if they are divided by the number of wash loads performed during each phase of thestudy. See below.
Average Load Weight: The values in the first two columns show the average load weight for thetwo phases. They were calculated by dividing the total weight of the laundry (given above) bythe total number of wash loads (given later). The third column is the difference in average loadweight between phases I and II.
Average Daily Weight, Average Weekly Weight: The values in the first two columns show theaverage weight of laundry washed daily or weekly. The third column shows the difference inthese averages between phases I and II.
Total Remaining Moisture: The values in the first two columns show the weight of the moistureremaining in loads for the two phases of the study. It was calculated by subtracting the total
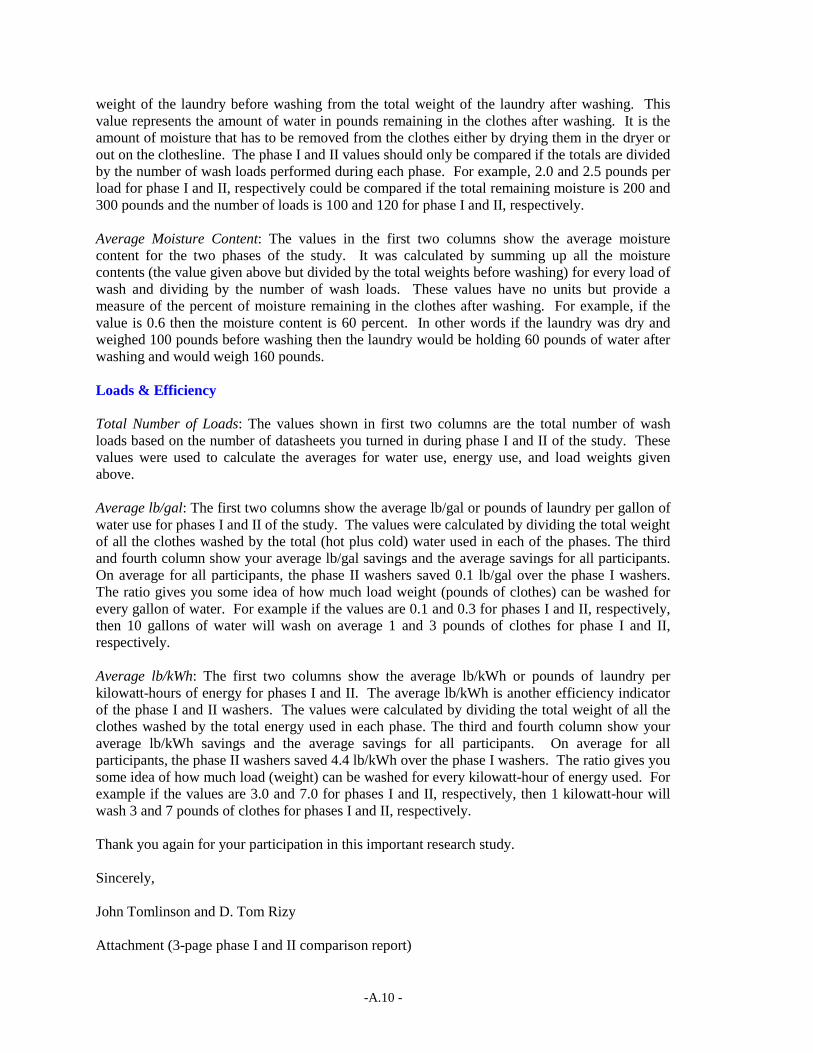
-A.10 -
weight of the laundry before washing from the total weight of the laundry after washing. Thisvalue represents the amount of water in pounds remaining in the clothes after washing. It is theamount of moisture that has to be removed from the clothes either by drying them in the dryer orout on the clothesline. The phase I and II values should only be compared if the totals are dividedby the number of wash loads performed during each phase. For example, 2.0 and 2.5 pounds perload for phase I and II, respectively could be compared if the total remaining moisture is 200 and300 pounds and the number of loads is 100 and 120 for phase I and II, respectively.
Average Moisture Content: The values in the first two columns show the average moisturecontent for the two phases of the study. It was calculated by summing up all the moisturecontents (the value given above but divided by the total weights before washing) for every load ofwash and dividing by the number of wash loads. These values have no units but provide ameasure of the percent of moisture remaining in the clothes after washing. For example, if thevalue is 0.6 then the moisture content is 60 percent. In other words if the laundry was dry andweighed 100 pounds before washing then the laundry would be holding 60 pounds of water afterwashing and would weigh 160 pounds.
Loads & Efficiency
Total Number of Loads: The values shown in first two columns are the total number of washloads based on the number of datasheets you turned in during phase I and II of the study. Thesevalues were used to calculate the averages for water use, energy use, and load weights givenabove.
Average lb/gal: The first two columns show the average lb/gal or pounds of laundry per gallon ofwater use for phases I and II of the study. The values were calculated by dividing the total weightof all the clothes washed by the total (hot plus cold) water used in each of the phases. The thirdand fourth column show your average lb/gal savings and the average savings for all participants.On average for all participants, the phase II washers saved 0.1 lb/gal over the phase I washers.The ratio gives you some idea of how much load weight (pounds of clothes) can be washed forevery gallon of water. For example if the values are 0.1 and 0.3 for phases I and II, respectively,then 10 gallons of water will wash on average 1 and 3 pounds of clothes for phase I and II,respectively.
Average lb/kWh: The first two columns show the average lb/kWh or pounds of laundry perkilowatt-hours of energy for phases I and II. The average lb/kWh is another efficiency indicatorof the phase I and II washers. The values were calculated by dividing the total weight of all theclothes washed by the total energy used in each phase. The third and fourth column show youraverage lb/kWh savings and the average savings for all participants. On average for allparticipants, the phase II washers saved 4.4 lb/kWh over the phase I washers. The ratio gives yousome idea of how much load (weight) can be washed for every kilowatt-hour of energy used. Forexample if the values are 3.0 and 7.0 for phases I and II, respectively, then 1 kilowatt-hour willwash 3 and 7 pounds of clothes for phases I and II, respectively.
Thank you again for your participation in this important research study.
Sincerely,
John Tomlinson and D. Tom Rizy
Attachment (3-page phase I and II comparison report)

-A.11 -
Appendix C. Data Integrity and Quality
Overall the completeness of the data was very good with any one field of information being 88%complete or better (see Table C.1) with the exception of the “did you” field which was anoptional field. The quality of the data (see Tables C.2 and C.3) was also very good as well withan extremely small percentage of the data consisting of outliers (out of range values). Theseoutliers are due to out of place (in terms of date and time) records, incomplete data, or incorrectlyentered information or a combination of the three. The completeness and quality of the data isdiscussed more in detail below.
Completeness of Recorded Data
Part of the quality of the data is the completeness of the data records. The completeness of eachdata sheet or record refers to the number of nonblank entries in each data field or cell ascompared to the total number of data records that was turned in. The completeness of the data setwas examined by counting the number of nonblank entries for each of the possible data fields andcomparing it to the total number records turned in. A total of 20,858 data sheets or records wereturned in by the study participants over the five-month long data collection period of the study(two-months during phase I and three-months during phase II). Each data sheet consists of 22 to32 individual fields or cells of data. For phase I, the maximum was 22 for a wash load withoutthe analog readings from the faces of the water meters and 26 with the readings. For phase II, themaximum was 28 for a wash load without the analog readings and 32 with the readings. Thecells of data consist of:
a) sequence number or the order in which each data sheet was scanned andentered into the database (1 field),
b) lithocode or unique id number associated with each individual data sheet (1field),
c) date (1 field),d) time (1 field),e) pre-wash load weight (2 fields),f) soiled level of pre-wash laundry (1 field),g) “did you” or pre-wash preparations such as pretreat stains, use of bleach,
presoak, use of fabric softener (1 field in phase I, 6 fields in phase II),h) detergent amount (1 field),i) detergent brand (1 field),j) detergent type (1 field),k) machine temperature, load, and cycle settings (4 fields for phase I, 5 for
phase II),l) digital hot and cold water readings (2 fields),m) post-wash load weight (2 fields),n) dampness satisfaction index indicated by participant (1 field),o) cleanliness satisfaction index indicated by participant (1 field),p) method used to dry cleaned laundry (1 field),q) analog meter reading (4 readings)
Table C.1 shows the total number of records turned in by the study participants for each phase ofthe study. Also, the number of nonblank or filled-in values for each cell as well as percent of thetotal records that this represents is shown in this table. For example, 7585 or 99.2 % out of a totalof 7645 records were filled in for the “date” field.
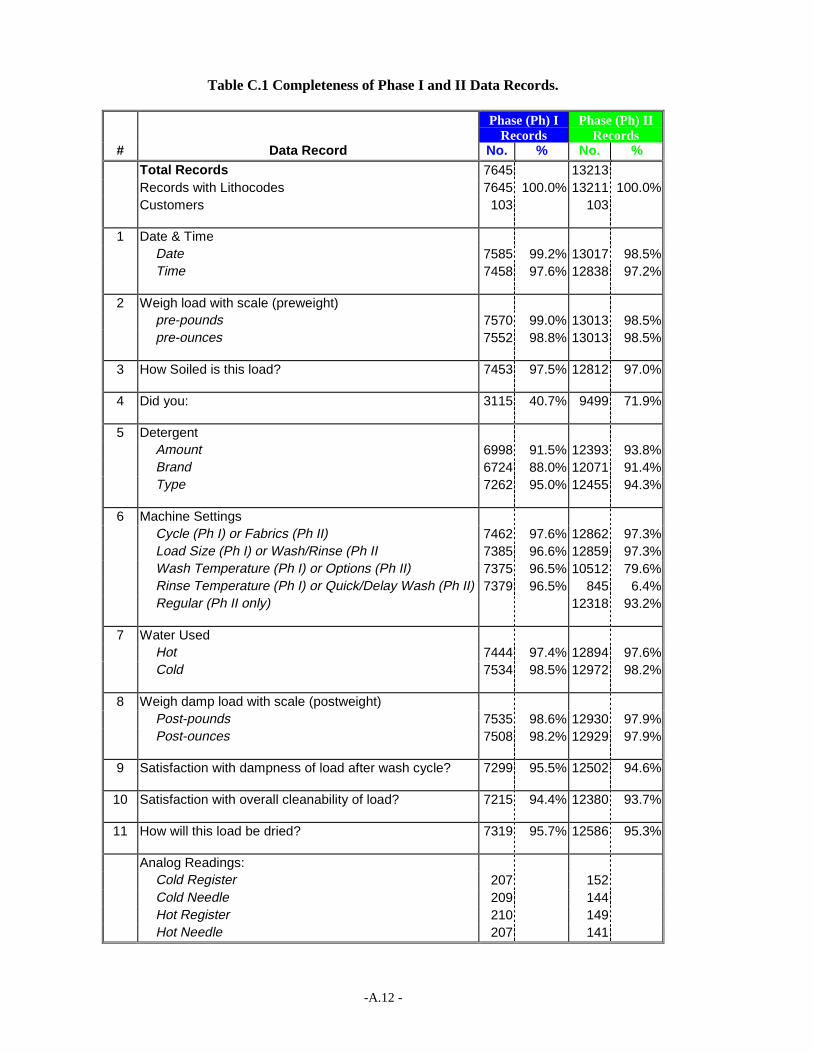
-A.12 -
Table C.1 Completeness of Phase I and II Data Records.
Phase (Ph) IRecords
Phase (Ph) IIRecords
# Data Record No. % No. %Total Records 7645 13213Records with Lithocodes 7645 100.0% 13211 100.0%Customers 103 103
1 Date & TimeDate 7585 99.2% 13017 98.5%Time 7458 97.6% 12838 97.2%
2 Weigh load with scale (preweight)pre-pounds 7570 99.0% 13013 98.5%pre-ounces 7552 98.8% 13013 98.5%
3 How Soiled is this load? 7453 97.5% 12812 97.0%
4 Did you: 3115 40.7% 9499 71.9%
5 DetergentAmount 6998 91.5% 12393 93.8%Brand 6724 88.0% 12071 91.4%Type 7262 95.0% 12455 94.3%
6 Machine SettingsCycle (Ph I) or Fabrics (Ph II) 7462 97.6% 12862 97.3%Load Size (Ph I) or Wash/Rinse (Ph II 7385 96.6% 12859 97.3%Wash Temperature (Ph I) or Options (Ph II) 7375 96.5% 10512 79.6%Rinse Temperature (Ph I) or Quick/Delay Wash (Ph II) 7379 96.5% 845 6.4%Regular (Ph II only) 12318 93.2%
7 Water UsedHot 7444 97.4% 12894 97.6%Cold 7534 98.5% 12972 98.2%
8 Weigh damp load with scale (postweight)Post-pounds 7535 98.6% 12930 97.9%Post-ounces 7508 98.2% 12929 97.9%
9 Satisfaction with dampness of load after wash cycle? 7299 95.5% 12502 94.6%
10 Satisfaction with overall cleanability of load? 7215 94.4% 12380 93.7%
11 How will this load be dried? 7319 95.7% 12586 95.3%
Analog Readings:Cold Register 207 152Cold Needle 209 144Hot Register 210 149Hot Needle 207 141
-A.13 -
Overall the completeness of the data is very good at 88% or better with the exception of the “didyou” field. The completeness of the “did you” field for phase I is lower than for phase II becausethe possibility of multiple selections was not accounted for in the data entry process for phase I.For the phase II data entry process, the field was broken down into 6 cells so that these multipleselections could be captured.
All but a few of the data records of phase I and II represent a load of wash. A small percent ofthem represent only the analog water readings at the beginning and end of each phase. In somecases the readings were recorded on a datasheet together with wash load data. In other cases thereadings were recorded separately from a load of wash.
Integrity of Data
A second area of data quality is the reasonableness or integrity of the recorded readings and thevarious calculations from the recorded readings (such as water use and load weight) in each datarecord. A small number of the recorded readings were incorrectly entered either by theparticipant on the datasheet or by State Testing and Evaluation in the creation of the digital file.Many of these misentered readings showed up as values that were too small or too large. Thevalues showed up as null (blank) values if no entry was entered for any reading. The calculationsmost sensitive to incorrect entries or lack of them are the water use calculations. First, thecalculations depended on having both a pre- and post-reading in order to calculate the water usefor the load of wash. By design, the raw data records contained only one reading whichrepresented the digital reading after the laundry (post reading) had been washed. It was firstnecessary to match up post and pre-water digital readings in order to calculate water use. It wastherefore necessary to create a table of pre-wash readings for each record. The pre-readings weredetermined by looking back at the record that occurred just prior to the current record. Thisrequired sorting of the records by both customer #, date, and by time. Thus water use, either hotor cold, was calculated by subtracting the pre-reading of this table from the post-reading of thedata records for the same record. An incorrect entry for either of these values needed for sortingresulted in an outlier, a calculated value outside of the normal range of values. The weightcalculations required either a recorded pound (lb) or an ounce (oz) reading in order to calculatethe pre- or post-weight of the laundry. The weight calculations did not require customer #, date,and time in order to determine totals and averages. These values were only needed to sort orgroup the data by customer, date, and/or time.
Table C.2 and C.3 describe the quality of the data as it relates to both the water use and loadweight calculations. The tables show the percent of the data records that provide reasonablecalculations.
Over 85% of the data records in phase I and II were found to be of extremely good quality forwater use calculations, since they fell within the 0 to 60 gallon range. Over 95% of the datarecords in phase I and II were found to be of extremely good quality for load weight calculations,since they fell with the 0 to 20 pounds range. Reasonableness of the calculations was determinedby grouping the calculations into four groups. For the water use calculations, these are (1) lessthan 0 gallons, (2) 0 to 60 gallons, (3) greater than 60 gallons, and (4) not enough data to performthe calculation. For the load weight calculations, these are (1) less than 0 pounds, (2) 0 to 20pounds, (3) greater than 20 pounds, and (4) not enough data to perform the calculation. Forexample, 85.9% and 91.3% of the phase I and II data records, respectively, provide watercalculations that fall within the range of 0 to 60 gallons. Limits were used in the MicrosoftAccess queries to eliminate gross outliers. The limit of 0 to 100 gallons was used for the cold andhot water use calculations, instead of 0 to 60 gallons, which was considered to be too narrow in

-A.14 -
range. The limit of not less than 0 pounds was used for the load weight calculations. Theaverage value calculated for the water use and load weight both without these limits and with thepreviously stated limits is shown on the right side of each table.
Table C.2 Quality (percent of total records) of Phase I and II Hot and Cold WaterCalculations.
% in Water Use (gal) Range Average Water Use
Less than 0 0 to 60GreaterThan 60
Not Enough DataFor Calculation
Limits(0 to 60)
Limits*(0 to 100)
Phase IHot 9.3% 85.9% 2.1% 2.6% 11.23 11.57Cold 3.9% 88.9% 5.8% 1.5% 28.48 29.89Hot + Cold 39.71 41.46
Phase IIHot 5.6% 91.3% 1.5% 1.6% 4.77 4.83Cold 3.6% 92.2% 3.3% 1.0% 20.38 20.96Hot + Cold 25.15 25.79
*Limits used to calculate the total and average water use in the study. They were used to eliminateany unreasonable calculations due to incorrectly entered water readings (by participant or key punchoperator) or sorting problems with readings due to incorrectly entered date or time.
Table C.3 Quality (in percent of total records) of Phase I and II Pre-Wash and Post-Wash Weight Calculations.
% in Weight (lb) Range Average Load Weights
Less than 0 0 to 20
Greater Than20 and LessThan 40
Not Enough DataFor Calculation No Limits
Limits(greaterthan 0)*
Phase IPreWash 0.6% 98.4% 0.03% 1.0% 6.60 6.65PostWash 0.3% 96.0% 2.3% 1.4% 10.32 10.36
Phase IIPreWash 0.2% 99.5% 0.1% 0.3% 6.97 6.98PostWash 0.1% 95.8% 3.4% 0.9% 10.39 10.40
*Limits used to calculate the total and average load weights in the study. They were used toeliminate any unreasonable calculations due to incorrectly entered load weight data (by participantor keypunch operator).
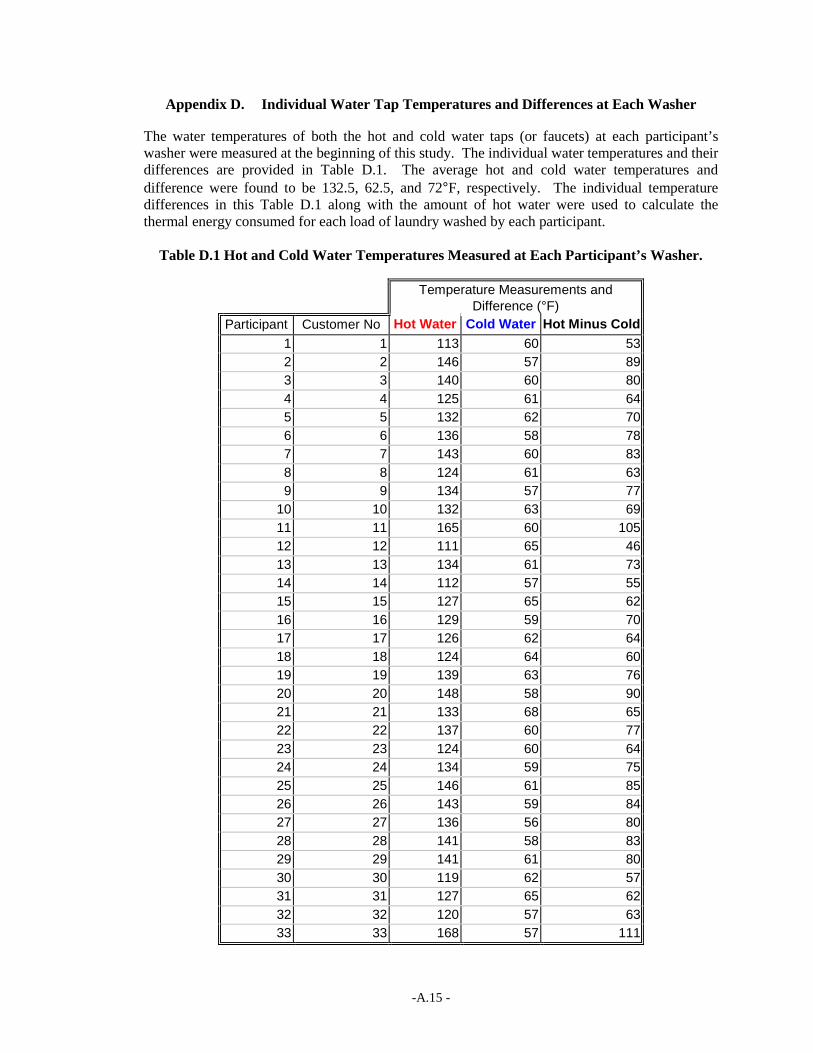
-A.15 -
Appendix D. Individual Water Tap Temperatures and Differences at Each Washer
The water temperatures of both the hot and cold water taps (or faucets) at each participant’swasher were measured at the beginning of this study. The individual water temperatures and theirdifferences are provided in Table D.1. The average hot and cold water temperatures anddifference were found to be 132.5, 62.5, and 72°F, respectively. The individual temperaturedifferences in this Table D.1 along with the amount of hot water were used to calculate thethermal energy consumed for each load of laundry washed by each participant.
Table D.1 Hot and Cold Water Temperatures Measured at Each Participant’s Washer.
Temperature Measurements andDifference (°F)
Participant Customer No Hot Water Cold Water Hot Minus Cold1 1 113 60 532 2 146 57 893 3 140 60 804 4 125 61 645 5 132 62 706 6 136 58 787 7 143 60 838 8 124 61 639 9 134 57 77
10 10 132 63 6911 11 165 60 10512 12 111 65 4613 13 134 61 7314 14 112 57 5515 15 127 65 6216 16 129 59 7017 17 126 62 6418 18 124 64 6019 19 139 63 7620 20 148 58 9021 21 133 68 6522 22 137 60 7723 23 124 60 6424 24 134 59 7525 25 146 61 8526 26 143 59 8427 27 136 56 8028 28 141 58 8329 29 141 61 8030 30 119 62 5731 31 127 65 6232 32 120 57 6333 33 168 57 111

-A.16 -
Table D.1 Hot and Cold Water Temperatures Measured at Each Participant’s Washer (cont.).
Temperature Measurements andDifference (°F)
Participant Customer No Hot Water Cold Water Hot Minus Cold34 34 126 60 6635 35 137 60 7736 36 110 57 5337 37 122 58 6438 38 149 57 9239 39 150 63 8740 40 120 61 5941 41 120 63 5742 42 131 63 6843 43 136 66 7044 44 117 66 5145 45 123 61 6246 46 130 60 7047 47 129 62 6748 48 122 61 6149 49 135 59 7650 50 134 58 7651 51 159 56 10352 53 125 61 6453 54 139 63 7654 55 121 58 6355 56 134 63 7156 57 134 60 7457 58 121 60 6158 59 143 57 8659 60 123 66 5760 61 146 59 8761 62 134 58 7662 63 152 60 9263 64 128 64 6464 65 114 61 5365 66 138 64 7466 67 141 65 7667 68 143 59 8468 69 138 57 8169 70 135 62 7370 71 128 55 7371 72 134 60 7472 73 148 60 8873 74 115 58 57
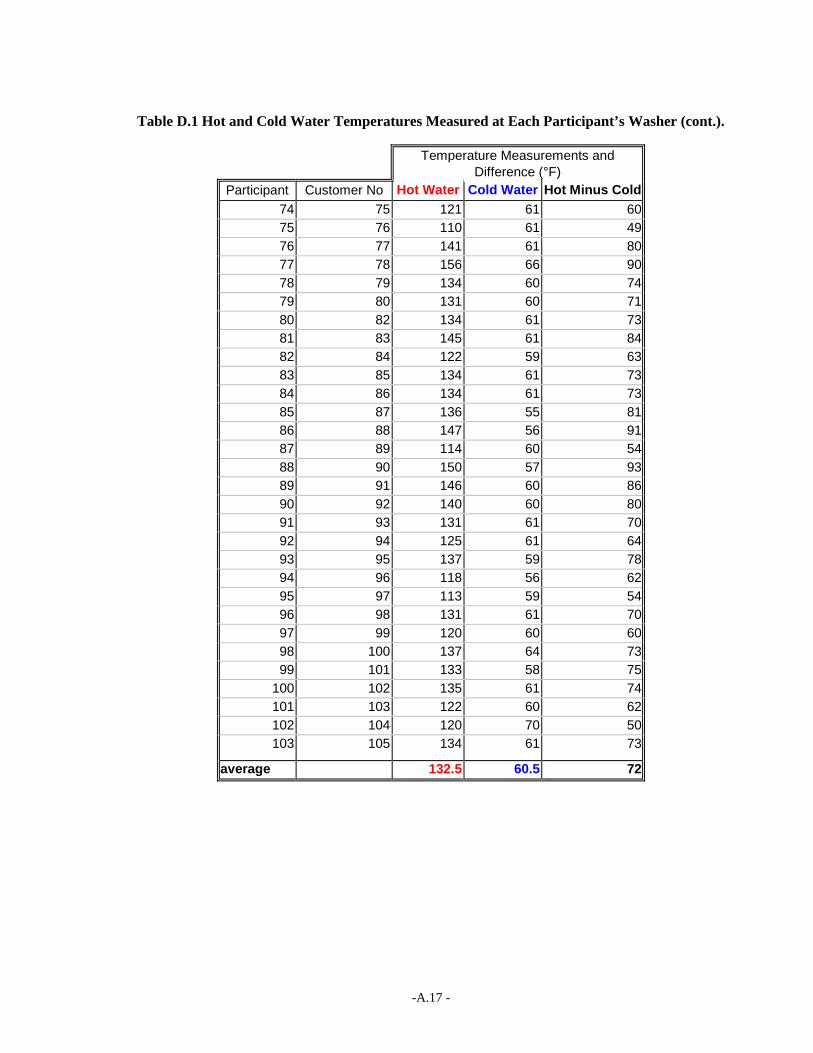
-A.17 -
Table D.1 Hot and Cold Water Temperatures Measured at Each Participant’s Washer (cont.).
Temperature Measurements andDifference (°F)
Participant Customer No Hot Water Cold Water Hot Minus Cold74 75 121 61 6075 76 110 61 4976 77 141 61 8077 78 156 66 9078 79 134 60 7479 80 131 60 7180 82 134 61 7381 83 145 61 8482 84 122 59 6383 85 134 61 7384 86 134 61 7385 87 136 55 8186 88 147 56 9187 89 114 60 5488 90 150 57 9389 91 146 60 8690 92 140 60 8091 93 131 61 7092 94 125 61 6493 95 137 59 7894 96 118 56 6295 97 113 59 5496 98 131 61 7097 99 120 60 6098 100 137 64 7399 101 133 58 75
100 102 135 61 74101 103 122 60 62102 104 120 70 50103 105 134 61 73
average 132.5 60.5 72