benthic recovery report - nan.usace.army.mil and physical... · 02.03.2017 · contract areas:...
TRANSCRIPT
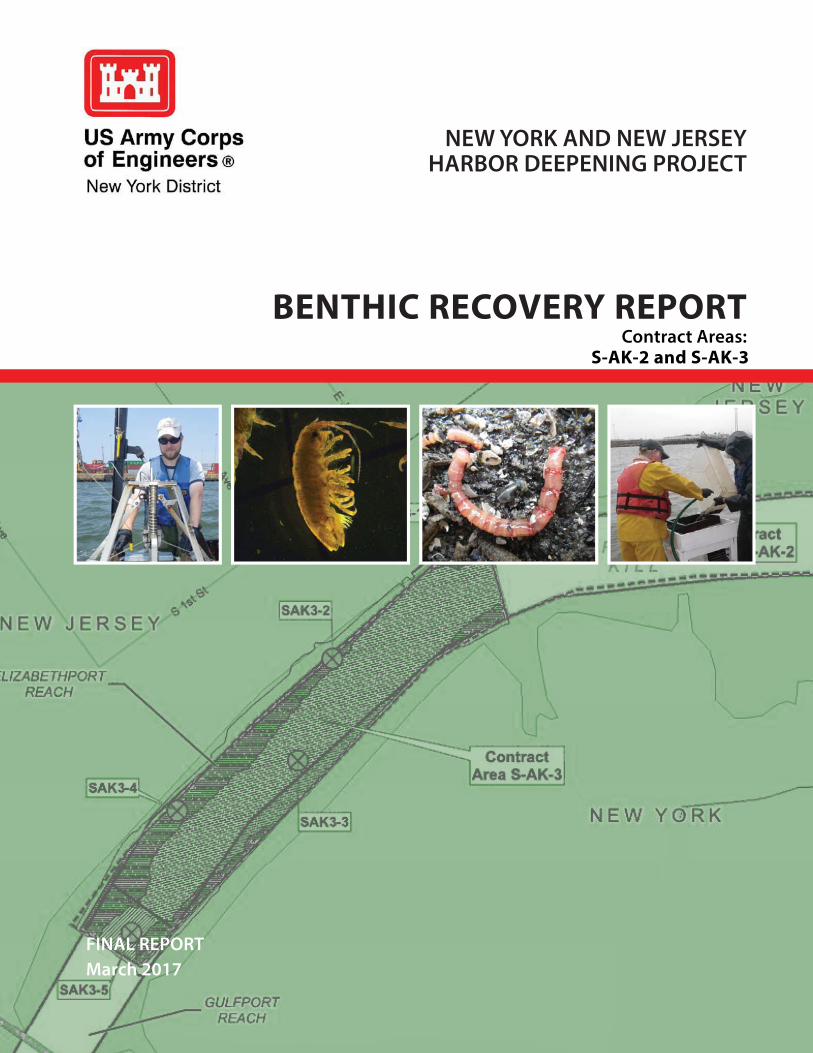
NEW YORK AND NEW JERSEYHARBOR DEEPENING PROJECT
FINAL REPORTMarch 2017
BENTHIC RECOVERY REPORTS-AK-2 and S-AK-3
Contract Areas:
Benthic Recovery Monitoring Report
Contract Areas: S-AK-2 and S-AK-3
Prepared for the:
United States Army Corps of Engineers - New York District
FINAL Report
March 2017
Contract Areas: S-AK-2 and S-AK-3
Benthic Recovery Report i NY & NJ Harbor Deepening Project
Table of Contents
Introduction ....................................................................................................................................... 1
Background ................................................................................................................................... 2
Previous Benthic Invertebrate Sampling ...................................................................................... 3
Methods............................................................................................................................................. 4
Sample Collection ......................................................................................................................... 4
Data Analysis ................................................................................................................................ 5
Results ............................................................................................................................................... 8
Previous Arthur Kill Channel Surveys ......................................................................................... 8
2016 Arthur Kill Channel (S-AK-2) Survey ................................................................................. 9
2016 Arthur Kill Channel (S-AK-3) Survey ............................................................................... 10
Discussion ....................................................................................................................................... 11
Arthur Kill Channel (S-AK-2) Summary ................................................................................... 13
Arthur Kill Channel (S-AK-3) Summary ................................................................................... 14
Literature Cited ............................................................................................................................... 16
Tables & Figures ............................................................................................................................. 20
Contract Areas: S-AK-2 and S-AK-3
Benthic Recovery Report ii NY & NJ Harbor Deepening Project
List of Tables
Table 1. Dredging events within Contract Areas sampled in 2016. ............................................... 21
Table 2. Pre and post-deepening sampling stations representative of Contract Areas. ................. 21
Table 3. Benthic invertebrates collected in July 2005 within the S-AK-2 Contract Area of the
Arthur Kill Navigation Channel...................................................................................................... 22
Table 4. Benthic macroinvertebrate density (organisms/m2) by station in the Arthur Kill Channel
in Contract Areas S-AK-2 and S-AK-3 During May 2016. ............................................................ 23
Table 5. Taxa richness and density by station and average density by Contract Area
(organisms/m2) from samples collected in Arthur Kill Channel in Contract Areas S-AK-2 and S-
AK-3 during 2005 and May 2016. .................................................................................................. 24
Table 6. Benthic community taxa richness, density (organisms/m2), Diversity (H'), Evenness (J'),
and relative pollution sensitivity from samples collected in NY/NJ Harbor Navigation Channels
from the Arthur Kill Channel in Contract Areas S-AK-2 and S-AK-3 during 2005 and May 2016.
......................................................................................................................................................... 25
Table 7. Sediment type observed during collection of samples from NY/NJ Harbor Navigation
Channel, 2016. ................................................................................................................................ 26
List of Figures Figure 1. HDP Contract Area S-AK-2 Benthic Recovery Sampling Locations. ........................... 27
Figure 2. HDP Contract Area S-AK-3 2016 Benthic Recovery Sampling Locations. .................. 28
Figure 3. Benthic Macroinvertebrate Density (± 1 SE) by Contract Area and Sampling Year. .... 29
Figure 4. Benthic Macroinvertebrate Diversity by Contract Area and Sampling year. ................. 30
Figure 5. Benthic Macroinvertebrate Evenness by Contract Area and Sampling Year. ................ 31
Figure 6. Percent Pollution Tolerant Species by Contract Area and Sampling Year. ................... 32
Figure 7. Percent Pollution Sensitive Species by Contract Area and Sampling Year. .................. 33
Contract Areas: S-AK-2 and S-AK-3
Benthic Recovery Report 1 NY & NJ Harbor Deepening Project
INTRODUCTION
The U.S. Army Corps of Engineers, New York District (USACE-NYD) in partnership with the
Port Authority of New York and New Jersey (PANYNJ) (“Port”) is responsible for providing,
commerce, and maintaining navigable waterways while maintaining the natural resources of the
NY/NJ Harbor. The Port is a critical economic component of the New York City Metropolitan
region, providing more than 230,000 direct and indirect jobs and $20 billion in economic
activities to the States of New York and New Jersey (USACE 2010). However, the Port is
located within a naturally shallow estuary, with an average depth of less than 20 feet (USACE
2008). Since the late 19th century, periodic maintenance dredging and improvement of navigation
channels has been necessary for the continued use and economic vitality of the Port.
Today, there are more than 200 miles of federally maintained navigation channels within the
NY/NJ Harbor. To meet current and anticipated shipping needs, including increased
containerization using larger Post-Panamax shipping vessels, these existing navigation channels
have recently been deepened as part of the Harbor Deepening Project (HDP), a multi-year
Federal navigation program, aimed at improving navigation in the Harbor while minimizing
impacts to the aquatic environment and incorporating beneficial aspects that seek to improve the
environment. Ongoing improvements to the Port since 1999 included the deepening of portions
of the Ambrose (AM) Channel (from the Narrows to Port Jersey Channel), the Anchorage (AN)
Channel (from the Narrows to Port Jersey Channel), the Kill Van Kull (KVK) Channel, Newark
Bay (NB) Channel, the Arthur Kill (AK) Channel, and the Port Jersey (PJ) Channel.
The impacts of navigation channel dredging on benthic macroinvertebrate and finfish
communities inhabiting and using the channels have been monitored by USACE-NYD in
compliance with the Coastal Zone Management Act (CZMA). This report presents the results of
pre-construction conditions in 2005 and the post-construction benthic macroinvertebrate
community surveys conducted in 2016 within the following completed HDP contract areas: S-
AK-2 and S-AK-3.
Contract Areas: S-AK-2 and S-AK-3
Benthic Recovery Report 2 NY & NJ Harbor Deepening Project
Benthic sampling was conducted approximately 38 and 20 months following completion of
dredging in Contract Areas S-AK-3 and S-AK-2, respectively (Table 1). The benthic results can
be used to document the Harbor’s benthic community after channel deepening and provides a
general timescale for benthic re-colonization. This report is the fourth in a series of benthic
recovery reports that have been completed throughout the duration of HDP dredging as Contract
Areas are completed (see also USACE 2011, USACE 2013, and USACE 2014).
Background
The benthic community in the Harbor consists of a wide variety of aquatic invertebrates which
live burrowed into or in contact with the bottom, such as worms, mollusks, and amphipods
(Pearce 1974, USACE 2006, USACE 2011, USACE 2013, USACE 2014). Benthic invertebrate
communities are an essential part of the marine food web, they cycle nutrients from the sediment
and water column to higher trophic levels, and they modify the substrate through bioturbation
and the formation of fecal pellets (Wildish and Kristmanson 1997, Wolff 1983).
Life strategies of marine benthic macroinvertebrates and sediment characteristics of their habitats
are tightly coupled (Levinton 1982). The distribution and abundance of benthic invertebrates are
influenced by a wide variety of physical parameters, such as substrate, water temperature,
dissolved oxygen, pH, salinity, and hydrodynamics, as well as disturbance and pollution (Cristini
1991, Watson and Barnes 2004). Benthic organisms are good indicators of local environmental
conditions and anthropogenic disturbance since they live and feed on the sediment and have
limited mobility, thus they cannot avoid exposure to pollution or disturbance (Dauer 1993).
Benthic communities generally respond in stages to habitat disturbance. Response stages include
an increase (or decrease) in abundance; increase (or decrease) in diversity, and a shift to (or
from) a pollution-tolerant to pollution-intolerant assemblage (USEPA 2009).
When a benthic community is physically altered or disturbed, the community may re-colonize
through natural succession to pre-disturbed conditions within approximately one to five years
following the cessation of the disturbance (Blake et al. 1996, Van Dolah et al. 1992). However,
recovery may take longer if physical characteristics (e.g. sediment, hydrology, etc.) are changed
and different species re-colonize (Schaffner et al. 1996, Van Dolah et al. 1994, Wilber and Stern
Contract Areas: S-AK-2 and S-AK-3
Benthic Recovery Report 3 NY & NJ Harbor Deepening Project
1992). Dernie et al. 2003 found that clean sand communities had the most rapid recovery rate
following disturbance, whereas communities from muddy sand habitats had the slowest physical
and biological recovery rates.
Previous Benthic Invertebrate Sampling
Pre-construction benthic samples for the HDP were collected from navigation channel locations
throughout the Harbor in July of 2005 (USACE 2006). The 2005 HDP sample locations were
selected based primarily on sediment types, rather than by HDP Contract Area, to sample the
entire harborwide complex. Previous benthic recovery reports in this series used the 2005 HDP
data as a baseline to assess benthic recovery after HDP construction was completed in each
Contract Area. However, there were no 2005 HDP pre-construction benthic sampling stations
located in the S-AK-2 or S-AK-3 Contract Areas that could be used as a baseline in this study.
Therefore, other surveys that provided benthic invertebrate information within or near the S-AK-
2 or S-AK-3 Contract Areas were evaluated including the New York and New Jersey Harbor
Navigation Study Biological Monitoring Report (USACE 1999) and the Post - Construction
Assessment for the Arthur Kill Channel – Howland Hook Terminal 40 – 41 foot Deepening
Project (USACE 2007).
Two locations were sampled in 1998-99 (identified as HW 6 in and HW 7), one in Contract Area
S-AK-2 and the other in S-AK-3 (species and numbers of benthic invertebrates collected are
available by location and month sampled in November 1998 and February, May, and August
1999). However, this data represents a benthic community that was present over 15 years earlier
and is briefly discussed in this report. The Arthur Kill Channel – Howland Hook Terminal 40 –
41 foot Deepening Project (USACE 2007) data was collected in 2005 during the same time
period as the HDP pre-construction data (USACE 2006) and therefore was used in this report as
the baseline for primary comparison to the 2016 benthic recovery data collected in the S-AK-2
and S-AK-3 Contract Areas. USACE (2007) included benthic sampling at two sampling grids
(Reach 1 and 1A) with 18 stations that were sampled in each grid during July and October 2005.
The sampling methods and analysis were similar to the methods used in 2016. None of the 36
stations sampled in 2005 were in Contract Area S-AK-3 and four stations (7B, 7C, 8B, and 8C)
Contract Areas: S-AK-2 and S-AK-3
Benthic Recovery Report 4 NY & NJ Harbor Deepening Project
in Reach IA were located at the eastern end of Contract Area S-AK-2 near stations SAK2-1 and
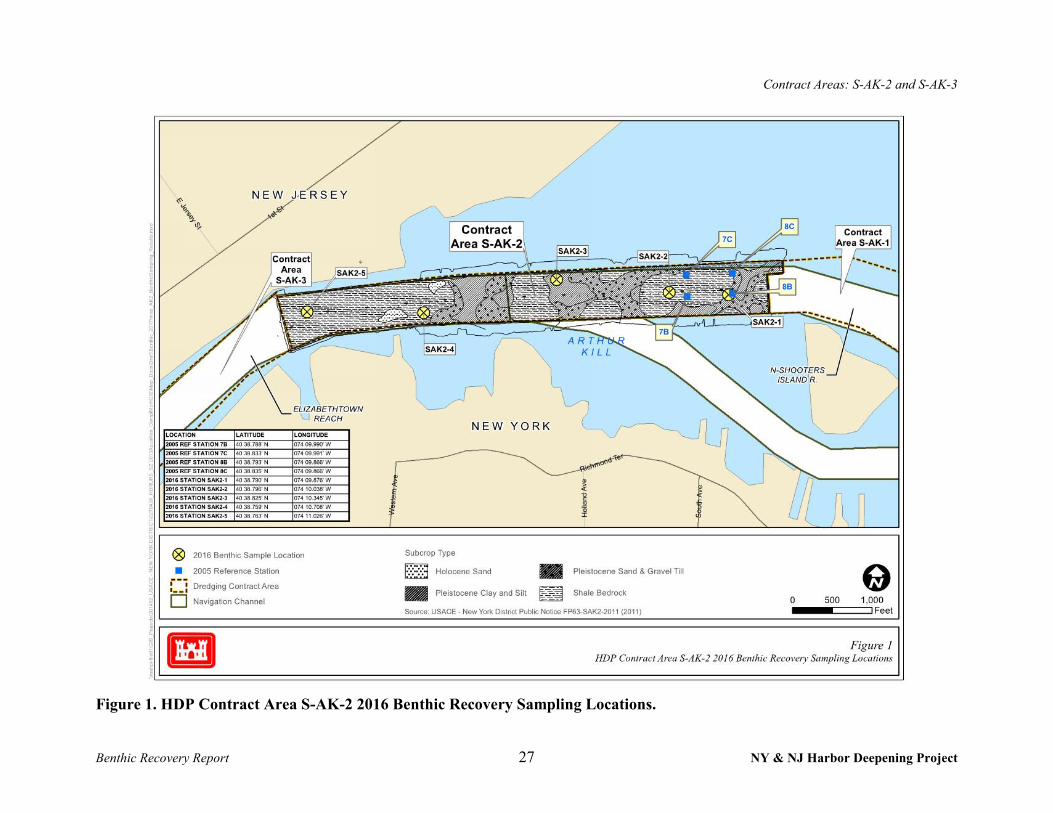
SAK2-2 that were sampled in 2016 (Figure 1).
METHODS
In May 2016, benthic samples were collected from navigation channel locations within each of
the most recently completed HDP Contract Areas and compared with 2005 stations located
within or nearest to the Contract Areas (Table 2). When available, the 2005 pre-construction
channel sampling locations were selected and re-sampled, otherwise 2016 stations were chosen
based on sediment type and location within the Contract Areas to distribute samples over the
existing habitats in the Contract Area and sample as diverse an area as possible.
Two stations sampled in 2016 (SAK2-1 and SAK2-2) represented stations that were sampled
previously in 2005. The remaining 8 stations (3 in S-AK-2 and 5 in S-AK-3) were spaced to
cover the various sediment types identified in the Contract Areas (Figures 1 and 2). Sediment
data provided in the USACE – New York District Public Notice FP63-SAK2-2011 were used to
select these 8 stations.
Sample Collection
Pre- (2005) and post-construction (2016) benthic samples were collected using a 0.1 m2 Smith-
McIntyre Grab. In 2016, at each sampling location, one benthic sample was collected and
washed onboard by gently rinsing the sample through a 500-µm mesh sieve to remove fine grain
sediment prior to preservation. Material retained within the sieve was placed into a labeled
sample bottle and preserved with 10% buffered Formalin containing Rose Bengal stain to
facilitate sorting and identification during laboratory analysis. For each grab sample, the date,
time, location, weather/oceanographic conditions, water depth, and sediment characteristics were
recorded.

Contract Areas: S-AK-2 and S-AK-3
Benthic Recovery Report 5 NY & NJ Harbor Deepening Project
In the laboratory, organisms were sorted from the remaining debris, identified and enumerated.
Identifications were made to the lowest practical identification level (LPIL) when not to the
species level. Sub-sampling was conducted using the fixed-count method to process samples in
an unbiased manner. Sub-sampling was conducted using a sampling tray with 30 grids, each 6
cm x 6 cm. For all samples, organisms in randomly selected grids were counted until the total
number of organisms reached 100 or the entire sample was sorted, whichever occurred first. Note
that the selected grid in which the cumulative organism count reached 100 was counted in its
entirety so the total sub-sampled count could exceed 100. The sub-sampled count was then
multiplied by the split fraction to determine the total number of organisms in the sample. For
example, if the 100 count was reached in the tenth grid (out of 30 grids) and the count was 111
organisms, then the total count for the sample was 333 organisms.
Data Analysis
The benthic community was assessed through calculation of density, taxa richness, Shannon-
Wiener Diversity Index, and Pielou’s Evenness. To assess the community within each completed
Contract Area, biodiversity indices were calculated from the sum of all samples collected within
that area.
Benthic density, or abundance, can be used as an indicator of benthic community health (Becker
et al. 1990). Density, the number of organisms per meter squared (organisms/m²), was calculated
for each taxa in each sample collected. Density was based on the total grab area sampled (0.1 m2)
and the applicable laboratory split fraction, if the sample was sub-sampled. Average density was
also calculated for each Contract Area (e.g. Arthur Kill Channel S-AK-2) by taking the sum of
each taxa collected at each station in that area.
Species richness is a measure of the total number of individual taxa collected at a site. In
counting the number of taxa present, taxonomic designations at the genera, familial, and higher
taxonomic levels were dropped if there was one valid lower level designation for that group. For
example, if Scoloplos sp., Scoloplos fragilis, and Scoloplos robustus were all identified in one
sample, then Scoloplos sp. was not counted in the total number of taxa. The number of taxa
recorded in this example would be two. Species richness was calculated in this manner to be as

Contract Areas: S-AK-2 and S-AK-3
Benthic Recovery Report 6 NY & NJ Harbor Deepening Project
conservative as possible with the number of species present. Since the 2005 surveys, benthic
macroinvertebrate nomenclature and taxonomic changes have occurred, and all changes are used
in this report. For example, Amage auricula is no longer grouped under the order Canalipalpata
and is now under order Terebellida. The 2005 data were updated to match the current taxonomic
classifications.1
The Shannon-Wiener Diversity Index (H′) is a widely used species diversity index (Washington
1984). It provides more information about the benthic community structure than taxa richness
because it takes into account the relative abundance of each taxa as well as taxa richness (Morin
1999). In comparing between samples, lower values of H′ indicate lower taxa richness and an
uneven distribution of abundance among species while higher values indicate higher taxa
richness and an even distribution of abundance among taxa. Typically, a healthy benthic macro-
invertebrate community would have a relatively high H′ value.
The index is computed as follows:
S is the total number of species per sample (i.e., taxa richness) and pi is the proportion of total
individuals in the ith species. Mathematically, pi is defined as ni/N where ni is the number of
individuals of a taxa in a sample and N is the total number of individuals of all taxa in the
sample.2
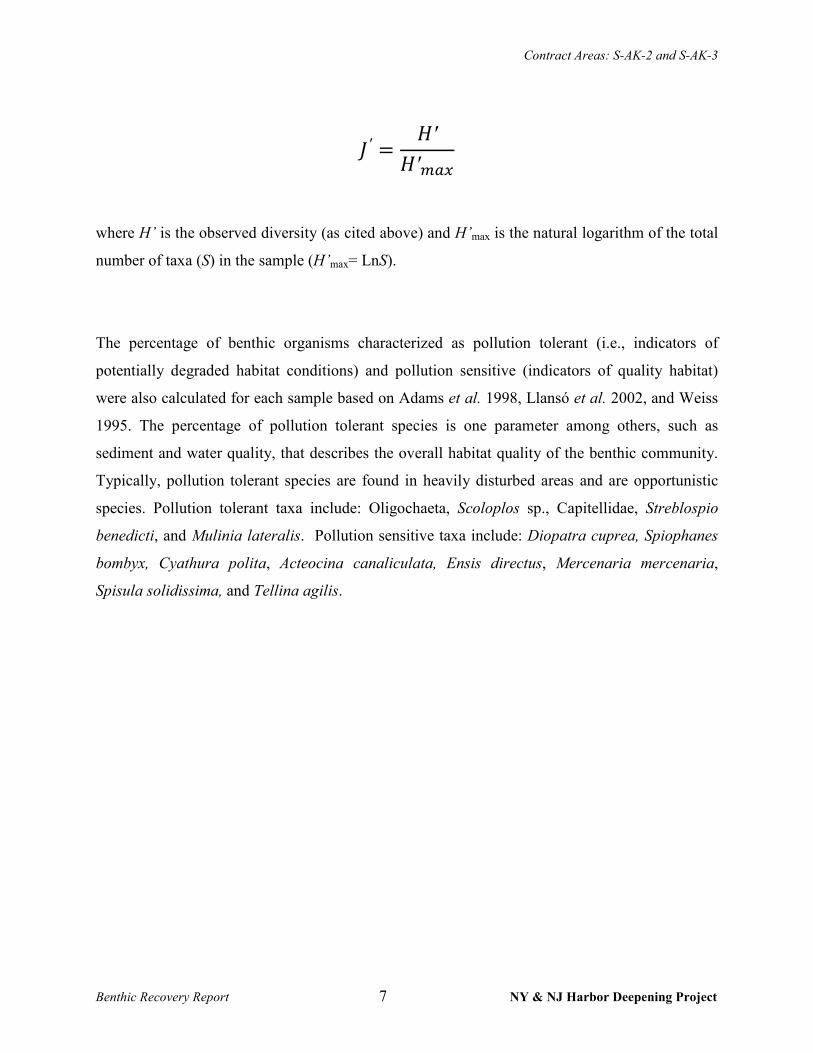
Pielou’s Evenness (J’) measures the distribution among species within the community by scaling
one of the diversity measures relative to its maximal possible value. Evenness can range from 0
to 1. It is computed as follows:
1 The following taxonomic nomenclature changes have been incorporated into USACE 2013, USACE 2014 and this report, respectively: Scoloplos sp. was formerly Leitoscoloplos sp.; Marenzellaria sp. was formerly Scolocolepides sp.; Polydora cornuta was formerly Polydora ligni, Amage auricula was formerly under the order Canalipalpata. The former taxonomic nomenclature was used in the USACE-NYD’s 2006 Harborwide Benthic Monitoring Program containing 2005 data and USACE (2011) containing 2005 and 2009 data. 2 For the Harborwide Benthic Report describing the 2005 sampling results (USACE 2006), the Shannon-Wiener Diversity Index was calculated using Log base 10 (Log10). To remain current with existing benthic community literature, the 2005 and 2016 diversity in this report was calculated using the natural log (Ln).
Contract Areas: S-AK-2 and S-AK-3
Benthic Recovery Report 7 NY & NJ Harbor Deepening Project
�′ =�′
�′���
where H’ is the observed diversity (as cited above) and H’max is the natural logarithm of the total
number of taxa (S) in the sample (H’max= LnS).
The percentage of benthic organisms characterized as pollution tolerant (i.e., indicators of
potentially degraded habitat conditions) and pollution sensitive (indicators of quality habitat)
were also calculated for each sample based on Adams et al. 1998, Llansó et al. 2002, and Weiss
1995. The percentage of pollution tolerant species is one parameter among others, such as
sediment and water quality, that describes the overall habitat quality of the benthic community.
Typically, pollution tolerant species are found in heavily disturbed areas and are opportunistic
species. Pollution tolerant taxa include: Oligochaeta, Scoloplos sp., Capitellidae, Streblospio
benedicti, and Mulinia lateralis. Pollution sensitive taxa include: Diopatra cuprea, Spiophanes
bombyx, Cyathura polita, Acteocina canaliculata, Ensis directus, Mercenaria mercenaria,
Spisula solidissima, and Tellina agilis.

Contract Areas: S-AK-2 and S-AK-3
Benthic Recovery Report 8 NY & NJ Harbor Deepening Project
RESULTS
Previous Arthur Kill Channel Surveys
1998-1999 Samples (USACE 1999)
The Arthur Kill Channel – Howland Hook Terminal 40’ – 41’ foot Deepening Project included
dredging in the S-AK-2 and S-AK-3 Contract Areas prior to 2005. Pre-dredge samples included
seasonal benthic grab samples at pre-construction Station HW-6 in clay and sand with some rock
that were collected in the S-AK-2 Contract Area during 1998 and 1999. Benthic grab samples
were also collected at Station HW-7 in clay and sand with some rock in the S-AK-3 Contract
Area during 1998 and 1999 (USACE 1999). These samples were collected nearly 13 years pre-
construction and they were composed primarily of the ubiquitous polychaete Streblospio
benedicti followed by polychaetes in the family Ampharetidae, Scoloplos fragilis, family
Phyllodocidae, and family Paraonidae; with a small component of amphipods (Leucon
americanus and Ampelisca abdita) and mollusks (Mulinina lateralis and Mya arenaria). A total
of 20 taxa were distributed among three primary phyla: annelids (69% of the total), arthropods
(18%), and mollusks (8%).
2005 Samples (USACE 2007)
Four station locations were in the S-AK-2 Contract Area: 7B, 7C, 8B, and 8C. Stations 7B and
7C were approximately 30% mud and 30% coarse sand with the remainder very fine to medium
sand and little gravel (USACE 2007). Station 8B was approximately 32% gravel, 18% mud, with
the remainder mostly composed of very fine to coarse sands; while station 8C was approximately
42% gravel with very little mud and the remainder mostly composed of fine to very coarse sands.
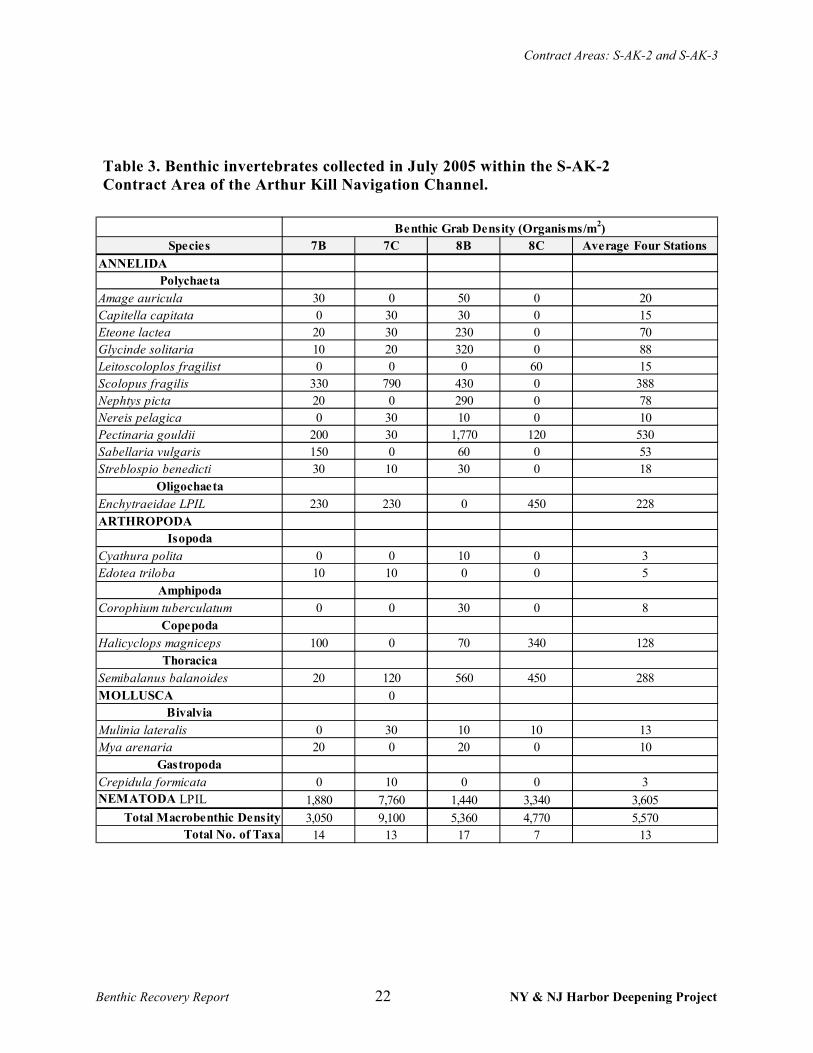
An average benthic community density of 5,570 organisms/m2 was calculated from four grab
samples distributed within the east end of the S-AK-2 Contract Area in 2005 (pre-construction),
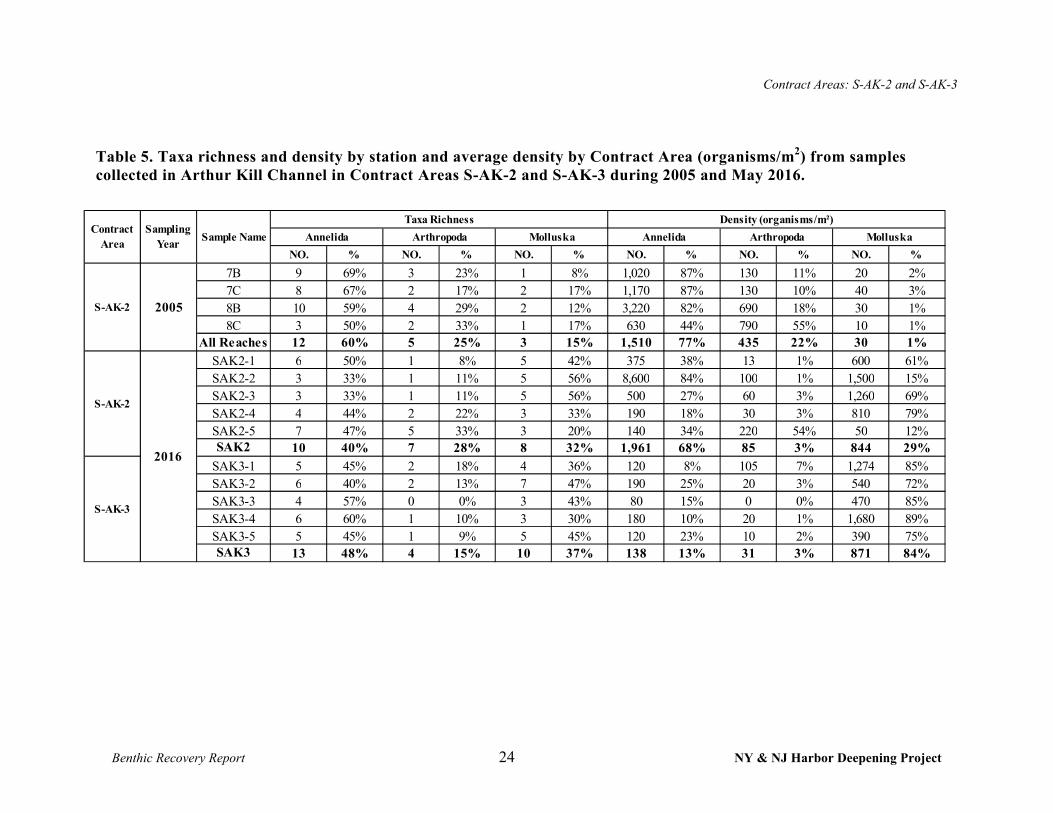
comprising a total of 21 taxa (Table 3). These taxa, excluding nematodes, consisted of 12
annelids (60% of the total), five arthropods (25%), and 3 mollusks (15%) (Table 5).
The majority of the individuals collected in 2005 were nematodes (average density of 3,605
organisms/m2), followed by the polychaetes Pectinaria gouldii (530 organisms/m2) and
Contract Areas: S-AK-2 and S-AK-3
Benthic Recovery Report 9 NY & NJ Harbor Deepening Project
Scoloplos fragilis (388 organisms/m2). An acorn barnacle, Semibalanus balanoides (288
organisms/m2) and Oligochaetes in the family Enchytraeidae (228 organisms/m2) were also
common (Table 3). Other common species included the polychaetes Eteone lactea, Glycinde
solitaria, Nephtys picta, and Sabellaria vulgaris and the cyclopoid copepod Halicyclops
magniceps. Of these four stations, 8B had the greatest number of non-nematode individuals, the
second highest species density, and the highest species richness and diversity (Tables 3 and 6).
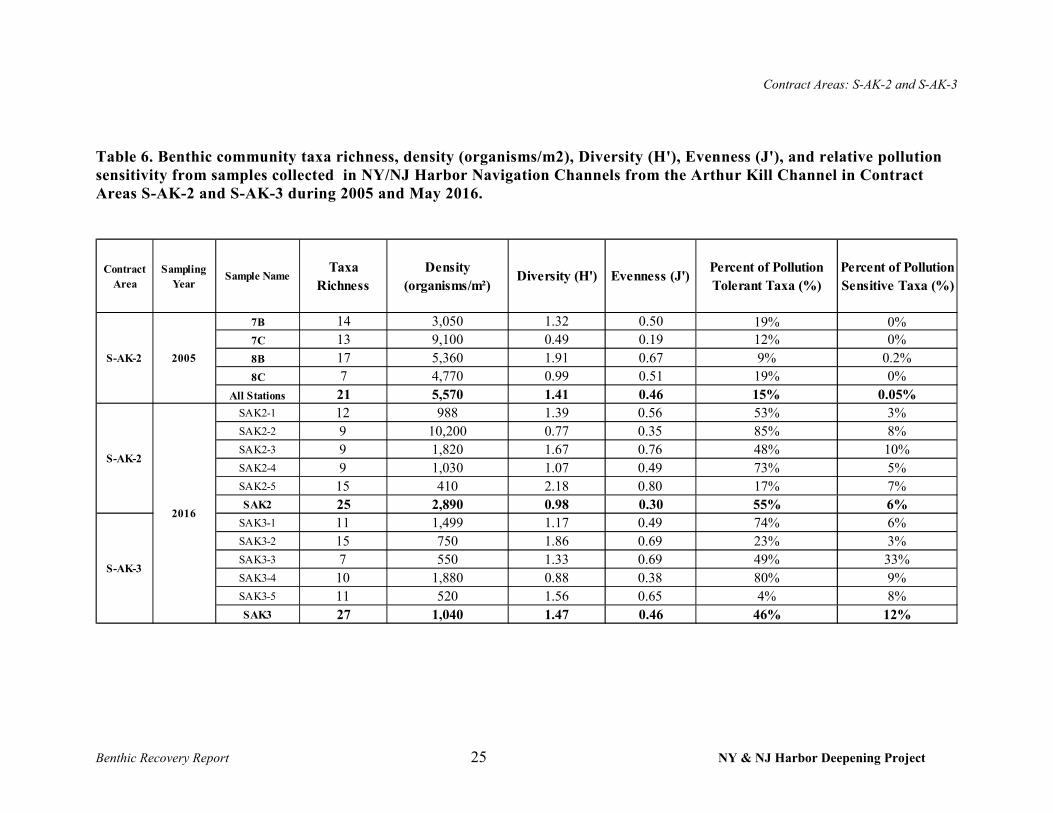
Diversity within the Contract Area ranged from 0.49 to 1.91 with an overall total diversity of
1.41; while evenness within the Contract Area ranged from 0.19 to 0.67 with an overall total
evenness of 0.46 (Table 6). The percentage of the total 2005 assemblage consisting of pollution
tolerant taxa was 15% compared to the percentage of pollution sensitive taxa which was 0.05%
(Table 6).
2016 Arthur Kill Channel (S-AK-2) Survey
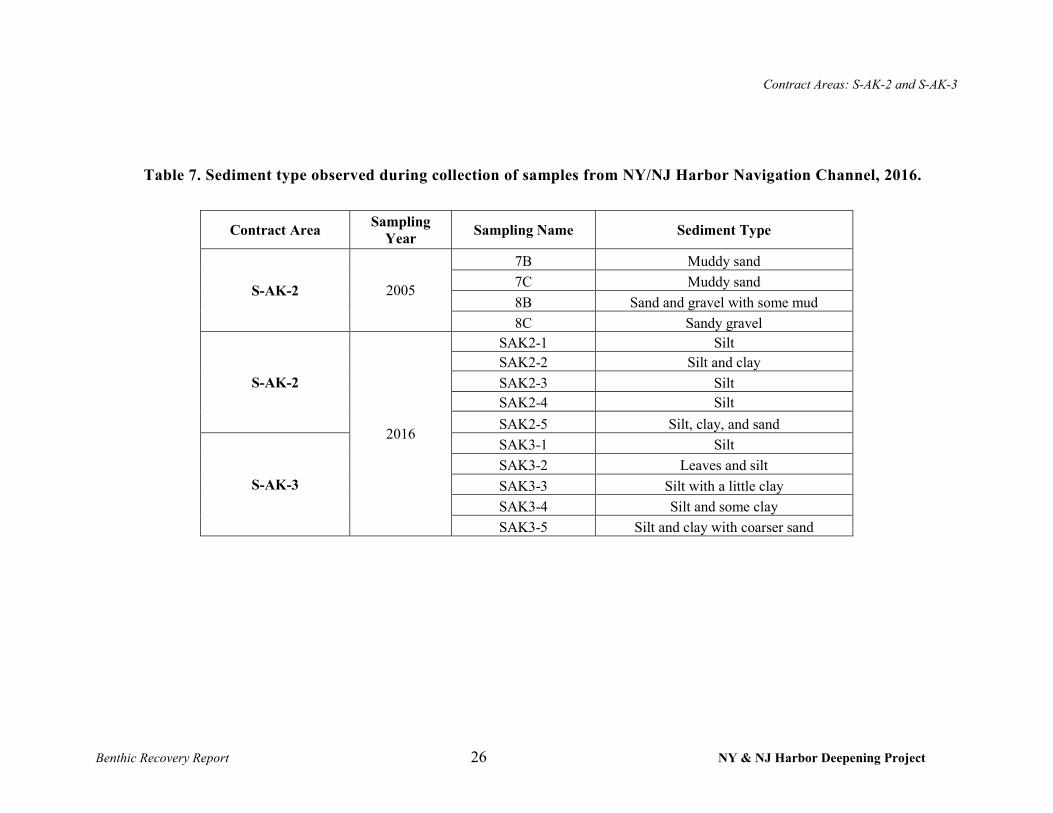
Five stations were sampled in the S-AK-2 Contract Area in 2016 (Figure 1). These post-
construction samples were composed primarily of mud (silt and clay), while one sample (SAK2-
5) had a sand component (Table 7). An average benthic community density of 2,890
organisms/m2 was calculated from these five grab samples distributed within the S-AK-2
Contract Area, comprising a total of 25 taxa (Table 6). These taxa were distributed among three
primary phyla; the relative richness and density of organisms collected among all samples
consisted of 10 annelids (40% of the total), 7 arthropods (28%), and 8 mollusks (32%) (Table 5).
Across the five stations, the average station density ranged from 410 to 10,200 organisms/m2 and
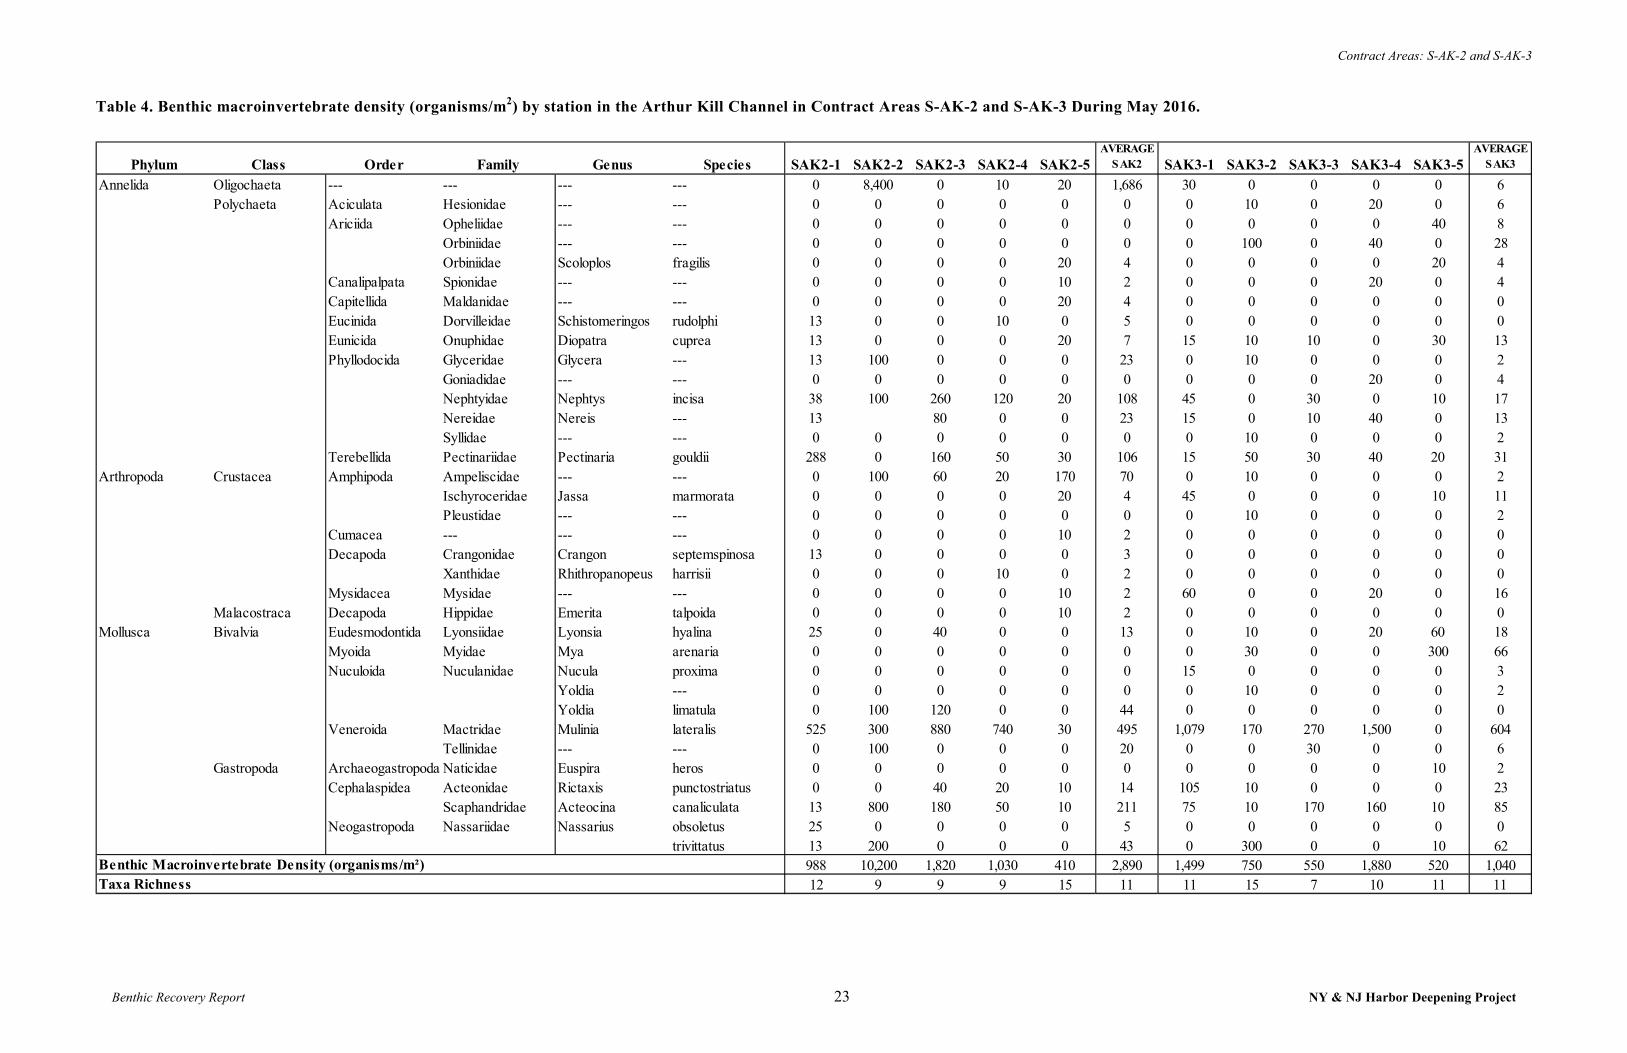
the species richness ranged from 9 to 15 taxa (Table 6). Oligochaetes (phylum Annelida) (1,686
organisms/m2) were the most abundant taxa, accounting for 58% of the total benthic organisms
collected in the Contract Area (Table 4). The dwarf surfclam (Mulinia lateralis) (495
organisms/m2) was the second most abundant species accounting for 17% of the total benthic
organisms collected, followed by the bubble snail Acteocina canaliculata (211 organisms/m2)
which accounted for 7% of the total. Four species accounted for 11% of the total. They included
two polychaetes, Nephtys incisa (108 organisms/m2) and Pectinaria gouldii (106 organisms/m2);
Contract Areas: S-AK-2 and S-AK-3
Benthic Recovery Report 10 NY & NJ Harbor Deepening Project
a tube-dwelling amphipod (Ampeliscidae; 70 organisms/m2); and a spoon clam Yoldia limatula
(44 organisms/m2).
Diversity within the Contract Area ranged from 0.77 to 2.18 with an overall total diversity of
0.98 and evenness ranged from 0.35 to 0.80 with an overall total evenness of 0.30 (Table 6). The
percentage of the total 2016 assemblage consisting of pollution tolerant taxa was 55% compared
to the percentage of pollution sensitive taxa of 6% (Table 6).
2016 Arthur Kill Channel (S-AK-3) Survey
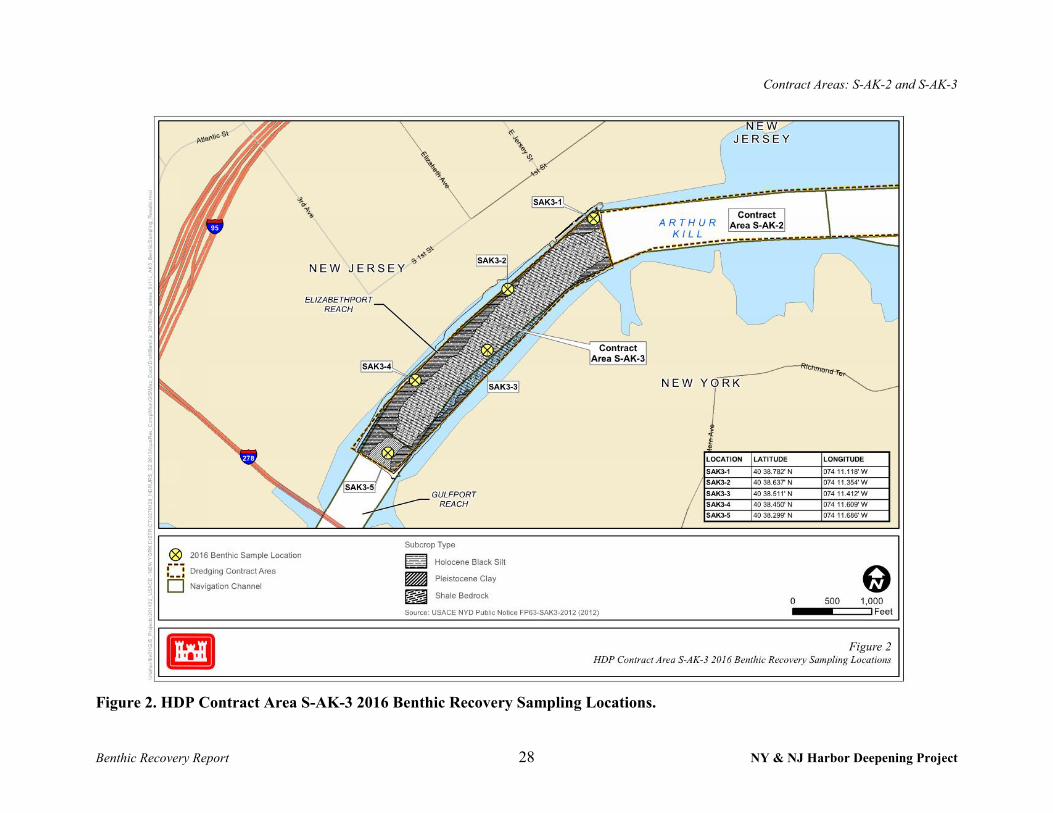
Five stations were sampled in the S-AK-3 Contract Area in 2016 (Figure 2). These post-
construction samples were composed primarily of mud (silt and clay), while one sample (SAK3-
5) had a coarse sand component (Table 7). An average benthic community density of 1,040
organisms/m2 was calculated from five grab samples distributed within the S-AK-3 Contract
Area in 2016 (post-construction), comprising a total of 27 taxa (Table 6). These taxa were
distributed among three primary phyla; the relative richness and density of organisms collected
among all samples consisted of 13 annelids (48%), 4 arthropods (15%), and 10 mollusks (37%)
(Table 5).
Across the five stations, the average station density ranged from 520 to 1,880 organisms/m2 and
the species richness ranged from 7 to 15 taxa (Table 6). The dwarf surfclam (Mulinia lateralis)
(604 organisms/m2) was the most abundant taxa, accounting for 58% of the total benthic
organisms collected in the Contract Area (Table 4). The bubble snail Acteocina canaliculata (85
organisms/m2) was the second most abundant species accounting for 8% of the total, followed by
the soft-shell clam Mya arenaria (66 organisms/m2) which accounted for 6% of the total. The
fourth most abundant species was the New England dog whelk Nassarius trivitatus (62
organisms/m2) which accounted for 6% of the total. Four species accounted for approximately
10% of the total, they included the polychaete Pectinaria gouldii (31 organisms/m2), a
polychaete in the Family Orbiniidae (28 organisms/m2), the pitted baby-bubble snail Rictaxis
punctostriatus (23 organisms/m2) and another polychaete Nephtys incise (17 organisms/m2)
(Table 4).
Contract Areas: S-AK-2 and S-AK-3
Benthic Recovery Report 11 NY & NJ Harbor Deepening Project
Diversity within the Contract Area ranged from 0.88 to 1.86 with an overall total diversity of
1.47 and evenness ranged from 0.38 to 0.69 with an overall total evenness of 0.46 (Table 6). The
percentage of the total 2016 assemblage consisting of pollution tolerant taxa was 46% compared
to the percentage of pollution sensitive taxa of 12% (Table 6).
DISCUSSION
The benthic community in the NY/NJ Harbor consists of a wide variety of aquatic invertebrates
which play an important ecological role in the Harbor. Physical disturbance to a benthic
community is typically followed by a period of re-colonization through natural succession by
invasions of species in existing nearby/adjacent communities (expedited via tidal transport) to
pre-disturbance conditions depending on the similarity of the remaining / modified habitat to the
disturbed habitat (habitat suitability). This natural recovery of the benthic community typically
occurs within approximately one to five years following the cessation of the disturbance (Blake
et al. 1996, Van Dolah et al. 1992). For example, the offshore benthic community in the
USACE-NYD's Manasquan Inlet study recovered rapidly following sand borrow area dredging
in 1997 and 1999; by the spring of 2000 no statistically detectable differences were noted
between dredged and reference areas in benthic abundance and biomass (USACE 2001).
However, other studies indicate that a less rapid recovery in areas of benthic disturbance is also
possible, particularly if physical characteristics (e.g. sediment, hydrology, etc.) are changed and
different species re-colonize (Schaffner et al. 1996, Van Dolah et al. 1994, Wilber and Stern
1992). Dernie et al. 2003 found that clean sand communities had the most rapid recovery rate
following disturbance, whereas communities from muddy sand habitats had the slowest physical
and biological recovery rates. Newell et al. (1998) observed that borrow areas at higher latitudes
recover at slower rates than borrow areas at lower latitudes. They also noted that relatively
weaker currents through a borrow area could decrease the rate of recovery to as much as 2-8
years (Newell et al. 1998).
Contract Areas: S-AK-2 and S-AK-3
Benthic Recovery Report 12 NY & NJ Harbor Deepening Project
Newell et al. (1998) provides a potential description of the process of ecological succession and
the re-colonization process of marine macro-benthic communities. Within the first year
following disturbance, there is typically rapid re-colonization and population growth by R-
selected species, which are opportunistic and reproduce quickly (e.g. polychaetes of the family
Capitellidae and the amphipod Ampelisca sp.) (Gray and Elliot 2009, Santos and Simon 1980,
Tsutsumi 1987). Typically, less than one year after disturbance, the number of species is
relatively low, but the number of organisms in the disturbed area is extremely high. At one year
post-disturbance a second group of species begin to re-colonize the area. Species richness
increases, but the number of organisms decreases. Mollusks such as the Atlantic nutclam
(Nucula proxima), usually re-establish during this time frame. During this transitional period, a
mixture of r-selected colonizers and stable (K-selected) species are present, as was generally
observed in each of the Contract Areas sampled during the previous benthic recovery survey
(USACE 2013, USACE 2014). Eventually, the species composition and density begin to reach
pre-disturbance conditions, or resemble a relatively stable community (Pearson and Rosenberg
1978). This community, though perhaps different from the pre-existing community, will
nonetheless continue to provide trophic support and material/nutrient processing functions which
contribute to maintenance of the estuarine benthos.
The majority of species identified in grab samples collected during the 2005 (pre-construction)
and 2016 (post-construction) benthic macroinvertebrate surveys were annelids (oligochaetes and
polychaetes), arthropods (Ampeliscidae), and mollusks (bivalves and gastropods). These taxa are
typically found in the Harbor, and vary considerably in occurrence and abundance both
seasonally and spatially (BVA 1998, Cerrato et al. 1989, Dean 1975, Iocco et al. 2000,
Gandarillas and Brinkhuis 1981). USACE (2007) found shifts in species and densities within the
same sampling grids between samples collected in July 2005 compared to October 2005.
Seasonal shifts in species and densities were also found in seasonal collections at two locations
within the S-AK-2 and S-AK-3 Contract Areas from 1998 to 1999 (USACE 1999). Therefore,
differences in species, densities, and distribution may occur naturally in relatively small areas
and it would be anticipated that greater difference could be expected over large areas.
Contract Areas: S-AK-2 and S-AK-3
Benthic Recovery Report 13 NY & NJ Harbor Deepening Project
During this study, benthic sampling was conducted approximately 20 to 38 months following the
completion of HDP dredging in Contract Areas S-AK-2 and S-AK-3, respectively (Table 1).
Benthic community recovery was assessed through density, taxa richness, Shannon-Wiener’s
diversity index, and Pielou’s Evenness from data within the completed HDP Contract Areas: S-
AK-2 and S-AK-3. Figures 3 through 7 illustrate summaries of calculated indices in each
Contract Area sampled for both the 2005 and 2016 sampling efforts.
Arthur Kill Channel (S-AK-2) Summary
Benthic macroinvertebrate sampling occurred approximately 38 months post HDP construction
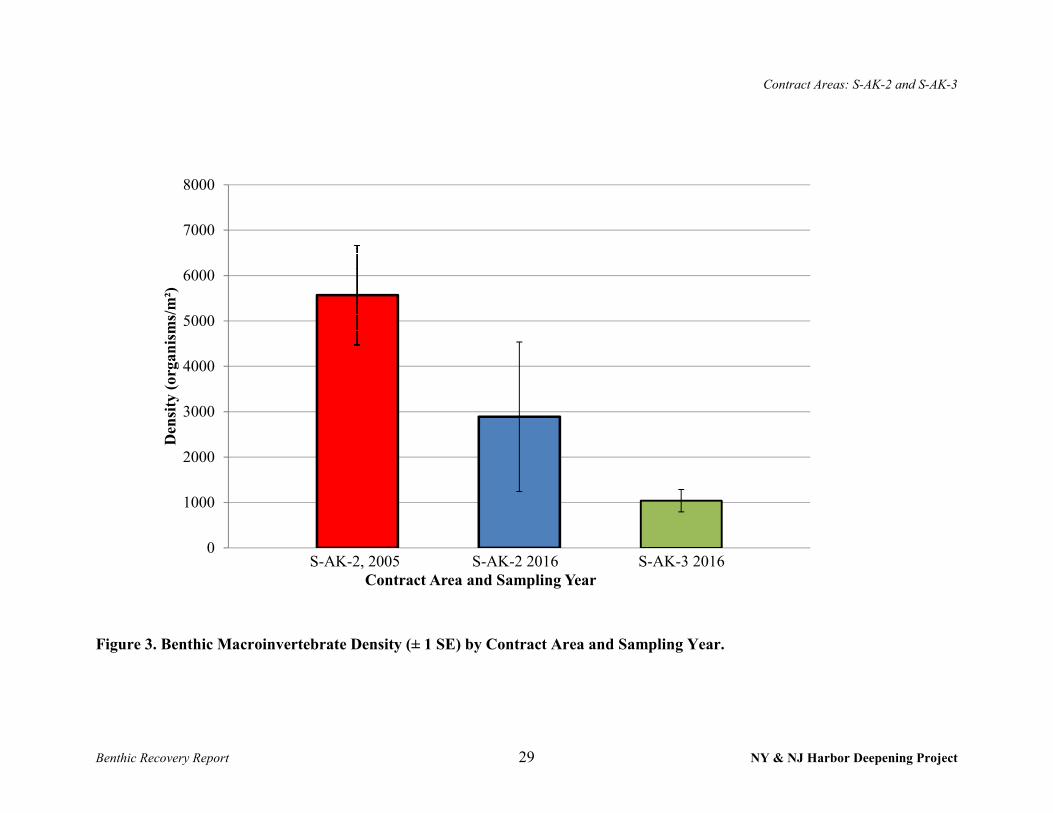
in the S-AK-2 Contract Area. Overall, average benthic macroinvertebrate density decreased from
5,570 organisms/m2 in 2005 to 2,890 organisms/m2 in 2016 (Figure 3), while species richness
increased from 21 species in 2005 to 25 species in 2016 (Table 6). Community diversity (Figure
4) and evenness (Figure 5) dropped from 1.41 and 0.46, respectively in 2005 to 0.98 and 0.30 in
2016, suggesting that although the total number of taxa within the study area had increased not
all of the benthic community indices had fully recovered to the 2005 condition. These results
were consistent with previous sampling efforts in other similar high energy and high flow
channel areas such as S-AK-1 (USACE 2014) and S-KVK-2 (USACE 2011). In the nearby S-
AK-1 Contract Area, for example, which was sampled in 2013 approximately five months after
the completion of HDP dredging, results showed an increase in the number of taxa from 12 in
2005 to 19 in 2013 but a decrease in average density similar to S-AK-2. In S-AK-1, however,
diversity and evenness did improve as a result of the increased number of taxa collected, unlike
S-AK-2.
In 2005, nematodes were the dominant organisms collected from all four stations located in S-
AK-2. Nematode density was 3,605 organisms/m2 in 2005, however no nematodes were
collected in 2016. In 2016, pollution tolerant oligochaetes were the dominant species at SAK-2-2
(8,400 organisms/m2); while few to none were collected at the other four stations (Table 4). In
2016, the dwarf surfclam (Mulinia lateralis) a pollution tolerant mollusk and the bubble snail
(Acteocina canaliculata) were common to abundant in the S-AK-2 Contract Area; few bivalve
mollusks were collected in 2005. Polychaetes were well represented in both 2005 and 2016;
Contract Areas: S-AK-2 and S-AK-3
Benthic Recovery Report 14 NY & NJ Harbor Deepening Project
Scolopus fragilis was the dominant polychaete species in 2005 compared to 2016 when Nephtys
incisa and Pectinaria gouldii were co-dominant polychaetes. Arthropods densities were similar
in both 2005 and 2016; the acorn barnacle Semibalanus balanoides and the cyclopoid copepod
Halicyclops magniceps were common in 2005 and a tube-dwelling amphipod (in the family
Ampeliscidae) was common in 2016.
In May 1999, taxa richness was 16 and average station density was 480 organisms/m2 at Station
HW-6 in the S-AK-2 Contract Area (USACE 1999 Table F1-6), which was similar to 2005
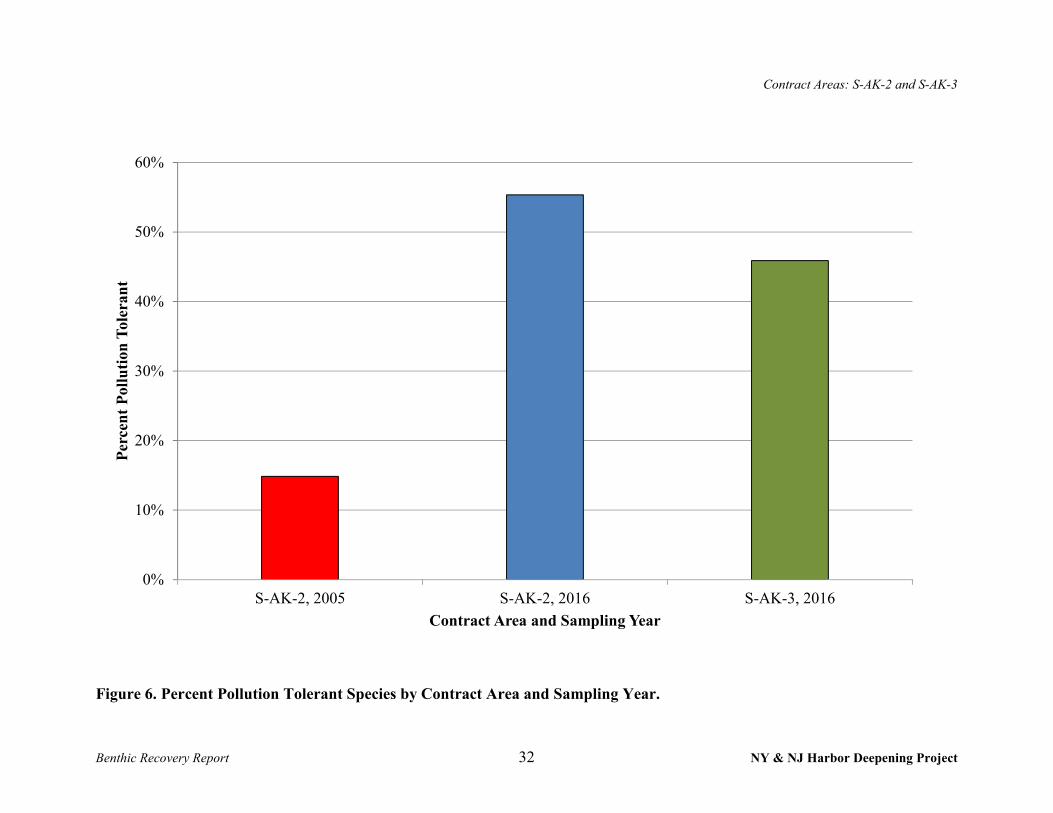
results and lower than that observed in 2016. The percentage of the total 2016 assemblage
consisting of pollution tolerant taxa was 55% which was much higher than observed in 2005
(15%) (Figure 6) and due primarily to a high density of Oligochaetes at one station (SAK-2-2)
and high densities of the Mulinia lateralis at stations SAK-2-1, 2, 3, and 4 (Table 4). However,
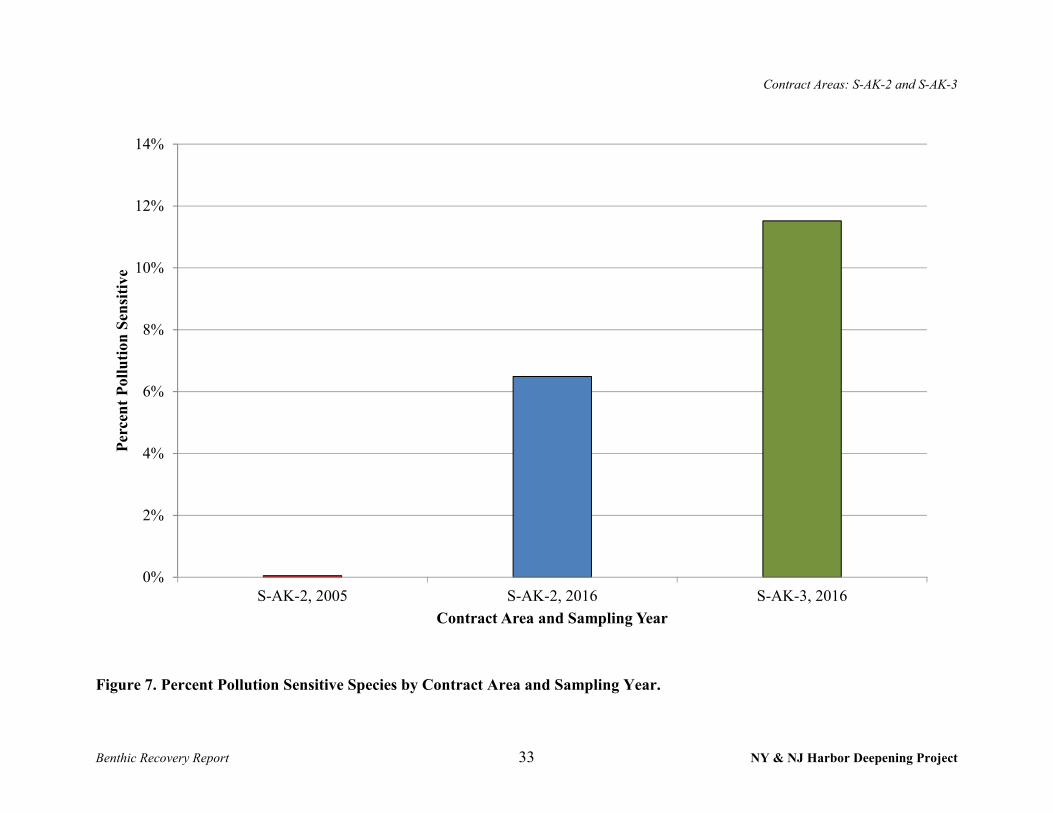
an increase in the percentage of pollution sensitive taxa from <0.1% in 2005 to more than 6% in
2016 (Figure 7) suggests that overall benthic habitat conditions may be improving within the
Contract Area.
Arthur Kill Channel (S-AK-3) Summary
Benthic macroinvertebrate sampling occurred approximately 20 months post HDP construction
in the S-AK-3 Contract Area. Overall, average benthic macroinvertebrate density decreased from
5,570 organisms/m2 in 2005 to 1,040 organisms/m2 in 2016 (Figure 3), while species richness
increased from 21 species in 2005 to 27 species in 2016 (Table 6). Community diversity
increased from 1.41 in 2005 to 1.47 in 2016 (Figure 4) and evenness was unchanged from 2005
to 2016 at 0.46 (Figure 5), suggesting that although benthic macroinvertebrate density had
decreased, overall benthic community indices within the Contract Area had recovered to the
2005 condition.
Nematodes were dominant in 2005 samples from the S-AK-2 Contract Area and accounted for
3,605 organisms/m2 in 2005; however, no nematodes were collected in 2016. In 2016, the dwarf
surfclam (Mulinia lateralis) a pollution tolerant mollusk and the bubble snail Acteocina
canaliculata were abundant in the S-AK-3 Contract Area, whereas few bivalve mollusks were

Contract Areas: S-AK-2 and S-AK-3
Benthic Recovery Report 15 NY & NJ Harbor Deepening Project
collected in the 2005 study area. Polychaetes were well represented in both 2005 and 2016;
Scolopus fragilis was the dominant polychaete species in 2005 compared to 2016 when Nephtys
incisa and Pectinaria gouldii were co-dominant. Arthropod densities were similar in both 2005
and 2016; the acorn barnacle Semibalanus balanoides and the cyclopoid copepod Halicyclops
magniceps were common in 2005 and a tube-dwelling amphipod (in the family Ampeliscidae)
was common in 2016.
In May 1999, taxa richness was 13 and average density was 590 organisms/m2 at Station HW-7
in the S-AK-3 Contract Area (USACE 1999 Table F1-7) which was lower than that observed in
2016. The percentage of the total 2016 assemblage consisting of pollution tolerant taxa was 46%
which was much higher than found in the S-AK-2 Contract Area in 2005 (15%) and this was due
primarily to high densities of the Mulinia lateralis in the S-AK-3 Contract Area in 2016 (Table 4
and Figure 6). However, an increase in the percentage of pollution sensitive taxa from <0.1% in
2005 to almost 12% in 2016 (Figure 7) suggests that overall benthic habitat conditions may be
improving within the Contract Area.
Contract Areas: S-AK-2 and S-AK-3
Benthic Recovery Report 16 NY & NJ Harbor Deepening Project
LITERATURE CITED
Adams, D.A., J.S. O’Connor, and S.B. Weisberg. 1998. Sediment Quality of the NY/NJ Harbor
System. U. S. Environmental Protection Agency, Report No. 902-R-98-001.
Barry A. Vittor & Associates, Inc. (BVA). 1998. Hudson/Raritan Bay Estuary Benthic
Community Assessment. Prepared for US Department of Commerce – NOAA.
Becker, D.S., G.R. Bilyard, and T.C. Ginn. 1990. Comparisons between sediment bioassays and
alterations of benthic macro-invertebrate assemblages at a marine Superfund site:
Commencement Bay, Washington. Environmental Toxicology and Chemistry 9:669-685.
Blake, N.J., L.J. Doyle, and J.J. Culter. 1996. Impacts and direct effects of sand dredging for
beach renourishment on the benthic organisms and geology of the west Florida shelf.
Prepared for U.S. Dept. of Interior, Minerals Management Service, Office of
International Activities and Marine Minerals (INTERMAR). OCS Report MMS 95-0005.
Cerrato, R.M., H.J. Bokuniewicz, and M.H. Wiggins. 1989. A Spatial and Seasonal Study of the
Benthic Fauna of Lower Bay of New York Harbor. Special Report 84. Marine Science
Research Center, State University of New York, Stony Brook, NY.
Cristini, A. 1991. Synthesis of Information on the Distribution of Benthic Invertebrates in the
Hudson/Raritan System. Final Report. Ramapo College of New Jersey, Mahwah, NJ.
Dauer, D.M. 1993. Biological criteria, environmental health and estuarine macrobenthic
community structure. Marine Pollution Bulletin 26:149–157.
Dean D. 1975. Raritan Bay Macrobenthos Survey, 1957-1960. Data Report 99. National Marine
Fisheries Service (NMFS), Seattle, WA.
Dernie, K.M., M.J. Kaiser and R.M. Warwick. 2003. Recovery rates of benthic communities
following physical disturbance. Journal of Animal Ecology 72:1043–1056.
Gandarillas, F.E. and B.H. Brinkhuis. 1981. Benthic Faunal Assemblages in the Lower Bay of
New York Harbor. Marine Sciences Research Center, State University of New York.
Stony Brook, New York.
Contract Areas: S-AK-2 and S-AK-3
Benthic Recovery Report 17 NY & NJ Harbor Deepening Project
Gray, J.S. and M. Elliott. 2009. Ecology of Marine Sediments: From Science to Management.
OUP, Oxford, 225 pp.
Iocco, L.E., P. Wilber, R.J. Diaz, D.G. Clarke, and R.J. Will. 2000. Benthic Habitats of New
York/New Jersey Harbor: 1995 Survey of Jamaica, Upper, Newark, Bowery and Flushing
Bays. Prepared for NOAA, USACE-NY District, and the states of New York and New
Jersey.
Levinton, J.S. 1982. Marine Ecology. Prentice-Hall Publ. Co. Englewood Cliffs, NJ, 526 pp.
Llansó, R.J., L.C. Scott, J.L. Hyland, D.M. Dauer, D.E. Russell, and F.W. Kutz. 2002. An
estuarine benthic index of biotic integrity for the mid-Atlantic region of the United States.
II. Index development. Estuaries 25:1231-1242.
Morin, P. J. 1999. Community Ecology. Blackwell Science, Inc. Malden, MA. 424 pp.
Newell, R.C., L.J. Seiderer, and D.R. Hitchcock. 1998. The impact of dredging works in coastal
waters: a review of the sensitivity to disturbance and subsequent recovery of biological
resources on the sea bed. Annual Reviews in Oceanography and Marine Biology 36:127-
178.
Pearce, B. 1974. Invertebrates of the Hudson River Estuary. Hudson River Colloquium, Annals
of the New York Academy of Sciences 250 pp. 137-143.
Pearson, T.H. and R. Rosenberg. 1978. Macrobenthic succession in relation to organic
enrichment and pollution of the marine environment. Oceanography and Marine Biology
Annual Review 16:229–311.
Santos, S. L., and J. L. Simon. 1980. Marine soft-bottom community establishment following
annual defaunation: Larval or adult recruitment. Marine Ecology Progress Series 2: 235–
241.
Schaffner, L.C., C.H. Hobbs, and M.A. Horvath. 1996. Effects of Sand-Mining on Benthic
Communities and Resource Value: Thimble Shoal, Lower Chesapeake Bay. Technical
Report, Virginia Institute of Marine Science, Gloucester Point, VA.
Tsutsumi, H. 1987. Population dynamics of Capitella capitata (Polychaeta; Capitellidae) in an
organically polluted cove. Marine Ecology Progress Series 36: 139-149.

Contract Areas: S-AK-2 and S-AK-3
Benthic Recovery Report 18 NY & NJ Harbor Deepening Project
United States Army Corps of Engineers (USACE).1999. Biological Monitoring Program for the
New York and New Jersey Harbor Navigation Study Final Report. U.S. Army Corps of
Engineers – New York District, New York, NY.
United States Army Corps of Engineers (USACE). 2006. Harborwide Benthic Monitoring
Program. Final Report. U.S. Army Corps of Engineers – New York District, New York,
NY.
United States Army Corps of Engineers (USACE). 2007. Post-Construction Assessment Arthur
Kill Channel – Howland Hook Terminal 40’ – 41’ Deepening Project. Final Report. U.S.
Army Corps of Engineers – New York District, New York, NY.
United States Army Corps of Engineers (USACE). 2008. Dredged Material Management Plan
for the Port of New York and New Jersey: Update - Volume 1. U.S. Army Corps of
Engineers, New York District, New York, NY.
United States Army Corps of Engineers (USACE). 2010. New York & New Jersey Harbor (50 ft.
Deepening) Navigation Project Public Notice. Available at:
http://www.nan.usace.army.mil/project/newjers/factsh/pdf/nynj.pdf
United State Army Corps of Engineers (USACE). 2011. Benthic Recovery Monitoring Report:
Contract Areas S-AM-1, S-AN-1a, and S-KVK-2. U.S. Army Corps of Engineers – New
York District, New York, NY.
United States Army Corps of Engineers (USACE). 2013. Benthic Recovery Monitoring Report:
Contract Areas S-AN-2, S-AN-1b, S-E-1, and S-NB-1. U.S. Army Corps of Engineers –
New York District, New York, NY.
United States Army Corps of Engineers (USACE). 2014. Benthic Recovery Monitoring Report:
Contract Areas S-KVK-1, S-NB-2/S-AK-1, S-AM-2(a&b), and S-AM-3(a&b). U.S.
Army Corps of Engineers – New York District, New York, NY.
United States Environmental Protection Agency (USEPA). 2009. Biological Indicators of
Watershed Health - Invertebrates as Indicators. Friday, December 04, 2009. Available at:
http://www.epa.gov/bioindicators/html/invertebrate.html.
Van Dolah, R.F., P.H. Wendt, R.M. Martore, M.V. Levisen, and W.A. Roumillat. 1992. A
Physical and Biological Monitoring Study of the Hilton Head Beach Nourishment
Project. Final Report to Town of Hilton Head, SC and the South Carolina Coastal
Council.
Contract Areas: S-AK-2 and S-AK-3
Benthic Recovery Report 19 NY & NJ Harbor Deepening Project
Van Dolah, R.F., R.M. Martore, A.E. Lynch, M.V. Levisen, P.H. Wendt, D.J. Whitaker, and
W.D. Anderson. 1994. Environmental Evaluation of the Folly Beach Nourishment
Project. Final Report to U.S. Army Corps of Engineers, Charleston District, Charleston,
SC.
Washington, H.G. 1984. Diversity, biotic and similarity indices. A review with special relevance
to aquatic ecosystems. Water Research 18:653-694.
Watson D.I. and D.K.A. Barnes. 2004. Quantifying Assemblage Distinctness With Time: An
Example Using Temperate Epibenthos. Journal of Experimental Marine Biology &
Ecology 312: 367-383.
Weiss, H.M. 1995. Marine animals of southern New England and New York: Identification keys
to common nearshore and shallow water macrofauna. State Geological and Natural
History Survey of Connecticut. Department of Environmental Protection Maps and
Publications Office. Hartford, CT.
Wilber, P. and M. Stern. 1992. A re-examination of infaunal studies that accompany beach
nourishment projects. pp. 242-257 in: New Directions in Beach Management:
Proceedings of the 5th Annual National Conference on Beach Preservation Technology,
St. Petersburg, FL, February 12-14, 1992. Florida Shore and Beach Preservation
Association, Tallahassee, FL.
Wildish, D. and D. Kristmanson. 1997. Benthic Suspension Feeders and Flow. Cambridge
University Press. New York.
Wolff, W.J. 1983. Estuarine Benthos. in: Ketchum, B.H. (ed.). Estuaries and Enclosed Seas.
Elsevier, Amsterdam. pp. 151-182.
Zajac, R.N., and R.B. Whitlatch. 1982. Responses of estuarine infauna to disturbance. I. Spatial
and temporal variation of initial recolonization. Marine Ecology – Progress Series 10:1-
14.

Contract Areas: S-AK-2 and S-AK-3
Benthic Recovery Report 20 NY & NJ Harbor Deepening Project
TABLES & FIGURES
Contract Areas: S-AK-2 and S-AK-3
Benthic Recovery Report 21 NY & NJ Harbor Deepening Project
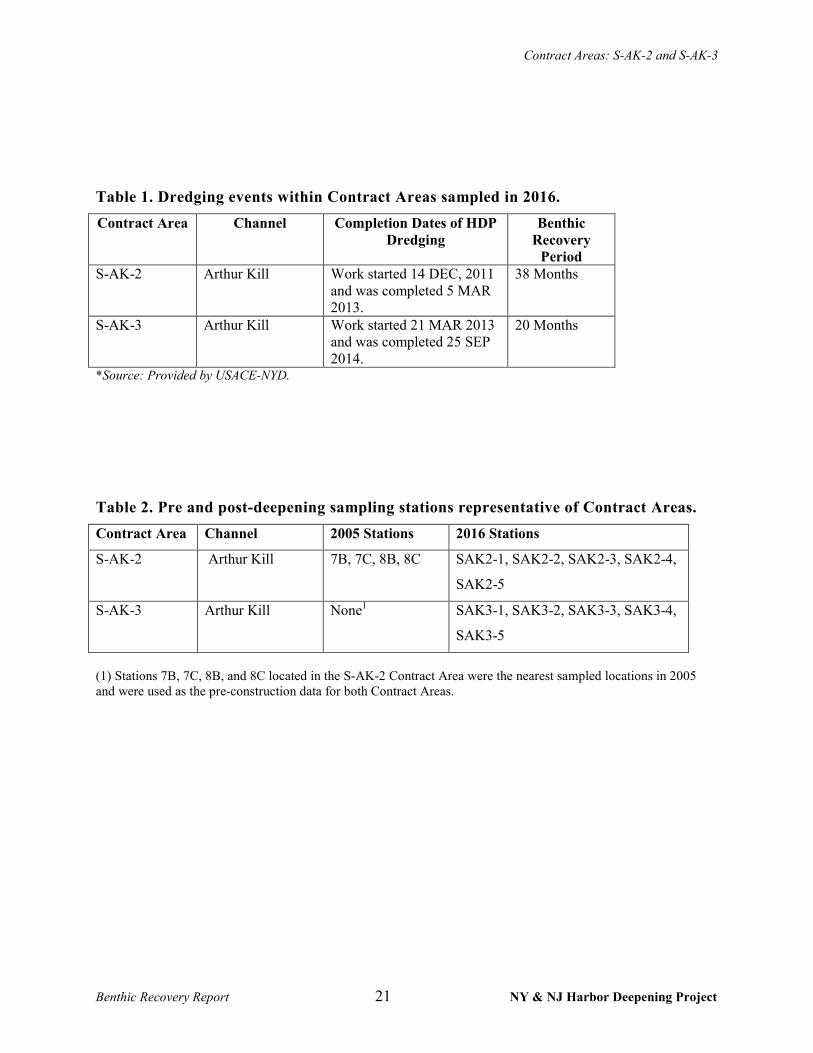
Table 1. Dredging events within Contract Areas sampled in 2016.
Contract Area Channel Completion Dates of HDP
Dredging
Benthic
Recovery
Period
S-AK-2 Arthur Kill Work started 14 DEC, 2011 and was completed 5 MAR 2013.
38 Months
S-AK-3 Arthur Kill Work started 21 MAR 2013 and was completed 25 SEP 2014.
20 Months
*Source: Provided by USACE-NYD.
Table 2. Pre and post-deepening sampling stations representative of Contract Areas.
Contract Area Channel 2005 Stations 2016 Stations
S-AK-2 Arthur Kill 7B, 7C, 8B, 8C SAK2-1, SAK2-2, SAK2-3, SAK2-4,
SAK2-5
S-AK-3 Arthur Kill None1 SAK3-1, SAK3-2, SAK3-3, SAK3-4,
SAK3-5
(1) Stations 7B, 7C, 8B, and 8C located in the S-AK-2 Contract Area were the nearest sampled locations in 2005 and were used as the pre-construction data for both Contract Areas.
Contract Areas: S-AK-2 and S-AK-3
Benthic Recovery Report 22 NY & NJ Harbor Deepening Project
Table 3. Benthic invertebrates collected in July 2005 within the S-AK-2
Contract Area of the Arthur Kill Navigation Channel.
Species 7B 7C 8B 8C Average Four Stations
ANNELIDA
Polychaeta
Amage auricula 30 0 50 0 20
Capitella capitata 0 30 30 0 15
Eteone lactea 20 30 230 0 70
Glycinde solitaria 10 20 320 0 88
Leitoscoloplos fragilist 0 0 0 60 15
Scolopus fragilis 330 790 430 0 388
Nephtys picta 20 0 290 0 78
Nereis pelagica 0 30 10 0 10
Pectinaria gouldii 200 30 1,770 120 530
Sabellaria vulgaris 150 0 60 0 53
Streblospio benedicti 30 10 30 0 18
Oligochaeta
Enchytraeidae LPIL 230 230 0 450 228
ARTHROPODA
Isopoda
Cyathura polita 0 0 10 0 3
Edotea triloba 10 10 0 0 5
Amphipoda
Corophium tuberculatum 0 0 30 0 8
Copepoda
Halicyclops magniceps 100 0 70 340 128
Thoracica
Semibalanus balanoides 20 120 560 450 288
MOLLUSCA 0
Bivalvia
Mulinia lateralis 0 30 10 10 13
Mya arenaria 20 0 20 0 10
Gastropoda
Crepidula formicata 0 10 0 0 3
NEMATODA LPIL 1,880 7,760 1,440 3,340 3,605
Total Macrobenthic Density 3,050 9,100 5,360 4,770 5,570
Total No. of Taxa 14 13 17 7 13
Benthic Grab Density (Organisms/m2)
Contract Areas: S-AK-2 and S-AK-3
Benthic Recovery Report 23 NY & NJ Harbor Deepening Project
Table 4. Benthic macroinvertebrate density (organisms/m2) by station in the Arthur Kill Channel in Contract Areas S-AK-2 and S-AK-3 During May 2016.
Phylum Class Order Family Genus Species SAK2-1 SAK2-2 SAK2-3 SAK2-4 SAK2-5
AVERAGE
SAK2 SAK3-1 SAK3-2 SAK3-3 SAK3-4 SAK3-5
AVERAGE
SAK3
Annelida Oligochaeta --- --- --- --- 0 8,400 0 10 20 1,686 30 0 0 0 0 6
Polychaeta Aciculata Hesionidae --- --- 0 0 0 0 0 0 0 10 0 20 0 6
Ariciida Opheliidae --- --- 0 0 0 0 0 0 0 0 0 0 40 8
Orbiniidae --- --- 0 0 0 0 0 0 0 100 0 40 0 28
Orbiniidae Scoloplos fragilis 0 0 0 0 20 4 0 0 0 0 20 4
Canalipalpata Spionidae --- --- 0 0 0 0 10 2 0 0 0 20 0 4
Capitellida Maldanidae --- --- 0 0 0 0 20 4 0 0 0 0 0 0
Eucinida Dorvilleidae Schistomeringos rudolphi 13 0 0 10 0 5 0 0 0 0 0 0
Eunicida Onuphidae Diopatra cuprea 13 0 0 0 20 7 15 10 10 0 30 13
Phyllodocida Glyceridae Glycera --- 13 100 0 0 0 23 0 10 0 0 0 2
Goniadidae --- --- 0 0 0 0 0 0 0 0 0 20 0 4
Nephtyidae Nephtys incisa 38 100 260 120 20 108 45 0 30 0 10 17
Nereidae Nereis --- 13 80 0 0 23 15 0 10 40 0 13
Syllidae --- --- 0 0 0 0 0 0 0 10 0 0 0 2
Terebellida Pectinariidae Pectinaria gouldii 288 0 160 50 30 106 15 50 30 40 20 31
Arthropoda Crustacea Amphipoda Ampeliscidae --- --- 0 100 60 20 170 70 0 10 0 0 0 2
Ischyroceridae Jassa marmorata 0 0 0 0 20 4 45 0 0 0 10 11
Pleustidae --- --- 0 0 0 0 0 0 0 10 0 0 0 2
Cumacea --- --- --- 0 0 0 0 10 2 0 0 0 0 0 0
Decapoda Crangonidae Crangon septemspinosa 13 0 0 0 0 3 0 0 0 0 0 0
Xanthidae Rhithropanopeus harrisii 0 0 0 10 0 2 0 0 0 0 0 0
Mysidacea Mysidae --- --- 0 0 0 0 10 2 60 0 0 20 0 16
Malacostraca Decapoda Hippidae Emerita talpoida 0 0 0 0 10 2 0 0 0 0 0 0
Mollusca Bivalvia Eudesmodontida Lyonsiidae Lyonsia hyalina 25 0 40 0 0 13 0 10 0 20 60 18
Myoida Myidae Mya arenaria 0 0 0 0 0 0 0 30 0 0 300 66
Nuculoida Nuculanidae Nucula proxima 0 0 0 0 0 0 15 0 0 0 0 3
Yoldia --- 0 0 0 0 0 0 0 10 0 0 0 2
Yoldia limatula 0 100 120 0 0 44 0 0 0 0 0 0
Veneroida Mactridae Mulinia lateralis 525 300 880 740 30 495 1,079 170 270 1,500 0 604
Tellinidae --- --- 0 100 0 0 0 20 0 0 30 0 0 6
Gastropoda Archaeogastropoda Naticidae Euspira heros 0 0 0 0 0 0 0 0 0 0 10 2
Cephalaspidea Acteonidae Rictaxis punctostriatus 0 0 40 20 10 14 105 10 0 0 0 23
Scaphandridae Acteocina canaliculata 13 800 180 50 10 211 75 10 170 160 10 85
Neogastropoda Nassariidae Nassarius obsoletus 25 0 0 0 0 5 0 0 0 0 0 0
trivittatus 13 200 0 0 0 43 0 300 0 0 10 62
Benthic Macroinvertebrate Density (organisms/m²) 988 10,200 1,820 1,030 410 2,890 1,499 750 550 1,880 520 1,040
Taxa Richness 12 9 9 9 15 11 11 15 7 10 11 11
Contract Areas: S-AK-2 and S-AK-3
Benthic Recovery Report 24 NY & NJ Harbor Deepening Project
Table 5. Taxa richness and density by station and average density by Contract Area (organisms/m2) from samples
collected in Arthur Kill Channel in Contract Areas S-AK-2 and S-AK-3 during 2005 and May 2016.
NO. % NO. % NO. % NO. % NO. % NO. %
7B 9 69% 3 23% 1 8% 1,020 87% 130 11% 20 2%
7C 8 67% 2 17% 2 17% 1,170 87% 130 10% 40 3%
8B 10 59% 4 29% 2 12% 3,220 82% 690 18% 30 1%
8C 3 50% 2 33% 1 17% 630 44% 790 55% 10 1%
All Reaches 12 60% 5 25% 3 15% 1,510 77% 435 22% 30 1%
SAK2-1 6 50% 1 8% 5 42% 375 38% 13 1% 600 61%
SAK2-2 3 33% 1 11% 5 56% 8,600 84% 100 1% 1,500 15%
SAK2-3 3 33% 1 11% 5 56% 500 27% 60 3% 1,260 69%
SAK2-4 4 44% 2 22% 3 33% 190 18% 30 3% 810 79%
SAK2-5 7 47% 5 33% 3 20% 140 34% 220 54% 50 12%
SAK2 10 40% 7 28% 8 32% 1,961 68% 85 3% 844 29%
SAK3-1 5 45% 2 18% 4 36% 120 8% 105 7% 1,274 85%
SAK3-2 6 40% 2 13% 7 47% 190 25% 20 3% 540 72%
SAK3-3 4 57% 0 0% 3 43% 80 15% 0 0% 470 85%
SAK3-4 6 60% 1 10% 3 30% 180 10% 20 1% 1,680 89%
SAK3-5 5 45% 1 9% 5 45% 120 23% 10 2% 390 75%
SAK3 13 48% 4 15% 10 37% 138 13% 31 3% 871 84%
Annelida Arthropoda Molluska
Density (organisms/m²)
Annelida Arthropoda MolluskaSample Name
Taxa RichnessContract
Area
Sampling
Year
S-AK-2
2016
S-AK-2
S-AK-3
2005
Contract Areas: S-AK-2 and S-AK-3
Benthic Recovery Report 25 NY & NJ Harbor Deepening Project
Table 6. Benthic community taxa richness, density (organisms/m2), Diversity (H'), Evenness (J'), and relative pollution
sensitivity from samples collected in NY/NJ Harbor Navigation Channels from the Arthur Kill Channel in Contract
Areas S-AK-2 and S-AK-3 during 2005 and May 2016.
Contract
Area
Sampling
YearSample Name
Taxa
Richness
Density
(organisms/m²)Diversity (H') Evenness (J')
Percent of Pollution
Tolerant Taxa (%)
Percent of Pollution
Sensitive Taxa (%)
7B 14 3,050 1.32 0.50 19% 0%
7C 13 9,100 0.49 0.19 12% 0%
8B 17 5,360 1.91 0.67 9% 0.2%
8C 7 4,770 0.99 0.51 19% 0%
All Stations 21 5,570 1.41 0.46 15% 0.05%
SAK2-1 12 988 1.39 0.56 53% 3%
SAK2-2 9 10,200 0.77 0.35 85% 8%
SAK2-3 9 1,820 1.67 0.76 48% 10%
SAK2-4 9 1,030 1.07 0.49 73% 5%
SAK2-5 15 410 2.18 0.80 17% 7%
SAK2 25 2,890 0.98 0.30 55% 6%
SAK3-1 11 1,499 1.17 0.49 74% 6%
SAK3-2 15 750 1.86 0.69 23% 3%
SAK3-3 7 550 1.33 0.69 49% 33%
SAK3-4 10 1,880 0.88 0.38 80% 9%
SAK3-5 11 520 1.56 0.65 4% 8%
SAK3 27 1,040 1.47 0.46 46% 12%
2016
2005S-AK-2
S-AK-2
S-AK-3
Contract Areas: S-AK-2 and S-AK-3
Benthic Recovery Report 26 NY & NJ Harbor Deepening Project
Table 7. Sediment type observed during collection of samples from NY/NJ Harbor Navigation Channel, 2016.
Contract Area Sampling
Year Sampling Name Sediment Type
S-AK-2 2005
7B Muddy sand
7C Muddy sand
8B Sand and gravel with some mud
8C Sandy gravel
S-AK-2
2016
SAK2-1 Silt
SAK2-2 Silt and clay
SAK2-3 Silt
SAK2-4 Silt
SAK2-5 Silt, clay, and sand
S-AK-3
SAK3-1 Silt
SAK3-2 Leaves and silt
SAK3-3 Silt with a little clay
SAK3-4 Silt and some clay
SAK3-5 Silt and clay with coarser sand
Contract Areas: S-AK-2 and S-AK-3
Benthic Recovery Report 27 NY & NJ Harbor Deepening Project
Figure 1. HDP Contract Area S-AK-2 2016 Benthic Recovery Sampling Locations.
Contract Areas: S-AK-2 and S-AK-3
Benthic Recovery Report 28 NY & NJ Harbor Deepening Project
Figure 2. HDP Contract Area S-AK-3 2016 Benthic Recovery Sampling Locations.
Contract Areas: S-AK-2 and S-AK-3
Benthic Recovery Report 29 NY & NJ Harbor Deepening Project
Figure 3. Benthic Macroinvertebrate Density (± 1 SE) by Contract Area and Sampling Year.
0
1000
2000
3000
4000
5000
6000
7000
8000D
ensi
ty (
org
an
ism
s/m
²)
Contract Area and Sampling Year
S-AK-2, 2005 S-AK-2 2016 S-AK-3 2016

Contract Areas: S-AK-2 and S-AK-3
Benthic Recovery Report 30 NY & NJ Harbor Deepening Project
Figure 4. Benthic Macroinvertebrate Diversity by Contract Area and Sampling year.
0
0.2
0.4
0.6
0.8
1
1.2
1.4
1.6
S-AK-2, 2005 S-AK-2, 2016 S-AK-3, 2016
Div
ersi
ty (
H')
Contract Area and Sampling Year

Contract Areas: S-AK-2 and S-AK-3
Benthic Recovery Report 31 NY & NJ Harbor Deepening Project
Figure 5. Benthic Macroinvertebrate Evenness by Contract Area and Sampling Year.
0
0.05
0.1
0.15
0.2
0.25
0.3
0.35
0.4
0.45
0.5
S-AK-2, 2005 S-AK-2, 2016 S-AK-3, 2016
Even
nes
s (J
')
Contract Area and Sampling Year
Contract Areas: S-AK-2 and S-AK-3
Benthic Recovery Report 32 NY & NJ Harbor Deepening Project
Figure 6. Percent Pollution Tolerant Species by Contract Area and Sampling Year.
0%
10%
20%
30%
40%
50%
60%
S-AK-2, 2005 S-AK-2, 2016 S-AK-3, 2016
Per
cen
t P
oll
uti
on
Tole
ran
t
Contract Area and Sampling Year
Contract Areas: S-AK-2 and S-AK-3
Benthic Recovery Report 33 NY & NJ Harbor Deepening Project
Figure 7. Percent Pollution Sensitive Species by Contract Area and Sampling Year.
0%
2%
4%
6%
8%
10%
12%
14%
S-AK-2, 2005 S-AK-2, 2016 S-AK-3, 2016
Per
cen
t P
oll
uti
on
Sen
siti
ve
Contract Area and Sampling Year