benefits of in-vehicle consolidation in less than truckload freight transportation operations
TRANSCRIPT

Transportation Research Part E 60 (2013) 113–125
Contents lists available at SciVerse ScienceDirect
Transportation Research Part E
journal homepage: www.elsevier .com/locate / t re
Benefits of in-vehicle consolidation in less than truckloadfreight transportation operations q
1366-5545/$ - see front matter � 2013 Elsevier Ltd. All rights reserved.http://dx.doi.org/10.1016/j.tre.2013.05.007
q This paper was presented at the 20th International Symposium on Transportation & Traffic Theory. It therefore also appears in the complete proof the 20th ISTTT in [Procedia - Social and Behavioral Sciences, Vol 80 (2013), pp. 576–590.⇑ Corresponding author. Tel.: +1 765 494 2296; fax: +1 765 494 0395.
E-mail addresses: [email protected] (R. Mesa-Arango), [email protected] (S.V. Ukkusuri).
Rodrigo Mesa-Arango, Satish V. Ukkusuri ⇑Purdue University, 550 Stadium Mall Drive, West Lafayette, IN 47907, USA
a r t i c l e i n f o a b s t r a c t
Keywords:Combinatorial auctionsTruckingLess-Than-TruckloadLogisticsBranch-and-priceConsolidationVehicle routing problemMulti-commodity one-to-one pickup-and-delivery
Researchers and public agencies have proposed consolidation policies as an alternative toincrease truck payload utilization and mitigate externalities produced by freight transpor-tation. Understanding and enhancing the economic mechanisms that lead to freight con-solidation can ease the implementation of these strategies, increase profits for shippersand carriers, and reduce freight-related negative externalities. An important mechanismthat has recently been studied for cost reduction in the freight industry is combinatorialauctions. In these auctions, a shipper invites a set of carriers to submit bids for freight lanecontracts. Carriers can bid for individual lanes or bundles of them according to their oper-ational characteristics. These bids are constructed considering direct shipments (Truckloadoperations) and several biding advisory models have been proposed for this purpose. How-ever, there are economies of scale that can be achieved if shipments are consolidated insidevehicles, which have not been explored in the construction of competitive bids. This paperinvestigates such benefits and provides insights on the competitiveness and challengesassociated to the development of consolidated bids (suitable for Less-Than-Truckload oper-ations). Consolidated bids are constructed using a multi-commodity one-to-one pickup-and-delivery vehicle routing problem that is solved using a branch-and-price algorithm.The numerical experiment shows that non-consolidated bids are dominated by consoli-dated bids, which implies that this type of operation can increase the likelihood of a carrierto win auctioned lanes, while increasing its profits margins over truckload companies(non-consolidated bids), and keeping the reported benefits that combinatorial auctionsrepresent for shippers.
� 2013 Elsevier Ltd. All rights reserved.
1. Introduction
Freight transportation is an important economic indicator of a nation. In 2010, the demand of transportation relatedgoods and services represent 9.1% ($1,316 billion dollars) of the United States (US) Gross Domestic Product (GDP)($14,499 billion dollars). In the same year, for-hire transportation services represent 2.8% of the US GDP ($402.5 billion dol-lars), where trucking contributed to 28.8%, followed by air transportation 15.7%, and rail 8.0%, i.e. $116, $63.3, and $14.7 bil-lion dollars respectively (USDOT, 2012). Despite the economic importance of trucking operations, there are severalexternalities associated to trucking, e.g., congestion, pollution, noise and accidents. One strategy to mitigate these external-ities is to utilize unused capacity inside the trucks (EC-DGET, 2006; OECD, 2003; Sathaye, 2006; TFL, 2007). Understanding
ceedings

114 R. Mesa-Arango, S.V. Ukkusuri / Transportation Research Part E 60 (2013) 113–125
and promoting economic mechanisms that improve truck utilization while enhancing shippers and carriers profits can accel-erate the acceptance and implementation of such strategies.
An evolving market mechanism used to assign freight contracts to carriers is combinatorial auctions, which has showncosts savings for both shippers and carriers. These auctions have been successfully implemented by several firms, e.g., HomeDepot Inc., Wal-Mart Stores Inc., Compaq Computer Corporation, Staples Inc., The Limited, K-Mart Corporation, Ford MotorCompany, Reynolds Metal Company, Sears Logistics Services, among others (De Vries and Vohra, 2003; Elmaghraby andKeskinocak, 2004; Moore et al., 1991; Porter et al., 2002; Sheffi, 2004).
A freight transportation combinatorial auction is a reverse auction, i.e., auctioneers are buyers and bidders are sellers.Thus, a shipper auctions freight lanes, i.e., shipments to be transported between geographically distributed origins and des-tinations, and a group of carriers bid for them. The main characteristic of a combinatorial auction is that, rather than biddingfor individual lanes, carriers can bid for bundles of lanes. This is attractive to the shippers because the price of a shipmentserved as part of a bundle is usually lower than or equal to the price of serving it individually. Once all the bids are collected,the shipper solves the Winner Determination Problem (WDP) to match lanes with the most appropriate carriers. Extensiveresearch has been conducted to formulate and solve the WDP in combinatorial auctions (Abrache et al., 2007; Caplice andSheffi, 2006; Ma et al., 2010; Sandholm, 2002). On the other hand, carriers are responsible for building and submitting bidsthat are attractive to the shipper. Competitive prices are usually achieved when the quoted lanes are complementary to theroutes operated by the carrier. Previous researchers propose bidding advisory models to solve this problem (Chang, 2009;Lee et al., 2007; Song and Regan, 2003, 2005; Wang and Xia, 2005).
Defining appropriate routes is important for the carriers to distribute the variable cost among their clients, achieving dif-ferent levels of economy, and quoting competitive shipping prices. To understand how this has been done previously, webriefly review the microeconomic operation of trucking firms. The total income perceived by a carrier is the sum of the pricescharged to each shipment transported in a time period. Likewise, the total cost is the summation of costs associated with thedelivering routes plus fixed costs. The total profit is defined by the difference between these two. For example, for a carrierserving the shipment h charged with a price ph following the route rh, the total profit associated with this shipment isP(h) = ph � c(rh) � co, where c(rh) is the total cost related to the operation of route rh, and co are fixed costs. To observehow route definition affects the value of the prices, assume that there is another shipper that needs transportation for a ship-ment k and requests a quote from the carrier. If the carrier decides to charge a price pk for that shipment, the correspondingtotal profit would be P(h, k) = ph + pk � c(rh[k) � c0, where rh[k is the route serving both shipments h and k. For a rational car-rier it is expected that PðhÞ 6 Pðh; kÞ, and therefore, cðrh[kÞ � cðrhÞ � pk � p̂k, where p̂k is an upper bound determining themaximum price that the shipper is willing to pay for this service. Notice that if the carrier can serve both shipments follow-ing the same route, then c(rh[k) = c(rh) + Dc where Dc is a small cost increment and, therefore, Dc 6 pk 6 p̂k. Furthermore, pk
might be reduced down to Dc without affecting the carrier profits. But, if the new shipper accepts to pay a price pk > Dc thatwould imply more profits for the carrier. This shows that bidding for lanes complementary to the routes currently operatedby the carrier has the potential of reducing the prices charged to these lanes and increasing the probability of getting thecontracts. The variable costs for these routes depend on operational characteristics of the carrier, e.g., the number of vehiclesoperated, total distance traveled, repositioning of vehicles, geographical location of the pickups and deliveries, current com-mitments, location of the depot, among others. Considering all these elements in the construction of a bid is not easy andpotentially leads to suboptimal solutions.
The complexity of building competitive bids has been studied by several researchers. In their seminal works, Song andRegan (2003, 2005), investigate the benefits perceived by carriers that participate in combinatorial auctions. They concludethat these auctions are more beneficial than simple sequential sealed-bid auctions and present methods for bid valuationand bid construction that require the solution of a NP-hard problem. The models presented by Song and Regan assume thatthe carrier has availability of vehicles at each node in the network, unlimited vehicle capacity and Truckload (TL) operation.In this context, Wang and Xia (2005) clarify the bidder’s optimality criterion and present heuristic methodologies to solvethis problem. They consider a central depot, which relaxes one of the previous assumptions. Additionally, Lee et al.(2007) approach this problem based on a vehicle routing methodology. Their formulation constructs routes by optimallytrading off repositioning costs of vehicles and the rewards associated with servicing lanes. Likewise, this formulation relaxessome of the previous assumptions and is solved using a suitable methodology based on column generation. Once again, theirformulation is only appropriate for carriers with TL operations. Finally, Chang (2009) develops a bidding advisory model forTL carriers using a minimum cost network flow problem.
Previous biding advisory models focus primarily on carriers with TL operations, where shipments are sent directly fromorigin to destination using an exclusive truck -similar to the use of taxis by passengers. This type of operation is mainly dri-ven by economies of scope. These economies are achieved when there are follow-up loads that reduce the number of emptytrips in a given trip chain/route (Caplice, 1996; Jara-Diaz, 1981, 1983). This concept is illustrated with the following casebased on the previous example, as well as the directed network and demand scenarios shown in Fig. 1 (i, ii, and iii). Withoutloss of generality, let us assume unitary traversing costs cij for each link (i, j) in the network. For a TL carrier in Scenario (i)(Fig. 1), the route rðiÞh involves picking up the shipment h at node 1, traveling to node 2, delivering at node 3 and returningempty to node 1 via node 4, i.e., trip chain rðiÞh ¼ fð1;2Þ; ð2;3Þ; ð3;4Þ; ð4;5Þg, and total cost cðrðiÞh Þ ¼ 4 units (notice that thesuperscript in parenthesis indicates the referred scenario). In scenario (ii), the TL carrier has to pick up k at node 2 and deliverit at node 4. This implies a new trip chain rðiiÞh[k ¼ fð1;2Þ; ð2;3Þ; ð3;2Þ; ð2;4Þ; ð4;1Þg with total cost cðrðiiÞh[kÞ ¼ 5 units. Thus, theprice charged to the new shipment pðiiÞk has to be defined in the range ½DcðiiÞ; p̂k�, where DcðiiÞ ¼ cðrðiiÞh[kÞ � cðrðiÞk Þ ¼ 1, i.e.,

Fig. 1. Economies of scope achieved by truckload (TL) firms.
R. Mesa-Arango, S.V. Ukkusuri / Transportation Research Part E 60 (2013) 113–125 115
pðiiÞk 2 ½1; p̂k�. Finally, in scenario (iii) the TL carrier has to pick up shipment k at node 3 and deliver in node 1, which corre-spond to the same trip chain presented in scenario (i), i.e., rðiiiÞh[k ¼ rðiÞk . Thus, cðrðiiiÞh[kÞ � cðrðiÞk Þ ¼ 4 and economies of scope areachieved by guaranteeing loaded follow up trips that decrease the lower bound of pðiiiÞk to Dc(iii) � 0, i.e., pðiiiÞk 2 ð0; P̂k�. By con-trasting scenarios (ii) and (iii) it can be concluded that under a fixed price pk ¼ pðiiÞk ¼ pðiiiÞk , the profits for scenario (iii) aregreater than those for scenario (ii), and, therefore, a carrier would be able to submit more competitive prices in a combina-torial auction for the bundle in scenario (iii). Notice that the equality cðrðiiiÞh[kÞ ¼ cðrðiÞk Þ does not strictly hold because there is asmall additional cost related to uploading/downloading k and a marginal fuel consumption increment due to the changefrom empty to loaded trips, however these two values are assumed to be very similar.
The bidding advisory models developed in previous research are not clearly applicable by companies that followLess-Than-Truckload (LTL) operations. In these operations, shipments are consolidated – similarly to the use of buses bypassengers – in order to achieve economies of scale and density in addition to the economies of scope (Caplice, 1996;Jara-Diaz 1981, 1983). According to Caplice (1996) there are three types of consolidation: at the origin, i.e. waiting for anappropriate size to be shipped; inside vehicles, i.e. sharing transportation with shipments from other origins; and/or in ter-minals, e.g. hub-and-spoke operations. The economies of consolidation are illustrated with a follow up of the previous exam-ple. Assume that shipments h and k are suitable for consolidation in the truck operated by an LTL carrier. Thus, the demandconsidered in scenario (ii) can be served by the same route for scenarios (i) and (iii), i.e., picking up the shipment h at node 1,picking up shipment k at node 2, traveling to node 3 with h and k in the same truck, delivering h at node 3, thenzdelivering k at node 4, and finally returning empty to node 1, i.e., rLTLðiiÞ
h[k ¼ rðiiiÞh[k ¼ rðiÞh ¼ fð1;2Þ; ð2;3Þ; ð3;4Þ; ð4;5Þg,cðrLTLðiiÞ
h[k Þ ¼ cðrðiiiÞh[kÞ ¼ cðrðiÞk Þ ¼ 4 units, and, therefore, pLTLðiiÞk 2 ð0; p̂kÞ. Notice that from an economic perspective the LTL strategy
dominates the TL strategy because the LTL carrier can always bid for k at lower prices than the TL carrier. At equilibrium theLTL carrier would obtain the demand k at a price pLTLðiiÞ
k ¼ 1� Dp, where Dp is a small quantity close to zero. Notice that inscenario (iii) it is not possible to consolidate k and h. Therefore, both TL and LTL strategies have the same probability of beenawarded to serve shipment k.
However, TL operations are more flexible than LTL because they can easily adapt to changing demand. This is because LTLoperations require a set of consolidation facilities where shipments are sorted, transferred to larger vehicles, and sent toother facilities to repeat this process or to be prepared for final delivery. Nevertheless, in-vehicle consolidation can be seenas a hybrid approach that integrates the flexibility and economies of scope of TL operations with the economies of scale ofLTL operations.
The objective of this paper is to quantify the benefits to carriers of in-vehicle consolidation in the bidding constructionprocess in a freight transportation combinatorial auction. The focus is not on the design of the auction per se but in demon-strating that in-vehicle consolidation in LTL framework can offer substantial gains to carriers. A multi-commodity one-to-one pickup-and-delivery vehicle routing problem (m-PDVRP) is used to determine partitions of the network (bundles) thatminimize operational costs. Minimizing costs is important because a bundle with a fixed price can be served by differentcombinations of trucks/routes but only the one with minimum cost maximizes the profits of the carrier. Similarly, if severalcarriers bid for the same bundle but have different operational costs, the one with lower costs can always price lower obtain-ing profits that are greater than or equal to those perceived by the others. Consequently, low costs propitiate low priceswhich increases the probability of wining lanes that are part of a bundle and do not deteriorate profits when competingagainst other carriers that have higher costs. The m-PDVRP formulation explicitly incorporates the following carrier charac-teristics: a single depot where all routes start and end, a fleet of vehicles with specific capacity, and a consolidation policywhere a single vehicle can carry shipments from different origin–destination OD pairs. In addition to the economies of scope

116 R. Mesa-Arango, S.V. Ukkusuri / Transportation Research Part E 60 (2013) 113–125
considered in previous research, this formulation takes advantages of economies of density and scale to identify low costroutes. The m-PDVRP is a mixed-integer program (MIP) where binary variables determine the assignment of vehicles to roadsegments in the transportation network and continuous decision variables determine the amount of freight inside a vehicleat each segment of the network. Since using commercial software to solve this NP-hard problem is not practical – real worldapplications involve 1800 lanes on average (Caplice and Sheffi, 2006) – a solution algorithm based on the branch-and-pricemethodology (Barnhart et al., 1998; Desaulniers et al., 1998) is proposed. The theoretical framework is problem specific,which means that no standard software exists to implement it. To the best of our knowledge, this is the first attempt toincorporate LTL features in the assessment of bids in combinatorial auctions for freight transportation. Then, a numericalexperiment is conducted to contrast consolidated bids against non-consolidated bids. The results show that, from the pureeconomic perspective, consolidated (LTL) bids are more profitable and have higher probability of being selected than non-consolidated (TL) bids.
This paper is organized as follows: Section 1 presents the problem motivation and a review of previous work. Section 2presents the problem definition, mathematical notation, and the MIP formulation. Section 3 presents the branch-and-pricesolution algorithm. Section 4 presents examples and computational experiments from the proposed methodology. Finally,Section 5 presents conclusions and future research directions.
2. Problem notation, definition, and formulation
This section presents the mathematical formulation to identify the most valuable set of lanes (bundle) that can be sub-mitted by a carrier in the freight market assuming that in-vehicle consolidation (LTL carrier) is allowed. Each auctioned lanepresents the amount of demand that goes from a specific origin to a specific destination. Likewise, the set of lanes can bepartitioned into subsets, where each of them is served by a truck and represents a bundle that can be submitted to the com-binatorial auction. Thus, the maximum number of partitions corresponds to the maximum number of trucks available by thecarrier. This idea for bundle definition is akin to the bidding advisory model proposed by Lee et al. (2007), where a vehiclerouting problem is used to determine optimal routes serving direct shipments (TL operation) and each route determines thelanes covered by a bundle. Furthermore, the problem approached in this paper corresponds to a multi-commodity one-to-one pickup-and-delivery vehicle routing problem (m-PDVHR), which has not been widely studied in previous literature.Although the formulation below is similar to the one presented by Hernández-Pérez and Salazar-González (2009) for themulti-commodity one-to-one traveling salesman problem (m-PDTSP), it considers multiple vehicles (a distinctive differencebetween the TSP and the VRP). To the best of our knowledge the only previous work related to m-PDVHR correspond to theone by Psaraftis (2011), who uses dynamic programming to solve the problem but presents results that are limited to net-works with low number of nodes (up to 4) and vehicles (up to 2). On the other hand, several works have been presented forLTL network design and vehicle routing (Andersem et al., 2011; Baykasoglu and Kaplanoglu, 2011; Crainic et al., 2009; Smilo-witz et al., 2003). However; these works are based on the consolidation and coordination of shipments through facilities(hubs and spokes) that are strategically located in the transportation network, which is a rigid assumption that is associatedto high investments in infrastructure, and do not consider the flexibility of in-vehicle consolidation for combinatorial auc-tions discussed in Section 1. The mathematical notation followed throughout the paper is presented in Table 1. Subsequentsubsections present a clear definition of the problem, modeling assumptions, and problem formulation.
2.1. Problem definition
In this problem, given a geographic area divided into regions connected by transportation infrastructures, a shipper plac-ing a combinatorial auction to assign a set of lanes over carriers that serve this area, and a carrier participating in the auction
Table 1Mathematical notation.
Notation Definition
G = (N, A) Transportation network (complete directed graph)N Set of all nodes in the transportation network. N = N0 [ {0}. Where 0 identifies the depotN0 Subset of nodes where loads have to be picked up or delivered. N0 � NA Set of all directed arcs in the transportation network. A = {(i, j):i e N, j e N}aijt Binary coefficient equal to one if arc (i, j) e A is covered by the deployment t e T or zero otherwisecij Traversing cost of arc (i, j) e Act Cost associated with the deployment of trucks t e Tprs Amount of freight to be moved in the auctioned lane (r, s) = {(r, s) e A:r e N0 , s e N0}V Fleet of vehicles initially located at the depot (node {0})Q Capacity or maximum utilization of the vehiclest A deployment of trucks covering all nodes in the network. t e TT Set of all deployments of trucksM Any subset of nodes not containing the depot M � N0
xvij Binary variable equal to one if arc (i, j) e A is traversed by vehicle v e V, zero otherwise
lrs;vij
Amount of freight picked up in r e N0 to be delivered in s e N0 traversing arc (i, j) e A inside vehicle v e V
kt Convexity variable associated with the deployment of trucks t e T
R. Mesa-Arango, S.V. Ukkusuri / Transportation Research Part E 60 (2013) 113–125 117
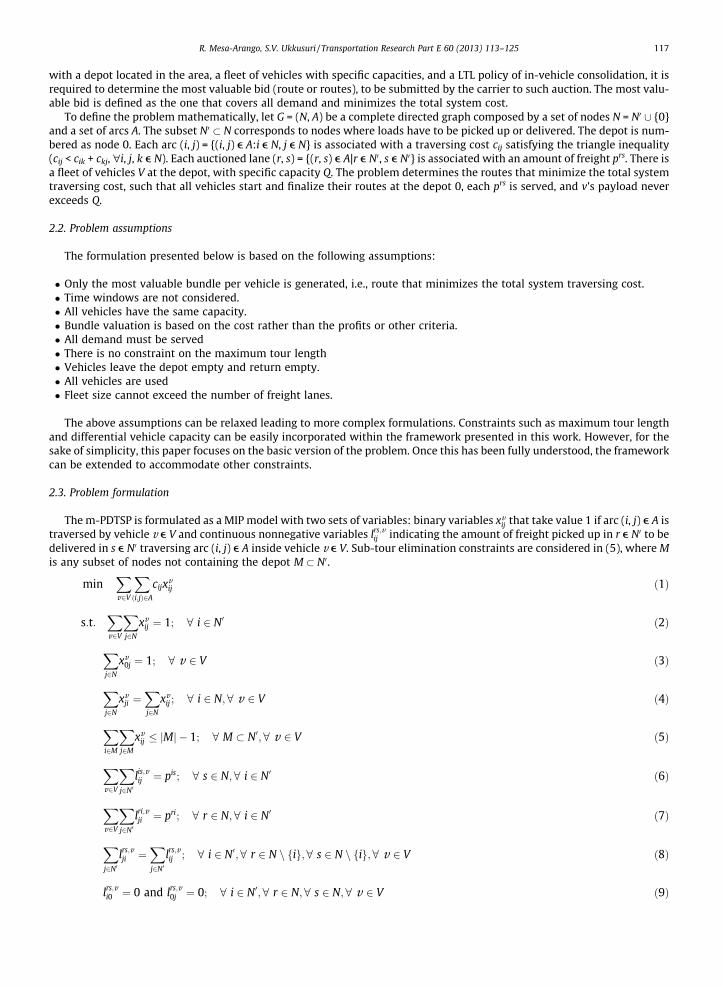
with a depot located in the area, a fleet of vehicles with specific capacities, and a LTL policy of in-vehicle consolidation, it isrequired to determine the most valuable bid (route or routes), to be submitted by the carrier to such auction. The most valu-able bid is defined as the one that covers all demand and minimizes the total system cost.
To define the problem mathematically, let G = (N, A) be a complete directed graph composed by a set of nodes N = N0 [ {0}and a set of arcs A. The subset N0 � N corresponds to nodes where loads have to be picked up or delivered. The depot is num-bered as node 0. Each arc (i, j) = {(i, j) e A:i e N, j e N} is associated with a traversing cost cij satisfying the triangle inequality(cij < cik + ckj, "i, j, k e N). Each auctioned lane (r, s) = {(r, s) e A|r e N0, s e N0} is associated with an amount of freight prs. There isa fleet of vehicles V at the depot, with specific capacity Q. The problem determines the routes that minimize the total systemtraversing cost, such that all vehicles start and finalize their routes at the depot 0, each prs is served, and v’s payload neverexceeds Q.
2.2. Problem assumptions
The formulation presented below is based on the following assumptions:
� Only the most valuable bundle per vehicle is generated, i.e., route that minimizes the total system traversing cost.� Time windows are not considered.� All vehicles have the same capacity.� Bundle valuation is based on the cost rather than the profits or other criteria.� All demand must be served� There is no constraint on the maximum tour length� Vehicles leave the depot empty and return empty.� All vehicles are used� Fleet size cannot exceed the number of freight lanes.
The above assumptions can be relaxed leading to more complex formulations. Constraints such as maximum tour lengthand differential vehicle capacity can be easily incorporated within the framework presented in this work. However, for thesake of simplicity, this paper focuses on the basic version of the problem. Once this has been fully understood, the frameworkcan be extended to accommodate other constraints.
2.3. Problem formulation
The m-PDTSP is formulated as a MIP model with two sets of variables: binary variables xvij that take value 1 if arc (i, j) e A is
traversed by vehicle v e V and continuous nonnegative variables lrs;vij indicating the amount of freight picked up in r e N0 to be
delivered in s e N0 traversing arc (i, j) e A inside vehicle v e V. Sub-tour elimination constraints are considered in (5), where Mis any subset of nodes not containing the depot M � N0.
minX
v2V
X
ði;jÞ2A
cijxvij ð1Þ
s:t:X
v2V
X
j2N
xvij ¼ 1; 8 i 2 N0 ð2Þ
X
j2N
xv0j ¼ 1; 8 v 2 V ð3Þ
X
j2N
xvji ¼
X
j2N
xvij ; 8 i 2 N;8 v 2 V ð4Þ
X
i2M
X
j2M
xvij � jMj � 1; 8 M � N0;8 v 2 V ð5Þ
X
v2V
X
j2N0lis;vij ¼ pis; 8 s 2 N;8 i 2 N0 ð6Þ
X
v2V
X
j2N0lri;vji ¼ pri; 8 r 2 N;8 i 2 N0 ð7Þ
X
j2N0lrs;vji ¼
X
j2N0lrs;vij ; 8 i 2 N0;8 r 2 N n fig;8 s 2 N n fig;8 v 2 V ð8Þ
lrs;vi0 ¼ 0 and lrs;v
0j ¼ 0; 8 i 2 N0;8 r 2 N;8 s 2 N;8 v 2 V ð9Þ

118 R. Mesa-Arango, S.V. Ukkusuri / Transportation Research Part E 60 (2013) 113–125
X
r2N
X
s2N
lrs;vij � Qxv
ij ; 8 i 2 N0;8 j 2 N0;8 v 2 V ð10Þ
xvij 2 f1;0g; 8 i 2 N;8 j 2 N;8 v 2 V ð11Þ
lrs;vij P 0; 8 i 2 N;8 j 2 N;8 r 2 N;8 s 2 N;8 v 2 V ð12Þ
In this formulation, the objective function (1) minimizes the total system traversing cost. Constraint (2) specifies that eachnode must be visited by one vehicle. Constraint (3) ensures that all vehicles are used. Constraint (4) defines the vehicle flowconservation at each node and constraint (5) relates to the sub-tour elimination, which increases the number of constraintsexponentially with respect to the number of nodes. The demand satisfaction constraints are given by (6) for pickups and (7)for deliveries. Constraint (8) determines the payload flow conservation. Constraint (9) specifies that vehicles leave the depotempty and return empty. Constraint (10) indicates that loads can be transported only on traversed links and its total amountcannot exceed the vehicle capacity. Constraint (11) is for binary variables and (12) for non-negative continuous variables.
The following section presents a solution algorithm that follows the branch-and-price methodology. This algorithm isproposed since it is difficult to solve the above formulation using standard MIP solvers.
3. Solution methodology
This section presents a branch-and-price (B&P) solution algorithm (Barnhart et al., 1998; Desaulniers et al., 1998) devel-oped to solve the MIP presented before. This methodology improves the computational time and can handle larger instancesof the problem than those handled by commercial solvers. B&P is the integration of Dantzig-Wolfe decomposition and col-umn generation into a branch-and-bound (B&B) algorithm. The three modules that integrate the B&P algorithm, i.e., B&B,Master Problem (MP), and Sub-Problem (Sub-P), are presented in the corresponding subsections below. Finally, the integra-tion of these modules in the B&P framework is presented at the end of the section.
3.1. Branch-and-bound (B&B)
In general, B&B is a built-in procedure used to solve integer programs (IPs) and MIPs by commercial software. This algo-rithm constructs a tree of feasible solutions while searching for an optimal integer solution.
In the B&B algorithm, a search tree is built based on the solution of sequential linear programs (LPs), a relaxation of theoriginal IP problem, where each node represents one of these solutions. To accelerate the process, nodes can be terminated,or fathomed, if the node solution is: greater than the incumbent solution (in the case of a minimization problem), infeasible,or lesser than the incumbent solution and integer. In the latter case the node solution updates the incumbent solution. Ifnone of these cases hold, i.e., the solution of the LP at the node is lesser than the incumbent solution but not integer, anon-integer variable (or set of variables) is selected and branched, i.e., two new branches are added to the current nodewhere each branch corresponds to an integer constraint of the branched variable (or set of variables). For example, if aftersolving the LP relaxation of a problem it turns out that the optimal solution is lesser than the incumbent solution and thereexists a variable x = a such that a is a non-integer number, two new instances (branches) of the LP are generated, i.e. onewhere the constraint x ¼ bac is added to the LP and another where x ¼ dae is added. bac and dae are the nearest lowerand higher integers to a respectively. There are different searching strategies to find an optimal solution (e.g., depth-first-, or breath-first-search).
The special characteristic that differentiates B&B from B&P is that a column generation procedure based on Dantzin-Wolfedecomposition Desrosiers and Lübbecke (2005) is implemented at each node of the tree rather than solving the LP relaxationof the original problem. In order to apply these concepts, the original MIP has to be decomposed into a Master Problem and aSub-Problem.
3.2. Master Problem (MP)
This section presents the Master Problem (MP) used in the B&P algorithm. The MP is the LP solved at each node of the B&Btree embedded in the B&P algorithm.
Since the original problem is a MIP, it is expressed as a LP using Dantzig-Wolfe decomposition which allows the represen-tation of integer variables, as convex combinations of extreme points of this space. Applying these concepts in the MIP (1)–(12) implies the identification of a common solution space that defines the corresponding convexity variables. It is observedthat constraints (2)–(5), and (11) split the set of nodes without the depot N0 in |V| subsets. The arcs in each of these subsets arethose covered by a Hamiltonian cycle connected to the depot. Examples of these covers are presented in Fig. 3. Each combi-nation of cycles is called a deployment of trucks and identified with the sub index t e T, where T is the set of all truck deploy-ments in a network G(N, A) (see Fig. 2). Therefore, the variables representing whether a link is selected or not xij are expressedas convex combination of these deployments through convexity variables kt , i.e., xij ¼
Ptaijtkt :
Ptkt ¼ 1; kt P 0, where aijt is a
binary coefficient equal to one if arc (i, j) e A is covered by the deployment t e T or zero otherwise. The resulting MP is pre-sented below.

Fig. 2. Examples of deployments of trucks t for one (|V| = 1), two (|V| = 2), and three (|V| = 3) trucks in a network with four nodes.
R. Mesa-Arango, S.V. Ukkusuri / Transportation Research Part E 60 (2013) 113–125 119
minX
t2T
ctkt ð13Þ
s:t:X
v2V
X
j2N0lri;vji ¼ pri; 8 r 2 N;8 i 2 N0 ð14Þ
X
v2V
X
j2N0lis;vij ¼ pis; 8 s 2 N;8 i 2 N0 ð15Þ
X
j2N0lrs;vji ¼
X
j2N0lrs;vij ; 8 i 2 N0;8 r;8 s 2 N n fig;8 v 2 V ð16Þ
lrs;vi0 ¼ 0 and lrs;v
0j ¼ 0; 8 i 2 N0;8 r 2 N;8 s 2 N;8 v 2 V ð17Þ
QX
t2T
aijtkt PX
r2N
X
s2N
lrs;vij ; 8 i 2 N0;8 j 2 N0;8 v 2 V ð18Þ
X
t2T
kt ¼ 1; ð19Þ
lrs;vij P 0; 8 i 2 N;8 j 2 N;8 r 2 N;8 s 2 N;8 v 2 V ð20Þ
kt P 0; 8 t 2 T ð21Þ
In this program the variables are lrs;vij and kt . The first one is defined as in MIP (1)–(12). The second one, kt , is a continuous
non-negative variable associated with each deployment of trucks t as previously defined. Constraints (14)–(17) and (20)have the same meaning as in MIP (1)–(12). Constraint (18) relates to the deployments of trucks with the flow of commoditieson each truck. Constraints (19) and (21) are the convexity constraints required to use convex combinations to obtain each xij.
Notice that the MP presented above is a LP. However, generating the complete set of deployments T is not practical.Therefore, column generation is used to work with a restricted number of variables. Hence, rather that working with thecomplete MP a restricted MP (RMP) is used. Variables (or columns) are generated iteratively by a Sub-Problem (Sub-P)and controlled by reduced cost of the RMP. The exact procedure is presented in the following subsection.
3.3. Sub-Problem (Sub-P)
As presented above, the use of all the variables in the MP is avoided by using a restricted Master Problem. Variables asso-ciated with columns of this LP are generated as needed through column generation. In column generation, the RMP is solvedwith an initial set of variable that might include costly dummy columns. Then, the reduced cost �c associated with this solu-tion is checked. If there exists a column such that �c < 0, this column is added to the RMP, which is solved again. Otherwise,the solution of the RMP is equivalent to the solution of the MP. Recall that this is valid only for the MP that is a linear relax-ation of the original problem and not a solution of the original MIP. Notice that the reduced cost of the MP is given by

Fig. 3. Branch-and-price (B&P) framework.
120 R. Mesa-Arango, S.V. Ukkusuri / Transportation Research Part E 60 (2013) 113–125
�c ¼X
v2V
X
ði;jÞ2A
xvijðcij � pijÞ � p0 ð22Þ
where pij are the dual variable associated with the set of constraints (18) –each of them associated with an arc (i, j) e A – andp0 is the dual variable associated with the convexity constraint (19). Hence, a negative value of �c can be found minimizingthe following IP.
minX
v2V
X
ði;jÞ2A
xvijðcij � pijÞ � p0 ð23Þ
s:t:X
v2V
X
j2N
xvij ¼ 1; 8 i 2 N0 ð24Þ
X
j2N
xv0j ¼ 1; 8 v 2 V ð25Þ
X
j2N
xvji ¼
X
j2N
xvij ; 8 i 2 N;8 v 2 V ð26Þ
X
i2M
X
j2M
xvij � jMj � 1; 8 M � N0;8 v 2 V ð27Þ
xvij 2 f1;0g; 8 i 2 N;8 j 2 N;8 v 2 V ð28Þ
IP (23)–(28) is a vehicle routing problem (VRP), which is notoriously a NP-Hard problem. Although solving to optimality isnot critical for the size of the instances considered in this work, the amount of resources required to solve slightly larger

R. Mesa-Arango, S.V. Ukkusuri / Transportation Research Part E 60 (2013) 113–125 121
instances is cumbersome. Therefore, the development and implementation of heuristics to efficiently approximate the Sub-Pis suggested as a future improvement of the algorithm.
3.4. Branch-and-price (B&P)
A summary of the B&P algorithm is presented in Fig. 3. In this figure, first a B&B node is generated and denominated asroot of the tree. This node is initialized with an initial costly dummy variable that initializes the generation of columns. Aspresented in the previous subsections, the column generation procedure solves the RMP, constructs the reduced cost func-tion �c with the duals of the MP (pij and p0), and solves the Sub-P. If there exists a deployment t e T such that the minimum of�c, �c�, is lesser than zero, then this deployment is added to the pool of columns and the previous RMP is modified to considerthe new generated column, with its corresponding costs and scope, and the RMP is solved again. The procedure continuesuntil a reduced cost that is greater than or equal to zero is found. Once the column generation procedure stops in a B&B nodethe solution is analyzed. If it is not possible to find a feasible solution for that instance of the problem, then the node is ter-minated. If the node solution is greater than the incumbent solution, the node is terminated. If the node solution is lesserthan the incumbent solution and integer the node is terminated but the incumbent solution is replaced by this one. Finally,if the node solution does not hold any of these conditions, the node is branched and two new instances of the RMP are gen-erated as two new nodes in the B&B tree. In one node, one arc or deployment variable is set to zero. In the other one, thesame variable is set equal to one. Then the column generation is solved in each of these nodes again and the algorithm con-tinues checking whether these nodes are terminated or branched. The algorithm stops when there are no more nodes to ter-minate or branch and the optimal solution is returned.
3.5. Acceleration strategies
Originally a depth-first search is implemented to explore solutions in the B&B tree. However, the computational timewith this procedure is high because finding an initial incumbent solution (feasible and integer), that represents an upperbound to the optimal solution, takes a reasonable amount of time. Then, fathoming other nodes to increase the lower boundbefore finding the optimal solution consumes the remaining time.
To save time in the initial search Strategy 1 is proposed. Here, the algorithm is initialized with two initial solutions: thecostly initial solution used before k0, and an initial feasible solution to the problem k1 associated to a feasible deploymentt = 1 e T. This deployment is found connecting the depot with any node that is a demand origin, then connecting to its cor-responding destination, then connecting to another origin not previously selected, and so on. Once all demand is covered, thedeployment returns to the depot. This procedure is easily extended to multiple vehicles. After column generation in the rootB&B node, if this node is branched, the search proceeds to a branch associated to a link covered by t = 1 e T. Then, if the nextB&B node is also branched, the search continues to a branch associated to a link covered by t = 1 e T, and so on up to findingk1 ¼ 1. After this, the depth first search continues normally.
Although Strategy 1 accelerates solution times, there are middle and large size instances in which computational timeincreases considerably and one wants to obtain the current solution and evaluate the optimality gap. However, the proce-dure so far rarely increases the lower bound of the solution at early stages of the algorithm. Therefore, the optimality gap isnot small which is undesirable. Thus, Strategy 2 is proposed to mitigate this issue. Strategy 2 is run after k1 ¼ 1 is found (fromStrategy 1). Then, the node with lowest current solution is selected and fathomed. This procedure continues up to finding theoptimal solution.
The numerical experiments shown in the next section demonstrate the acceleration properties of these strategies. In es-sence, Strategy 1 reduces computational times as compared to the deep-first search, and results from Strategy 2 are some-times faster than those obtained merely from Strategy 1.
4. Numerical results
This section presents numerical results for the formulation defined above. Fig. 4 presents a description of the numericalexample. Since a complete network is considered, traversing arcs are not drawn. On the other hand, the arrows connectingnodes represent the auctioned lanes associated to each scenario, three in total. Each of them is associated with an amount offreight (20 or 10 units). Likewise, the depot is labeled as 0 according to the notation above. Scenario 1 presents 2 auctionedlanes, i.e., a network with 5 nodes. Scenario 2 presents 3 auctioned lanes, i.e., a network with 7 nodes. Finally, Scenario 3presents 4 auctioned lanes, i.e., a network with 9 nodes. The matrix in Fig. 4. presents the traversing cost between nodes.Each scenario is tested with a number of trucks lesser than or equal to the number of auctioned lanes. Likewise, three dif-ferent values are considered for the capacity of the trucks, i.e., 20, 40, and, 50.
The B&P algorithm is coded in Java. Several classes are created to set up the problem, manipulate the deployments in thetransportation network, build the B&B tree with its corresponding nodes, and transfer information between the MP andthe Sub-P. Likewise, ILOG CPLEX is called from the Java code to solve the LP associated with the MP and the IP associatedwith the Sub-P. An initial expensive solution k0 is used to initialize the algorithm, where t = 0 is a dummy deploymentvisiting all the arcs.

Fig. 4. Numerical Example.
122 R. Mesa-Arango, S.V. Ukkusuri / Transportation Research Part E 60 (2013) 113–125
Table 2 presents the numerical results for this example. Looking at deployment costs, it is observed that the total systemcost increases when more trucks are deployed and when the capacity of these trucks is low. This supports in-vehicle con-solidation as a cost reduction strategy where the assets of the carriers (trucks) are used efficiently. However, it should benoticed that this conclusion is valid only in contexts where dynamic features are not considered, e.g., time dependent de-mand, time windows, and deadlines, which will be discussed in the following section.
From the algorithmic efficiency perspective, computational time increases with the number of nodes in the network asexpected. Additionally, by comparing instances with high and low truck capacities it is observed that the former tend to re-quire higher computational effort than the second one. This is expected because high capacities are related to more consol-idation options that have to be systematically fathomed in the B&B tree. Likewise, it shows how incorporating consolidationis computationally more challenging than considering just TL operations. On the other hand, it is observed that Strategies 1and 2 accelerate the algorithm as compared to a merely deep-first search strategy. For this particular example it is observedthat Strategy 1 is slightly faster than Strategy 2. However, the value of Strategy 2 is higher in large instances where no optimalsolution can be reached but a good approximation with low optimality gap is acceptable.
The competitiveness of consolidated (LTL) bids over the non-consolidated (TL) ones is illustrated with an extension of Sce-nario 3 (Fig. 4), where the same number of bundles is obtained considering TL operations. A simple way to model TL behaviorin the current framework is setting each demand lane equal to the capacity of the truck. Thus, the results of running thisscenario using Strategy 2 are presented in Table 3.
Next, the optimal bundles obtained for the LTL carrier in Scenario 3 (Fig. 4) are compared to those that would be submit-ted if TL operation is assumed instead. Likewise, the optimal bundles obtained for TL operation are re-estimated consideringin-vehicle consolidation (LTL). The results of this experiment are presented in Table 4, where the first column indicates thetype of operation for which the bundle in the second column is optimal. The following columns indicate for each type ofoperation the optimal deployment to serve the demand in the bundle, its total cost, and cost per lane. It is observed thatthe total cost and cost per lane for the LTL operation are always less than or equal to the corresponding costs for the TL car-rier. Thus, LTL carriers considering in-vehicle consolidation can submit bundles with prices slightly lower to the operationalcosts of TL carriers – which increases their probability of winning the auctioned lanes – and perceive considerable profits.These profits are computed in the last column of Table 4. Notice that the difference is more pronounced when fewer vehiclesare used. This is because as the number of vehicles serving the whole network increases there are less possibilities of con-solidation and, therefore, the LTL operation is very similar to the TL one (When the number of trucks equals the number oflanes, costs for TL and LTL are equal). This trend also occurs when the capacity of the vehicles is low, as observed for severalinstances in Table 2 where the capacity of the trucks is reduced to 20 units and the resulting deployment follow a TL-type ofoperation (direct shipments).
In summary, the numerical examples show that – under the conditions assumed for the problem above – the bids sub-mitted by a LTL carrier that considers in-vehicle consolidation can be priced below or at the same price of bundles submit-ted by TL carriers. Interestingly, LTL carriers can perceive considerable profits when several shipments are consolidated infew trucks while TL carries would be bidding at a breakeven point, where operational cost equals price. Furthermore, theshipper conducting the auction can reduce its procurement expenditure by receiving consolidated bids with more favor-able prices.

Table 2Numerical results LTL bids.
|N| |V| Q Min. cost Deployment Bundles Time (s) Gap (%)
Deep-first search Strategy 1 Strategy 2
5 1 50 13 0-1-2-3-4-0 {(1,3), (2,4)} 0.203 0.171 0.313 0.05 1 40 13 0-1-2-3-4-0 {(1,3), (2,4)} 0.188 0.188 0.406 0.05 1 20 21 0-1-3-2-4-0 {(1,3), (2,4)} 1.640 0.734 0.531 0.05 2 50 30 0-1-3-0-2-4-0 {(1,3)}, {(2,4)} 1.063 1.125 0.265 0.05 2 40 30 0-1-3-0-2-4-0 {(1,3)}, {(2,4)} 1.094 1.078 0.203 0.05 2 20 30 0-1-3-0-2-4-0 {(1,3)}, {(2,4)} 0.891 0.672 0.235 0.07 1 50 11 0-5-1-2-6-3-4-0 {(1,3), (2,4), (5,6)} 0.359 0.234 0.281 0.07 1 40 15 0-5-1-6-2-3-4-0 {(1,3), (2,4), (5,6)} 2.609 8.062 1.718 0.07 1 20 31 0-5-6-1-3-2-4-0 {(1,3), (2,4), (5,6)} 1.937 4.688 5.859 0.07 2 50 28 0-2-4-0-5-1-6-3-0 {(2,4)}, {(1,3), (5,6)} 23.124 13.469 4.390 0.07 2 40 28 0-2-4-0-5-1-6-3-0 {(2,4)}, {(1,3), (5,6)} 16.734 16.109 4.781 0.07 2 20 32 0-1-3-0-5-6-2-4-0 {(1,3)}, {(2,4), (5,6)} 7.390 7.109 6.000 0.07 3 50 45 0-1-3-0-2-4-0-5-6-0 {(1,3)}, {(2,4)}, {(5,6)} 15.344 3.985 1.812 0.07 3 40 45 0-1-3-0-2-4-0-5-6-0 {(1,3)}, {(2,4)}, {(5,6)} 14.203 13.406 1.813 0.07 3 20 45 0-1-3-0-2-4-0-5-6-0 {(1,3)}, {(2,4)}, {(5,6)} 5.484 3.719 1.125 0.09 1 50 13 0-5-1-7-6-2-3-8-4-0 {(1,3), (2,4), (5,6), (7,8)} 19.203 37.265 12.188 0.09 1 40 13 0-5-1-7-6-2-3-8-4-0 {(1,3), (2,4), (5,6), (7,8)} 7.094 53.656 10.531 0.09 1 20 31 0-5-6-7-1-8-3-2-4-0 {(1,3), (2,4), (5,6), (7,8)} 53.312 103.359 55.406 0.09 2 50 26 0-2-4-0-5-1-7-6-3-8-0 {(2,4)}, {(1,3), (5,6), (7,8)} 574.012 219.905 113.172 0.09 2 40 26 0-2-4-0-5-1-7-6-3-8-0 {(2,4)}, {(1,3), (5,6), (7,8)} 383.779 214.186 174.281 0.09 2 20 30 0-1-7-3-8-0-5-6-2-4-0 {(1,3), (7,8)}, {(5,6), (2,4)} 5.812 36.406 130.657 0.09 3 50 43 0-2-4-0-5-1-6-3-0-7-8-0 {(2,4)}, {(1,3), (5,6)}, {(7,8)} 2148.677 254.654 397.782 0.09 3 40 43 0-2-4-0-5-1-6-3-0-7-8-0 {(2,4)}, {(1,3), (5,6)}, {(7,8)} 1267.945 270.67 413.016 0.09 3 20 43 0-1-7-3-8-0-2-4-0-5-6-0 {(2,4)}, {(1,3), (7,8)}, {(5,6)} 205.436 91.984 138.625 0.09 4 50 60 0-1-3-0-2-4-0-5-6-0-7-8-0 {(1,3)}, {(2,4)}, {(5,6)}, {(7,8)} 692.870 91.375 58.084 0.09 4 40 60 0-1-3-0-2-4-0-5-6-0-7-8-0 {(1,3)}, {(2,4)}, {(5,6)}, {(7,8)} 503.496 101.702 77.581 0.09 4 20 60 0-1-3-0-2-4-0-5-6-0-7-8-0 {(1,3)}, {(2,4)}, {(5,6)}, {(7,8)} 260.092 59.71 39.563 0.0
Table 3Numerical results TL bids (Scenario 3).
|N| |V| Min. cost Deployment Bundles Time (s) Gap (%)
9 1 43 0-1-3-2-4-5-6-7-8-0 {(1,3), (2,4), (5,6), (7,8)} 14.000 0.009 2 42 0-1-3-2-4-0-5-6-7-8-0 {(1,3), (2,4)}, {(5,6), (7,8)} 25.266 0.009 3 47 0-1-3-0-5-6-2-4-0-7-8-0 {(1,3)}, {(2,4), (5,6)}, {(7,8)} 113.172 0.009 4 60 0-1-3-0-2-4-0-5-6-0-7-8-0 {(1,3)}, {(2,4)}, {(5,6)}, {(7,8)} 78.188 0.00
Table 4Comparison between LTL and TL bundles.
Opt.for
Bundle No.lanes
LTL operation TL operation LTL minmargin
Deployment Totalcost
Cost perlane
Deployment Totalcost
Cost perlane
LTL {(1,3), (5,6), (7,8)} 3 0-5-1-7-6-3-8-0 11.00 3.67 0-5-6-1-3-7-8-0 35.00 11.67 24.01LTL {(1,3), (5,6)} 2 0-5-1-6-3-0 13.00 6.50 0-5-6-1-3-0 25.00 12.50 12TL {(1,3), (2,4)} 2 0-1-2-3-4-0 13.00 6.50 0-1-3-2-4-0 21.00 10.50 8TL {(5,6), (7,8)} 2 0-5-7-6-8-0 13.00 6.50 0-5-6-7-8-0 21.00 10.50 8TL {(5,6), (2,4)} 2 0-5-2-6-4-0 13.00 6.50 0-5-6-2-4-0 17.00 8.50 4TL/LTL {(1,3), (2,4), (5,6), (7,8)} 4 0-5-1-7-6-2-3-
8-4-013.00 3.25 0-1-3-2-4-5-6-
7-8-043.00 10.75 30
TL/LTL {(1,3)} 1 0-1-3-0 15.00 15.00 0-1-3-0 15.00 15.00 0TL/LTL {(2,4)} 1 0-2-4-0 15.00 15.00 0-2-4-0 15.00 15.00 0TL/LTL {(5,6)} 1 0-5-6-0 15.00 15.00 0-5-6-0 15.00 15.00 0TL/LTL {(7,8)} 1 0-7-8-0 15.00 15.00 0-7-8-0 15.00 15.00 0
R. Mesa-Arango, S.V. Ukkusuri / Transportation Research Part E 60 (2013) 113–125 123
The following section summarizes the findings of this research, discusses about its limitations, and provides interestingresearch directions to be approached in posterior works.

124 R. Mesa-Arango, S.V. Ukkusuri / Transportation Research Part E 60 (2013) 113–125
5. Conclusions
This paper contributes to literature by quantifying for the first time the benefits of considering in-vehicle consolidation –a behavior suitable for LTL firms – in the construction of bids that can be submitted to a combinatorial auction for the pro-curement of freight transportation services. This strategy is compared with the TL bids (direct shipments) which has beenthe only strategy considered by carriers participating in these auctions (De Vries and Vohra, 2003; Elmaghraby and Keski-nocak, 2004; Moore et al., 1991; Porter et al., 2002; Sheffi, 2004) and past research on bidding advisory models (Chang,2009; Lee et al., 2007; Song and Regan, 2003, 2005; Wang and Xia, 2005). Thus, an m-PDVRP model is presented to findthe combination of bundles that minimizes the system cost associated to a deployment of vehicles in the network auctionedby the shipper and a branch-and-price algorithm is presented to find optimal solutions to the problem. The numerical resultsshow that consolidated (LTL) bids dominate the non-consolidated (TL) ones.
Specifically, it is shown that the cost of serving a bundle with in-vehicle consolidation is always less than or equal to thecost of serving it with direct shipments. Thus, LTL carriers can submit bids with prices that are less than or equal to the costsof TL carriers for the same bundles and getting profits while TL carriers could just reach the breakeven point. This charac-teristic is better appreciated in bundles where several lanes are consolidated in one truck, which can be done using largetrucks with consolidation capabilities, e.g., STAA double trailers, rocky mountain doubles, turnpike doubles, and triple trail-ers. On the other hand, shippers can benefits from this behavior by receiving low price bids that can potentially reduce theirprocurement costs.
It is important to highlight that the strategy considered in this paper only covers in-vehicle consolidation, which does notapply for typical LTL firms where shipments are consolidated in facilities that are strategically located over the transporta-tion network, e.g., terminals, or hubs. Hence, this strategy is closer to a hybrid approach that incorporates the flexibility andeconomies of scope of TL shipments with the economies of scale and density encouraged by in-vehicle consolidation. Differ-entiating these two types of consolidation is important because LTL shipments that are consolidated in facilities are associ-ated with high transportation times, which is not beneficial for shippers/commodities with high value of time, and is themain reason to prefer TL shipments. However this hybrid approach does not require consolidation and sorting in facilitiessince shipments are directly consolidated inside vehicles, e.g., plugging additional trailers, or adding containers. Althoughserving several shipments with one truck represents higher delivery times than direct shipments, these times are not as highas a pure LTL approaches with consolidation in facilities. Nevertheless, additional research is required to understand howincreased travel times and low prices affect the procurement decision of the shipper. This can be approached using econo-metric techniques, e.g., discrete choice models, to obtain marginal rates of substitution between price and time that can beincorporated in the construction of optimal bids.
Similar to traveling time, there are other non-monetary attributes that the shippers consider when assigning contracts tocarriers, e.g., balancing demand among carriers, the financial and claim history of the carriers, carrier coverage, type of vehi-cles, fleet size, previous contract with the shipper, among other (Caplice and Sheffi, 2003; Elmaghraby and Keskinocak, 2004;Moore et al., 1991). Furthermore, the development of discrete choice models to understand the characteristics determiningcarrier selection and the monetary valuation that shipper assign to attributes other than cost would be valuable in the devel-opment of segmented pricing policies to be considered in the bid construction process. Nevertheless, the current analysis isan initial benchmarking point demonstrating the potential benefits of consolidated bids.
On the other hand, finding optimal bundles solving the m-PDVRP to optimality might be computationally expensive andimpractical for real-world large instances. Therefore the initial algorithm proposed in this paper can be accelerated in futureresearch. An initial direction for this acceleration is exploring parallel computing (Bader et al., 2004; Melab et al., 2012)where different segments of the B&B tree are handled by independent processors. Likewise, parallel computing can be com-plemented with the development of hybrid-metaheuristics that approximate good solution at reasonable computationaltimes by searching optimal solutions in the B&B tree using metaheuristic search, e.g., tabu search (Hung and Chen, 2011).
Additionally, the methods considered so far are based on fixed (deterministic) demand, which is not a reasonable assump-tion considering the high level of uncertainty that exists with freight demand (Caplice and Sheffi, 2006). Thus, more robustm-PDVRP models have to incorporate stochastic demand.
Furthermore, the development of these extensions, i.e., multi-criteria utility functions, and efficient m-PDVRP algorithmsincorporating stochastic demand, are important steps to develop a robust bidding advisory algorithm, that first optimizes thebundles that are more attractive for carriers, next testes them with optimal bundles estimated from known information ofthe competitors, and then assigns prices such that profits are maximized, prices are competitive with respect to the betteroutcome of competitors and cannibalization is avoided, i.e., prices for low-profit bundles do not compete against prices forhigh-profit bundles proposed by the same carrier, which harms the global profits of the firm.
Finally, the impact of favoring larger trucks should be analyzed from a macroscopic perspective in order to determinewhat are the (positive/negative) externalities and network effects associated to a high penetration of in-vehicle consolida-tion strategies in the freight transportation market. Preliminary, authors consider that a high rate of consolidation wouldimply positive externalities in the transportation network. It is expected that consolidation would reduce the number oftruck-miles because vehicles will be efficiently used and, hence, this would reduce a number of other externalities suchas emissions, traffic congestion, accidents, and pavement deterioration. However, this has to be validated with appropriateperformance measures, models and data.

R. Mesa-Arango, S.V. Ukkusuri / Transportation Research Part E 60 (2013) 113–125 125
References
Abrache, J., Crainic, T.G., Gendreau, M., Rekik, M., 2007. Combinatorial auctions. Annals of Operations Research 153 (1), 131–164.Andersem, J., Christiansen, M., Crainic, G.T., Grønhaug, R., 2011. Branch and price for service network design with asset management constraints.
Transportation Science 45 (1), 33–49.Bader, D.A., Hart, W.E., Philips, C.A., 2004. Parallel algorithm design for branch and bound. In: Greenberg, H.J. (Ed.), Tutorials on Emerging Methodologies
and Applications in Operations Research. Kluwer Academic Press, pp. 1–44 (Chapter 5).Barnhart, C., Johnson, E.L., Nemhauser, G.L., Savelsbergh, M.W.P., Vance, P.H., 1998. Branch-and-price: column generation for solving huge integer programs.
Operations Research 46 (3), 316–329.Baykasoglu, A., Kaplanoglu, V., 2011. A multi-agent approach to load consolidation in transportation. Advances in Engineering Software 42, 477–490.Caplice, C., 1996. An Optimization based Bidding Process: A New Framework for Shipper–Carrier Relationship. Ph.D. Dissertation. Massachusetts Institute of
Technology. Cambridge, MA.Caplice, C., Sheffi, Y., 2003. Optimization based procurement for transportation services. Journal of Business Logistics 24 (2), 109–128.Caplice, C., Sheffi, Y., 2006. Combinatorial auctions for truckload transportation. In: Cramton, P. et al. (Eds.), Combinatorial Auctions. The MIT Press, Boston.Chang, T.S., 2009. Decision support for truckload carriers in one-shot combinatorial auctions. Transportation Research Part B: Methodological 43 (10), 914–
933.Crainic, T.G., Ricciardi, N., Storchi, G., 2009. Models for evaluating and planning city logistics systems. Transportation Science 43 (4), 432–454.De Vries, S., Vohra, R.V., 2003. Combinatorial auctions: a survey. INFORMS Journal of Computing 15 (3), 284–309.Desaulniers, G., Desrosiers, J., Ioachim, I., Solomon, M.M., Soumis, F., Villeneuve, D., 1998. A unified framework for deterministic time constrained vehicle
routing and crew scheduling problems. In: Crainic, T.G., Laporte, G. (Eds.), Fleet Management and Logistics. Kluwer, Boston, pp. 57–93.Desrosiers, J., Lübbecke, M.E., 2005. A primer in column generation. In: Desaulniers, G., Desroriers, J., Solomon, M. (Eds.), Column generation. Springer
Science + Business Media, New York (Chapter 1).EC-DGET, 2006. European Commission, Directorate-General for Energy and Transport. Urban Freight Transport and Logistics. European Communities.
<http://www.transport-research.info/Upload/Documents/200608/20060831_105348_30339_Urban_freight.pdf> (accessed 10.08.12).Elmaghraby, W., Keskinocak, P., 2004. Combinatorial auctions in procurement. In: Harrison, T.P., Lee, H.L., Neale, J.J. (Eds.), The Practice of Supply Chain
Management: Where Theory and Application Converge. International Series in Operations Research & Management Science 62(3), 245–258. Springer,US.
Hernández-Pérez, H., Salazar-González, J.J., 2009. The multi-commodity one-to-one pickup-and-delivery traveling salesman problem. European Journal ofOperational Research 196, 987–995.
Hung, Y.F., Chen, W.C., 2011. A heterogeneous cooperative parallel search of branch-and-bound method and tabu search algorithm. Journal of GlobalOptimization 51 (1), 133–148.
Jara-Diaz, S.R., 1981. Transportation Cost Functions: A Multiproducts Approach. Ph.D. Dissertation. Massachusetts Institute of Technology, Cambridge, MA.Jara-Diaz, S.R., 1983. Freight transportation multioutput analysis. Transportation Research Part A 17 (6), 429–438.Lee, C.G., Kwon, R.H., Ma, Z., 2007. A carrier’s optimal bid generation problem in combinatorial auctions for transportation procurement. Transportation
Research Part E: Logistics and Transportation Review 43 (2), 173–191.Ma, Z., Kwon, R.H., Lee, C., 2010. A stochastic programming winner determination model for truckload procurement under shipment uncertainty.
Transportation Research Part E: Logistics and Transportation Review 46 (1), 49–60.Melab, N., Chakron, I., Mohand, M., Tuyttens, D., 2012. A GPU-accelerated branch-and-bound algorithm for the flow-shop scheduling problem. In: 14th IEEE
International Conference on Cluster Computing. <http://arxiv.org/abs/1208.3933> (accessed 15.02.13).Moore, E.W., Warmke, J.M., Gorban, L.R., 1991. The indispensable role of management science in centralizing freight operations at Reynolds Metals
Company. Interfaces 21 (1), 107–129.OECD, 2003. Organisation for Economic Co-Operation and Development, Delivering the Goods. 21st Century Challenges to Urban Goods Transport. <http://
www.internationaltransportforum.org/Pub/pdf/03DeliveringGoods.pdf> (accessed 10.08.12).Porter, D., Torma, D.P., Ledyard, J.O., Swanson, J.A., Olson, M., 2002. The first use of a combined-value auction for transportation services. Interfaces 32 (5), 4–
12.Psaraftis, H.N., 2011. A multi-commodity, capacitated pickup and delivery problem: the single and two-vehicle cases. European Journal of Operational
Research 215, 572–580.Sandholm, T., 2002. Algorithm for optimal winner determination in combinatorial auctions. Artificial Intelligence 135, 1–54.Sathaye, N., Li, Y., Horvath, A., Madanat, S., 2006. The Environmental Impacts of Logistics Systems and Options for Mitigation. Working Paper VWP-2006-4.
U.C. Berkeley Center for Future Urban Transport. A Volvo Center of Excellence.Sheffi, Y., 2004. Combinatorial auctions in the procurement of transportation services. Interfaces 34 (4), 245–252.Smilowitz, K.R., Atamtürk, A., Daganzo, C.F., 2003. Deferred item and vehicle routing within integrated networks. Transportation Research Part E 39, 305–
323.Song, J., Regan, A., 2003. Combinatorial auctions for transportation service procurement, the carrier perspective. Transportation Research Record: Journal of
the Transportation Research Board 1833, 40–46.Song, J., Regan, A., 2005. Approximation algorithms for the bid construction problem in combinatorial auctions for the procurement of freight transportation
contracts. Transportation Research Part B: Methodological 39 (10), 914–933.TFL, Transport for London, 2007. London Freight Plan – Sustainable Freight Distribution: A Plan for London. <http://www.tfl.gov.uk/microsites/freight/
documents/London-Freight-Plan.pdf> (accessed 10.08.12).USDOT, U.S. Department of Transportation, 2012. National Transportation Statistics. Research and Innovative Technology Administration. Bureau of
Transportation Statistics. Washington, DC. <http://www.rita.dot.gov/bts/sites/rita.dot.gov.bts/files/publications/national_transportation_statistics/index.html> (accessed 10.01.13).
Wang, X., Xia, M., 2005. Combinatorial bid generation problem for transportation service procurement. Transportation Research Record: Journal of theTransportation Research Board 1923, 189–198.