benchmarking survey report - fleet...
TRANSCRIPT

© 2017 by National Private Truck Council. All Rights Reserved. 1
Sponsored by
2017
BENCHMARKINGSURVEY REPORT

© 2017 by National Private Truck Council. All Rights Reserved. 2
N A T I O N A L P R I V A T E T R U C K C O U N C I L
GARY F. PETTY PRESIDENT AND
CHIEF EXECUTIVE OFFICER
950 N. GLEBE ROAD, SUITE 530 ARLINGTON, VIRGINIA 22203-4183
(703) 838-8876 (703) 683-1217 FAX [email protected]
August 1, 2017 Dear NPTC Members: We are pleased to issue the 2017 Benchmarking Survey Report which represents the largest and most comprehensive study of key operating metrics ever provided by Council Fleet Member companies. Working in conjunction the Benchmarking Steering Committee (see Appendix I), Benchmarking Survey Report author and general editor, Tom Moore, CTP, NPTC Senior Vice President, designed and updated the detailed 22-page survey question-naire containing more than 150 questions and related data points. This survey document was emailed to all NPTC Fleet Member companies and the survey itself conducted from February through June. Like surveys in the past, the 2017 report includes many open ended questions that encourage respondents to answer in their own words. The information contained herein represents operating data for calendar year 2016. We are pleased to report that more than 100 Fleet Member companies participated in the survey. This is the largest response rate to an NPTC benchmarking survey in the history of the Council. Thank you very much! These leading companies are representative of a broad cross-section of NPTC’s member base operating nationally or region-ally and serving a wide variety of industries and customers. As a result, the statistics, trends, and conclusions of the Bench-marking Survey Report broadly and accurately represent major performance indicators of the entire private fleet market. Please note that as a result of the quality and quantity of responses in this survey, the Council is able upon request to provide individual fleet companies with informal, more granular, “deeper-dive” comparisons of their performance in specific metrics or areas of interest against a subset of anonymous group data collected from similar or peer company operations. Contact Tom Moore for details. The NPTC Benchmarking Survey Report continues to improve each year because of critical suggestions made by member users. Please let us know your thoughts on how you successfully used the data at your company, what additional information from future surveys would be useful, and what questions you would like to see added, modified, or deleted. If you have any questions about how to use the survey, let us know as well. Kindly send your comments or questions to Tom Moore, CTP, NPTC Senior Vice President, via email at [email protected] or by phone at (703) 838-8898. Thanks again for helping make this the “biggest and best” benchmarking report in NPTC history! Sincerely,

© 2017 by National Private Truck Council. All Rights Reserved. 3
THE FUTURE – AND THE PRESENT – IS BRIGHT INDEED
Benchmarking Excellence Private Fleet Performance Continues to Advance with a Focus on Customer Service, Cost, Drivers and Safety
he 2017 Benchmarking Survey Report, released Au-gust 1, 2017, paints the picture of a private fleet community that is resilient, adaptive, flexible, and committed to delivering a valuable return on the
corporate investment for those companies operating in-house transportation. Conducted in the first four months of this year, the benchmarking survey reflects performance achieved during the calendar year of 2016. For the first time in the 12 years that NPTC has been taking the pulse of its members, the survey attracted more than 100 fleets taking the time to complete the 22-page survey ques-tionnaire that contains more than 150 questions and related data points. That is more than double the num-ber which participated in the first survey the Council conducted in 2005. The increased number is significant in its breadth and depth for several reasons. First, it demonstrates the credibility of the metrics that are being offered to de-velop a roadmap toward private fleet excellence. Sec-ondly, even when private fleets are not tracking these metrics, they inevitably place them on their dashboard and begin reporting on them in subsequent years. Final-ly, the quality and quantity of responses allows the Council to develop more granular reports – a “deeper dive” – for participating members by comparing their performance against a subset of participants that re-flects more similar or peer operations. The key takeaways from this year’s report show a pri-vate fleet community that is more professionally-trained and experienced; more efficient; and performing at a higher safety standard than in years past. In the face of a pervasive, industry-wide driver shortage, private fleets are demonstrating their commitment to the drivers (perhaps the element that distinguishes the private fleet from all other transportation sectors) by raising wages, expanding benefits, upgrading equipment, and improv-ing overall working conditions. The result is driver turn-over at a low percentage consistent with historic averages.
Additionally, despite national safety statistics trending in the wrong direction, private fleets continue to raise the bar on highway safety. This year’s benchmarking survey reported a DOT Recordable crash rate of 0.61 crashes per million miles, a drop of nearly one-third over the 0.86 crashes per million miles reported last year, and back in line with the historical norms of 0.55 and 0.59 reported in 2015 and 2014, respectively. This crash rate is roughly three times better than the indus-try average according to Federal Motor Carrier Safety Administration (FMCSA) officials, although the agency does not report an industry average crash rate for all motor carriers. This significantly higher safety performance of private fleets is driven by advances in driving hiring standards; enhanced safety protocols, and an increased adoption rate of advanced safety technologies such as collision mitigation, electronic stability control, speed monitor-ing, in-cab cameras, lane departure warning systems, disk brakes, and automatic transmissions. And despite a modest uptick in the reported empty backhaul ratio, private fleet managers are accomplish-ing their mission with a higher level of operational effi-ciency—garnering a higher share of the inbound freight flow; lowering their equipment replacement cycles, and enhancing their adoption of onboard and back office technology. All these enhancements allow the core mission of the private fleet community – providing unparalleled levels of customer service – to advance as the primary and overwhelming reason why companies choose to oper-ate a private truck fleet. Private fleet respondents de-fined that customer service with attributes such as flexibility, reliability, dependability, a desire to put com-pany employees in front of the customer, building ac-cess and security. Interestingly, several respondents took it a step further, reporting that their private fleet was viewed as a core competency – “a natural extension of our successful manufacturing facilities that ensures satisfaction with our products to our customers” – ac-cording to one respondent. But that satisfaction was echoed by several other respondents.
T

© 2017 by National Private Truck Council. All Rights Reserved. 4
On the basis of responses to the fundamental question of private fleet justification, survey results show the con-tinued ability of private fleets to deliver exceptional customer service. They do this by providing a differenti-ated value that is often tangibly rated by customers and measured by management. They expertly manage, con-trol, and flexibly deploy their capacity of their fleets at or below carrier rates. The result in the overall process is they enhance the professionalism of critical transporta-tion services provided on behalf of their companies. This year’s survey results reveal that, in addition to pre-mium customer service, today’s private fleets offer ad-vantages compared to using alternative outside transportation services which included cost perfor-mance and control over capacity. Indeed, the private fleet provided control against capacity spikes, leverage from escalating rates, guaranteed levels of committed service, and control over the supply chain. The survey shows that private fleets provided opportu-nities for cost reduction, revenue enhancement, capaci-ty control, leverage against higher rates, transportation expense control, and even a competitive cost ad-vantage. In fact, for those respondents who said cost was one of the primary reasons for their private fleet, fully three-quarters reported the private fleet provided a cost advantage over other transportation alternatives. This focus on key metrics has resulted in an expansion of the private fleet business model by every measure – shipments, volume, and value – all are higher than the previous year. Specifically, participants in this year’s sur-vey reported shipments were up in 2016 by 7.6% over the performance recorded in 2015. Volume grew by 5.9% and value was up 5.6%. These increases come in the wake of three successive periods of year-over-year performance and were accomplished with relative effi-ciency, as fleet respondents reported overall mileage up 5.1%.
Perhaps the numbers would have been better had not businesses, and the private fleets they operate, experi-enced patchy and uneven growth in 2016 while con-fronting overcapacity and lower rates. That situation started to firm up as the year came to a close, buoyed by rising consumer confidence and expectations sur-rounding the push for infrastructure investment being pushed by the Trump administration, plus continued low energy prices. As we shall see at the end of the report, private fleet professionals responding to this year’s survey remain unabashedly optimistic about the years ahead. Three out of four of the respondents report that they expect their fleet to grow (add equipment or handle more of their company’s freight) over the next five years. That compares with 66% that reported similar growth last year. In those cases, the average growth – whether measured by an increase in total equipment or in terms of handling more of their company’s freight – is esti-mated at 8.6%. Another 5% of the fleet respondents expect to stay the same size. Only 19% expect a decline in their fleet operations. The future – and the present – is bright indeed! Gary Petty President and CEO National Private Truck Council

© 2017 by National Private Truck Council. All Rights Reserved. 5
TABLE OF CONTENTS
INTRODUCTION: A Guide to Benchmarking ....................................................................................................................... 6 WHY COMPANIES OPERATE PRIVATE FLEETS ..................................................................................................................... 7 CHALLENGES ................................................................................................................................................................................ 11 PRIVATE FLEET OPERATIONS .................................................................................................................................................. 13
Outbound Freight Movements ............................................................................................................................ 13 Inbound Freight Movements ................................................................................................................................ 15 Strategies to Position the Private Fleet Effectively ....................................................................................... 16 Fleet Advertising ....................................................................................................................................................... 17
Private Fleet Demographics ................................................................................................................................................... 18 Heavy-Duty Power Units ........................................................................................................................................ 18 Leasing Trends ........................................................................................................................................................... 19 Lease Arrangements ................................................................................................................................................ 20 Lease Fleet Performance Characteristics .......................................................................................................... 21 Environmental Sustainability Strategies ........................................................................................................... 21 Trailers ........................................................................................................................................................................... 22
Improving Performance ........................................................................................................................................................... 24 Technology Trends ................................................................................................................................................... 24 Increasing Utilization by Reducing Empty Miles ........................................................................................... 26 For-Hire Authority ..................................................................................................................................................... 27 Slip Seating .................................................................................................................................................................. 28 Tracking Utilization ................................................................................................................................................... 28
Equipment and Maintenance Trends .................................................................................................................................. 29 In-House vs. Outsourced Maintenance ............................................................................................................. 29 Maintenance Effectiveness: PM Currency Rates ............................................................................................ 30 Maintenance Effectiveness: Breakdown Percentage ................................................................................... 31 Age of Heavy Duty Power Unit Population ..................................................................................................... 31
Labor Trends ................................................................................................................................................................................ 34 Driver Demographics ............................................................................................................................................... 34 Home Time .................................................................................................................................................................. 35 Team Operations ....................................................................................................................................................... 35 Union Penetration .................................................................................................................................................... 36 Driver Turnover .......................................................................................................................................................... 37 Driver Recruiting ....................................................................................................................................................... 39 Driver Compensation ............................................................................................................................................... 40 Driver Sourcing Strategies ..................................................................................................................................... 45
Cost Performance ....................................................................................................................................................................... 46 Safety Trends ................................................................................................................................................................................ 49
Active Safety Technologies ................................................................................................................................... 51 Looking Ahead ............................................................................................................................................................................ 52 About NPTC .................................................................................................................................................................................. 53 APPENDIX I: Benchmarking Steering Committee ........................................................................................................... 54

© 2017 by National Private Truck Council. All Rights Reserved. 6
Introduction: A Guide to Benchmarking Understanding the Process, Interpreting Results, and Improving Performance
he National Private Truck Council has assembled the following benchmarking report to assist private fleet managers in comparing their fleet’s performance to others with the goal of improving performance. It is
intended to help self-critique your fleet’s existing per-formance by accurately and candidly assessing “where your fleet stacks up” against relative, normative national standards and best practices. The study is intended to prioritize areas for improvement by helping you identify gaps in your performance on those standards that are important to you, your company and your customers. Not all the benchmarks apply equally to all fleets. For instance, cost-per-mile will vary widely by the length of haul and the number of stops. Just because your fleet’s cost-per-mile is higher than the average in the report does not necessarily mean it is inefficient or poorly managed. Rather, these figures are intended to high-light areas for further research and improvement. So use the figures in the report like you would a barometer – as only one of many tools to assess the “weather con-ditions” of your fleet. The next steps for any private fleet manager interested in using the benchmarking report to justify and improve their performance should be to compare themselves against the standards both in terms of best practices and results achieved. This means:
• Defining the service requirements for your fleet
• Collecting financial and operating information by type of operation (shuttle, local, regional, inter-regional, long haul)
• Benchmarking fleet performance against others within the NPTC database and selected outside companies
• Selecting and prioritizing improvement areas
The idea is to understand the performance of your pri-vate fleet and translate that into executable improve-ment strategies that will enhance the value of your fleet.
Why Benchmark? While benchmarking requires careful planning and con-sideration, it is widely recognized as a proven method to enhance operational performance for the following reasons:
• Benchmarking determines true relative perfor-mance
• Benchmarking uncovers competitive intelligence
• Benchmarking reveals best practices
• Benchmarking can be a catalyst for a strategic plan
• Benchmarking provides a game plan for establish-ing a sustainable competitive advantage
• Benchmarking leads to superior fleet performance while also increasing the fleet’s value to the or-ganization
Definition of Benchmarking Benchmarking is the process of defining and searching for best practices that will lead to superior performance and recognition as an industry leader. The primary focus of any benchmarking study should be to uncover, both internally and externally, those prac-tices that result in superior performance within a certain cost or service category. When conducting a benchmarking study specifically focused on private carriage statistics, it is important that the fleet manager spends sufficient time ensuring an apples-to-apples comparison. Cost-per-mile is often calculated differently, depending upon the fleet appli-cation and the corresponding assignment of fixed costs. More measures, such as driver pay, can have numerous variations in terms of definition (i.e., including overtime, incentive pay, safety incentive, etc.). Three key areas to consider when implementing benchmarking are: (1) setting improvement goals, (2) planning for improvements, and (3) establishing an ac-tion plan.
T

© 2017 by National Private Truck Council. All Rights Reserved. 7
WHY COMPANIES OPERATE PRIVATE FLEETS
AS IN YEARS PAST, PROVIDING UNPARALLELED LEVELS OF CUSTOMER SERVICE CONTINUES as the primary and overwhelming reason why companies choose to operate a private truck fleet. In this year’s survey, more than 90% of the respondents, in response to the open-ended question “What is the Primary Reason Your Company Operates a Private Fleet?”, answered customer service. That was defined by respondents by attributes including flexibility, reliability, de-pendability, a desire to put company employees in front of the customer, building access and security. Interestingly, sev-eral respondents took it a step further, reporting that their private fleet was viewed as a core competency – “a natural extension of our successful manufacturing facilities that ensures satisfaction with our products to our customers,” accord-ing to one respondent. That sentiment was shared by several other respondents. This year’s survey results reveal that responding companies gave reasons other than, or in addition to, unparalleled, pre-mium customer service as justification/validation for operating a private fleet, and as advantages compared to using al-ternative outside transportation services.
Responses totals were more than 100% because respondents could, and often did, provide multiple answers. Customer service, cost and capacity related issues all overlap to some degree. Those private fleets that mentioned capaci-ty explained that the private fleet provided control against capacity spikes, leverage from escalating rates, guaranteed levels of committed service and control over the supply chain.
0% 10% 20% 30% 40% 50% 60% 70% 80% 90% 100%
Cost
Marketing and Brand Awareness
Historical Commitment
Specialized Products and/or Equipment
Safety
Capacity
Customer Service
Why Do Private Fleets Exist?

© 2017 by National Private Truck Council. All Rights Reserved. 8
When you “peel the onion” on costs, you find that respondents used some of the same language. The private fleet pro-vided opportunities for cost reduction, revenue enhancement, control, leverage against higher rates, transportation ex-pense control, and even a competitive cost advantage. In fact, for those respondents who said cost was one of the primary reasons for their private fleet, fully three quarters reported the private fleet provided a cost advantage over other transportation alternatives. On the basis of responses to this fundamental question of private fleet justification, survey results show the continued ability of private fleets to deliver exceptional customer service; to provide a differentiated value which is often tangibly rated by customers and measured by management; to manage, control, and flexibly deploy capacity of their fleets at or below outside carrier rates, and to enhance overall the professionalism of critical transportation services provided on behalf of their companies. Year-Over-Year Business Performance Whatever the reason for operating a private fleet and regardless of the challenges reported in operating the private fleet, respondents in this year’s survey reported expansion of their business by every measure – shipments, volume, and value over the previous year. Specifically, participants in this year’s survey reported shipments were up in 2016 by 7.2% over the performance recorded in 2015. Volume grew by 5.9% and value was up 5.6%. This increased performance was ac-complished with relative efficiency, as fleet respondents reported overall mileage up by 5.1%.
Why? Perhaps the numbers would have been better had not businesses, and the private fleets they operate, experienced patchy and uneven growth in 2016 while confronting overcapacity and lower rates. That situation started to firm up as the year came to a close, buoyed by rising consumer confidence and expectations surrounding the push for infrastruc-ture investment being pushed by the Trump administration, plus continued low energy prices. As we shall see at the end of this report, private fleet professionals responding to this year’s survey remain unabashedly optimistic about the future as measured in both the anticipated size and scope of their private fleet.
9.1% 9.7%
9.1%
6.3% 6.6%
12.0%
18.0%
5.4%
7.2% 5.9% 5.6% 5.1%
0.0%
5.0%
10.0%
15.0%
20.0%
Shipments Volume Value Mileage
Business Peformance Year Over Year
2015 2016 2017

© 2017 by National Private Truck Council. All Rights Reserved. 9
Tracking Customer Service With customer service being named as the central private fleet value proposition, it should come as no surprise that pri-vate fleet respondents continue to broaden the number of metrics they are using to measure and improve customer ser-vice. For instance, this year fleets reported tracking dwell time (35%) and delivery accuracy (41%) – measures that were not widely monitored in previous surveys. By expanding the customer service metrics, fleet practitioners not only im-prove their performance, they also better ensure they meet and exceed the expectations under which they operate. In fact, although private fleet justification continues to remain on the list of challenges for most private fleet managers, re-spondents continue to share anecdotes of unqualified support from upper management – that the fleet had become a core pillar of the company’s value proposition. Respondents reported monitoring the following performance metrics (totals add to more than 100 because respondents were permitted to choose multiple options).
As in previous surveys, measuring on-time performance remained the primary means of tracking customer service with 77% of the respondents monitoring late deliveries and 27% measuring early deliveries. This compares to 80% and 33% respectively last year. Private fleets recognize the disruptions that both early and late deliveries can place on the opera-tion. The tremendous growth in onboard computers, detailed elsewhere in this report, provides the means to measure the timeliness of their deliveries.
0%
10%
20%
30%
40%
50%
60%
70%
80%
90%
Late Early Customer Comment
Over, short or damaged
(OSD)
Fill Rate Dwell Time Delivery Accuracy
Other
How Fleets Track Customer Service
2014 2015 2016 2017

© 2017 by National Private Truck Council. All Rights Reserved. 10
The most significant trend in how fleets track customer service continues to be the number of respondents that report tracking customer comments. Some 62% reported doing so this year as compared to 66% last year and 72% in the 2015 survey. To put this number in perspective, less than half of the fleets indicated they depend upon customer feedback and surveys to monitor their service levels just three years ago. This is a significant strategy as it turns the measurement into a direct, customer-centric metric. Interestingly, although it was too small a measure to make the chart, a couple of fleets reported that safety was becom-ing a key customer service differentiator. We’ll have to see how this plays out in future surveys. On-Time Deliveries When it comes to on-time deliveries, the time windows are impressively tight. For instance, contained within the 10-minute window were a number of respondents who indicated that they measured on-time deliveries to the minute. The importance of this metric is not to say that a 10-minute window is better than a 30-minute window or a 60-minute win-dow. The specific time window is a matter of individual corporate service and customer expectations. Rather, what is im-portant is the ability to measure, monitor and manage on-time performance through the nearly universal implementation of onboard technology. Interestingly, these time windows have remained almost unchanged over the last five years.
10 Minutes 18%
15 Minutes 17%
30 Minutes 26%
60 Minutes 27%
Other 12%
On-Time Performance Windows

© 2017 by National Private Truck Council. All Rights Reserved. 11
CHALLENGES
THE ABILITY OF TODAY’S PRIVATE FLEET TO DELIVER EXCEPTIONAL CUSTOMER SERVICE AT A COMPETITIVE COST ADVANTAGE continues to be complicated by numerous issues as detailed on the following chart, according to the pri-vate fleet respondents. The survey asked an open-ended question: to name the most pressing issues currently facing their fleets. Given the driver shortage continues to haunt the trucking industry, it should come as no surprise that driver-related is-sues were cited by more than three-quarters of all respondents, topping the list of concerns by a factor of more than 3:1 over the next closest challenge. Rounding out the top issues cited by the fleets were customer service (24%), equipment-related issues (23%), safety (22%), cost (17%), fleet justification (11%) and utilization and productivity (11%). This list is virtually unchanged from last year. Equipment issues included issues such as maintenance, cost, and reliability.
2
2
3
3
4
4
4
5
5
5
8
8
11
11
17
22
23
24
77
0 10 20 30 40 50 60 70 80 90
Finance
Operational Issues
Backhaul
Technician Availability
Traffic, Congestion and Road Issues
Fuel
Weather
Economic and Business Issues
Leadership and Management
Technology
For-Carrier Capacity (Rates and Service)
Regulations
Utilization & Productivity
Fleet Justification
Cost
Safety
Equipment
Customer Service
Driver Issues

© 2017 by National Private Truck Council. All Rights Reserved. 12
Strategies That Fleets Are Using to Enhance Value To overcome these challenges, private fleet respondents continued to take proactive steps to ensure their ability to de-liver exceptional customer service, safely, efficiently and cost-competitively. In this year’s survey, we asked the open-ended question about significant cost savings initiatives fleets had developed during the survey period. Following is a list of all the responses identified by respondents.
Notably, safety and compliance related improvements seized the top spot this year as they were cited by 25% of the re-spondents as a strategy to justify their fleet. This is on par with the responses from last year. Closely related, fleets indicated they were keen on adopting new technologies and data management as a tool to im-prove productivity. In fact, some 19% of the respondents said they had enhanced their position in that space. Rounding out the top five strategies were enhanced fuel economy (15%), utilization and network optimization (11%) and equipment and maintenance (8%).
2% 4% 4%
6% 6% 8%
11% 15%
19%
25%
0%
5%
10%
15%
20%
25%
30%
How Fleets Enhance Their Value

© 2017 by National Private Truck Council. All Rights Reserved. 13
PRIVATE FLEET OPERATIONS
Outbound Freight Movements With the vast majority of private fleet respondents focused primarily on customer service, it should come as no surprise that outbound freight movements (where control of the final transportation and distribution stages in the product or service life provides the greatest and most visible control and return on investment) still constitute the largest share of private fleet freight movements. That is driven by the fact that in-house private fleets indicate that they handle finished products with a greater degree of care, pride and attention to detail than what is available from many transportation al-ternatives. Said one private fleet manager, “Our distribution is an extension of our successful manufacturing facilities and ensures satisfaction with our products to our customers.” Treating transportation and distribution as a core competency was mentioned several times. As previously noted in this report, these outbound moves have become increasingly cost-competitive as compared to for-hire alternatives, and a competitive advantage to many of the respondents in the survey. Collectively, those outbound freight movements are divided up as follows:
Collectively, the private fleet market share of all outbound freight remained essentially unchanged in 2016, with private fleets hauling, on average 69% of the outbound movements. For the past four years it has hovered between 67% and 69%. As mentioned earlier, this is a function of spotty economic growth, overcapacity issues that helped to drive down rates. Plus it reflects an ongoing restructuring of retail sales, with the growth of e-commerce and the proliferation of mergers and consolidations. Interestingly, traditional truckload and less-than-truckload carriers increased their presence by capturing 17% of the out-bound movements compared to 9% last year. That returned that segment to the level at which it has performed for three of the last four years. Almost all of that gain can be attributed to a drop in the third party/dedicated share, which tumbled to 11% from 21%.
0%
10%
20%
30%
40%
50%
60%
70%
80%
Private Third Party For-Hire Rail
Outboard Freight Movements
2014 2015 2016 2017

© 2017 by National Private Truck Council. All Rights Reserved. 14
Digging deeper into that 69% private fleet share of the outbound movements, the survey reveals more about how pri-vate fleets are deployed:
• Direct to Retail Customer: Some 58% of all private fleet outbound volume is accounted for in service directly to the retail customer, up five points from last year’s 53%. Direct-to-customer movements accounted for 54% and 58% of all private fleet movements reported in 2015 and 2014 respectively. The average length of haul for these moves de-clined by 39 miles to 265 miles. The survey also reported an average of 5.5 stops, down slightly from the 6.6 stops re-ported last year and the 7.8 stops in the previous year. This year’s figure returns us close to the six-stop average reported in 2013.
For comparison purposes, for-hire movements in this category were 369 miles (compared to 267 miles last year) with an average of 2.3 stops (in line with the 2.1 stops reported last year). Movements handled by third party contract and/or dedicated carriers were 276 miles and 3.0 stops compared to 334 miles and 2.7 stops last year and 202 miles with 2.7 stops the previous year.
• Direct to Distribution Center: Another 26% of the private fleet outbound market share is comprised of movements directly to the distribution center. This level was down from the 34% reported last year, the 33% recorded in 2015 and the 32% level reported in 2014. The average length of haul has eased down to 325 miles from the 404 miles re-ported last year, but ahead of the 271-mile length of haul recorded in the previous year. The number of stops report-ed averaged 1.79 down slightly from the 2.1 stops reported last year and the 2.2 stops from the previous year. The number of stops, however, ran ahead of the average number of stops recorded in 2014 (1.4).
For comparison purposes, for-hire movements direct to the distribution center averaged 498 miles with an average of 1.5 stops compared to the 395 miles with an average of 2.1 stops last year and the 390 miles and 1.5 stops in 2015. Dedicated moves were 351 miles and 1.65 stops compared to last year’s performance of 437 miles and 1.75 stops and the 506 miles with 1.15 stops in 2015’s survey.
• Interplant: The remainder of the outbound moves – 16% – were interplant movements, up from the 13% levels re-ported over the last two years and the 8% share reported three years ago. In this segment, the average length of haul tallied 337 miles and 1.4 stops, almost identical to the 351 miles and 1.4 stops reported last year. This performance was up from the 198 miles and 1.04 stops reported in the 2015 survey and the 278-mile length of haul and 1.25 stops recorded in 2014. For comparison purposes, for-hire movements in this category were 430 miles and one stop com-pared to last year’s performance of 338 miles and one stop and the 324 miles with an average of one stop in 2015. Dedicated moves were 337 miles with 1.5 stops. In 2016 those numbers were 381 miles with one stop and in 2015 they were 272 miles with one stop in 2015’s survey.
Retail 58%
Distribution Center
26%
Interplant 16%
Private Fleet Outbound Freight Moves

© 2017 by National Private Truck Council. All Rights Reserved. 15
Inbound Freight Movements With private fleet professionals continuing to expand their percentage of the outbound business, they found the in-bound side of the business to offer solid growth opportunities. Private fleet respondents’ share of the inbound freight was reported at 37%, identical to the performance in the 2016 survey although it was down from the all-time high water market of 43% achieved in 2015. The for-hire share of the inbound freight was 37%, down from the 48% levels achieved last year and the 43% of the pre-vious year. The third party/dedicated share garnered 10% of the inbound freight movements, while rail was up one per-centage point to 7%. For the first time in the history of the survey, participants reported that “other” (primarily vendor supplied freight) captured 8% of all inbound moves.
The average length of haul for these inbound moves handled by the private fleet was 268 miles and 1.2 stops compared to last year’s reported averages of 313 miles with 1.4 stops. For comparison purposes, in 2015, respondents reported a 278-mile length of haul with 2 stops. For comparison purposes, the average length of haul for the for-hire carriers in-volved in these inbound movements was 454 miles with 1.3 stops compared to 597 miles with 1.2 stops reported in the previous year. The dedicated/third-party carriers recorded an inbound length of haul of 447 miles and 1.1 stops. The average private fleet operates out of numerous locations. In fact, 76% of the respondents operate multiple locations, exactly the same as reported doing so in 2016 and up slightly from the 74% and 73% that reported operating out of mul-tiple locations during 2014 and 2015. The remainder have their entire operation headquartered out of one location, or did not answer the question. Private fleets in this year’s survey were nearly evenly split on those reporting loads weighing out (45%) as opposed to those reporting cubing out (55%).
0%
10%
20%
30%
40%
50%
60%
Private Dedicated For-Hire Rail
Inbound Freight Movements
2012 2013 2014 2015 2016 2017

© 2017 by National Private Truck Council. All Rights Reserved. 16
Strategies to Position the Private Fleet Effectively With private fleet managers looking to drive their value proposition by implementing cost-effective transportation solu-tions and with continued pressure on private fleet justification, the majority of respondents in this year’s survey report benchmarking the private fleet to for-hire carriers. In fact, the number of companies that report making such compari-sons stands at 60%, up six points over last year’s 54% level. Only 23% of respondents report not benchmarking their op-eration against for-hire fleets down from the 27% that reported making such comparisons last year. Such competitive benchmarks are increasingly valuable resources not only to justify a private fleet but to identify areas for cost and service enhancements.
Some 53% of the private fleets took this comparison a step further, reporting that their fleet is used as leverage against for-hire carrier service and pricing, while 38% did not. This is in line with results from the previous five years.
Yes 60%
No 23%
Don't Know/No Answer
17%
Private Fleets That Compare Costs to For-Hire Alternatives
Yes 53% No
38%
Don't Know/No Answer
9%
Using the Private Fleet as Leverage

© 2017 by National Private Truck Council. All Rights Reserved. 17
Fleet Advertising Another highly visible, and often effective value traditionally associated with the private fleet is trailer advertising. The trailer provides companies with a “rolling billboard.” Some 74% of respondents report having graphics, up from 66% lev-els reported over the last five years. Some 19% of the respondents reported not using fleet graphics and the remainder did not respond to this question. Of the fleets that use fleet graphics, nearly all the trailers in their pool (92%) are marked. Those fleets with rolling bill-boards claim their graphics are “very effective” rating them an average of 3.8 on a 5-point scale. Funding for the artwork is split with 44% of the respondents reporting the cost is picked up by the transportation department and 44% being paid by the marketing or advertising department. In the remainder of the cases funding is split.
Yes 74%
No 19%
No Answer 7%
Majority of Fleets Make Use of Graphics

© 2017 by National Private Truck Council. All Rights Reserved. 18
PRIVATE FLEET DEMOGRAPHICS
Heavy-Duty Power Units The average fleet size in the 2017 Benchmarking Survey is 248 Class 8 heavy-duty power units, almost identical to the 244 power unit average achieved last year. This number provides a glimpse of what the typical fleet respondent looks like while helping put the other performance metrics in some context. It also points to the fact that each year, a different and varied group or fleets are participating in the survey. But, in and of itself, the changing fleet size does not carry any statis-tical significance. For instance, whether the equipment was leased or owned, the private fleet respondents reported the size of their fleet, measured in the raw number of power units, was up by 1.75% for ownership and 9.6% for leased units over the 2016 report (a year in which the size of the fleet expanded by 5%). To supplement their fleet, 27% of the respondents reported renting heavy-duty power units during 2016. That number is on par with the number of respondents reporting renting equipment in 2015. Such a strategy is generally perceived as a “trial run” precursor to validate the business needs and freight volumes before moving to equipment acquisition. In those fleet operations that reported renting, the average number of rental units was 19 units (on an annualized basis), identical to the level reported last year and down from the 37 units reported the year previously. Finally, fleet respondents report-ed that rental numbers in their fleet were up 19% over the previous year, exactly the same as last year and down from the 30% that so reported in the previous year. So not only do the rental numbers bump up the average fleet size numbers, they point to some expected heavy-duty fleet expansion and higher trucks sales and leasing numbers down the road.
Another way to look at the heavy-duty composition is to look at the median, or middle, of the heavy-duty fleet popula-tion. This year, the median fleet size declined slightly to 99 units compared to the to 110 units reported last year and the 156 units recorded last year but more in line with the 101 median recorded in 2014. The median fleet size means that half the respondents have heavy-duty fleets greater than 110 heavy duty power units, and half have fleets with less than that number.
0%
5%
10%
15%
20%
25%
30%
35%
40%
1-24 Units 25-49 Units
50-99 Units
100-249 Units
250-499 Units
500+ Units
2012
2013
2014
2015
2016
2017

© 2017 by National Private Truck Council. All Rights Reserved. 19
Leasing Trends This year, a total of 33% of the NPTC member companies responding to the survey reported leasing the majority of their equipment (90% or more), a two point gain over the 31% share reported last year. The percentage of fleets that ex-pressed a preference for leasing as an acquisition strategy is down from the 38% and 44% levels that reported leasing the majority of their equipment the previous two years. Some 38% of the respondents reported owning the majority of their heavy-duty equipment – down from the 42% level recorded last year and in line with what was reported in the previous year. The fastest-growing balance – 29% – reports a combination of ownership and leasing heavy-duty equipment acquisition strategies. This compares with the 27% of the fleets that reported the combination strategy last year and the 20% the year prior. This leasing-ownership combination is consistent with several other trends in the survey: A number of fleets have indicated they acquired other fleets through mergers and acquisitions. These other fleets may have a different acquisition strategy in place. The prevalence of larger carriers in the survey operating multiple locations allows these carriers to pick the acquisition strategy that best suits them in different areas of the country.
Digging a little deeper into the leasing numbers, as the following chart indicates, by total vehicle count, we find the fleet population moving toward parity between leasing and ownership. In fact, 46% of the Class 8 vehicle population is leased while 54% is owned. Last year, we reported that 38.5% of vehicle population was leased and 61.6% owned, similar to what was reported in 2014. The average size, measured in the number of power units, by fleets that engage in ownership as an acquisition strategy is 184, down sharply from last year’s 454 units and 352 in the previous year, while the average size of the leased vehicle fleet is 182 units compared to 162 units last year and the 191 units in the previous year.
0%
10%
20%
30%
40%
50%
60%
Lease Own Combination
Fleet Acquisition Preferences Heavy-Duty Power Units Lease vs. Own
2012 2013 2014 2015 2016 2017

© 2017 by National Private Truck Council. All Rights Reserved. 20
Lease Arrangements Looking deeper into the various types of lease arrangements, the vast majority of leases, by a factor of more than 2:1, were classified as Full Service Leases. Following is the complete breakdown (which are in line with historical averages):
0%
10%
20%
30%
40%
50%
60%
70%
80%
Leased Owned
Leasing vs. Ownership Vehicle Population
2014 2015 2016 2017
Finance 12%
TRAC 9%
Fair Market Value 17%
Operating 12%
Full Service 50%
Heavy Duty Lease Instruments

© 2017 by National Private Truck Council. All Rights Reserved. 21
Lease Fleet Performance Characteristics Looking even closer at leasing versus ownership as acquisition strategies and as discussed elsewhere in this report, sur-vey respondents indicated that leased fleets tended to trade their equipment at peppier intervals than those fleets that owned equipment. Other important distinctions include:
• Leased fleets were five times more likely to use leasing as a trailer acquisition strategy.
• As detailed elsewhere in this report, leased fleets are more prone to outsource their maintenance. For instance, of the fleets that lease their equipment, only 16% report any significant in-house maintenance spend while 84% report outsourcing the majority of their maintenance (an average of 90% of the maintenance spend).
Environmental Sustainability Strategies As in previous years, environmental sustainability efforts continued to be a priority for respondents, with 87% indicating they were involved in some sort of “green” initiative, exactly the same percentage as reported in both of the last two years. By way of comparison, merely 63% of private fleets indicated they were involved in green fleet technologies six years ago. A scant 7% of the survey respondents indicated no “greening” initiatives currently underway in their fleet, with the remainder not answering the question or saying that they did not know. In addition, 46% of the respondents that indicated they were involved with environmental issues, said they were a SmartWay partner, an 8 percentage point de-cline from last year’s survey. Typical “greening” initiatives and strategies most prominently mentioned are captured in the following chart.
Despite the speculation about natural gas engines that permeated the market several years ago, these power plants comprise less than 3% of the entire heavy-duty power unit population according to survey respondents. For the medium duty fleet population, 3% were gasoline powered and 97% were diesel powered. Cumulatively, the fuel economy for all heavy-duty units in operation averaged out to 6.62, almost identical to last year’s reported average. For medium duty units, respondents reported a fuel economy of 8.1, compared to the 8.9 mpg report-ed last year. The continued effort by fleets to develop snappier trade cycles thus infusing their fleets with more fuel effi-cient power plants units was, to some degree, offset by operational demands such as less fuel efficient regional applications with multiple stops making it difficult to achieve the full benefits of the newer engines.
0% 10% 20% 30% 40% 50% 60% 70% 80% 90%
LNG Electric
Nitrogen Trailers Hybrids
CNG Louvered Mud Flaps
Tail Kites Wheel Caps
Biodiesel Wide Base Tires
Increase Load Density Trailer Skirts
Fuel Economy Improvement Anti-Idling
Environmental Sustainability Initiatives

© 2017 by National Private Truck Council. All Rights Reserved. 22
Trailers Respondents reported operating an average of 585 trailers, down from the levels of the last three years (an average of 633 trailers in 2016, 819 in 2015 and 699 in 2014). To put that number in perspective, we measure the number of trailers per tractor. By that measure, this year’s survey produces a trailer-to-tractor ratio of 4.3 trailers for every power unit, an increase from last year’s trailer-to-tractor ratio of 2.72.
As an acquisition strategy, leasing was not quite as prevalent on the trailer side as it was on the power side. In fact, private fleet respondents in this year’s survey preferred trailer ownership by a margin of three to one. Some 58.5% of the fleets reported ownership as an acquisition strategy (owning 90% or more of the trailers) and 18% said they leased trailers (leasing 90% or more of the trailers). These were in line with last year’s results. The remaining 21.5% opted for a combina-tion of leasing and ownership. By raw trailer count, the percentage of trailers owned (80%) far outweighed the percent-age leased (20%).
Breaking the total trailer pool down by application, the average fleet operating van trailers operated an average of 662 trailers compared to the 665 in last year’s survey and the 713 in the previous year. This stacks up to an average of 2.7 van trailers per tractor as compared to the 2.3 trailer-to-tractor ratio last year and the 2.9 the previous year. The low ratios no doubt reflect improved asset utilization on the part of the private fleet professionals.
0
0.5
1
1.5
2
2.5
3
3.5
4
4.5
Van Reefer Flat Bulk
Trailer to Tractor Ratios by Operation Type
2008 2009 2010 2011 2012 2013 2014 2015 2016 2017

© 2017 by National Private Truck Council. All Rights Reserved. 23
Respondents reported they were more likely to own van trailers as to lease them (46% vs. 21%), while 33% rely on a com-bination of the two acquisition strategies. When considering the total van trailer population, the percentages increase: 90% of the total van trailer population is owned while 10% is leased. The average number of refrigerated trailers operated by the survey respondents in this year’s survey decreased to 401 from 516 last year and 750 the year before. This equates to a trailer-to-tractor ratio of 2.2:1, in line with last year’s trailer-to-tractor ratio. Some 71% of the respondents indicated a preference for ownership as an acquisition strategy (up about 10 percentage points from last year), while 11% prefer leasing and the remaining 18% share relies on a combination of both strategies. In terms of the raw reefer trailer population, the share leaned more toward an ownership proposition with 81% of the reefer population owned and 19% leased. The average number of bulk trailers is 282 almost identical to the 298 from last year. However, the trailer-to-tractor ratio remained virtually unchanged at 2:1. While 22% of the fleets expressed a preference for leasing, 53% preferred ownership and the remaining 25% relied on an acquisition strategy that included both leasing and ownership. However, the vast majority of this equipment (84%) is owned – the identical percentage as reported last year) is owned, most likely because of the specialized nature of the equipment and the prevalence of larger fleets for an ownership position. Sixteen percent of the bulk trailers in the survey are leased. For fleets operating flatbed equipment, the average number of trailers is 315, up from the levels recorded over the last three years, attributable to new, larger flatbed operations participating in the survey. This translates to a trailer-to-tractor ratio of a little better than 2.4:1. Fleet respondents split on their trailer acquisition preferences along the following lines: ownership (40%), leasing (40%); or a combination of two (20%). Some 78% of the total flatbed trailer population is owned and 22% is leased.

© 2017 by National Private Truck Council. All Rights Reserved. 24
IMPROVING PERFORMANCE
Technology Trends One effective strategy private fleets continue to employ to help improve their productivity is the deployment of on-board technology – combined with better data aggregation and analysis – to track and improve various elements of their performance. As the following chart indicates, fleets have been steadily adopting such technology and this year, fully 97% of the fleets that answered the question reported adopting the technology, while 3% did not. This is in line with the near universal penetration of on-board technology achieved in each of the last five years. To put that number in perspec-tive, in 2005, the penetration of on-board technology was reported at less than 50%. In addition to providing the tools to manage their investment, on-board technology provides the data that can lead to more effective methods to understand, communicate, and improve their value, performance and safety. The challenge – and in many cases – the frustration expressed on the part of the fleets is to detangle the massive amounts of data and convert it into actionable intelligence. For purposes of this Benchmarking Survey Report, performance comparisons between fleets using onboard technology and those that do not are rendered essentially moot because of the near ubiquitous adoption of the technology.
The impressive development in terms of on-board technology is the rapid penetration of some key safety, compliance and productivity features – most notably electronic logs, driving performance and fuel taxes (see following chart). The penetration and broad deployment of these on-board technology resources underscores the private fleet migration to a more capable and professional operation as they tailor the resources to best serve their needs.
0%
10%
20%
30%
40%
50%
60%
70%
80%
90%
100%
2005 2006 2007 2008 2009 2010 2011 2012 2013 2014 2015 2016 2017
Onboard Technology Dominates
Yes No

© 2017 by National Private Truck Council. All Rights Reserved. 25
Not surprisingly, private fleets are backing their on-board technology with technology and analytics in the back-office to optimize the investment. This year, 88% of the fleet respondents reported deploying back-office technology, in line with the 90% that indicated deploying back-office solutions over the last two years. Just three years ago that adoption rate stood at 56%. Only 5% of the population said they did not use back-office technology, while the remaining respondents did not answer the question.
0% 10% 20% 30% 40% 50% 60% 70% 80% 90% 100%
Payroll On-Time
Progressive Shifting Deliveries
Fuel Tax Speed
E-Logs Driving Performance
Fuel Economy Sudden Stops
Idle Time Maintenance
Non-Driving Performance
How Fleets Deploy On-Board Technology
Yes 88%
No 5%
No Answer 7%
Back-Office Technology Support

© 2017 by National Private Truck Council. All Rights Reserved. 26
Specific back-office technology support features deployed by the fleet respondents are captured in the following chart:
Increasing Utilization by Reducing Empty Miles This year, private fleet managers continued to focus on improving productivity by reducing the number of non-compensated empty miles. In fact, for the total fleet population, although the number of empty miles that were available for backhaul for all fleets in the survey crept up five percentage points, it still remained at an impressive 26% level – up from the 22% levels of the two years before. For comparison purposes, just six years ago, the empty backhaul percentage crested at 30%, which puts the near ubiquitous drive to improve productivity into great perspective. Most of the reason for the increase can be attributed to the fact that the headhaul private fleet business has been grow-ing impressively over the years and it’s more important to have the power units repositioned to participate in those out-bound moves than to be delayed looking for return freight.
20% 40% 60% 80% 100%
Payload Out-of-Route
On-Time Planned vs. Actual
Safety Payroll
Fuel Tax Maintenance
Routing Dispatch
Back-Office Technology Deployment
10%
15%
20%
25%
30%
35%
2005 2006 2007 2008 2009 2010 2011 2012 2013 2014 2015 2016 2017
Empty Backhaul Percentage

© 2017 by National Private Truck Council. All Rights Reserved. 27
For-Hire Authority One of the most effective strategies deployed by private fleet managers is the acquisition of for-hire authority to pursue revenue-producing freight and offset, in whole or in part, the cost of miles that would otherwise go empty. Towards that end, 66% of the respondents in the survey report having for-hire authority. This is in line with historical averages (last year’s average was 64%). This year, 28% (vs. 30% last year) of the respondents reported not having authority. The remain-ing 6% of the respondents did not answer this question.
In the overwhelming majority of the cases (90.4%), the internal company freight takes precedence over the outside freight, while 4.7% of respondents give equal priority to company freight and contracted freight. In 1.5% of the instances does the contracted freight take priority over in-house freight. The remainder is made up by respondents who did not answer the question. These results provide evidence that private fleets use for-hire authority as a supplemental strategy to fill empty backhauls – without compromising the quality of service provided to their parent company and internal cus-tomer. Of those fleets operating for-hire authority, 30% indicated maintaining an internal sales force (compared to 23% last year and 22% the year before), while 63% use brokers and 53% act as brokers (vs. 73% and 76% that reported doing so in those respective categories last year).
0%
10%
20%
30%
40%
50%
60%
70%
80%
For-Hire Authority No Authority No Answer
For-Hire Authority
2012 2013 2014 2015 2016 2017

© 2017 by National Private Truck Council. All Rights Reserved. 28
Slip Seating Another strategy many fleets have used to boost operating efficiency is the practice of slip seating (the practice of assign-ing more than one driver to a piece of equipment). After numerous years of percolating in the mid to upper 60% range, this year, the number of fleets employing this strategy dropped to 59% of the respondents. Of those employing slip seat-ing, on average 48% of their fleet operation was slip-seated, consistent with what was reported last year.
Tracking Utilization This year’s survey asked respondents how they tracked utilization. Some 71% reported that they tracked equipment miles or hours and/or driver hours (or both). The annual average for driver’s hours worked was 2,445 hours, another drop from the previous year. Last year, drivers worked an average of 2,518, which was down slightly from the 2,596 and 2,621 hours’ average reported during the previous two years.
The survey also revealed that the average hours a power unit was deployed averaged 3271 hours, which underscores the previously reported slip seating statistics.
40%
45%
50%
55%
60%
65%
70%
75%
2010 2011 2012 2013 2014 2015 2016 2017
Fleets Rely on Slip Seating To Improve Productivity
2621 2596
2518
2445
2350
2400
2450
2500
2550
2600
2650
Number of Hours the Typical Driver Works in a Year
2014 2015 2016 2017

© 2017 by National Private Truck Council. All Rights Reserved. 29
EQUIPMENT AND MAINTENANCE TRENDS
In-House vs. Outsourced Maintenance When it comes to maintaining equipment, there has been little movement in the number of fleets outsourcing mainte-nance, conducting maintenance in-house, or a combination of the two strategies. In fact, some 95% of all respondents indicate that they outsource at least a portion of their maintenance spend and only 5% indicating that they keep it all in-house. These numbers are nearly identical to last year’s results. Digging deeper, the survey reveals that 22% of the fleets report they conduct nearly all their maintenance themselves. That is, 90% or more of the routine maintenance spend (rebuilding is not included) is spent in their own shops. This number is up from the 20% that indicated a preference for in-house maintenance last year and back in line with the 22% and 21% before 2014.
Some 41% of the fleets outsource the majority of their maintenance functions, down from the 55% and the 48% that re-ported outsourcing the majority of their maintenance. The remaining 37% of fleet respondents pursue a combination of maintenance strategies, up from the 25% who reported exercising that strategy last year, but back in line with the levels (36%) reported in the previous year. Fleets that conduct the majority of maintenance in-house report that they have longer trade cycles – 6.8 years versus 5.8 years for fleets that outsource. When we probe a little deeper and look at the average mileage at which equipment is traded, we find that those fleets that conduct most maintenance in-house, trade their equipment at an average of 729,000 miles (versus 775,000 miles last year and 828,333 the previous year). Those fleets that outsource maintenance report trade cycles of 572,900 miles, down from the 637,593 miles reported last year and down from the 682,000 miles reported the year before that. Finally, those fleets relying on a combination of maintenance providers trade at 667,272 miles.
0%
10%
20%
30%
40%
50%
60%
Outsourced In-House Combination
Where is Maintenance Conducted?
2008 2009 2010 2011 2012 2013 2014 2015 2016 2017

© 2017 by National Private Truck Council. All Rights Reserved. 30
Outsourced Resources When they do outsource maintenance, 40% of the business goes to a full service lessor; 38% to an OEM shop; and 21% to an independent dealer, and the remaining 1% being maintained by “other” (see following chart). These are in line with historical averages.
Maintenance Effectiveness: PM Currency Rates This year’s survey continued to evaluate two new measures of maintenance effectiveness, the first being PM Currency Rate. For the purposes of this survey, PM currency is defined as “Total class population minus number of PM’s past due divided by total class population equals percentage of PM’s complete.” Private fleet respondents reported the following currency rates (which remain relatively consistent year over year):
Full Service Lessor, 40%
OEM, 38%
Independent, 21%
Other, 1%
Outsourcing Providers
100% (14%)
95-99% (62%)
90-94% (15%)
85-89% (6%)
80-84% (2%)
Below 80% (1%)
PM Currency Rates

© 2017 by National Private Truck Council. All Rights Reserved. 31
Maintenance Effectiveness: Breakdown Percentage Another maintenance measure, the breakdown percentage (breakdowns per 100,000 miles) is tracked by about one-half of the fleets in this year’s survey and averages 2.8%; a significant improvement over last year’s 4.36%, and even the previ-ous year’s. Of those fleets using this metric, following are the leading problem areas:
Age of Heavy Duty Power Unit Population Trade Cycles This past year, respondents reported accelerating their equipment turns. The trade cycle of the entire Class 8 heavy-duty tractor population decreased to 6.4 years and 639,000 miles, down from last year’s reported trade cycles of 6.7 years and 675,000 miles. Just two years ago the figures stood at 7.4 years and 713,900 miles. Thus, trade cycles returned to levels last seen in the 2014 Benchmarking Report, which reflected trade cycles of 6.22 years, or 620,000 miles. This indicates that private fleets continue to be successful in justifying capital expenditures from their parent company to update the fleet. The good news is that it would appear the industry has turned the corner and is no longer flirting with operating the old-est fleet in the history of the survey. Relying on a peppier replacement cycle provides technology, fuel economy, opera-tions and customer service advantages to the fleet.
0% 10% 20% 30% 40% 50% 60%
Brakes
Electrical
Engine
Drivetrain
Lighting
Fuel System
Tires
Cooling System
Engine
Leading Cause of Breakdowns
5
6
7
8
9
10
2008 2009 2010 2011 2012 2013 2014 2015 2016 2017
Yea
rs
Class 8 Trade Cycles

© 2017 by National Private Truck Council. All Rights Reserved. 32
To get a more complete picture of the trade cycle strategies, when those fleets that lease the majority of their equipment were removed, the trade cycles shortened slightly to 6.75 years from last year’s 7.25 years. Equipment turns averaged 681,200 miles for this same class of vehicle, down from the 705,000 miles. For comparison purposes, in 2015, trade cycles for this same class averaged 8.74 years and 717,000 miles reported last year. Even those fleets that lease the majority of their equipment report extending the trade cycle out to 5.5 years and 580,000 miles.
5
6
7
8
9
10
2008 2009 2010 2011 2012 2013 2014 2015 2016 2017
Yea
rs
Class 8 Trade Cycles Years (Leasing Removed)

© 2017 by National Private Truck Council. All Rights Reserved. 33
Trailer Age On the trailer side of the business, across the board, fleet respondents reported accelerated trade cycles, once again un-derscoring the proposition that capital expenditures had been loosened. Specifically, fleets that owned trailers reported trading their van trailers at 12 years, down from last year’s average of 14 years. Trade cycles for reefers were reported at 10.8 identical to last year’s reported turns of 10.7 years. Flatbeds were traded at 14.4 years, exactly the same as last year. Finally, bulk trailers were turned at a historically snappy rate of 13.6 years up 3/10 of one percent from last year. Each of these reported equipment turns is likely more sluggish as many fleets don’t have formalized trade cycles and his-torically scrap one out of five trailers.
0
2
4
6
8
10
12
14
16
18
Vans Reefers Flats Bulk
Trailer Trade Cycles
2012 2013 2014 2015 2016 2017

© 2017 by National Private Truck Council. All Rights Reserved. 34
LABOR TRENDS
PRIVATE FLEET RESPONDENTS REPORTED EMPLOYING OR CONTRACTING WITH AN AVERAGE OF 283 DRIVERS (company drivers, temporary personnel, leased drivers, or owner-operators) – a ratio of 1.5 drivers per power unit. For comparison purposes, last year respondents reported a ratio of 1.4 drivers per power unit; the previous year the average was 1.21 and the year before that came in at 1.46 drivers per power unit. These figures evidence the proportion of NPTC members that continue to slip-seat their equipment.
Driver Demographics The average driver age reported in the survey remains at over 50, coming in at 50.4 years of age, down slightly from last year’s reported average of 51 years of age, which was the oldest driver population in the history of the survey. This aver-age age is somewhat surprising given the number of older drivers who left the industry via retirement. Two-thirds of the respondents reported losing drivers due to retirement last year and retirement is the third leading cause of why drivers are exiting the business. More on this in the section on driver turnover.
However, to call the typical private fleet driver “just a driver” is a bit of a misnomer as their job typically involves more than just the time spent behind the wheel. The typical private fleet driver works an average of 52.8 hours a week, up just under an hour over last year’s 52 hours but still down from the 59 hours recorded two years ago.
45
46
47
48
49
50
51
52
The Aging Driver Workforce
2011 2012 2013 2014 2015 2016 2017

© 2017 by National Private Truck Council. All Rights Reserved. 35
Of these hours, 35.5 are spent behind the wheel each week (vs. the 37.46 last year) while the remainder is spent perform-ing other non-driving tasks such as loading (6.38 hours a week), unloading (11.4 hours a week), and “other duties” (5.4 hours a week). These duties include paperwork, pre- and post-trip inspections, and the like.
Home Time When it comes to driver satisfaction with their jobs, many in the industry believe that the more time at home for the driv-er, in most cases leads to a more satisfying and fulfilling job. Or, at a minimum, home time helps to eliminate a source of dissatisfaction. By this measure, private fleets, as reported in this year’s survey, indicate that 61.5% of their driver popula-tion is home every night, as compared to 46% last year. Some, 18.7% are out overnight, compared to 17% last year; and in 19.8% of the cases are drivers out two nights or more per run, compared to 37% last year.
Team Operations This year’s survey revealed that 26.3% of all fleets use team drivers in at least a portion of their operation. That is down slightly from the previous two year’s reported averages of 28.8% and 29.8% and back with the range of 24% three years ago. Of those fleets employing team drivers, teams account for, on average, 33% of their operation and 27% of their miles, up significantly from last year.
0
20
40
60
80
Driving Working Total
Ho
urs
The Typical Driver's Work Week
2012 2013 2014 2015 2016 2017
15%
20%
25%
30%
35%
40%
2011 2012 2013 2014 2015 2016 2017
Percentage of Fleets Using Teams

© 2017 by National Private Truck Council. All Rights Reserved. 36
Union Penetration According to survey data that is captured on the following chart, 31% of the private fleets have a union presence in some or all of their driver workforce, down from the 33% level reached last year. Of those, half operate in an entirely union envi-ronment. Or to put it another way, 15% of all survey respondents operate in a totally union environment. Some 55% are wholly non-union, with the balance, 14%, operating in a partially union environment.
Comparing those fleets with a majority union workforce to those with primarily a non-union workforce revealed some rather interesting trends:
• Union operations updated their equipment more frequently with trade cycles of 6.2 years and 650,000 milesas opposed to non-union operations that traded equipment at 6.95 years and 722,500 miles. Late modelequipment has long been seen as a driver retention inducement.
• Union operations averaged a breakdown percentage that was twice that of the non-union operations.
• Union operations had a better turnover rate (10.7%) compared to their non-union counterparts (16.4%). Inaddition, union drivers boasted an average retention rate of more than 14 years vs. the 9.9 years in non-union shops. Digging deeper into the turnover figures, we find that union drivers retire at a rate almosttwice that of non-union operations; while non-union drivers leave for another driving job at nearly twice therate as their union colleagues.
• On average, union drivers were two years older than non-union drivers.
• Non-union operations were more likely to have wellness programs for their drivers by a factor of seven per-centage points.
• Union drivers earned an average of $3,000 more per year. However, non-union drivers were almost twice aslikely to receive incentive pay (94% vs. 50%)
Union, 31%
Non-Union, 55%
Combination, 14%
Fleets Reporting Union Presence

© 2017 by National Private Truck Council. All Rights Reserved. 37
Driver Turnover Although labor issues remain a significant challenge for survey respondents, they continue to report retention and turn-over performance far better than for-hire motor carriers. In 2017, private fleets reported that turnover dropped to 15.2% after surpassing the 18% barrier for the first time in the history of the survey last year.
This level of turnover is not inconsistent with the aging workforce and the increased number of drivers opting for retire-ment. Comparatively, the escalating turnover rate, while not in the neighborhood of the triple digit rate traditionally as-sociated with the for-hire truckload segment, should be of concern especially in the face of the projected shortfall of new drivers which many fleets are experiencing and which could reach 175,000 by 2024, according to industry projections.
Statistically, the survey revealed some major differences between those fleets that report driver turnover at 10% or less compared to those with a turnover rate above 20%:
• Turnover would appear to have some impact on safety with fleets experiencing turnover lower than the averagereporting a DOT recordable crash rate of 0.53 accidents per million miles compared to 0.74 accidents per millionmiles for the group reporting higher turnover.
• Higher turnover fleets experienced a cost per mile that was 15 cents higher than the lower turnover fleets.
• Lower turnover fleets paid their drivers better with annual compensation averaging $71,828 for low turnover fleets and $60,497 for the higher turnover fleets.
• Drivers in low turnover fleets averaged 51 years of age while those in the higher turnover fleets were more thantwo years younger.
• Somewhat surprisingly, drivers in the low turnover fleets worked longer hours, averaging 50.4 hours a week,more than 8 hours longer than drivers in the higher turnover fleets.
• Although many believe putting a driver in a late-model truck helps boost retention, this year’s survey – like lastyear’s – actually revealed the opposite. High turnover fleets had equipment trade cycles of 6.2 years and 610,000miles (5.9 years and 642,000 miles last year) compared to 6.5 years and 650,000 miles (7 years and 677,000 miles)for the fleets operating with lower turnover.
• Interestingly, both groups seemed to take driver health and wellness seriously, with 84% of the respondents inthe low turnover fleets and 90% in the high turnover fleets reporting that they offered driver health and wellnessprograms.
8%
10%
12%
14%
16%
18%
20%
2005 2006 2007 2008 2009 2010 2011 2012 2013 2014 2015 2016 2017
Driver Turnover Remains Low

© 2017 by National Private Truck Council. All Rights Reserved. 38
Why Drivers Leave Fleets in this year’s survey report their drivers leave for a variety of reasons (again these numbers add up to more than 100 because there are multiple reasons why drivers leave in each fleet):
Driver Retention The average retention rate reported by NPTC members is 10.5 years, down slightly from last year’s 11 year retention rate but about three years less than the 14.5 year average retention three years ago. This slight decline in the average reten-tion rate is most likely the result of older drivers opting to retire (see previous chart that shows 67% of driver turnover can be attributed to retirement).
One of the reasons why driver turnover and retention levels remain so positive among private fleets can be attributed to the fact that private fleets continue to be highly selective about their minimum driver hiring practices despite pervasive driver shortage issues. In fact, the minimum driver age, after several years of modest declines increased ever so slightly to 22.2 years up from the 22.0 level reported last year and close to the minimum age of 22.3 reported the previous year.
Similarly, the average minimum years of experience looked for when hiring a driver – 2.14 years – declined ever so slight-ly from last year’s 2.17. In addition, 8% of the fleet respondents report conducting hair follicle testing. This screening pro-tocol, which cannot replace the minimum drug and alcohol testing requirements established by the Federal Motor Carrier Safety Administration has shown a steady decline from the 20% reached two years ago. In addition, 15% of the fleet respondents report conducting personality profiling (down from 18% last year); and 36% report conducting func-tional capacity screening (almost identical to last year).
0% 10% 20% 30% 40% 50% 60% 70% 80%
Death
Another job
Other
Discipline
Another driving job
Retire
Reasons Drivers Leave
2014
2015
2016
2017

© 2017 by National Private Truck Council. All Rights Reserved. 39
This was the second year the survey asked about fleets using the PSP program and 50% indicated they were taking ad-vantage of this program that allows prospective carriers, industry personnel and drivers review drivers' safety records from the Federal Motor Carrier Safety Administration's (FMCSA) Motor Carrier Management Information System (MCMIS). This is the same level as reported last year.
The average age of the private fleet’s average new hire remains at 41.2 years of age, exactly what it was last year. That number is up from the average 38.6-year-old recruit reported three years ago.
Driver Recruiting The demand for new drivers continues to escalate at the same time the pool of existing drivers is drying up. Private fleet respondents report that they are filling empty seats through the following strategies, which have remained relatively consistent over the years.
0% 10% 20% 30% 40% 50% 60%
Hair Follicle
Personality Profile
Functional Capacity
PSP
Pre-Employment Screening Practices
2017 2016 2015 2014 2013
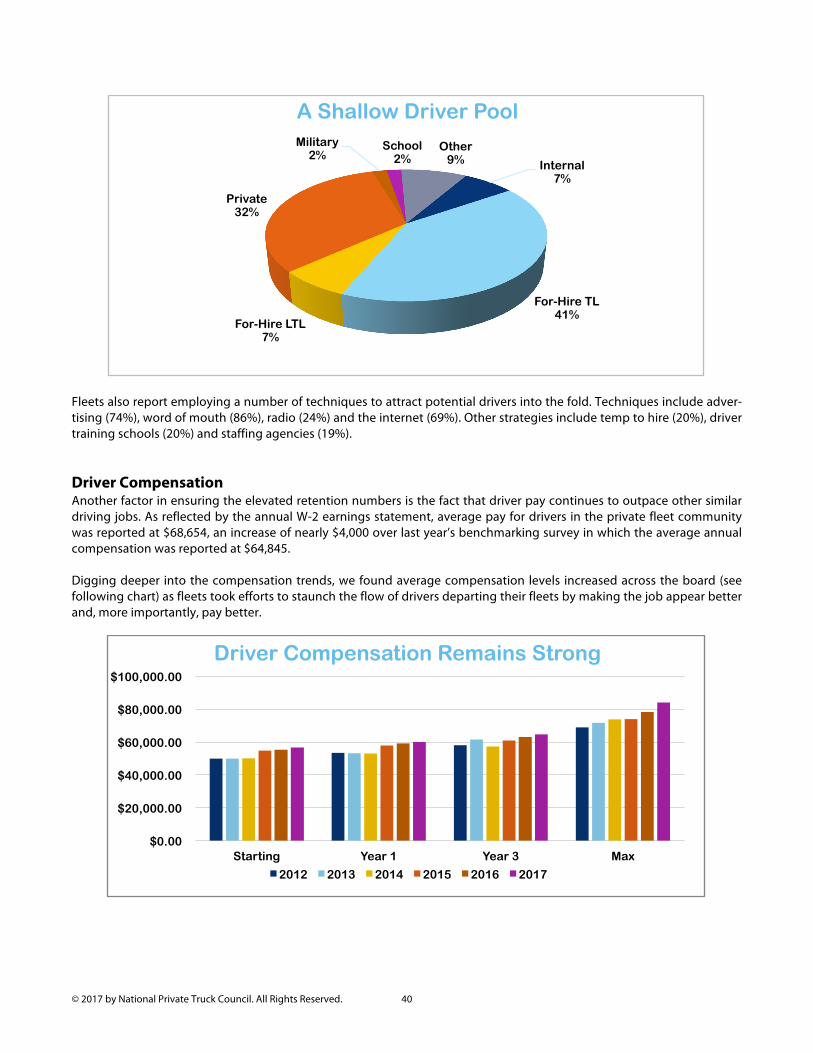
© 2017 by National Private Truck Council. All Rights Reserved. 40
Fleets also report employing a number of techniques to attract potential drivers into the fold. Techniques include adver-tising (74%), word of mouth (86%), radio (24%) and the internet (69%). Other strategies include temp to hire (20%), driver training schools (20%) and staffing agencies (19%). Driver Compensation Another factor in ensuring the elevated retention numbers is the fact that driver pay continues to outpace other similar driving jobs. As reflected by the annual W-2 earnings statement, average pay for drivers in the private fleet community was reported at $68,654, an increase of nearly $4,000 over last year’s benchmarking survey in which the average annual compensation was reported at $64,845. Digging deeper into the compensation trends, we found average compensation levels increased across the board (see following chart) as fleets took efforts to staunch the flow of drivers departing their fleets by making the job appear better and, more importantly, pay better.
Internal 7%
For-Hire TL 41%
For-Hire LTL 7%
Private 32%
Military 2%
School 2%
Other 9%
A Shallow Driver Pool
$0.00
$20,000.00
$40,000.00
$60,000.00
$80,000.00
$100,000.00
Starting Year 1 Year 3 Max
Driver Compensation Remains Strong
2012 2013 2014 2015 2016 2017

© 2017 by National Private Truck Council. All Rights Reserved. 41
Prying the data out into typical operating segments, fleets reported the following compensation averages:
Today’s driver, as previously discussed, is not one-size, fits-all. To look at how driver compensation was tailored for the over-the-road, regional and local segment, we put together the following charts based upon the data submitted. As the following charts indicate, private fleets pay their drivers in a number of different manners:
$0
$10,000
$20,000
$30,000
$40,000
$50,000
$60,000
$70,000
$80,000
$90,000
$100,000
Starting Year 1 Year 3 Maximum
Over-the Road
Regional
Local/Interplant
Mileage 43%
Activity-Based 23%
Hourly 31%
Salary 3%
OTR Pay Components

© 2017 by National Private Truck Council. All Rights Reserved. 42
Performance based compensation components included such activities as: § Stops § Miles § Cases § Detention § Layover § Trailer transfer § Backhaul
§ Drop & hook § Fuel economy § Hard braking § Speeding § Shifting § Cross border § Metro pay
§ Hourly § Doubles § Team § Meals § Pre and post trip § Pounds unloaded § Safety
Mileage 29%
Activity-Based 28%
Hourly 40%
Salary 3%
Regional Pay Components
Mileage 25%
Activity-Based 21%
Hourly 53%
Salary 1%
Intraplant/Local Pay Components

© 2017 by National Private Truck Council. All Rights Reserved. 43
Incentive Offerings The majority of fleets report paying their drivers incentives. This year, 79% of the respondents reported paying incentives, down from the 91% that reported doing so last year but back in line with the number that did so in the previous year’s survey. Just three years ago, two-thirds of the respondents reported paying incentives. This high level can be explained by the need to boost compensation and the plentiful data that can now be used to track key performance metrics.
The average incentive amount dropped full percentage to 4% from 5% last year and 4.5% the year before.
In fact, fleets continue to expand the number of metrics upon which incentives are based (see following chart).
0% 10% 20% 30% 40% 50% 60% 70% 80% 90% 100%
Appearance
Retention
Idle Time
On-Time Performance
Attendance
Customer Service
Stop Pay
Company Goals
Productivity
Fuel Economy
New-Hire Referral
Compliance
Safety
Components of Incentive Compensation

© 2017 by National Private Truck Council. All Rights Reserved. 44
Benefit Packages Private fleets continue to back their compensation programs with generous benefit packages, as reflected in the follow-ing chart. Benefit packages were reported to represent slightly more than 20% of the driver’s gross pay. Although these percent-ages remain roughly equivalent year to year, NPTC members report these benefit costs are rising quickly, essentially cost-ing them more as the driver compensation base keeps growing. Despite the cost, the generous benefit offerings are judged as a key component to driver satisfaction and retention, especially when viewed over the entire career of the driver.
0% 10% 20% 30% 40% 50% 60% 70% 80% 90% 100%
Pension
Family Leave
Tuition Reibursement
Sick Time
Continuing Education
Profit Sharing
Vacation
LTD
STD
Vision
Life Insurance
401(k)
Holiday
Funeral Leave
Dental
Medical
Private Fleets Offer Generous Benefit Packages

© 2017 by National Private Truck Council. All Rights Reserved. 45
Driver Wellness Initiatives In addition to these benefits, and perhaps to a small degree as a result of the aging driver population, 85% of the re-spondents reported having a driver wellness program. That figure is down slightly from last year’s reported average of 89% but up dramatically from the 63% level recorded just three years ago. It is best explained by the fact that fleets want to take care of drivers that are increasingly harder to come by. In addition, as the driver population continues to age, most fleet managers would agree that an ounce of prevention (driver wellness) is worth a pound of cure (worker’s comp). Finally, driver wellness initiatives are an attempt to control employee health care costs that are rapidly escalating. Only 10.5% of the respondents reported having no driver wellness programs. Following are the individual components of the-se programs:
0% 10% 20% 30% 40% 50% 60% 70% 80% 90%
Sleep Management
Sleep Testing
Nutritional Counseling
Exercise Program
Weight Management
Smoking Cessation
Mental Health
Grief
Driver Wellness Components

© 2017 by National Private Truck Council. All Rights Reserved. 46
Support Personnel The number of support personnel needed to support the private fleet, detailed in the chart below, showed minor in-creases in productivity year over year – a sign that the fleets continue to do more with less. The numbers on the chart below represent the average number of drivers that are served by one person in each of the functions.
Driver Sourcing Strategies The bulk of private fleet managers (79%) continue to directly employ company drivers, almost identical to the historical share. Some 7% of private fleets exclusively lease their drivers in this year’s survey, identical to last year. The remaining 14% percent of the fleets rely on a combination of staffing options (company drivers, owner-operators and driver leasing) nearly identical to last year. Some 10.5% of the fleets contract with owner-operators as part of their driver staffing model.
When the driver population as a whole is considered, 91% are company drivers, 8% are leased employees and 1% are owner-operators. These results are in line with the results reported in last year’s survey.
21.5 32
140 116
192 34
20 515
190
0 100 200 300 400 500 600
Supervisor Dispatcher
Safety Accounting
Backhaul Administration
Maintenance Tax
Technology
Ratio of Support Personnel (Number of Drivers per Function)
Company 79%
Leased 7%
Combination 14%
Fleet Driver Sourcing Strategies

© 2017 by National Private Truck Council. All Rights Reserved. 47
COST PERFORMANCE
IN ORDER TO INCREASE THE RELIABILITY OF OUR DATA, EACH YEAR WE ASK PRIVATE FLEETS TO REPORT ON THE COST-PER-MILE by major component area: equipment, maintenance, fuel, driver, benefits, administration, and claims. Across the entire pool of recipients, the cost per mile reported was $2.64 per mile, down 6% from the $2.82 per mile re-ported last year. Most of that increase can be attributed to lower fuel prices. However, like previous benchmarking initia-tives, there remain wide variations in private fleet operations and costs. This makes “apples-to-apples” rather difficult, so caution should be used when benchmarking these numbers. Following are the cost figures as reported by all respond-ents:
Please note that the individual entries do not add up to the total because many of the responses would only provide a total cost per mile and not break it down by individual components. Those components were averaged separately to provide the most reliable data.
Since many fleets do not break out equipment costs individually, this year’s survey includes a “Total Equipment & Repair,” bucket which is comprised of all fleets, regardless of how they account for equipment costs.
$0.0 $0.5 $1.0 $1.5 $2.0 $2.5 $3.0
TOTAL
Other
Licensing
Fuel
Driver
Claims & Insurance
Benefits
Administration
TOTAL EQUIPMENT & MAINTENANCE
Trailer
Tractor Maintenance
Tires
Power Equipment
Cost-Per-Mile
2014 2015 2016 2017

© 2017 by National Private Truck Council. All Rights Reserved. 48
To get a better understanding of the costs of an operation, we took looked at the various costs by operation type:
Digging deeper, this year’s survey looked at the annual operating costs by various mileage categories:
Please note that the individual entries do not add up to the total because many of the responses would only provide a total cost per mile and not break it down by individual components. Those components were averaged separately to provide the most reliable data.
0%
10%
20%
30%
40%
50%
60%
70%
80%
90%
100%
Van Operations
Refrigerated Operations
Flatbed Operations
Bulk Operations
Other
Claims
Licensing
Administration
Benefits
Driver
Fuel
Equipment & Maintenance
$0.00
$0.50
$1.00
$1.50
$2.00
$2.50
$3.00
Less than 75,000 75,000 – 99,999 100,000 – 124,999
More than 125,000
Cost-Per-Mile by Annual Mileage
Other
Claims
Licensing
Administration
Benefits
Driver
Fuel
Equipment & Maintenance

© 2017 by National Private Truck Council. All Rights Reserved. 49
Cost Center vs. Profit Center This year, 72% of the respondents reported operating as a cost center as compared to the 77% that indicated they did so last year. Some 19% reported they operated as a profit center, compared to the 24% that said they operated as profit cen-ter last year.
Cost Center 72%
Profit Center 19%
No Answer 9%
Cost Center vs. Profit Center

© 2017 by National Private Truck Council. All Rights Reserved. 50
SAFETY TRENDS
WITH AN ACCIDENT FREQUENCY THAT IS SHOWED SIGNIFICANT IMPROVEMENT, private fleets participating in the survey continue to report an outstanding safety record whether measured by Preventable Accidents per Million Miles (total crashes resulting from errors, efficient conditions, work processes or other problems that could have been prevent-ed multiplied by one million and divided by total miles), Non-Preventable Accidents per Million Miles (total crashes in which no errors, deficient conditions or work processes could be identified that contributed to the occurrence multiplied by one million and divided by total miles), or by DOT Recordable Accidents per Million Miles (DOT recordable crashes multiplied by one million and divided by total miles). As part of its effort to determine a carrier’s safety fitness, the Department of Transportation looks at, among other factors, the recordable accident rate which the carrier has experienced during the past 12 months. Recordable accident, as de-fined in federal law, means an accident involving a commercial motor vehicle operating on a public road in interstate or intrastate commerce which results in a fatality; a bodily injury to a person who, as a result of the injury, immediately re-ceives medical treatment away from the scene of the accident; or one or more motor vehicles incurring disabling damage as a result of the accident requiring the motor vehicle to be transported away from the scene by a tow truck or other mo-tor vehicle. Private fleets reported a DOT Recordable crash rate of 0.61 crashes per million miles, a drop of nearly one-third over the 0.86 crashes per million miles reported last year and back in line with the historical norms of 0.55 and 0.59 reported in 2015 and 2014 respectively. This crash rate is roughly three times better than the industry average according to Federal Motor Carrier Safety Administration (FMCSA) officials, although the agency does not report an industry average crash rate for all motor carriers. Please note that the preventable and non-preventable crash rates may not be that easy to draw conclusions from as eve-rybody’s definition of what constitutes an accident is in the process of evolving.
0
0.1
0.2
0.3
0.4
0.5
0.6
0.7
0.8
0.9
1
DOT Recordable
Private Fleet Safety Performance
2007 2008 2009 2010 2011 2012 2013 2014 2015 2016 2017

© 2017 by National Private Truck Council. All Rights Reserved. 51
New to the survey this year was a question regarding lost time injury rate. The average score reported was 2.92. Another measure of a motor carrier’s safety is their CSA performance. As a result, the Benchmarking Survey asked fleets for their most recent CSA performance, a question that continued in this year’s survey. The results are summarized in the table below.
0
0.5
1
1.5
2
2.5
3
2.4 1.4
Preventable and Non-Preventable Accidents
2008 2009 2010 2011 2012 2013 2014 2015 2016 2017
Preventable Non-Preventable
0
5
10
15
20
25
30
35
2012 2013 2014 2015 2016 2017
CSA Performance Scores
■ Unsafe Driving ■ Fatigued Driving ■ Driver Fitness ■ Controlled Sunstances ■ Vehicle Maintenance ■ HazMat ■ Crash

© 2017 by National Private Truck Council. All Rights Reserved. 52
Active Safety Technologies Fleets continue to increase the amount of advanced safety technologies in their fleet operations. Across the board, each technology showed single-digit gains year over year. As an aside, the survey question related to in-cab cameras specifi-cally asked for those that were ‘front and driver facing’.
0% 10% 20% 30% 40% 50% 60% 70% 80%
Lane Departure
Collision Warning
Adaptive Cruise Control
Electronic Stability Control
In-Cab Camera
Speed Monitoring
Tire Inflation
Disk Brakes
Backup Cameras
Automatic Transmission
Active Safety Technologies

© 2017 by National Private Truck Council. All Rights Reserved. 53
LOOKING AHEAD…
SOME 76% OF THE RESPONDENTS REPORT THAT THEY EXPECT THEIR FLEET TO GROW (add equipment or handle more of their company’s freight) over the next five years. That compares to the 66% that reported similar growth last year. In those cases, the average growth – whether measured by an increase in total equipment or in terms of handling more of their company’s freight – is estimated at 8.6%. Another 5% of the fleet respondents expect to stay the same size. Only 19% expect a decline in their fleet operations.
Grow 76%
Shrink 19%
Stable 5%
Most Private Fleets Plan to Add Equipment or Haul More Freight Over Next Five Years

© 2017 by National Private Truck Council. All Rights Reserved. 54
ABOUT NPTC
FOUNDED IN 1939, the National Private Truck Council is the only national trade association exclusively representing the interests of the private truck industry and corporate/business private truck fleet management. With an actively engaged leadership team of Board representatives, member volunteers and staff, NPTC in the past decade has grown significantly to serve a rising professional class of private fleet practitioners meeting the challenges of modern corporate transporta-tion. NPTC is the leading learning resource center, government affairs advocate, and business networking culture for America's top private fleet and supplier member companies. The Council produces benchmarking, best practices, and economic data reports on the private fleet market; administers the highly regarded Certified Transportation Professional (CTP) training program, and conducts some of the most successful events in the trucking industry including the Annual Conference and Trade Show, the Private Fleet Management Institute, and the National Safety Conference. For more in-formation about the Council’s activities and programs, visit our website at www.nptc.org.

© 2017 by National Private Truck Council. All Rights Reserved. 55
APPENDIX I: NPTC BENCHMARKING STEERING COMMITEE
DAVID BARTH, CTP Transportation Area Manager Wegmans Retail Service Center820 Keystone Blvd.Pottsville, PA 17901 (570)[email protected]
MICHAEL LITTLE, CTP Director Service First Distribution 600 Phil Gramm Boulevard Bryan, TX 77807 (979)778-4549 [email protected]
RICK REED, CTP Pepsi Beverages Company 631 Solarex Court Frederick, MD 21702 (484)221-4821 [email protected]
DUANE WOODS, CTP Director, Transportation Operations Albertsons Companies 5918 Stoneridge Mall Road Pleasanton, CA 94588-3229 (925)226-9127 [email protected]
GARY PETTY President & CEO National Private Truck Council 950 North Glebe Road, Suite 530 Arlington, VA 22203-4183 (703)838-8876 [email protected]
TOM MOORE, CTP Sr. Vice President National Private Truck Council 950 North Glebe Road, Suite 530 Arlington, VA 22203-4183 (703)838-8898 [email protected]
KELLY NEWSOME, CTP Financial Analyst Hill-Rom Company, Inc. 1069 State Route 46 East Batesville, IN 47006 (812)931-2719 [email protected]