quantified fleet management - · pdf filesource: fmcg company, ... benchmarking as part of...
TRANSCRIPT

Quantified Fleet Management
Saskia HarremanManaging Consultant, LeasePlan International

Agenda
Fleet Benchmarking
The importance of fleet strategy
Quantified Fleet Management
Cost
Environment
Policy
Conclusions
LeasePlan International Consultancy Services
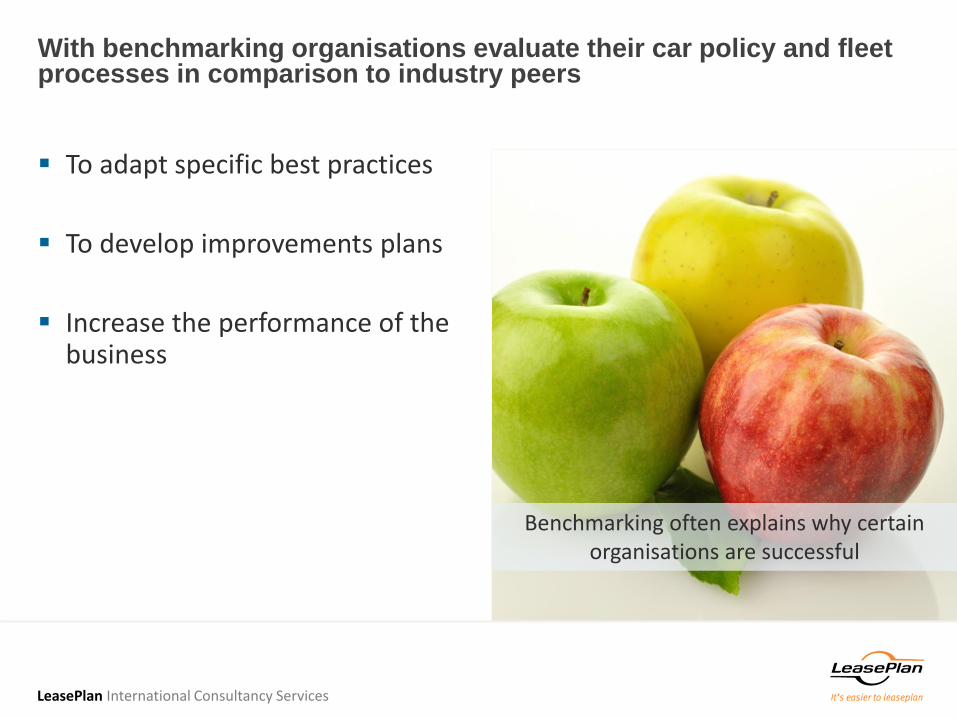
With benchmarking organisations evaluate their car policy and fleet processes in comparison to industry peers
To adapt specific best practices
To develop improvements plans
Increase the performance of the business
Benchmarking often explains why certain organisations are successful
LeasePlan International Consultancy Services
Agenda
Fleet Benchmarking
The importance of fleet strategy
Quantified Fleet Management
Cost
Environment
Policy
Conclusions
LeasePlan International Consultancy Services
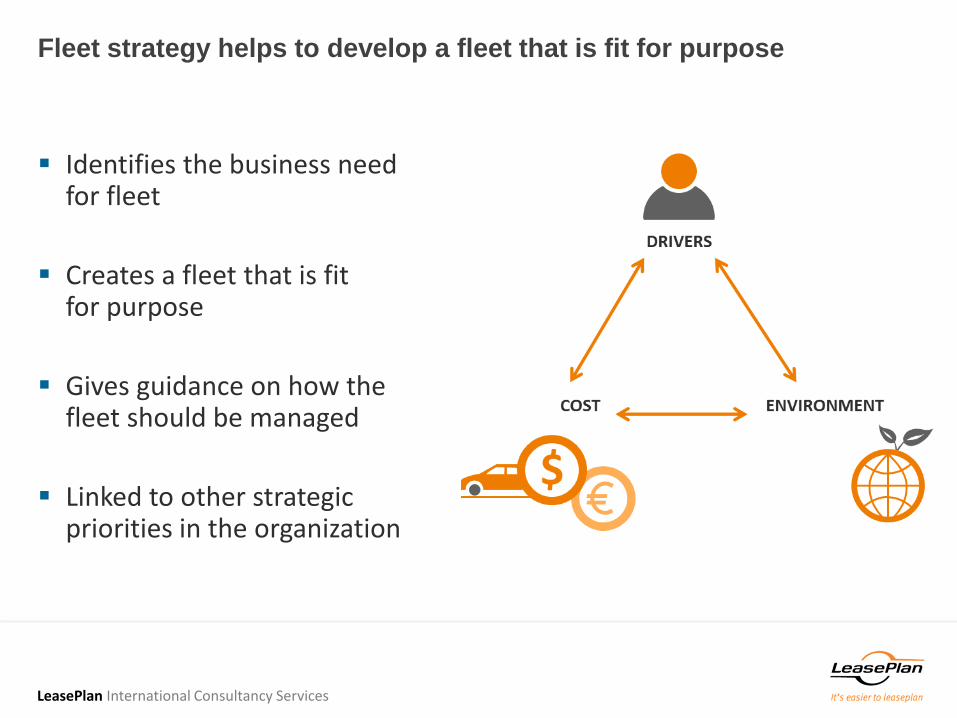
Fleet strategy helps to develop a fleet that is fit for purpose
Identifies the business need for fleet
Creates a fleet that is fit for purpose
Gives guidance on how the fleet should be managed
Linked to other strategic priorities in the organization
LeasePlan International Consultancy Services
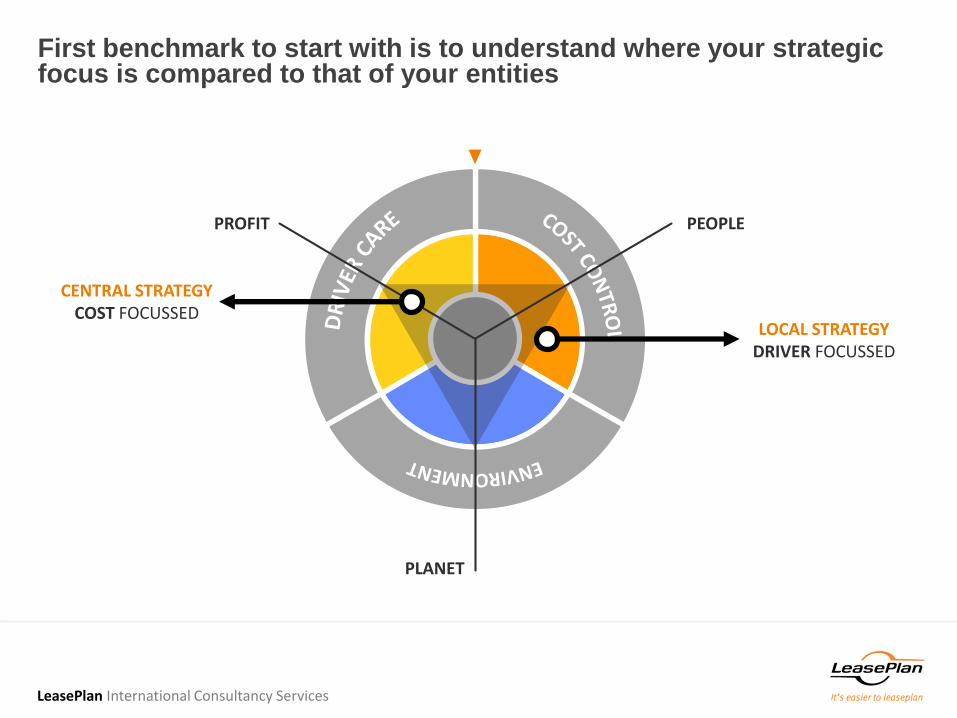
First benchmark to start with is to understand where your strategic focus is compared to that of your entities
PEOPLEPROFIT
PLANET
LOCAL STRATEGY DRIVER FOCUSSED
CENTRAL STRATEGY COST FOCUSSED
LeasePlan International Consultancy Services
Agenda
Fleet Benchmarking
The importance of fleet strategy
Quantified Fleet Management
Cost
Environment
Policy
Conclusions
LeasePlan International Consultancy Services
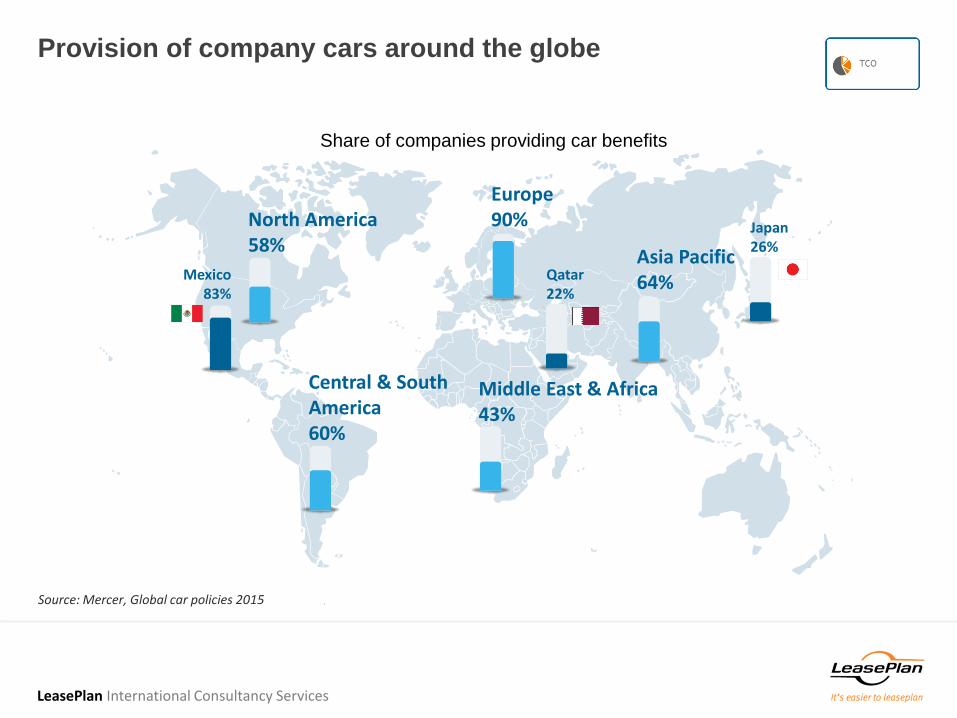
Provision of company cars around the globe
Source: Mercer, Global car policies 2015
Central & SouthAmerica60%
Europe90%
Middle East & Africa43%
Asia Pacific64%Qatar
22%
North America58%
Mexico83%
Japan26%
Share of companies providing car benefits
LeasePlan International Consultancy Services
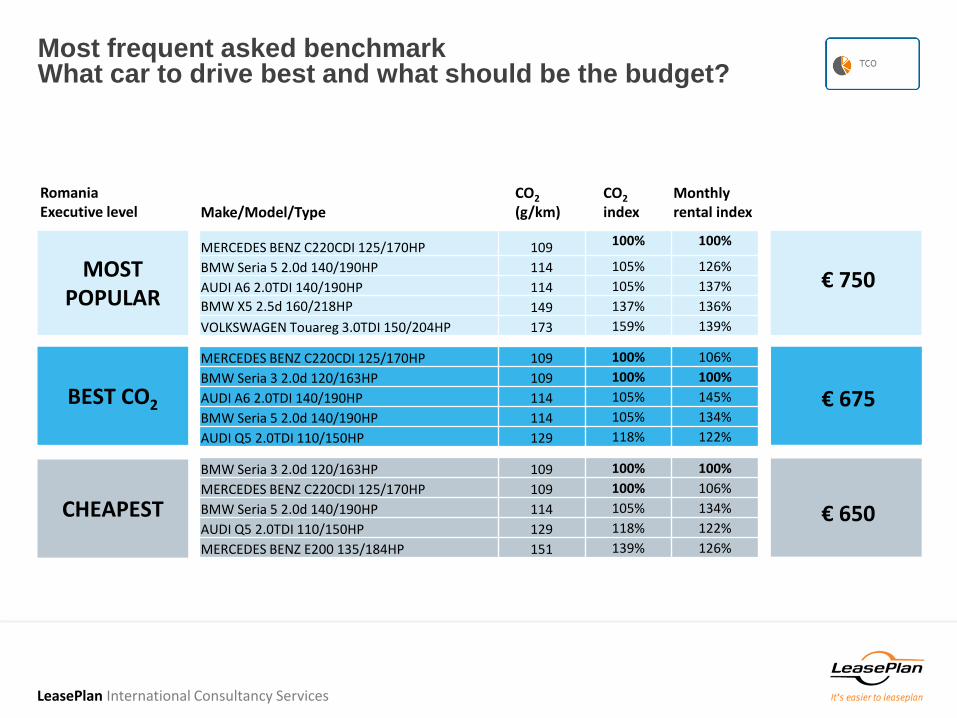
Most frequent asked benchmarkWhat car to drive best and what should be the budget?
MOST POPULAR
BEST CO2
CHEAPEST
€ 750
€ 675
€ 650
MERCEDES BENZ C220CDI 125/170HP 109 100% 100%
BMW Seria 5 2.0d 140/190HP 114 105% 126%
AUDI A6 2.0TDI 140/190HP 114 105% 137%
BMW X5 2.5d 160/218HP 149 137% 136%
VOLKSWAGEN Touareg 3.0TDI 150/204HP 173 159% 139%
MERCEDES BENZ C220CDI 125/170HP 109 100% 106%
BMW Seria 3 2.0d 120/163HP 109 100% 100%
AUDI A6 2.0TDI 140/190HP 114 105% 145%
BMW Seria 5 2.0d 140/190HP 114 105% 134%
AUDI Q5 2.0TDI 110/150HP 129 118% 122%
BMW Seria 3 2.0d 120/163HP 109 100% 100%
MERCEDES BENZ C220CDI 125/170HP 109 100% 106%
BMW Seria 5 2.0d 140/190HP 114 105% 134%
AUDI Q5 2.0TDI 110/150HP 129 118% 122%
MERCEDES BENZ E200 135/184HP 151 139% 126%
Romania Executive level Make/Model/Type
CO2
(g/km) CO2
indexMonthly rental index
LeasePlan International Consultancy Services
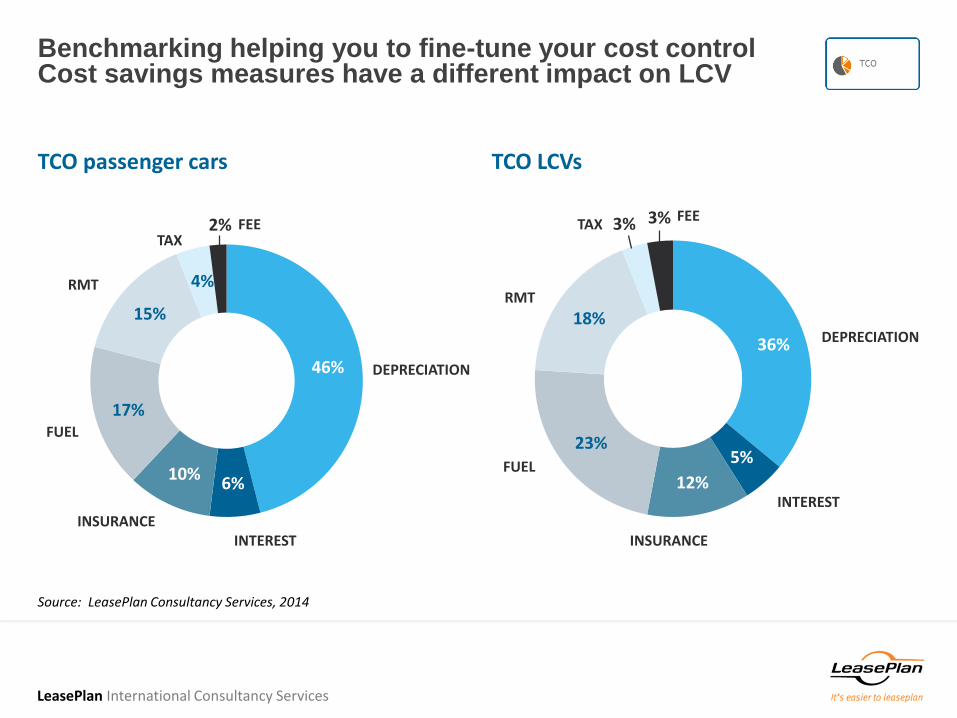
Benchmarking helping you to fine-tune your cost controlCost savings measures have a different impact on LCV
TCO passenger cars TCO LCVs
46%
6%10%
17%
15%
4%
2% FEE
DEPRECIATION
INTERESTINSURANCE
FUEL
RMT
TAX
36%
5%
12%
23%
18%
3% 3%
DEPRECIATION
INTEREST
INSURANCE
FUEL
RMT
TAXFEE
Source: LeasePlan Consultancy Services, 2014
LeasePlan International Consultancy ServicesLeasePlan International Consultancy Services
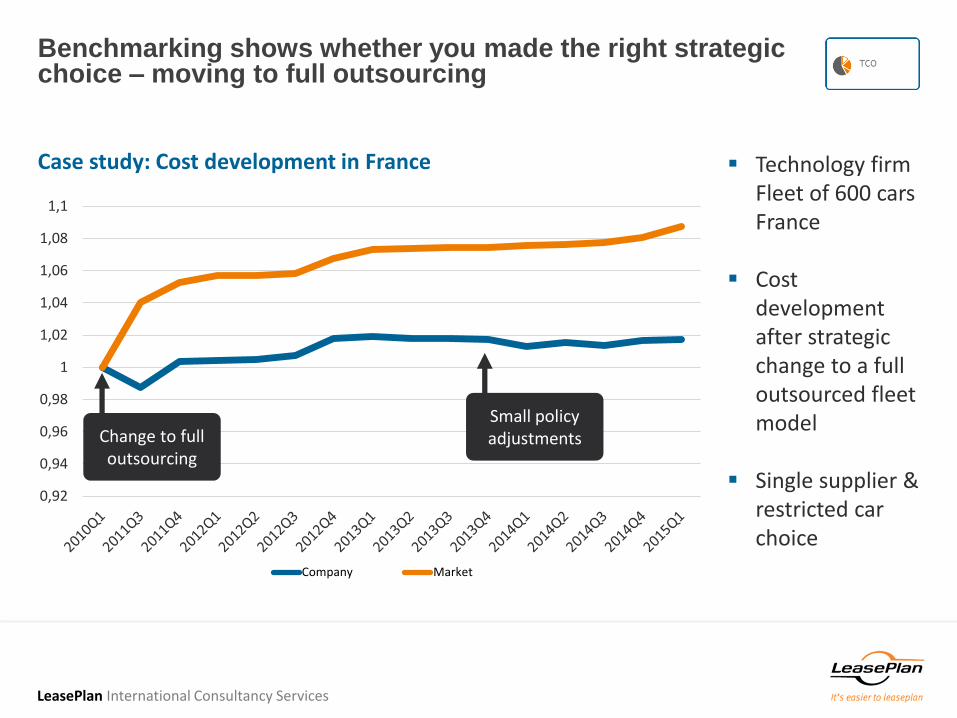
Benchmarking shows whether you made the right strategic choice – moving to full outsourcing
0,92
0,94
0,96
0,98
1
1,02
1,04
1,06
1,08
1,1
Company Market
Case study: Cost development in France Technology firmFleet of 600 carsFrance
Cost development after strategic change to a full outsourced fleet model
Single supplier & restricted car choice
Change to full outsourcing
Small policy adjustments
LeasePlan International Consultancy Services
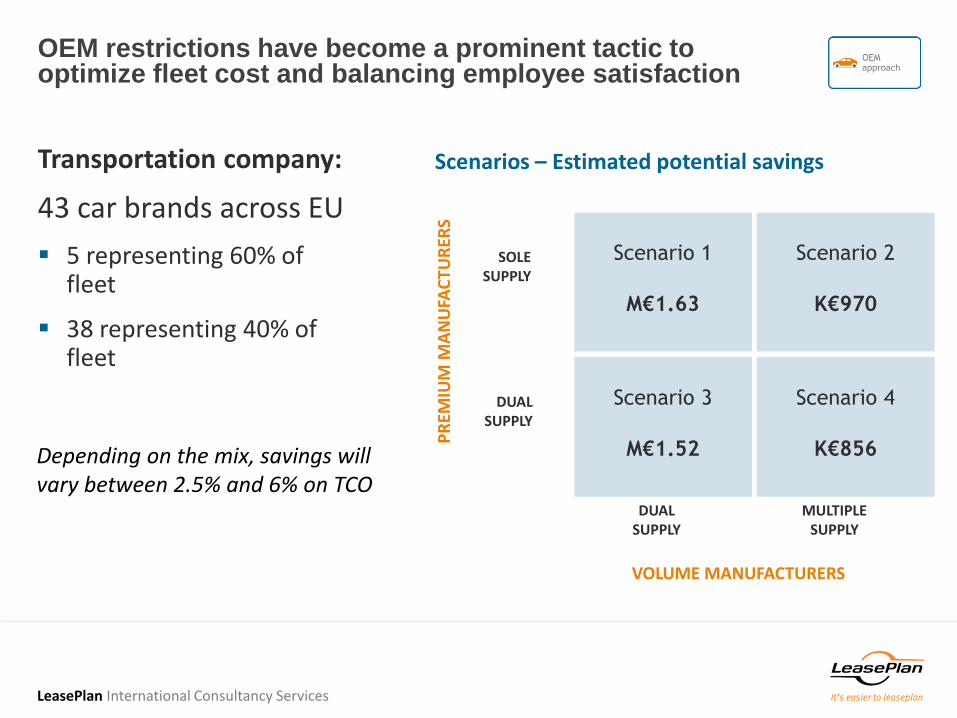
OEM restrictions have become a prominent tactic to optimize fleet cost and balancing employee satisfaction
Transportation company:
43 car brands across EU
5 representing 60% of fleet
38 representing 40% of fleet
Scenarios – Estimated potential savings
Scenario 3
M€1.52
Scenario 4
K€856
Scenario 2
K€970
Scenario 1
M€1.63
DUAL SUPPLY
MULTIPLE SUPPLY
VOLUME MANUFACTURERS
SOLE SUPPLY
DUAL SUPPLY
PR
EMIU
M M
AN
UFA
CTU
RER
SDepending on the mix, savings will vary between 2.5% and 6% on TCO
LeasePlan International Consultancy Services
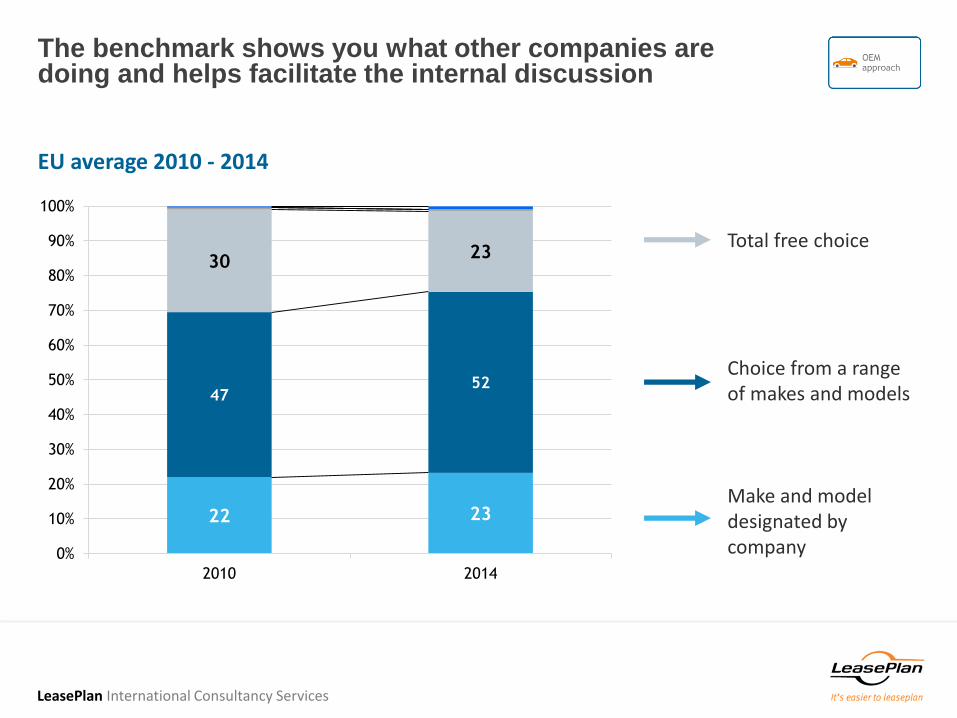
The benchmark shows you what other companies are doing and helps facilitate the internal discussion
EU average 2010 - 2014
Total free choice
Choice from a range of makes and models
Make and model designated by company
22 23
4752
3023
0%
10%
20%
30%
40%
50%
60%
70%
80%
90%
100%
2010 2014
LeasePlan International Consultancy Services
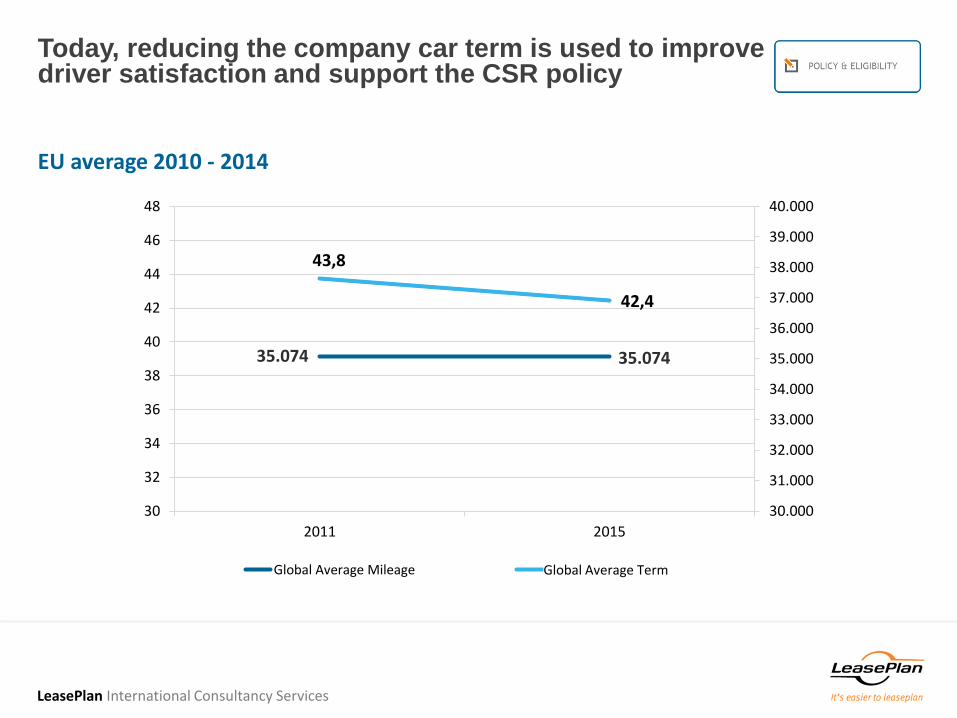
Today, reducing the company car term is used to improvedriver satisfaction and support the CSR policy
EU average 2010 - 2014
43,8
42,4
30.000
31.000
32.000
33.000
34.000
35.000
36.000
37.000
38.000
39.000
40.000
30
32
34
36
38
40
42
44
46
48
2011 2015
Global Average Mileage Linear (Global Average Term)Global Average Term
35.07435.074
LeasePlan International Consultancy Services
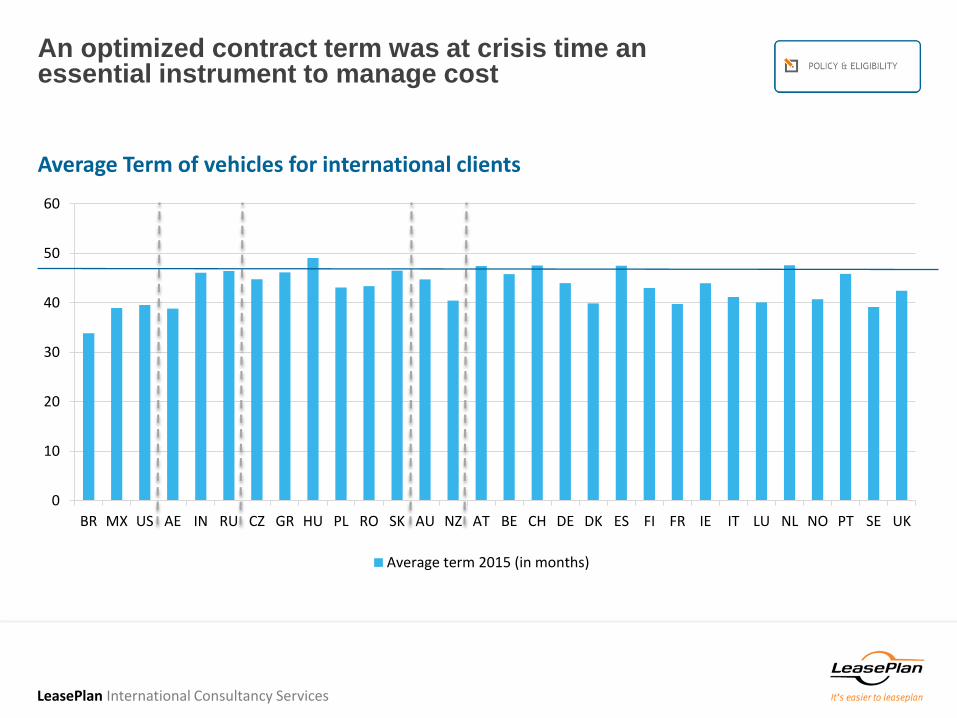
An optimized contract term was at crisis time an essential instrument to manage cost
Average Term of vehicles for international clients
0
10
20
30
40
50
60
BR MX US AE IN RU CZ GR HU PL RO SK AU NZ AT BE CH DE DK ES FI FR IE IT LU NL NO PT SE UK
Average term 2015 (in months)
LeasePlan International Consultancy Services
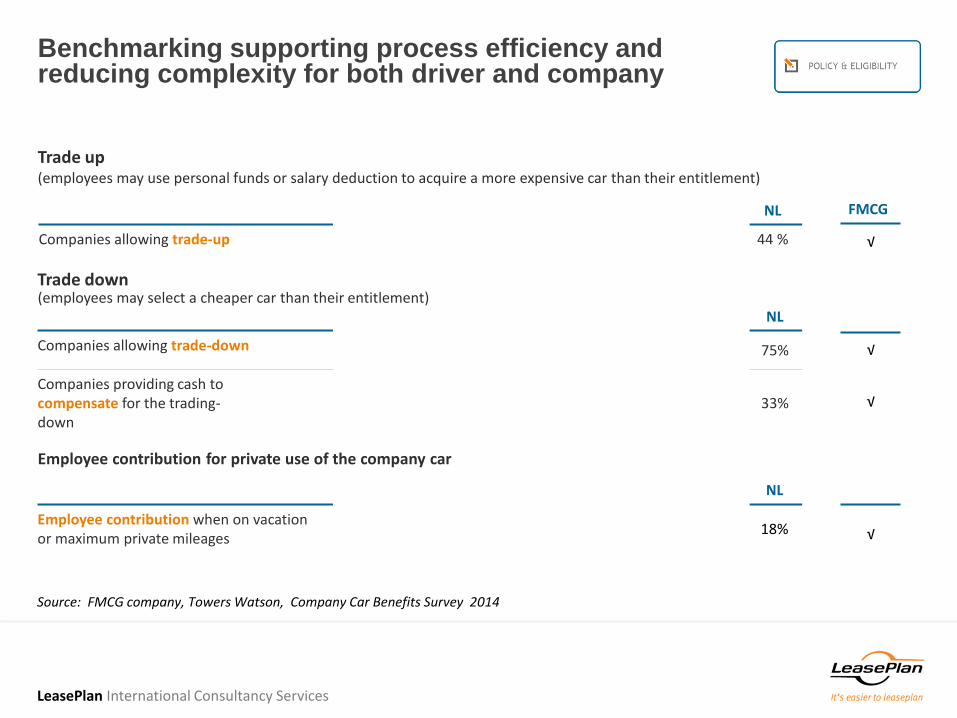
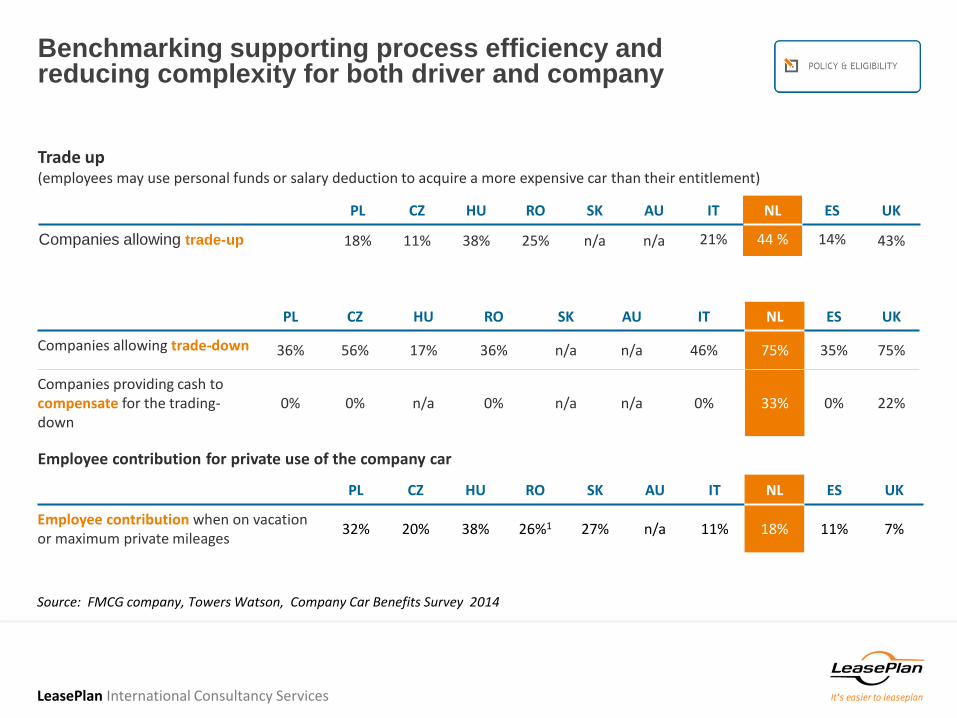
Benchmarking supporting process efficiency and reducing complexity for both driver and company
Trade up
Employee contribution for private use of the company car
(employees may use personal funds or salary deduction to acquire a more expensive car than their entitlement)
PL CZ HU RO SK AU IT NL ES UK
Companies allowing trade-up 18% 11% 38% 25% n/a n/a 21% 44 % 14% 43%
CZ HU RO SK AU IT NL ES UK
Companies allowing trade-down 56% 17% 36% n/a n/a 46% 75% 35% 75%
Companies providing cash to compensate for the trading-down
0% n/a 0% n/a n/a 0% 33% 0% 22%
PL CZ HU RO SK AU IT NL ES UK
Employee contribution when on vacation or maximum private mileages
32% 20% 38% 26%1 27% n/a 11% 18% 11% 7%
Source: FMCG company, Towers Watson, Company Car Benefits Survey 2014
Trade down(employees may select a cheaper car than their entitlement)
FMCG
√
√
√
√
LeasePlan International Consultancy Services
Benchmarking supporting process efficiency and reducing complexity for both driver and company
Trade up
Employee contribution for private use of the company car
(employees may use personal funds or salary deduction to acquire a more expensive car than their entitlement)
PL CZ HU RO SK AU IT NL ES UK
Companies allowing trade-up 18% 11% 38% 25% n/a n/a 21% 44 % 14% 43%
PL CZ HU RO SK AU IT NL ES UK
Companies allowing trade-down 36% 56% 17% 36% n/a n/a 46% 75% 35% 75%
Companies providing cash to compensate for the trading-down
0% 0% n/a 0% n/a n/a 0% 33% 0% 22%
PL CZ HU RO SK AU IT NL ES UK
Employee contribution when on vacation or maximum private mileages
32% 20% 38% 26%1 27% n/a 11% 18% 11% 7%
LeasePlan International Consultancy Services
Source: FMCG company, Towers Watson, Company Car Benefits Survey 2014
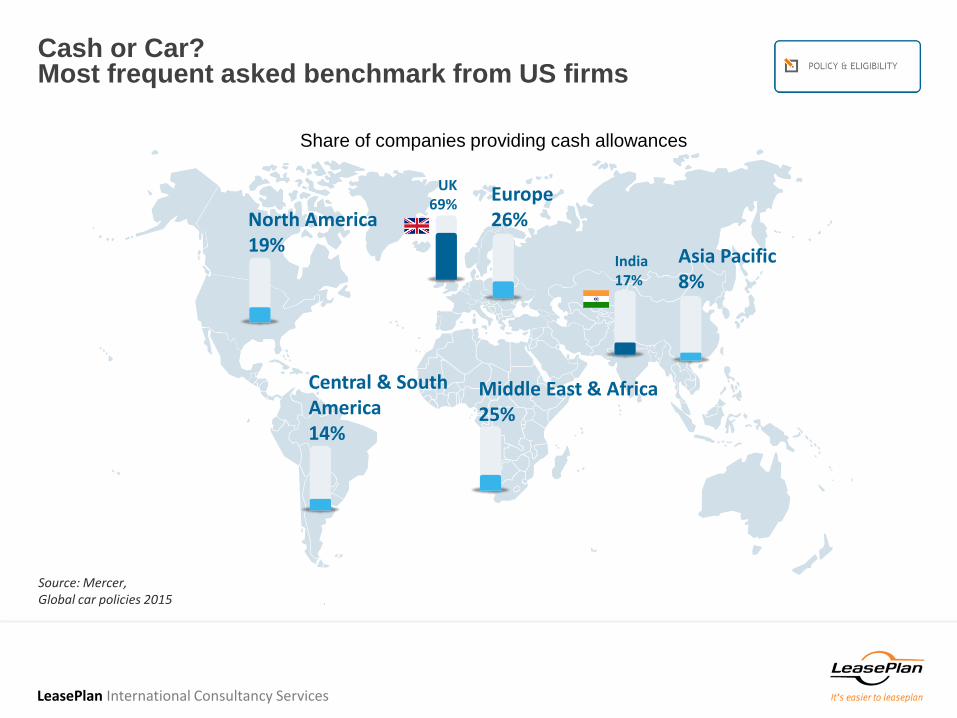
Cash or Car?Most frequent asked benchmark from US firms
Source: Mercer, Global car policies 2015
Central & SouthAmerica14%
Europe26%
Middle East & Africa25%
Asia Pacific8%
North America19%
UK69%
India17%
Share of companies providing cash allowances
LeasePlan International Consultancy Services

OEMs have managed to bring down the CO2 levels drastically
Source: Jato Dynamics, LeasePlanConsultancy Services
Brazil191
Europe123.3 (10% less compared to 2011)
Australia/New Zealand176
US229
Mexico142
India171
AVG CO2 in g/km for newly produced cars
LeasePlan International Consultancy Services
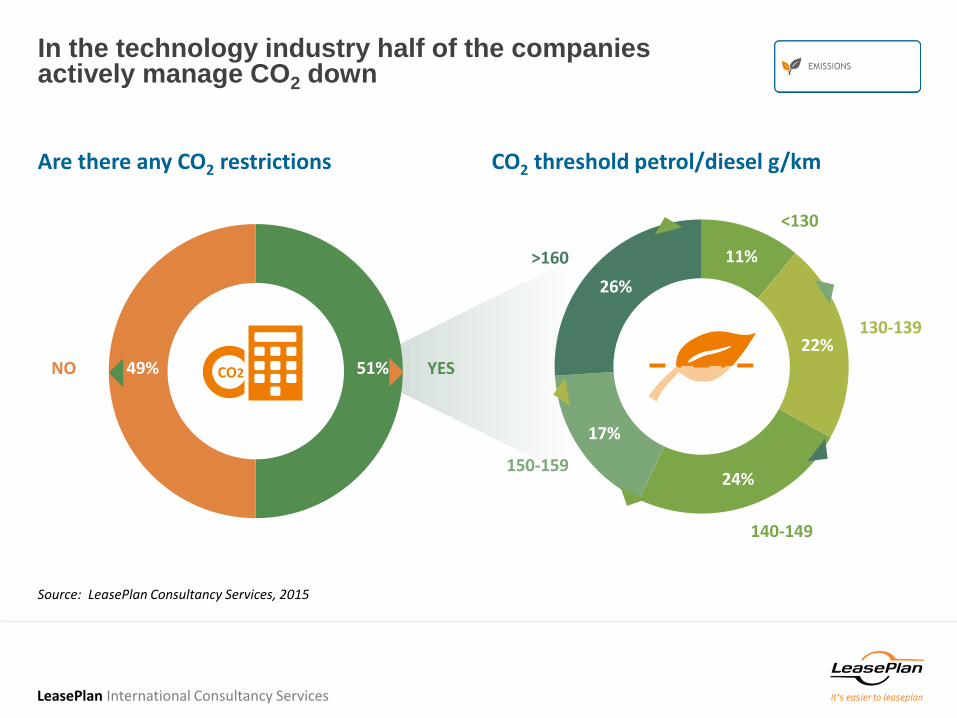
In the technology industry half of the companies actively manage CO2 down
Are there any CO2 restrictions CO2 threshold petrol/diesel g/km
11%
22%
24%
17%
26%
NO YES51%49%
Source: LeasePlan Consultancy Services, 2015
<130
130-139
140-149
150-159
>160
CO2
LeasePlan International Consultancy Services
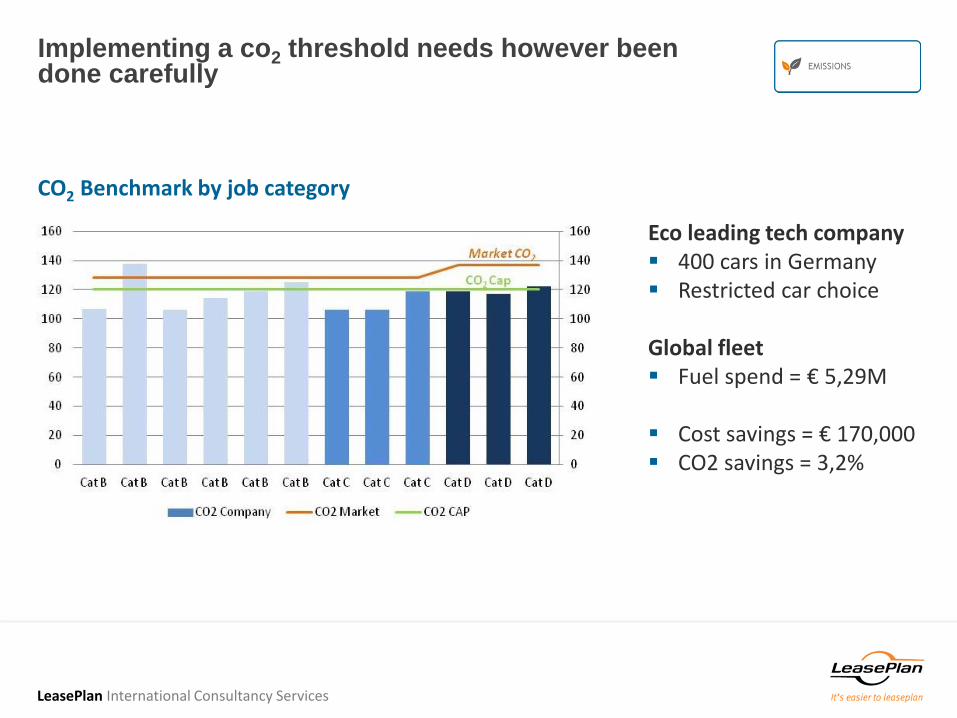
Implementing a co2 threshold needs however been done carefully
CO2 Benchmark by job category
Eco leading tech company 400 cars in Germany Restricted car choice
Global fleet Fuel spend = € 5,29M
Cost savings = € 170,000 CO2 savings = 3,2%
LeasePlan International Consultancy Services
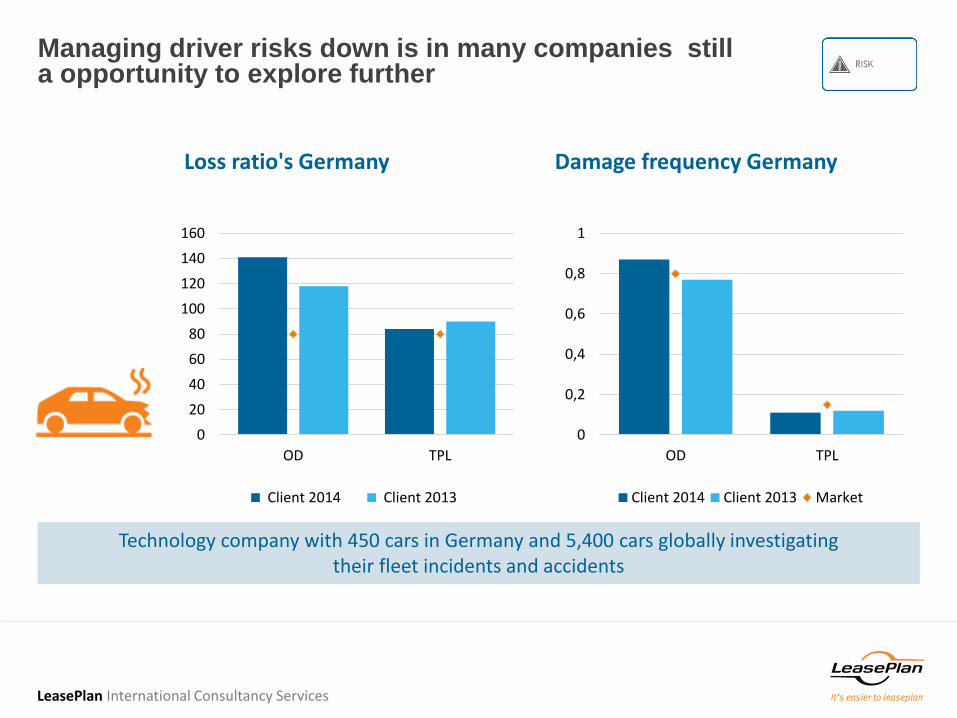
Managing driver risks down is in many companies still a opportunity to explore further
Loss ratio's Germany Damage frequency Germany
0
20
40
60
80
100
120
140
160
OD TPL
Client 2014 Client 2013
0
0,2
0,4
0,6
0,8
1
OD TPL
Client 2014 Client 2013 Market
Technology company with 450 cars in Germany and 5,400 cars globally investigating their fleet incidents and accidents
LeasePlan International Consultancy Services

Agenda
Fleet Benchmarking
The importance of fleet strategy
Quantified Fleet Management
Cost
Environment
Policy
Conclusions
LeasePlan International Consultancy Services
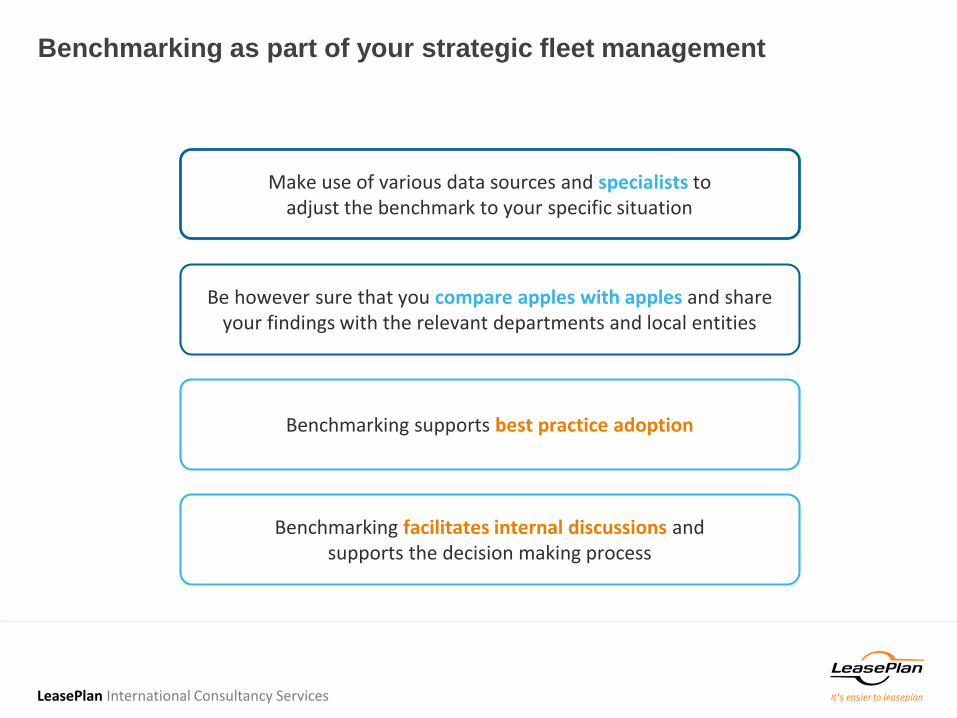
Benchmarking as part of your strategic fleet management
Make use of various data sources and specialists to adjust the benchmark to your specific situation
Benchmarking supports best practice adoption
Be however sure that you compare apples with apples and share your findings with the relevant departments and local entities
Benchmarking facilitates internal discussions and supports the decision making process
LeasePlan International Consultancy Services

Thank you for your attention
For more information:
LeasePlan International
Consultancy Services