benchmarking report 2 0 1 6 · improved and efficient water and wastewater services to the people...
TRANSCRIPT
B E N C H M A R K I N G R E P O R T
Apia, Samoa © PWWA 2016
2 0 1 6
Pacific Water and Wastewater AssociationFive Years of Performance Assessment (2011-2015)
Benchmarking Report 2016 uto v8.indd 1 2/08/16 12:51 PM
2 | B E N C H M A R K I N G R E P O R T
PWWA Vision: Shaping a cohesive, proficient and robust Pacific water utilities’ sector
PWWA Mission: Develop expertise in the Pacific for the sustainable management of water and wastewater services
Benchmarking Report 2016 uto v8.indd 2 2/08/16 12:51 PM

B E N C H M A R K I N G R E P O R T | 3
This round of performance assessment was done exclusively by PWWA secretariat and its utilities-members. With financial assistance from the Asian Development Bank, assisting Conferences and technical support of the IBNET program of the World Bank, the PWWA utilities-members are getting ready to make their own decisions in performance improvement.
I thank all active PWWA members and I encourage everyone to continue working with performance assessment, monitoring and benchmarking to ensure improved and efficient water and wastewater services to the people of the Pacific.
The Pacific Water and Wastewater Association is a not for profit membership body established in 1994 to support the Pacific Region in meeting all water challenges and as a knowledge and information platform for water utilities in the Pacific Region. PWWA’s work is guided by its Mission and Vision statements as outline in its Strategic Plan 2015-2017. This is its 4th Benchmarking Report published since it commenced back in 2011.
Latu KupaExecutive Director
PrefaceThe Pacific Water and Wastewater Association (PWWA) is pleased to release the Five Years of Performance Assessment report based on PWWA performance monitoring and assessment work during the last years. Twenty-eight utilities members submitted and analyzed their performance results paving the way to understanding issues of each of the utility, create strategic development plans and search for the financial resources that can help to expand and in many cases sustain the life supporting services.
In recognizing the important role of performance assessment and benchmarking play in utilities operation, the PWWA Board reaffirms its commitment to continue this work with its utilities-members.
Benchmarking Report 2016 uto v8.indd 3 2/08/16 12:51 PM
4 | B E N C H M A R K I N G R E P O R T
AcknowledgementThis report is the joint product of Pacific Water and Wastewater Association and its 27 utilities members. The PWWA secretariat conducted the data collection and validation with PWWA utilities members. In particular, Latu Kupa, the PWWA Executive Director was critical to the project success communicating with PWWA members and encouraging progress in data collection and analysis. Misileti Masoe-Satuala communicated with utilities, collected information and uploaded information to the pwwa.ws website. Alexander Danilenko, Sr. Water and Sanitation Specialist provided technical support and helped to compile and analyze the collected information.
PWWA staff, Kisa Kupa, Taatele Tofilau, Maria Petaia, Etuale Jr. Ioane & Theresa Hunt all contributed at some ways during the last five years of Benchmarking
Special thanks to all the PWWA Utilities listed below, for the collated data from 2014 & 2015 those have been compiled and analyzed with results presented in this report.
Benchmarking Report 2016 uto v8.indd 4 2/08/16 12:51 PM

Countries Utilities Contacts1 American Samoa American Samoa Power Authority Utu Abe MalaeWilliam Spitzenberg
2 Cook Islands Infrastructure Cook Islands Ngametua College Pokino
3 Fiji Islands Water Authority Fiji Opetaia Ravai Manasa Tusulu
4 FSM – Yap States Central Yap State Public Service Faustino Yangmog
Southern Yap Water Authority John Guswell
Northern Yap Gagil Tomil Authority Razakrisnan Manikam
FSM – Chuuk Chuuk Public Utilities Corporation Paul Howell
FSM – Kosrae Department of Transportation and Infrastructure Weston Luckymis
FSM – Pohnpei Pohnpei Utilities Robert Hadley
5 Guam Guam Waterworks Authority Heidi Ballendorf Joe Tadeo
6 Kiribati Islands Public Utilities Board Tokaata Niata
7 Marshall Islands Kwajalein Atoll Joint Utility ResourcesRomeo Alfred Daniel Tokeak Kitlang Kapua
Majuro Water Sewer Company Joseph Batol
8 Nauru Nauru Utility Corporation Abraham Simpson Mark Hiram
9 New Caledonia Caledonienne des Eaux Didier Gaujous
10 Niue Public Works Department Deve Talagi Crispina Konelio
11 Northern Marianas Commonwealth Utilities Gary Camacho
12 Palau PPUC Water and Wastewater Kione J Isechal
13 Papua New Guinea Eda Ranu Henry Mokono Roy Karang
Water PNG Raka Taviri Roger Kara
14 Samoa Samoa Water AuthoritySeugama’ali’i Jammie Saena Phillip Kerslake Jolivette Thompson
Independent Water SchemeSulutumu Sasa MiloAmituana’i Laumua LeavaiTofae Alailima Nu’uali’itia
15 Solomon Islands Solomon Islands Water Authority Ian GoodenMarista Kapini
16 Tahiti Polynesienne des Eaux Stephane Martin dit Neuville
17 Tokelau Islands Tokelau Government Mikaele PerezJewel Toloa
18 Tonga Tonga Water Board Saimone HeluElisiva Tapueluelu
19 Tuvalu Ministry of Utilities & Industries Ampelosa Tehulu
20 Vanuatu UNELCO Ghislain Kaltack
B E N C H M A R K I N G R E P O R T | 5
Benchmarking Report 2016 uto v8.indd 5 2/08/16 12:51 PM
6 | B E N C H M A R K I N G R E P O R T
Overviewin development and sustainment of water and sanitation services in the Pacific Island states and territories. Since 2009, with the first baseline data collection exercise, the PWWA members were able to assess their performance and conduct their own performance assessment and reporting.
In 2011, PWWA adopted the tools and instruments of the International Benchmarking Network for Urban Water and Sanitation Utilities (IBNET) of the World Bank.
IBNET consists of three major tools. The first is the IBNET data collection toolkit, which can be downloaded from the IBNET website at www.ib-net.org and which is essentially an Excel spreadsheet with a set of data to be completed and instructions as to which precise data to enter. The second tool is a database of water and sewerage utilities’ performance that is continuously updated. This database provides utilities and other sector stakeholders the opportunity to search for data in different formats and also allows for simple benchmarking of utility data. The benchmarking tool enables the utility to compare itself to other utilities that share similar characteristics (e.g. size, factors related to location, and management structure). A third tool provides data on participating agencies that can help organizations, interested in measuring utility performance, contact neighboring utilities as well as other organizations, and as such build local networks for performance assessment and benchmarking.
IBNET data collectors enter required performance data into a standardized Excel spreadsheet under the categories General, Service Area, Water
Service, Sewerage Service, Financial, and Tariffs. The spreadsheet can be downloaded easily from the IBNET website. Macros in the spreadsheet automatically calculate more than 27 groups of quantitative indicators that characterize the utility’s performance with respect to water and wastewater coverage and quality, water consumption and production, cost recovery, operations, finance, technical efficiency, billings and collections, and capital investment. Following completion of data entry and submission of the spreadsheet to the IBNET program, the World Bank’s Water and Sanitation Program performs quality control on submitted data and then enters them into the IBNET database.
As per the PWWA’s request and meamorandum of understanding, a special website was developed for PWWA utilities and is now available at www.pwwa.ws and directly at pwwa2.ib-net.org.
Separate tariff database tariffs.ib-net.org presents information on domestic tariffs, payments and structure of charges for water for domestic users.
Benchmarking Report 2016 uto v8.indd 6 2/08/16 12:51 PM
B E N C H M A R K I N G R E P O R T | 7
It is expected that transparent and accurate information will bring attention to the utilities and to their investment potential. Specifically, it is expected that this report will help:
ObjectivesPerformance monitoring and
benchmarking enables utilities assess
their performance, and helps compare
themselves with previous performance
and with similar utilities within the
PWWA and around the World.
• assess the performance of PWWA utility-members and benchmark their performance against each other;
• impart learning on the institutional structure and drivers of utility performance, and in determining how this affects the way the PWWA utilities and their authorities design and implement water and wastewater projects and policies;
• increase the monitoring and evaluation capacity in utilities using the available data and benchmarks for performance in the Pacific region; and
• encourage development of investment projects based on objective information by PWWA utilities, their authorities and donors.
Benchmarking Report 2016 uto v8.indd 7 2/08/16 12:51 PM
8 | B E N C H M A R K I N G R E P O R T
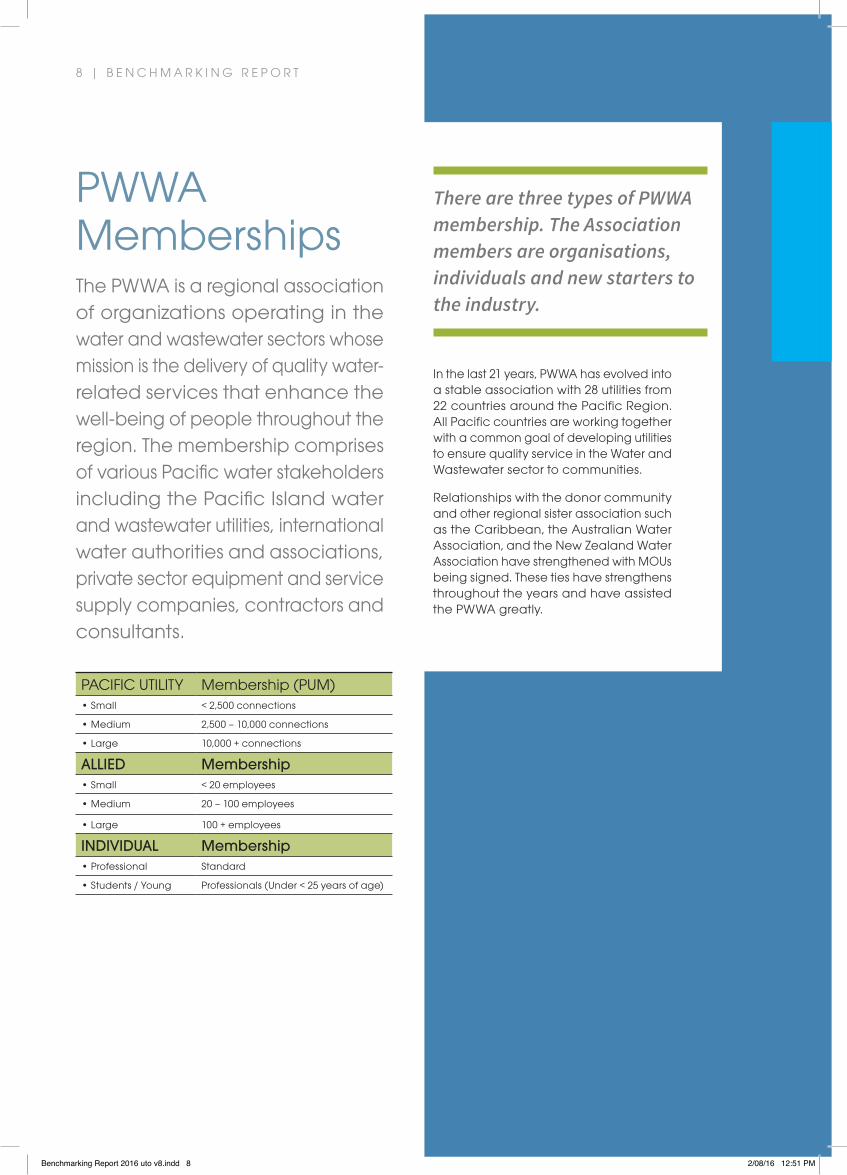
PWWA MembershipsThe PWWA is a regional association of organizations operating in the water and wastewater sectors whose mission is the delivery of quality water-related services that enhance the well-being of people throughout the region. The membership comprises of various Pacific water stakeholders including the Pacific Island water and wastewater utilities, international water authorities and associations, private sector equipment and service supply companies, contractors and consultants.
PACIFIC UTILITY Membership (PUM)• Small < 2,500 connections
• Medium 2,500 – 10,000 connections
• Large 10,000 + connections
ALLIED Membership• Small < 20 employees
• Medium 20 – 100 employees
• Large 100 + employees
INDIVIDUAL Membership• Professional Standard
• Students / Young Professionals (Under < 25 years of age)
There are three types of PWWA membership. The Association members are organisations, individuals and new starters to the industry.
In the last 21 years, PWWA has evolved into a stable association with 28 utilities from 22 countries around the Pacific Region. All Pacific countries are working together with a common goal of developing utilities to ensure quality service in the Water and Wastewater sector to communities.
Relationships with the donor community and other regional sister association such as the Caribbean, the Australian Water Association, and the New Zealand Water Association have strengthened with MOUs being signed. These ties have strengthens throughout the years and have assisted the PWWA greatly.
Benchmarking Report 2016 uto v8.indd 8 2/08/16 12:51 PM
B E N C H M A R K I N G R E P O R T | 9
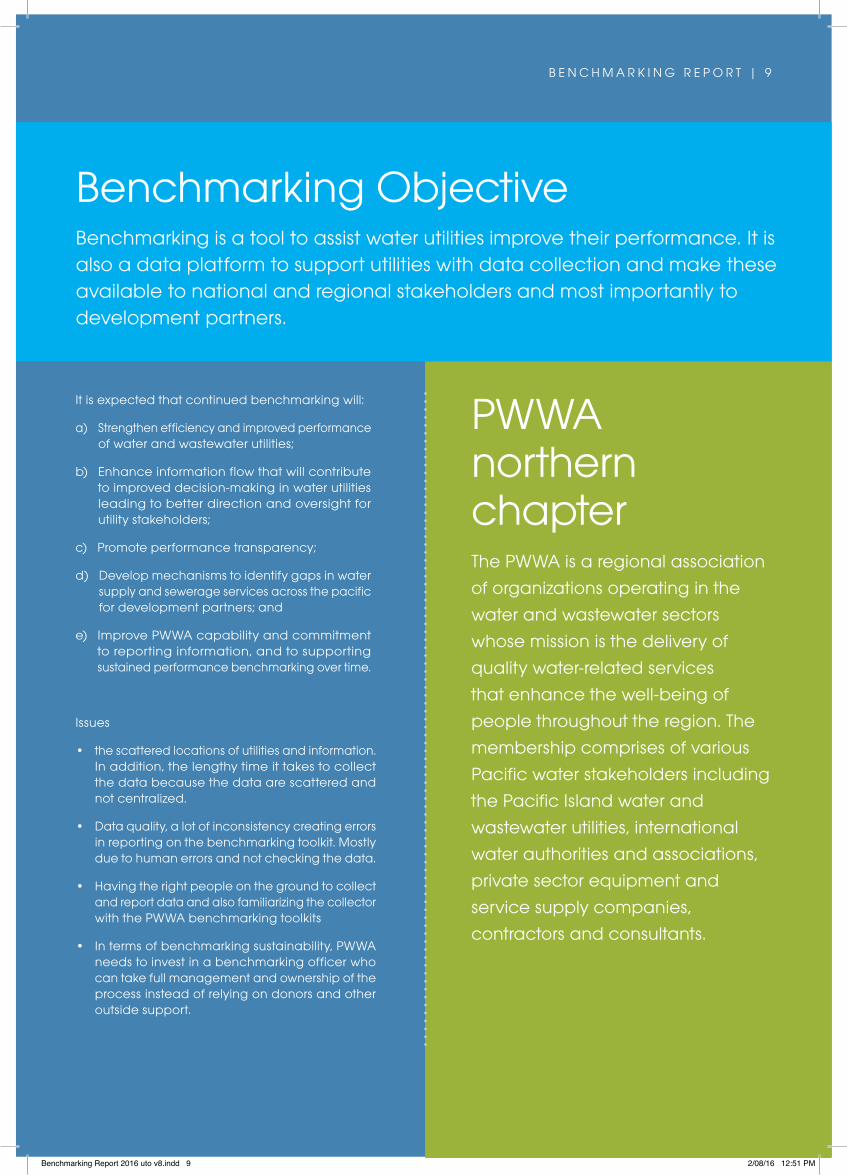
It is expected that continued benchmarking will:
a) Strengthen efficiency and improved performance of water and wastewater utilities;
b) Enhance information flow that will contribute to improved decision-making in water utilities leading to better direction and oversight for utility stakeholders;
c) Promote performance transparency;
d) Develop mechanisms to identify gaps in water supply and sewerage services across the pacific for development partners; and
e) Improve PWWA capability and commitment to reporting information, and to supporting sustained performance benchmarking over time.
Issues
• the scattered locations of utilities and information. In addition, the lengthy time it takes to collect the data because the data are scattered and not centralized.
• Data quality, a lot of inconsistency creating errors in reporting on the benchmarking toolkit. Mostly due to human errors and not checking the data.
• Having the right people on the ground to collect and report data and also familiarizing the collector with the PWWA benchmarking toolkits
• In terms of benchmarking sustainability, PWWA needs to invest in a benchmarking officer who can take full management and ownership of the process instead of relying on donors and other outside support.
PWWA northern chapterThe PWWA is a regional association
of organizations operating in the
water and wastewater sectors
whose mission is the delivery of
quality water-related services
that enhance the well-being of
people throughout the region. The
membership comprises of various
Pacific water stakeholders including
the Pacific Island water and
wastewater utilities, international
water authorities and associations,
private sector equipment and
service supply companies,
contractors and consultants.
Benchmarking ObjectiveBenchmarking is a tool to assist water utilities improve their performance. It is also a data platform to support utilities with data collection and make these available to national and regional stakeholders and most importantly to development partners.
Benchmarking Report 2016 uto v8.indd 9 2/08/16 12:51 PM
1 0 | B E N C H M A R K I N G R E P O R T
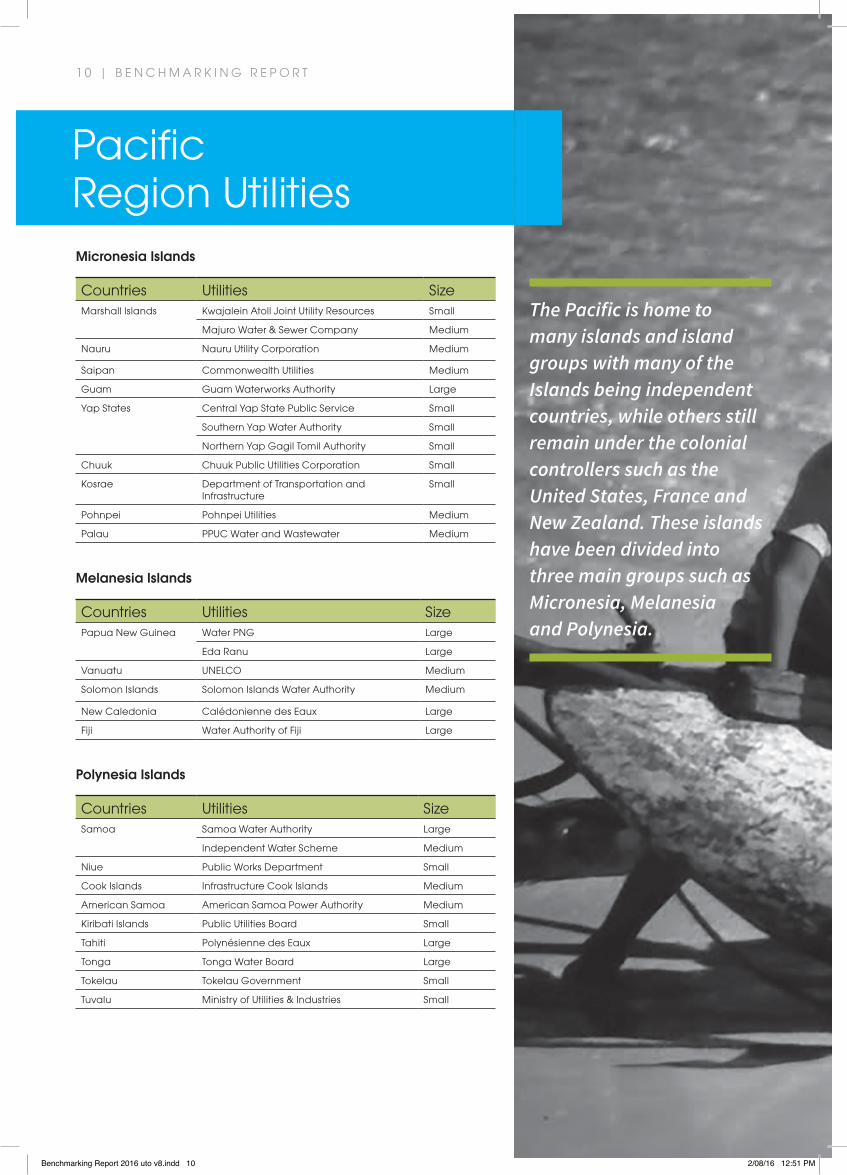
Micronesia Islands
Countries Utilities SizeMarshall Islands Kwajalein Atoll Joint Utility Resources Small
Majuro Water & Sewer Company Medium
Nauru Nauru Utility Corporation Medium
Saipan Commonwealth Utilities Medium
Guam Guam Waterworks Authority Large
Yap States Central Yap State Public Service Small
Southern Yap Water Authority Small
Northern Yap Gagil Tomil Authority Small
Chuuk Chuuk Public Utilities Corporation Small
Kosrae Department of Transportation and Infrastructure
Small
Pohnpei Pohnpei Utilities Medium
Palau PPUC Water and Wastewater Medium
Melanesia Islands
Countries Utilities SizePapua New Guinea Water PNG Large
Eda Ranu Large
Vanuatu UNELCO Medium
Solomon Islands Solomon Islands Water Authority Medium
New Caledonia Calédonienne des Eaux Large
Fiji Water Authority of Fiji Large
Polynesia Islands
Countries Utilities SizeSamoa Samoa Water Authority Large
Independent Water Scheme Medium
Niue Public Works Department Small
Cook Islands Infrastructure Cook Islands Medium
American Samoa American Samoa Power Authority Medium
Kiribati Islands Public Utilities Board Small
Tahiti Polynésienne des Eaux Large
Tonga Tonga Water Board Large
Tokelau Tokelau Government Small
Tuvalu Ministry of Utilities & Industries Small
Pacific Region Utilities
The Pacific is home to many islands and island groups with many of the Islands being independent countries, while others still remain under the colonial controllers such as the United States, France and New Zealand. These islands have been divided into three main groups such as Micronesia, Melanesia and Polynesia.
Benchmarking Report 2016 uto v8.indd 10 2/08/16 12:51 PM
B E N C H M A R K I N G R E P O R T | 11
Participation in the benchmarking studyThe PWWA is a regional association of organizations operating in the water and wastewater sectors whose mission is the delivery of quality water-related services that enhance the well-being of people throughout the region. The membership comprises of various Pacific water stakeholders including the Pacific Island water and wastewater utilities, international water authorities and associations, private sector equipment and service supply companies, contractors and consultants.
Benchmarking Report 2016 uto v8.indd 11 2/08/16 12:51 PM
1 2 | B E N C H M A R K I N G R E P O R T
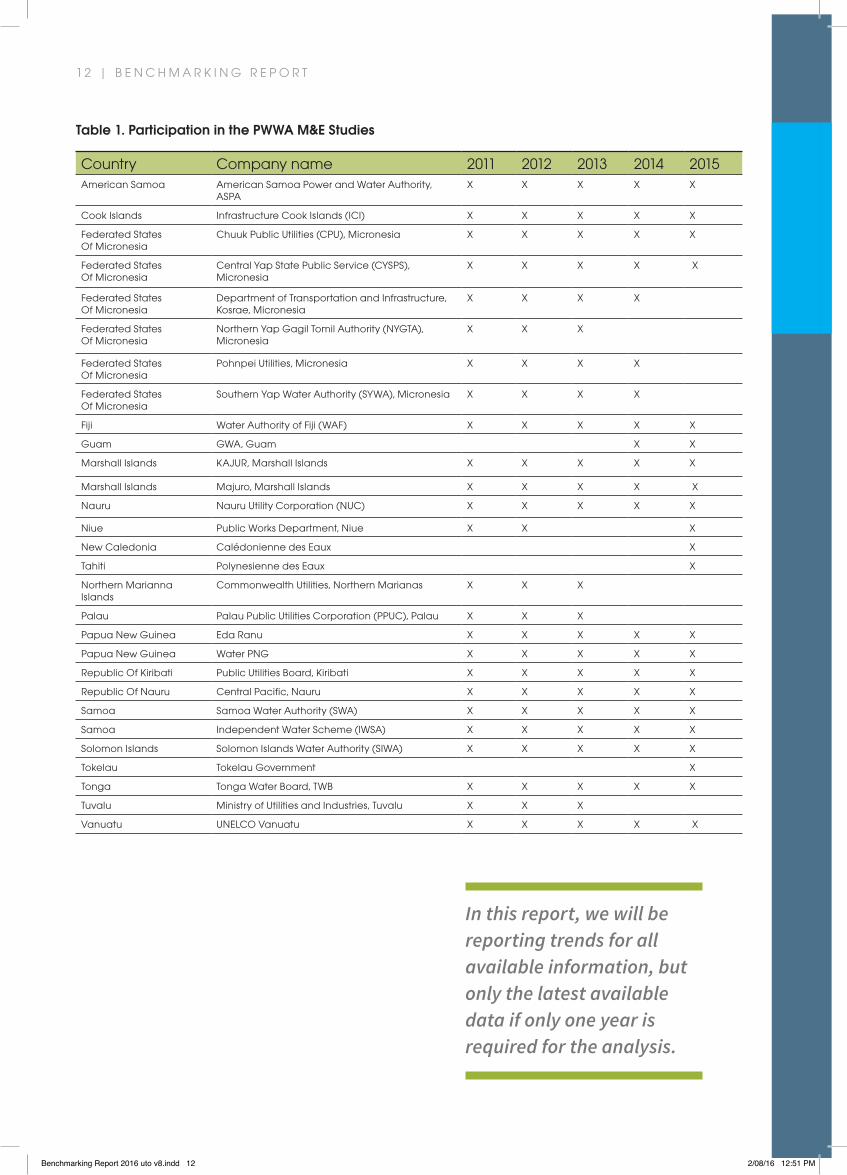
Table 1. Participation in the PWWA M&E Studies
Country Company name 2011 2012 2013 2014 2015American Samoa American Samoa Power and Water Authority,
ASPAX X X X X
Cook Islands Infrastructure Cook Islands (ICI) X X X X X
Federated States Of Micronesia
Chuuk Public Utilities (CPU), Micronesia X X X X X
Federated States Of Micronesia
Central Yap State Public Service (CYSPS), Micronesia
X X X X X
Federated States Of Micronesia
Department of Transportation and Infrastructure, Kosrae, Micronesia
X X X X
Federated States Of Micronesia
Northern Yap Gagil Tomil Authority (NYGTA), Micronesia
X X X
Federated States Of Micronesia
Pohnpei Utilities, Micronesia X X X X
Federated States Of Micronesia
Southern Yap Water Authority (SYWA), Micronesia X X X X
Fiji Water Authority of Fiji (WAF) X X X X X
Guam GWA, Guam X X
Marshall Islands KAJUR, Marshall Islands X X X X X
Marshall Islands Majuro, Marshall Islands X X X X X
Nauru Nauru Utility Corporation (NUC) X X X X X
Niue Public Works Department, Niue X X X
New Caledonia Calédonienne des Eaux X
Tahiti Polynesienne des Eaux X
Northern Marianna Islands
Commonwealth Utilities, Northern Marianas X X X
Palau Palau Public Utilities Corporation (PPUC), Palau X X X
Papua New Guinea Eda Ranu X X X X X
Papua New Guinea Water PNG X X X X X
Republic Of Kiribati Public Utilities Board, Kiribati X X X X X
Republic Of Nauru Central Pacific, Nauru X X X X X
Samoa Samoa Water Authority (SWA) X X X X X
Samoa Independent Water Scheme (IWSA) X X X X X
Solomon Islands Solomon Islands Water Authority (SIWA) X X X X X
Tokelau Tokelau Government X
Tonga Tonga Water Board, TWB X X X X X
Tuvalu Ministry of Utilities and Industries, Tuvalu X X X
Vanuatu UNELCO Vanuatu X X X X X
In this report, we will be reporting trends for all available information, but only the latest available data if only one year is required for the analysis.
Benchmarking Report 2016 uto v8.indd 12 2/08/16 12:51 PM
B E N C H M A R K I N G R E P O R T | 1 3
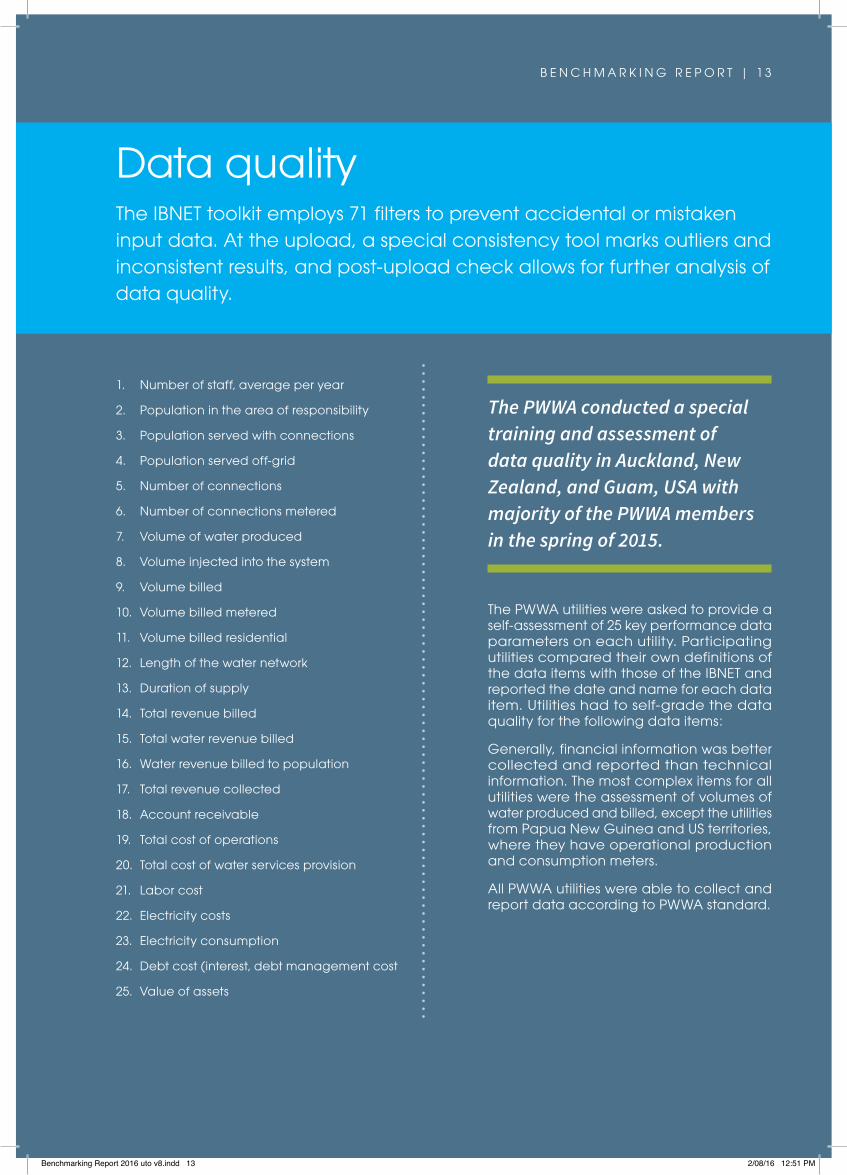
The PWWA utilities were asked to provide a self-assessment of 25 key performance data parameters on each utility. Participating utilities compared their own definitions of the data items with those of the IBNET and reported the date and name for each data item. Utilities had to self-grade the data quality for the following data items:
Generally, financial information was better collected and reported than technical information. The most complex items for all utilities were the assessment of volumes of water produced and billed, except the utilities from Papua New Guinea and US territories, where they have operational production and consumption meters.
All PWWA utilities were able to collect and report data according to PWWA standard.
Data qualityThe IBNET toolkit employs 71 filters to prevent accidental or mistaken input data. At the upload, a special consistency tool marks outliers and inconsistent results, and post-upload check allows for further analysis of data quality.
The PWWA conducted a special training and assessment of data quality in Auckland, New Zealand, and Guam, USA with majority of the PWWA members in the spring of 2015.
1. Number of staff, average per year
2. Population in the area of responsibility
3. Population served with connections
4. Population served off-grid
5. Number of connections
6. Number of connections metered
7. Volume of water produced
8. Volume injected into the system
9. Volume billed
10. Volume billed metered
11. Volume billed residential
12. Length of the water network
13. Duration of supply
14. Total revenue billed
15. Total water revenue billed
16. Water revenue billed to population
17. Total revenue collected
18. Account receivable
19. Total cost of operations
20. Total cost of water services provision
21. Labor cost
22. Electricity costs
23. Electricity consumption
24. Debt cost (interest, debt management cost
25. Value of assets
Benchmarking Report 2016 uto v8.indd 13 2/08/16 12:51 PM
1 4 | B E N C H M A R K I N G R E P O R T
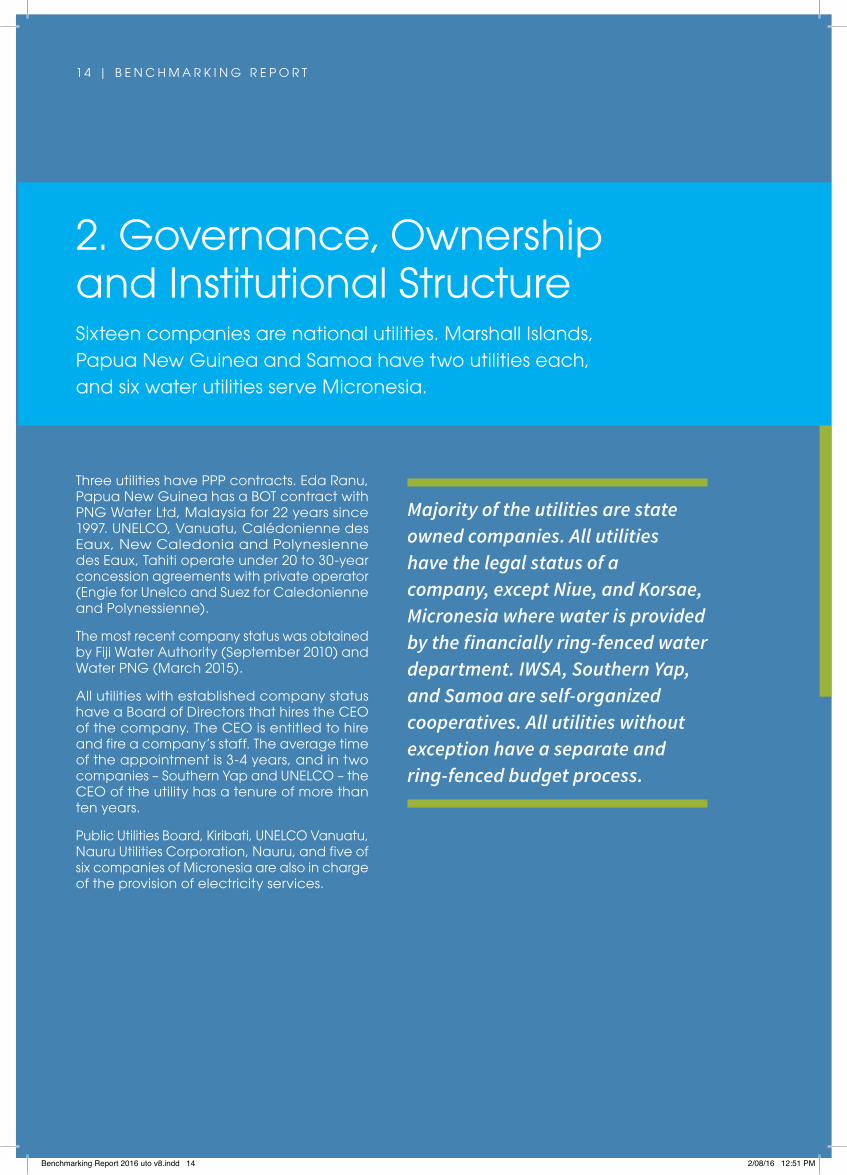
2. Governance, Ownership and Institutional StructureSixteen companies are national utilities. Marshall Islands, Papua New Guinea and Samoa have two utilities each, and six water utilities serve Micronesia.
Three utilities have PPP contracts. Eda Ranu, Papua New Guinea has a BOT contract with PNG Water Ltd, Malaysia for 22 years since 1997. UNELCO, Vanuatu, Calédonienne des Eaux, New Caledonia and Polynesienne des Eaux, Tahiti operate under 20 to 30-year concession agreements with private operator (Engie for Unelco and Suez for Caledonienne and Polynessienne).
The most recent company status was obtained by Fiji Water Authority (September 2010) and Water PNG (March 2015).
All utilities with established company status have a Board of Directors that hires the CEO of the company. The CEO is entitled to hire and fire a company’s staff. The average time of the appointment is 3-4 years, and in two companies – Southern Yap and UNELCO – the CEO of the utility has a tenure of more than ten years.
Public Utilities Board, Kiribati, UNELCO Vanuatu, Nauru Utilities Corporation, Nauru, and five of six companies of Micronesia are also in charge of the provision of electricity services.
Majority of the utilities are state owned companies. All utilities have the legal status of a company, except Niue, and Korsae, Micronesia where water is provided by the financially ring-fenced water department. IWSA, Southern Yap, and Samoa are self-organized cooperatives. All utilities without exception have a separate and ring-fenced budget process.
Benchmarking Report 2016 uto v8.indd 14 2/08/16 12:51 PM
B E N C H M A R K I N G R E P O R T | 1 5
3. Investment and Investment PlanningInvestment is a significant issue for the PWWA utilities. Nauru Utility and Kosrae Water, Micronesia never had an investment project, while Public Utilities Board, Kiribati, and Southern Yap and Central Yap, both in Micronesia completed their last investment more than 10 years ago.
Pohnpei Utilities Corp., Micronesia completed its last investment project four years ago. Majuro, Marshall Islands completed its last project in 2001, and currently has an ongoing project. This does not necessarily mean that there are no investments at all in the service. Instead they might have been fully taken in charge directly by the Government or they never appear in the utility’s balance sheet.
Larger utilities have investment plans and programs that are financed through grants or loans to the Government, while utilities get assets on their balance sheet after the project completion. ADB is the most active agency that implements projects in two
utilities (WAF, Fiji and Pohnpei Micronesia), and JICA supports investments in Samoa and the Solomon Islands. The World Bank is preparing a large investment project in Water-PNG, Papua New Guinea.
US territories, specifically Guam and American Samoa have stable pipelines of investment projects.
At the same time, almost every utility has an investment plan and at least one shovel-ready project. Below is the list of the most urgent projects identified by utilities - all of them have prepared concept documents and in many cases, feasibility studies.
Benchmarking Report 2016 uto v8.indd 15 2/08/16 12:51 PM
1 6 | B E N C H M A R K I N G R E P O R T
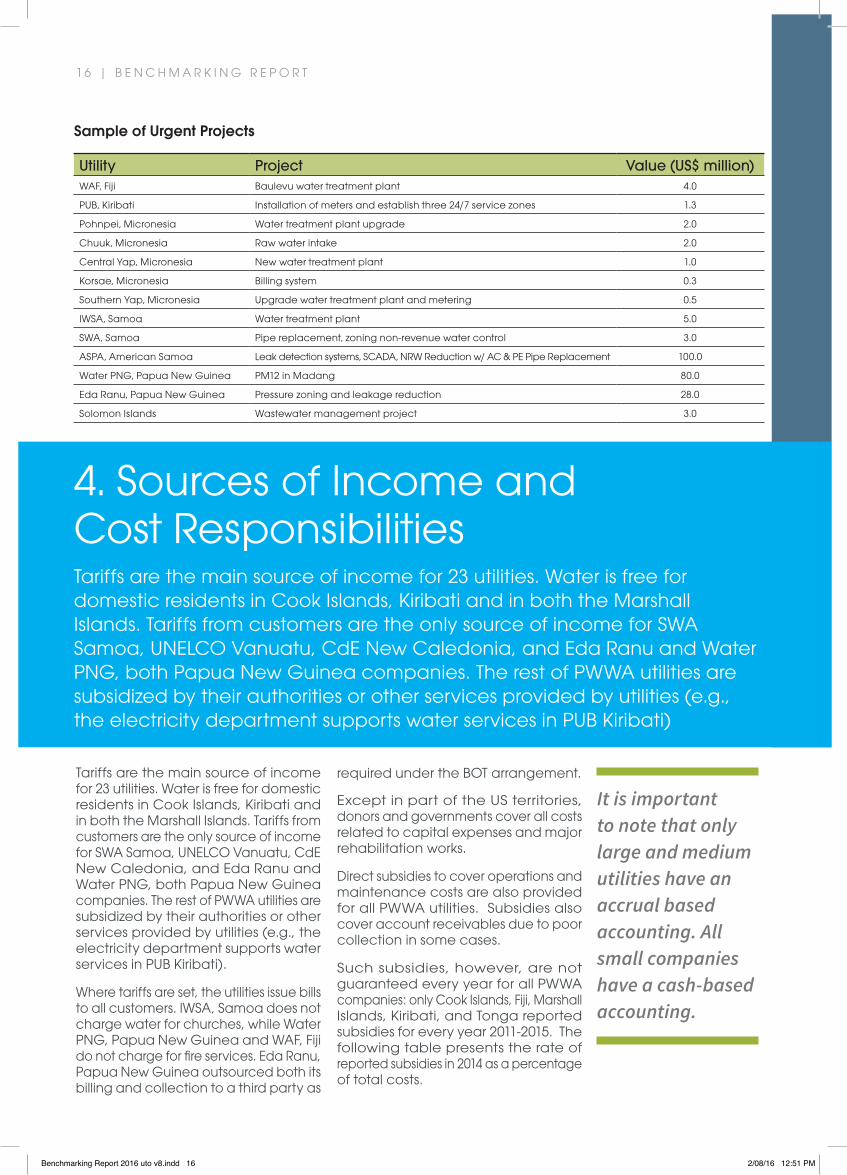
4. Sources of Income and Cost ResponsibilitiesTariffs are the main source of income for 23 utilities. Water is free for domestic residents in Cook Islands, Kiribati and in both the Marshall Islands. Tariffs from customers are the only source of income for SWA Samoa, UNELCO Vanuatu, CdE New Caledonia, and Eda Ranu and Water PNG, both Papua New Guinea companies. The rest of PWWA utilities are subsidized by their authorities or other services provided by utilities (e.g., the electricity department supports water services in PUB Kiribati)
Tariffs are the main source of income for 23 utilities. Water is free for domestic residents in Cook Islands, Kiribati and in both the Marshall Islands. Tariffs from customers are the only source of income for SWA Samoa, UNELCO Vanuatu, CdE New Caledonia, and Eda Ranu and Water PNG, both Papua New Guinea companies. The rest of PWWA utilities are subsidized by their authorities or other services provided by utilities (e.g., the electricity department supports water services in PUB Kiribati).
Where tariffs are set, the utilities issue bills to all customers. IWSA, Samoa does not charge water for churches, while Water PNG, Papua New Guinea and WAF, Fiji do not charge for fire services. Eda Ranu, Papua New Guinea outsourced both its billing and collection to a third party as
required under the BOT arrangement.
Except in part of the US territories, donors and governments cover all costs related to capital expenses and major rehabilitation works.
Direct subsidies to cover operations and maintenance costs are also provided for all PWWA utilities. Subsidies also cover account receivables due to poor collection in some cases.
Such subsidies, however, are not guaranteed every year for all PWWA companies: only Cook Islands, Fiji, Marshall Islands, Kiribati, and Tonga reported subsidies for every year 2011-2015. The following table presents the rate of reported subsidies in 2014 as a percentage of total costs.
It is important to note that only large and medium utilities have an accrual based accounting. All small companies have a cash-based accounting.
Sample of Urgent Projects
Utility Project Value (US$ million)WAF, Fiji Baulevu water treatment plant 4.0
PUB, Kiribati Installation of meters and establish three 24/7 service zones 1.3
Pohnpei, Micronesia Water treatment plant upgrade 2.0
Chuuk, Micronesia Raw water intake 2.0
Central Yap, Micronesia New water treatment plant 1.0
Korsae, Micronesia Billing system 0.3
Southern Yap, Micronesia Upgrade water treatment plant and metering 0.5
IWSA, Samoa Water treatment plant 5.0
SWA, Samoa Pipe replacement, zoning non-revenue water control 3.0
ASPA, American Samoa Leak detection systems, SCADA, NRW Reduction w/ AC & PE Pipe Replacement 100.0
Water PNG, Papua New Guinea PM12 in Madang 80.0
Eda Ranu, Papua New Guinea Pressure zoning and leakage reduction 28.0
Solomon Islands Wastewater management project 3.0
Benchmarking Report 2016 uto v8.indd 16 2/08/16 12:51 PM
B E N C H M A R K I N G R E P O R T | 17
Fig. 1
Reported Rate of Direct Subsidies, % of the total cost
GWA, Guam, in addition to all other cost elements, pays for all environmental fees.
We can observe that several utilities (usually combined with power) are excused from payment for electricity.
There might also be additional indirect subsidies. The following table presents cost responsibilities for PWWA utilities that is covered by revenue of sales and direct operational subsidies. We can observe that several utilities (usually combined with power) are excused from payment for electricity.
Benchmarking Report 2016 uto v8.indd 17 2/08/16 12:51 PM
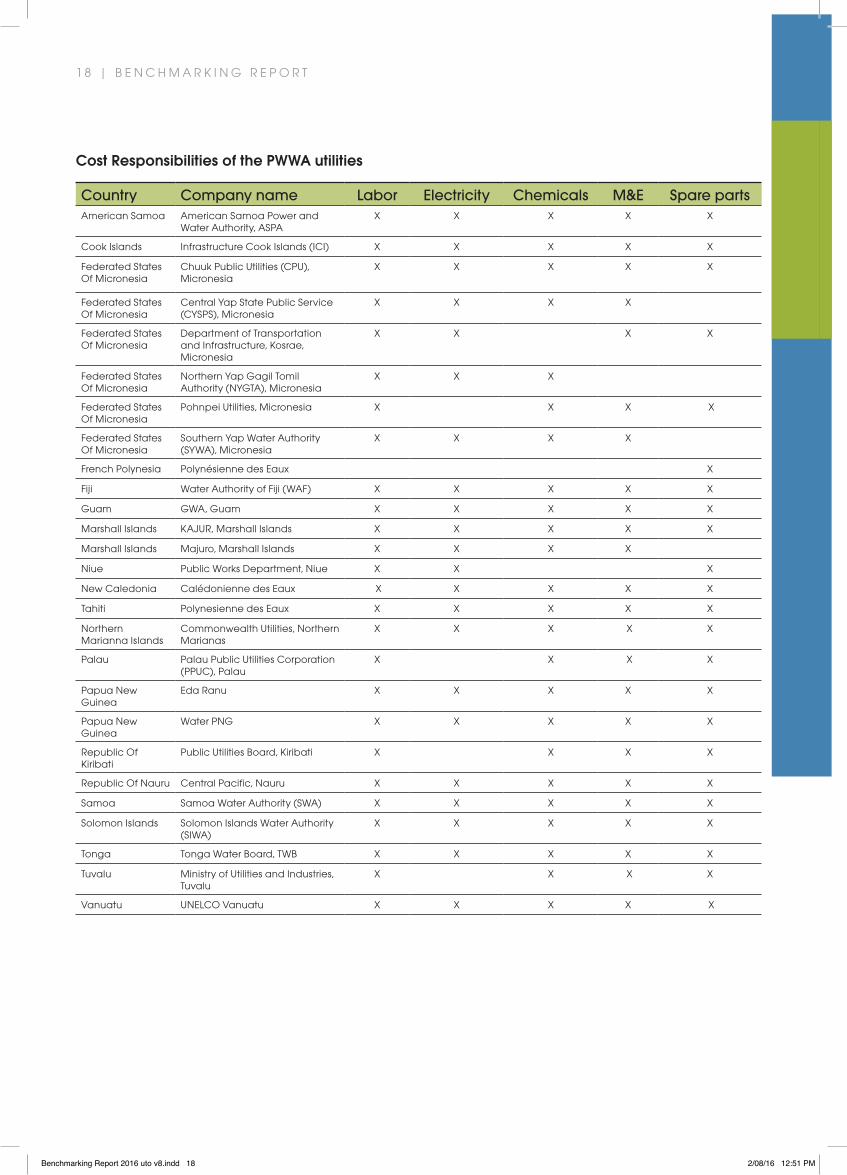
Cost Responsibilities of the PWWA utilities
Country Company name Labor Electricity Chemicals M&E Spare partsAmerican Samoa American Samoa Power and
Water Authority, ASPAX X X X X
Cook Islands Infrastructure Cook Islands (ICI) X X X X X
Federated States Of Micronesia
Chuuk Public Utilities (CPU), Micronesia
X X X X X
Federated States Of Micronesia
Central Yap State Public Service (CYSPS), Micronesia
X X X X
Federated States Of Micronesia
Department of Transportation and Infrastructure, Kosrae, Micronesia
X X X X
Federated States Of Micronesia
Northern Yap Gagil Tomil Authority (NYGTA), Micronesia
X X X
Federated States Of Micronesia
Pohnpei Utilities, Micronesia X X X X
Federated States Of Micronesia
Southern Yap Water Authority (SYWA), Micronesia
X X X X
French Polynesia Polynésienne des Eaux X
Fiji Water Authority of Fiji (WAF) X X X X X
Guam GWA, Guam X X X X X
Marshall Islands KAJUR, Marshall Islands X X X X X
Marshall Islands Majuro, Marshall Islands X X X X
Niue Public Works Department, Niue X X X
New Caledonia Calédonienne des Eaux X X X X X
Tahiti Polynesienne des Eaux X X X X X
Northern Marianna Islands
Commonwealth Utilities, Northern Marianas
X X X X X
Palau Palau Public Utilities Corporation (PPUC), Palau
X X X X
Papua New Guinea
Eda Ranu X X X X X
Papua New Guinea
Water PNG X X X X X
Republic Of Kiribati
Public Utilities Board, Kiribati X X X X
Republic Of Nauru Central Pacific, Nauru X X X X X
Samoa Samoa Water Authority (SWA) X X X X X
Solomon Islands Solomon Islands Water Authority (SIWA)
X X X X X
Tonga Tonga Water Board, TWB X X X X X
Tuvalu Ministry of Utilities and Industries, Tuvalu
X X X X
Vanuatu UNELCO Vanuatu X X X X X
1 8 | B E N C H M A R K I N G R E P O R T
Benchmarking Report 2016 uto v8.indd 18 2/08/16 12:51 PM

Fig. 2
Average domestic tariff, US$/m3 (as of 01.01.2016) at monthly consumption 15 m3/connection
*Nauru tariffs are for wholesale if purchased directly at water treatment plant. Retail tariff is US$60/m3 if delivered to residence by truck.
Water tariff systems in PWWA utilities are usually set based on metered consumption. Typically, a utility tariff system would be based on an Increasing Block Tariff system (IBT) and consist of several blocks, connection fee and taxes. The first block is usually set to guarantee water to consumers with lower income. Such Increased Block Tariff system is employed everywhere, except in Papua New Guinea (PNG), which employs a Jump Block Tariff System (JBT) where each block of consumption has its own rate, and Kiribati with flat connection fee for each connected customer. Kiribati set its tariffs in 2016 for the first time. PNG tariff system is theoretically more equitable than the standard IBT system, where the privileged tariff of the first block would also benefit users consuming in higher blocks, and therefore generate an a priori inclusion error (e.g. users benefiting from a lower tariff when they should not).
The following table presents the average water tariffs per country1:
B E N C H M A R K I N G R E P O R T | 1 9
Tariffs and tariff systemsAs a rule, utilities develop a tariff proposal for its board of directors and then the appropriate authority approves the new tariffs. US territories update their tariffs annually, while others update their tariffs every three or four years.
Benchmarking Report 2016 uto v8.indd 19 2/08/16 12:51 PM

2 0 | B E N C H M A R K I N G R E P O R T
High monthly fixed charge in many companies results in higher tariffs for lower consumption per month. This is why some tariff systems suppress the fixed charge for low income/low consumption users. In addition, their revenues are generally not wella predictable and constant, as it is hard for customers to pay a monthly fixed charge.
Utilities have the same structure for wastewater tariffs using water consumption as a proxy for wastewater discharge, except Kiribati, Guam, and American Samoa whose wastewater tariffs have a flat structure (a monthly fixed charge regardless of volume discharge).
The following table presents effective average wastewater tariffs for the PWWA utilities.
Tariffs per different consumption (US$/m3)
Monthly consumption, m3Country 6.00 50.00 100.00
Guam 4.38 2.41 2.57
Republic Of Nauru 2.82 2.82 2.82
Northern Marianna Islands 2.98 1.60 1.63
American Samoa 3.36 1.24 1.18
French Polynesia 1.13 0.90 1.18
Vanuatu 1.28 0.83 0.86
Solomon Islands 0.77 1.12 1.23
Republic Of Kiribati 2.19 0.26 0.13
Federated States Of Micronesia 1.22 0.69 0.76
SWA, Samoa 0.21 0.52 0.66
Eda Ranu, Papua New Guinea 0.26 0.45 1.20
Palau 0.22 0.22 0.22
Water PNG 0.10 1.91 1.91
Cook Islands - - -
Fig. 3
Average domestic wastewater tariffs, US$/m3 (as of 01.01.2016) monthly consumption is 15 m3/connection
Benchmarking Report 2016 uto v8.indd 20 2/08/16 12:51 PM

B E N C H M A R K I N G R E P O R T | 2 1
Indicator 1.1 Water coverage The PWWA water utilities continue to improve their coverage, stably serving about 85-90 percent of their customers, with a somewhat positive trend in recent years.
Individually, utilities in countries with lower GNI per capita perform worse than those in the richer countries. The lowest coverage is reported from utilities with the lowest water availability. WAF Fiji is actively expanding into suburban and rural areas, so its coverage is higher than 100%.
Chapter 2 Performance results
Fig. 4
Water coverage, 2011-2015
Benchmarking Report 2016 uto v8.indd 21 2/08/16 12:51 PM
2 2 | B E N C H M A R K I N G R E P O R T
2.1 Wastewater coverageSixteen of the PWWA utilities provide wastewater services through piped wastewater network. Overall, wastewater coverage tends to drop in PWWA utilities on average due to ongoing urbanization in large number of countries such as Fiji and Papua New Guinea.
Fig 5.
Water Coverage, % (2014). Indicator 1.1
Benchmarking Report 2016 uto v8.indd 22 2/08/16 12:51 PM
B E N C H M A R K I N G R E P O R T | 2 3
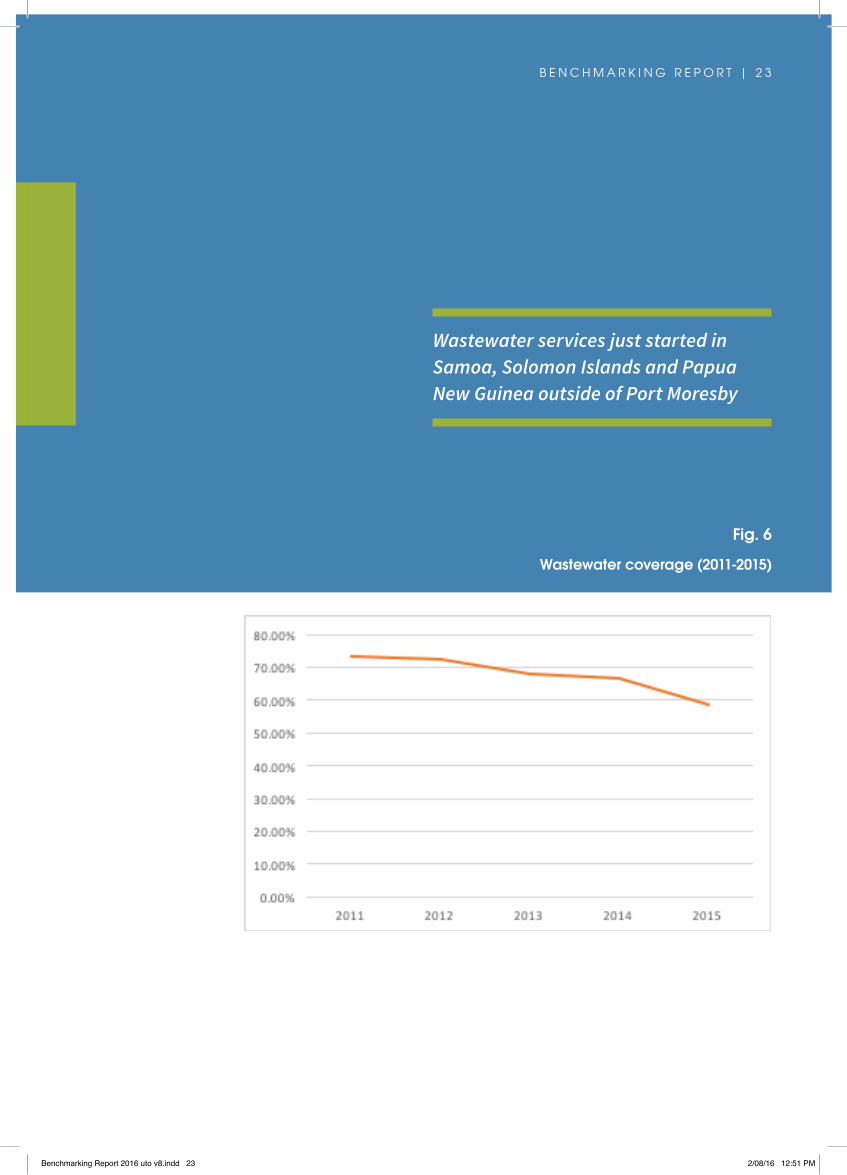
Fig. 6
Wastewater coverage (2011-2015)
Wastewater services just started in Samoa, Solomon Islands and Papua New Guinea outside of Port Moresby
Benchmarking Report 2016 uto v8.indd 23 2/08/16 12:51 PM
2 4 | B E N C H M A R K I N G R E P O R T
Hours of operationsThe majority of PWWA utilities provide water 24 hours a day, seven days a week. The overall trend is positive and increased from 17 to 21 hours on average in the period between 2011 and 2015.
Fig 7.
Wastewater services coverage, % (2014), Indicator 2.1
Benchmarking Report 2016 uto v8.indd 24 2/08/16 12:51 PM
B E N C H M A R K I N G R E P O R T | 2 5
Fig 8.
Hours of operation per day on average (2014), Indicator 15.1
Nauru distributes water in trucks. Marshall Islands companies have to ration water due to significant issues with water availability. Kiribati and Solomon Islands companies are working on expanding their working hours.
Benchmarking Report 2016 uto v8.indd 25 2/08/16 12:51 PM
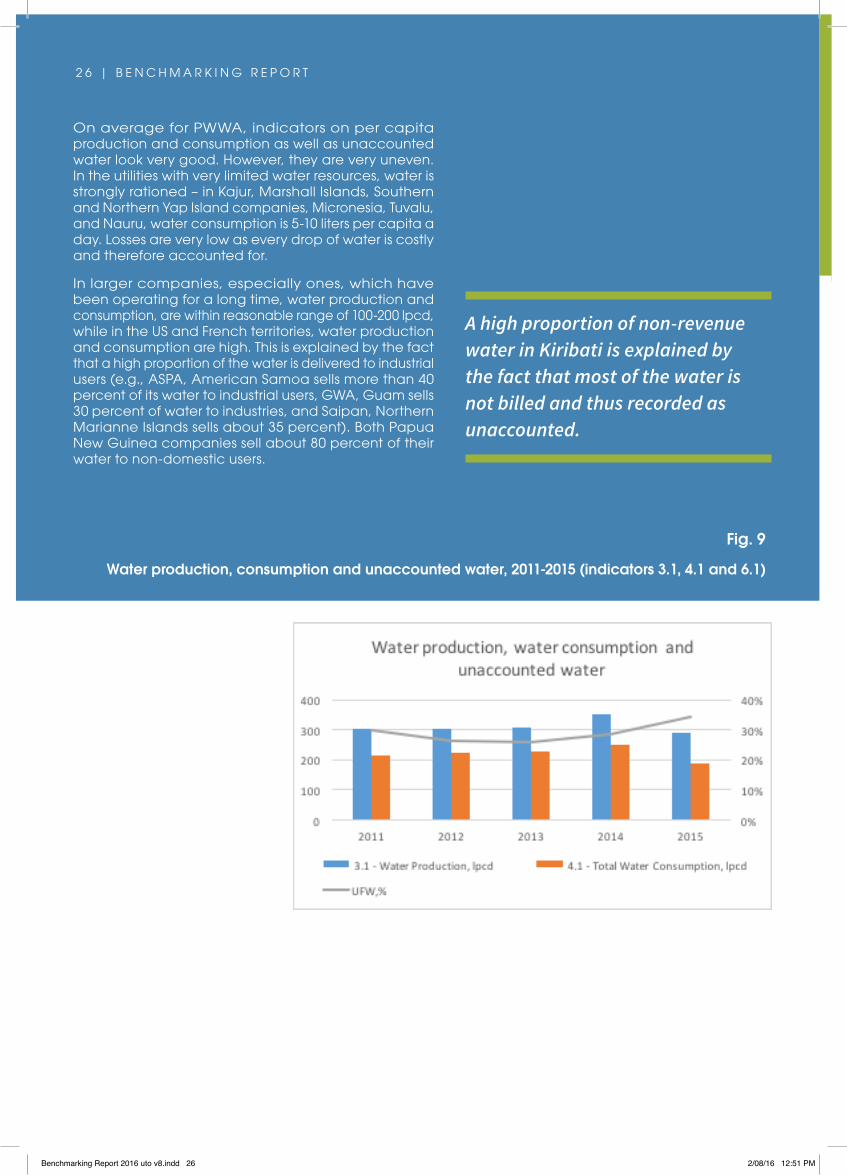
Fig. 9
Water production, consumption and unaccounted water, 2011-2015 (indicators 3.1, 4.1 and 6.1)
2 6 | B E N C H M A R K I N G R E P O R T
On average for PWWA, indicators on per capita production and consumption as well as unaccounted water look very good. However, they are very uneven. In the utilities with very limited water resources, water is strongly rationed – in Kajur, Marshall Islands, Southern and Northern Yap Island companies, Micronesia, Tuvalu, and Nauru, water consumption is 5-10 liters per capita a day. Losses are very low as every drop of water is costly and therefore accounted for.
In larger companies, especially ones, which have been operating for a long time, water production and consumption, are within reasonable range of 100-200 lpcd, while in the US and French territories, water production and consumption are high. This is explained by the fact that a high proportion of the water is delivered to industrial users (e.g., ASPA, American Samoa sells more than 40 percent of its water to industrial users, GWA, Guam sells 30 percent of water to industries, and Saipan, Northern Marianne Islands sells about 35 percent). Both Papua New Guinea companies sell about 80 percent of their water to non-domestic users.
A high proportion of non-revenue water in Kiribati is explained by the fact that most of the water is not billed and thus recorded as unaccounted.
Benchmarking Report 2016 uto v8.indd 26 2/08/16 12:51 PM
B E N C H M A R K I N G R E P O R T | 2 7
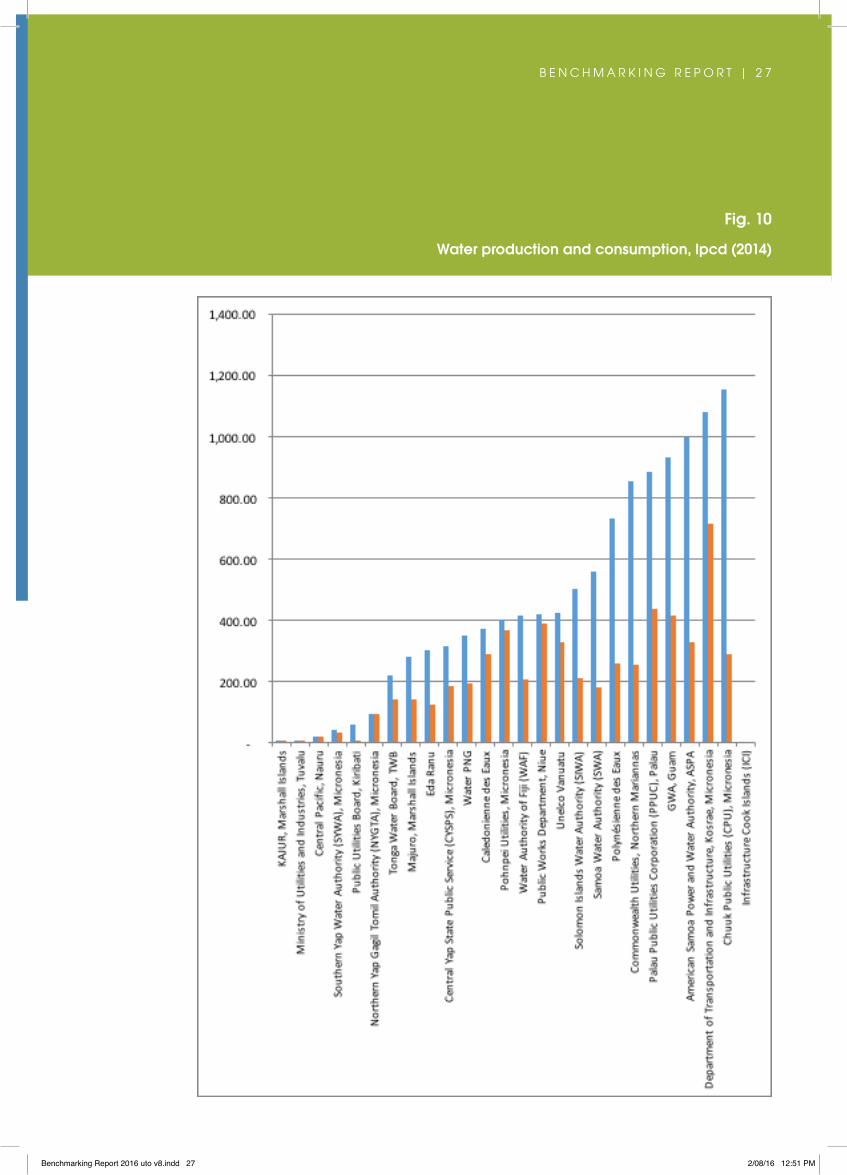
Fig. 10
Water production and consumption, lpcd (2014)
Benchmarking Report 2016 uto v8.indd 27 2/08/16 12:51 PM

2 8 | B E N C H M A R K I N G R E P O R T
Fig. 11
Unaccounted for water, % (Indicator 6.1)
Unaccounted water (UFW) is an issue for majority of the PWWA companies. In fact, 12 of the 16 utilities, which reported unaccounted water declared a need for investments in the networks. This is because a substantial proportion of their network was built in the period during 1960s-1980s, and has since never been replaced or undergone a major rehabilitation. It is clear that fresh water availability is not an issue for these companies, and the governance structure of these utilities allows passing the cost of these losses to customers. At the same time, the UFW management is considered a complex and expensive task for many PWWA companies. This task may require a large financial and technical support.
Only GWA, Guam has an operational SCADA system that tracks pressure and consumption within its networks.
GWA is also the only utility with an automatic system that installs electronic water meters for every customer, a precondition to any reasonable action addressing UFW.
Benchmarking Report 2016 uto v8.indd 28 2/08/16 12:51 PM
B E N C H M A R K I N G R E P O R T | 2 9
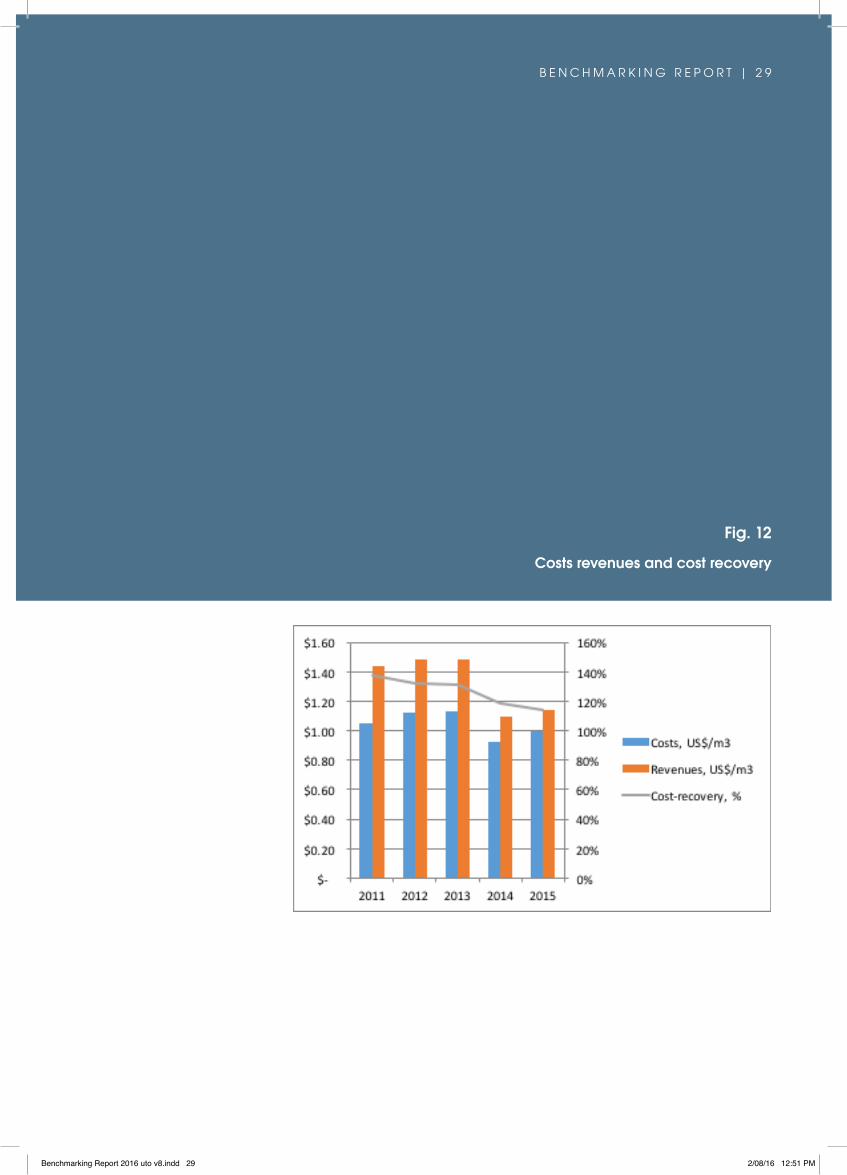
Fig. 12
Costs revenues and cost recovery
Benchmarking Report 2016 uto v8.indd 29 2/08/16 12:51 PM
3 0 | B E N C H M A R K I N G R E P O R T
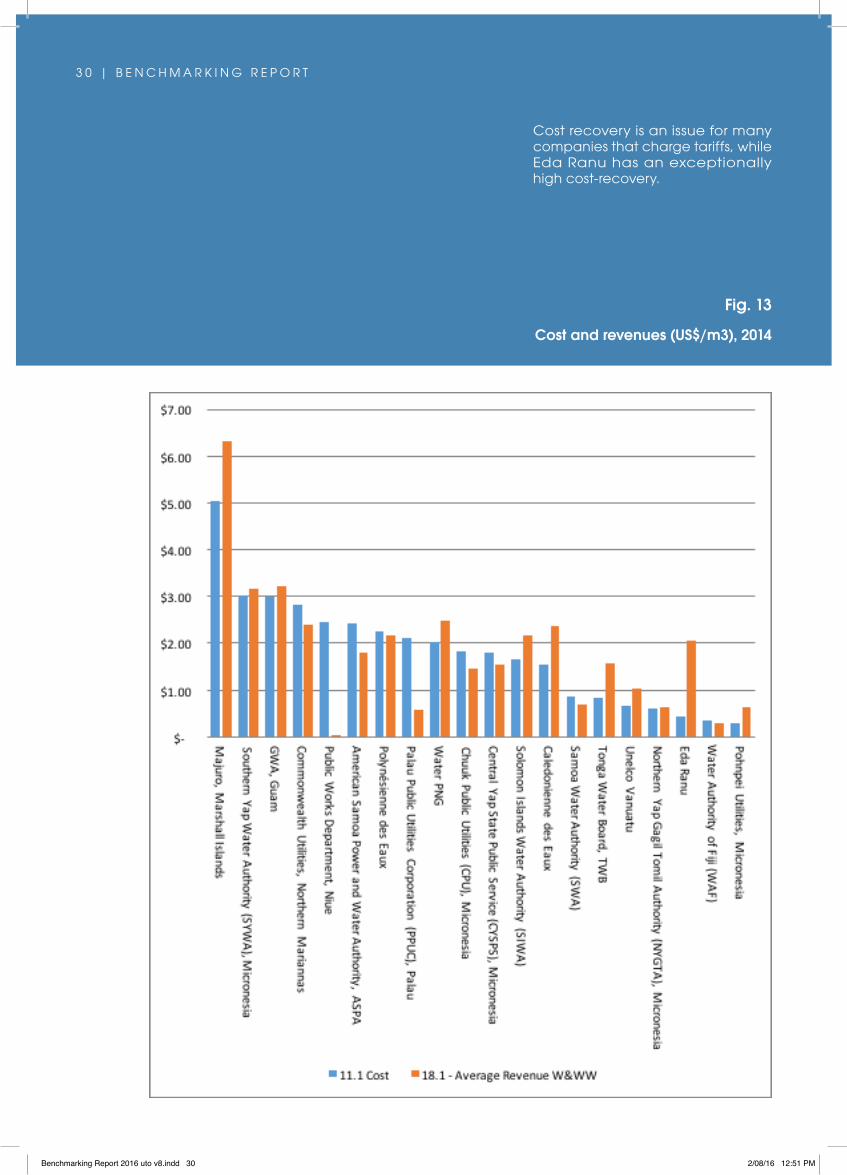
Fig. 13
Cost and revenues (US$/m3), 2014
Cost recovery is an issue for many companies that charge tariffs, while Eda Ranu has an exceptionally high cost-recovery.
Benchmarking Report 2016 uto v8.indd 30 2/08/16 12:51 PM
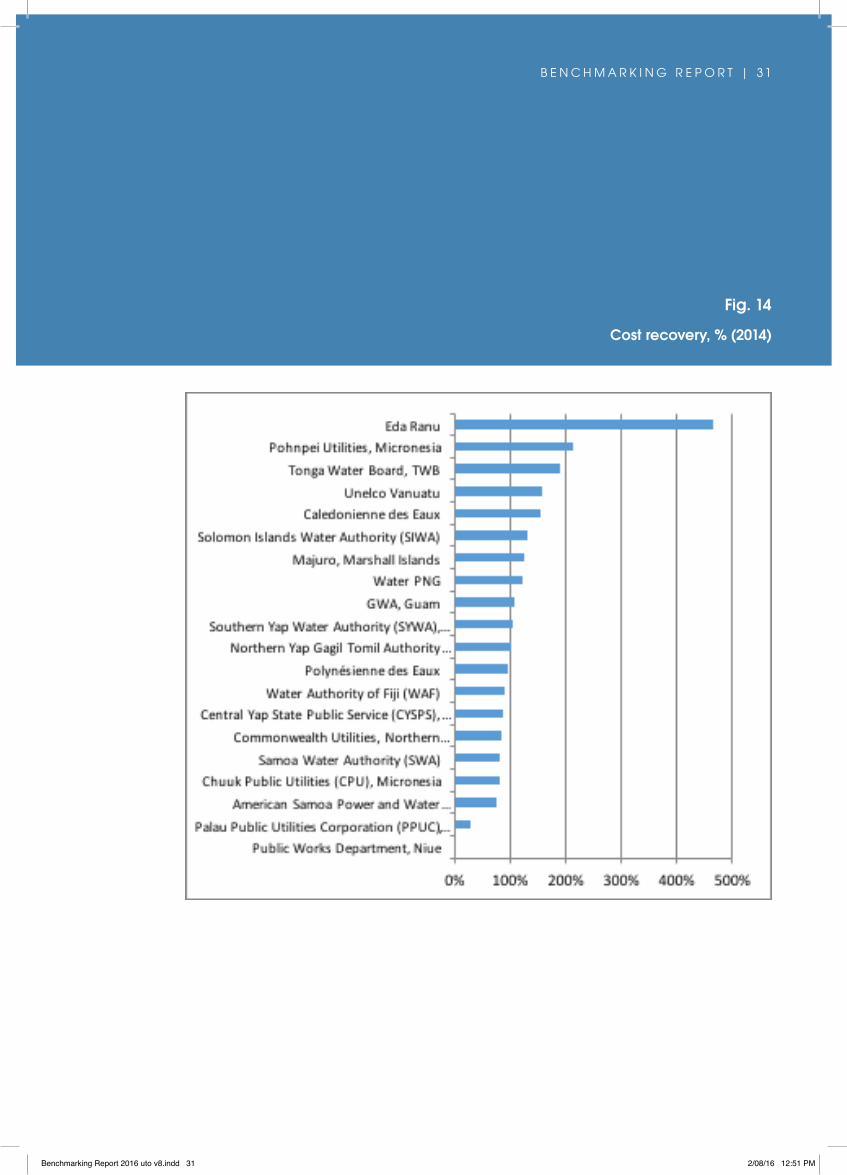
B E N C H M A R K I N G R E P O R T | 31
Fig. 14
Cost recovery, % (2014)
Benchmarking Report 2016 uto v8.indd 31 2/08/16 12:51 PM
3 2 | B E N C H M A R K I N G R E P O R T
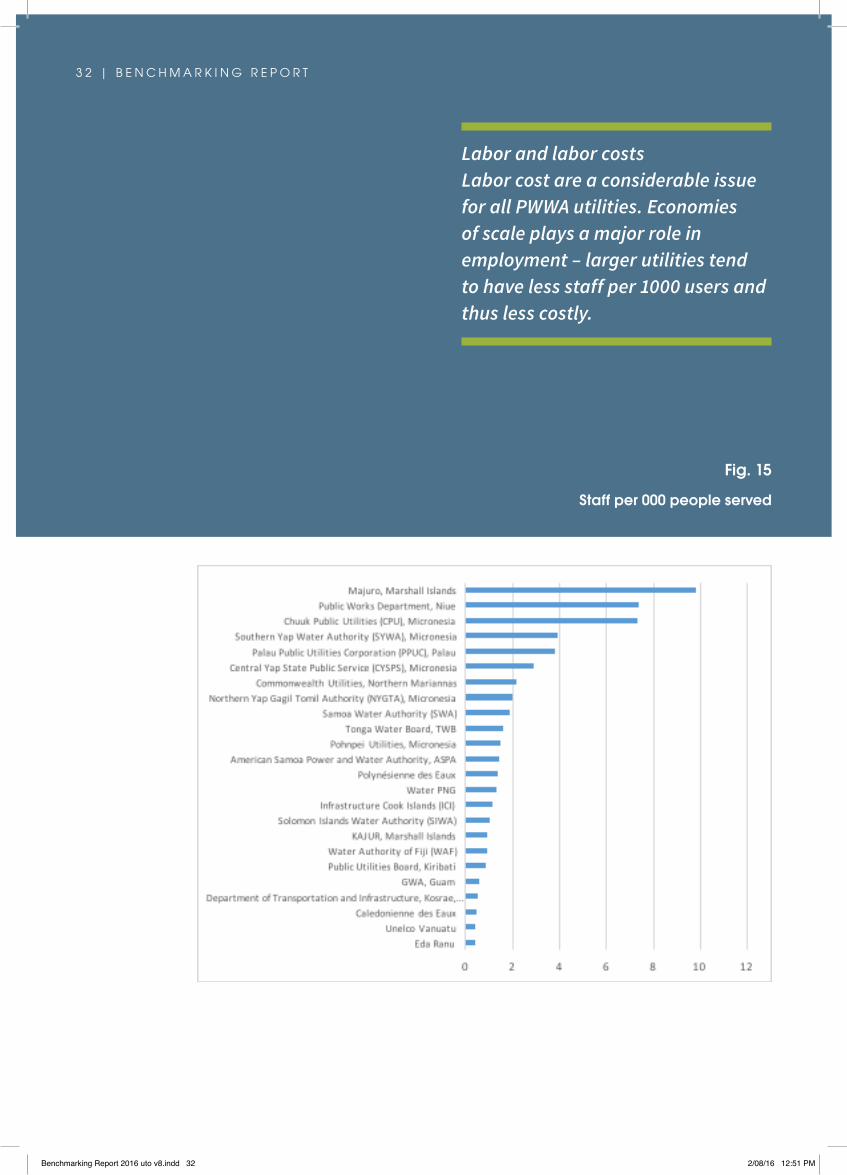
Labor and labor costs Labor cost are a considerable issue for all PWWA utilities. Economies of scale plays a major role in employment – larger utilities tend to have less staff per 1000 users and thus less costly.
Fig. 15
Staff per 000 people served
Benchmarking Report 2016 uto v8.indd 32 2/08/16 12:51 PM
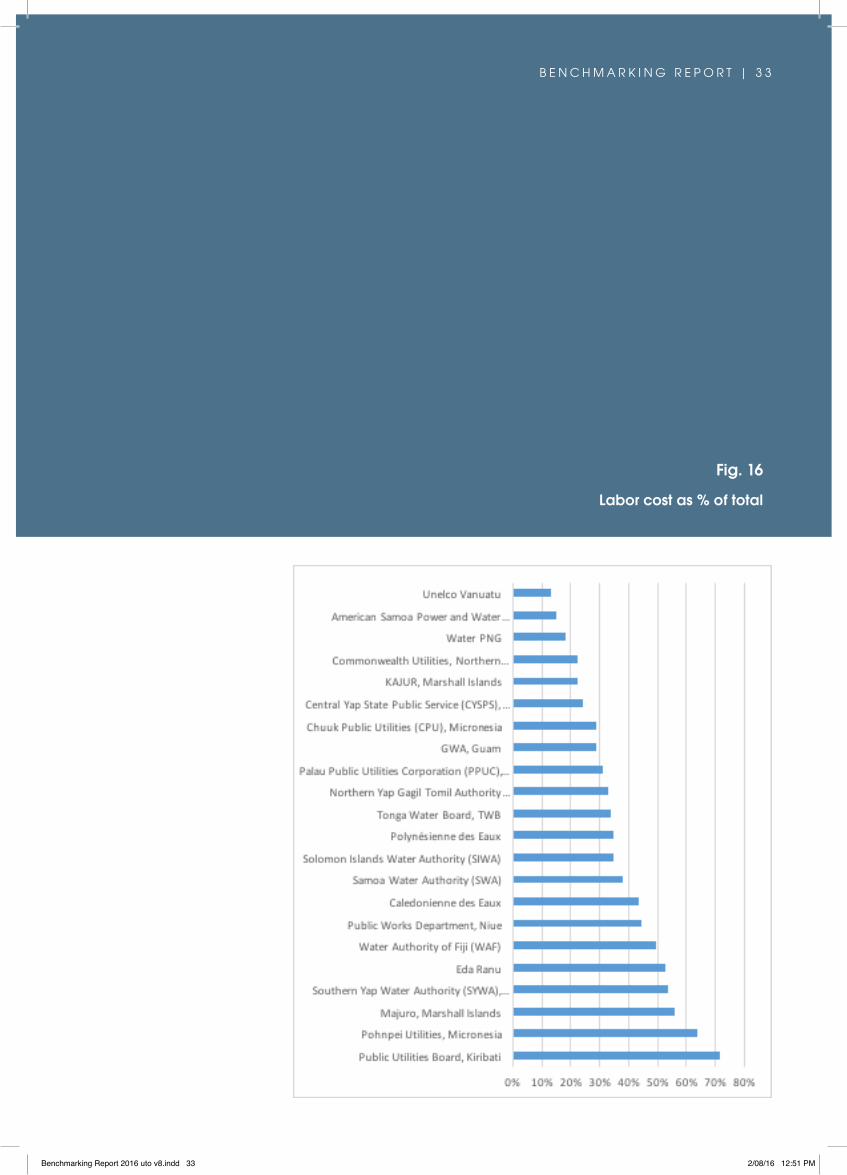
B E N C H M A R K I N G R E P O R T | 3 3
Fig. 16
Labor cost as % of total
Benchmarking Report 2016 uto v8.indd 33 2/08/16 12:51 PM
3 4 | B E N C H M A R K I N G R E P O R T
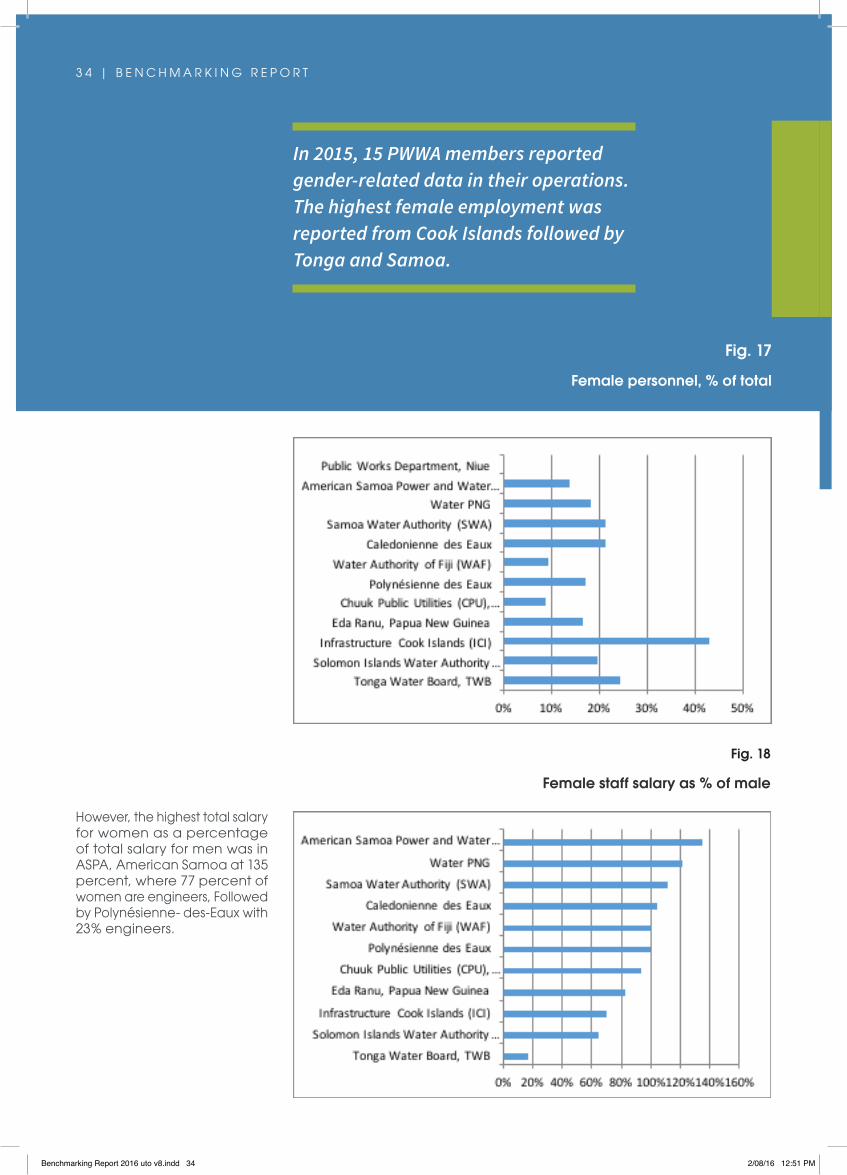
In 2015, 15 PWWA members reported gender-related data in their operations. The highest female employment was reported from Cook Islands followed by Tonga and Samoa.
However, the highest total salary for women as a percentage of total salary for men was in ASPA, American Samoa at 135 percent, where 77 percent of women are engineers, Followed by Polynésienne- des-Eaux with 23% engineers.
Fig. 17
Female personnel, % of total
Fig. 18
Female staff salary as % of male
Benchmarking Report 2016 uto v8.indd 34 2/08/16 12:51 PM
B E N C H M A R K I N G R E P O R T | 3 5
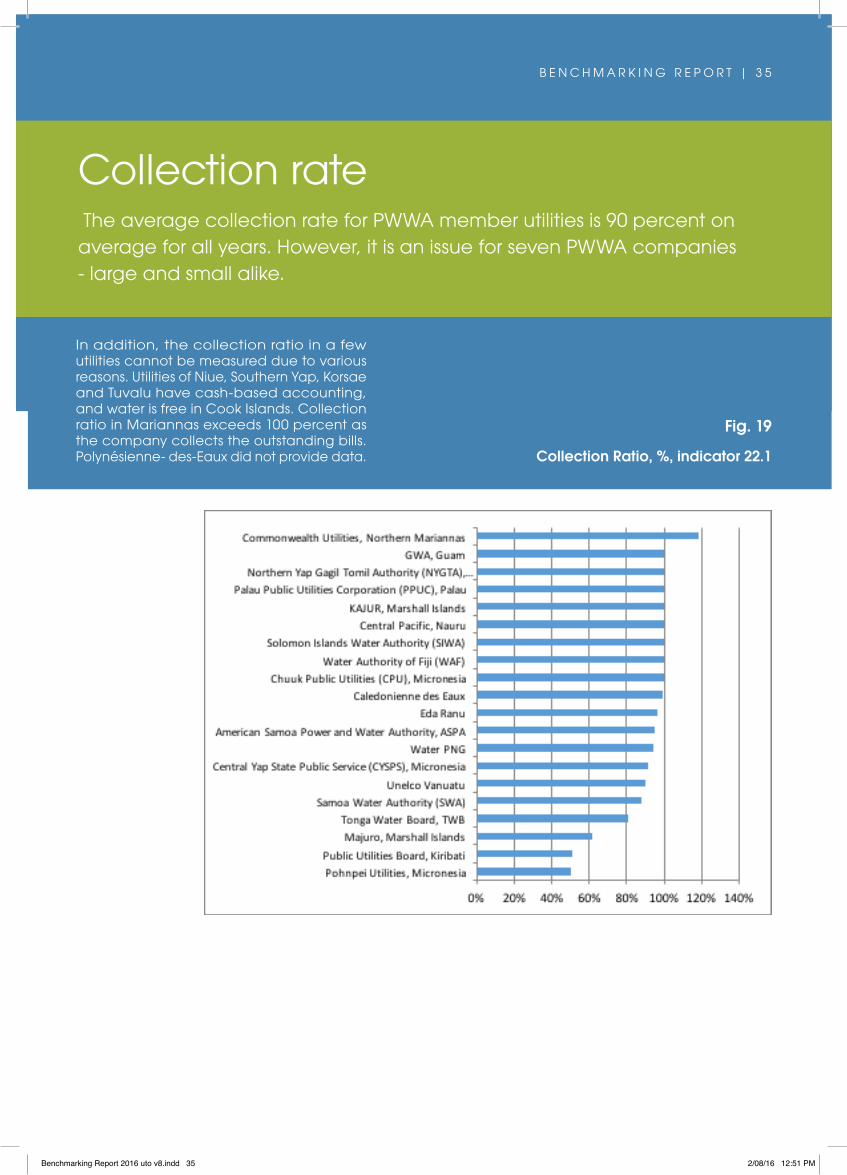
In addition, the collection ratio in a few utilities cannot be measured due to various reasons. Utilities of Niue, Southern Yap, Korsae and Tuvalu have cash-based accounting, and water is free in Cook Islands. Collection ratio in Mariannas exceeds 100 percent as the company collects the outstanding bills. Polynésienne- des-Eaux did not provide data.
Fig. 19
Collection Ratio, %, indicator 22.1
Collection rate The average collection rate for PWWA member utilities is 90 percent on average for all years. However, it is an issue for seven PWWA companies - large and small alike.
Benchmarking Report 2016 uto v8.indd 35 2/08/16 12:51 PM

3 6 | B E N C H M A R K I N G R E P O R T3 6 | B E N C H M A R K I N G R E P O R T
However, collection period remains high in companies with poor collection discipline. This needs to be addressed by companies such as Kajur and Chuuk from Micronesia, both Marshall Islands companies, Solomon Water, Solomon Islands, Water PNG, Papua New Guinea, and to an extent in in FAW, Fiji and UNELCO, Vanuatu. There is no collection in Cook Islands yet. The 2015 report significantly improved due to participation of French territories in the study that year. Tuvalu, Korsae and Saipan did not provide this information.
Fig. 20
Collection period, days, Indicator 23.1
Collection periodThe collection period has been quite high historically but has a tendency to go down on average for PWWA utilities, heading to a more reasonable three months in 2015.
Benchmarking Report 2016 uto v8.indd 36 2/08/16 12:51 PM

B E N C H M A R K I N G R E P O R T | 3 7B E N C H M A R K I N G R E P O R T | 3 7
Fig. 21
Collection period, days, Indicator 23.1 (the latest year available)
Benchmarking Report 2016 uto v8.indd 37 2/08/16 12:51 PM
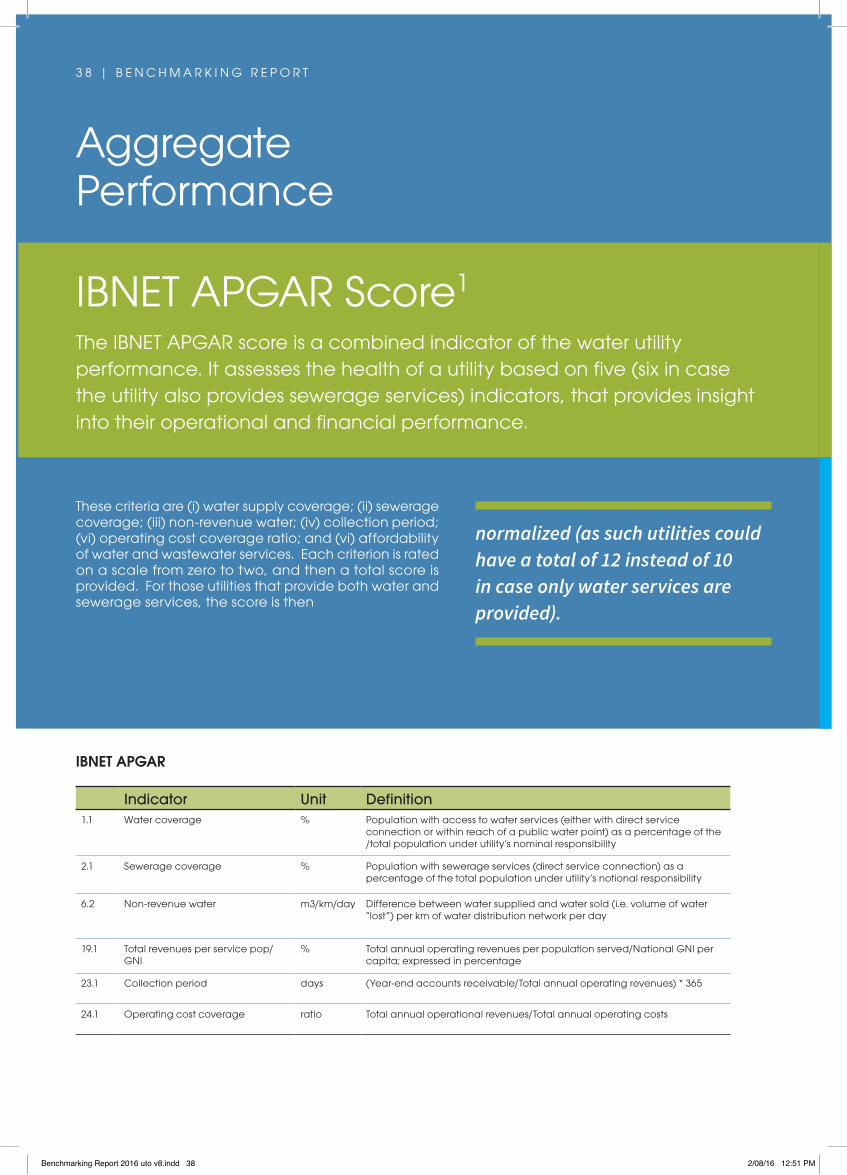
These criteria are (i) water supply coverage; (ii) sewerage coverage; (iii) non-revenue water; (iv) collection period; (vi) operating cost coverage ratio; and (vi) affordability of water and wastewater services. Each criterion is rated on a scale from zero to two, and then a total score is provided. For those utilities that provide both water and sewerage services, the score is then
3 8 | B E N C H M A R K I N G R E P O R T
IBNET APGAR Score1
The IBNET APGAR score is a combined indicator of the water utility performance. It assesses the health of a utility based on five (six in case the utility also provides sewerage services) indicators, that provides insight into their operational and financial performance.
Indicator Unit Definition1.1 Water coverage % Population with access to water services (either with direct service
connection or within reach of a public water point) as a percentage of the /total population under utility’s nominal responsibility
2.1 Sewerage coverage % Population with sewerage services (direct service connection) as a percentage of the total population under utility’s notional responsibility
6.2 Non-revenue water m3/km/day Difference between water supplied and water sold (i.e. volume of water “lost”) per km of water distribution network per day
19.1 Total revenues per service pop/GNI
% Total annual operating revenues per population served/National GNI per capita; expressed in percentage
23.1 Collection period days (Year-end accounts receivable/Total annual operating revenues) * 365
24.1 Operating cost coverage ratio Total annual operational revenues/Total annual operating costs
IBNET APGAR
normalized (as such utilities could have a total of 12 instead of 10 in case only water services are provided).
Aggregate Performance
Benchmarking Report 2016 uto v8.indd 38 2/08/16 12:51 PM
B E N C H M A R K I N G R E P O R T | 3 9
Indicator Agpar score value
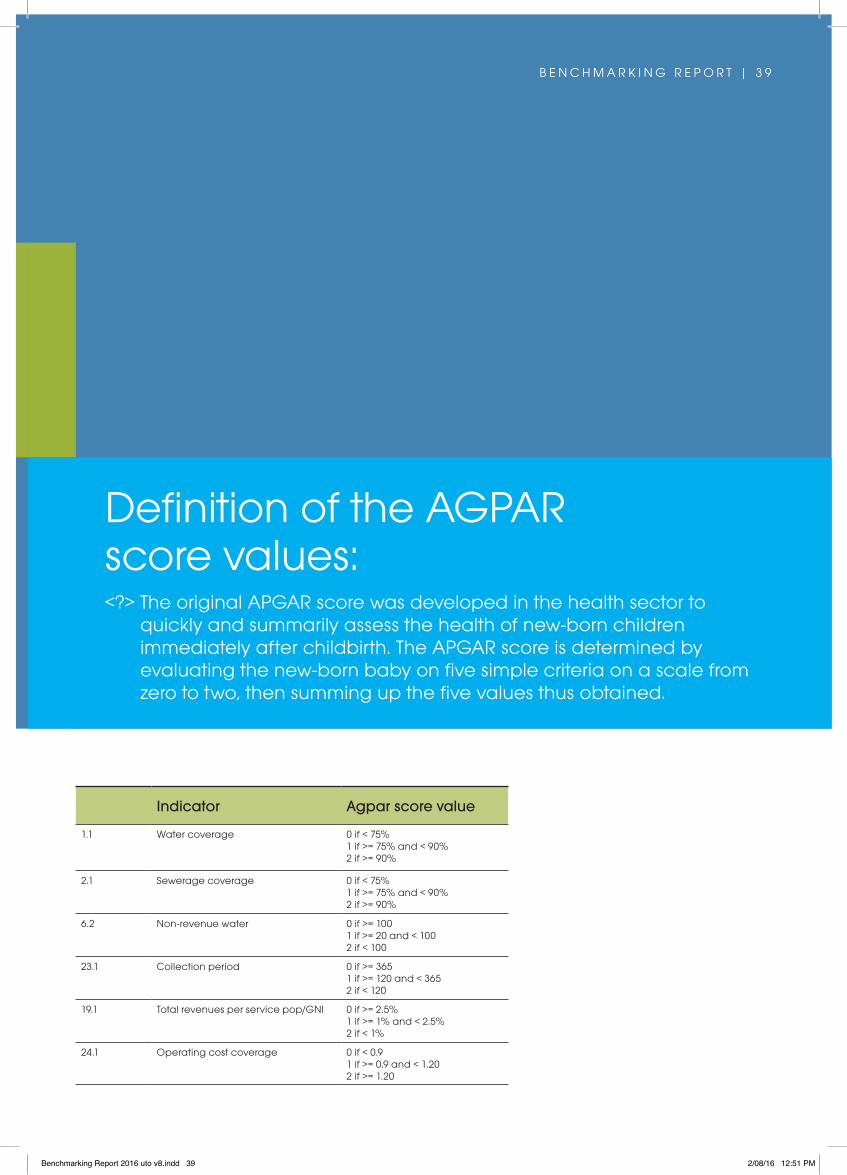
1.1 Water coverage 0 if < 75%1 if >= 75% and < 90%2 if >= 90%
2.1 Sewerage coverage 0 if < 75%1 if >= 75% and < 90%2 if >= 90%
6.2 Non-revenue water 0 if >= 1001 if >= 20 and < 1002 if < 100
23.1 Collection period 0 if >= 3651 if >= 120 and < 3652 if < 120
19.1 Total revenues per service pop/GNI 0 if >= 2.5%1 if >= 1% and < 2.5%2 if < 1%
24.1 Operating cost coverage 0 if < 0.91 if >= 0.9 and < 1.202 if >= 1.20
Definition of the AGPAR score values: <?> The original APGAR score was developed in the health sector to
quickly and summarily assess the health of new-born children immediately after childbirth. The APGAR score is determined by evaluating the new-born baby on five simple criteria on a scale from zero to two, then summing up the five values thus obtained.
Benchmarking Report 2016 uto v8.indd 39 2/08/16 12:51 PM
4 0 | B E N C H M A R K I N G R E P O R T
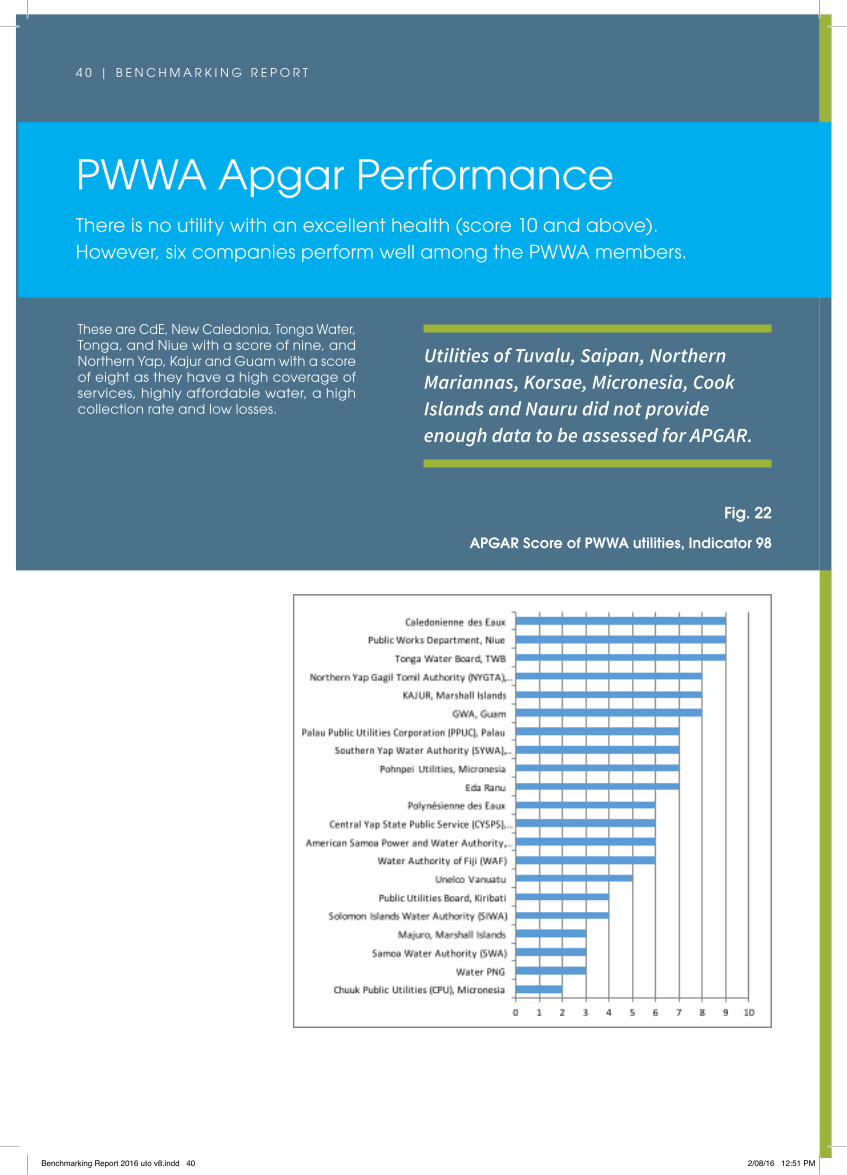
Utilities of Tuvalu, Saipan, Northern Mariannas, Korsae, Micronesia, Cook Islands and Nauru did not provide enough data to be assessed for APGAR.
Fig. 22
APGAR Score of PWWA utilities, Indicator 98
PWWA Apgar PerformanceThere is no utility with an excellent health (score 10 and above). However, six companies perform well among the PWWA members.
These are CdE, New Caledonia, Tonga Water, Tonga, and Niue with a score of nine, and Northern Yap, Kajur and Guam with a score of eight as they have a high coverage of services, highly affordable water, a high collection rate and low losses.
Benchmarking Report 2016 uto v8.indd 40 2/08/16 12:51 PM
B E N C H M A R K I N G R E P O R T | 4 1
IBNET considers three different thresholds of Apgar scores below which a utility is considered to be in a vulnerable position:
Apgar score of 3.6 (bankruptcy or complete write-off of the account receivable)
Apgar score of 5 (inability to cover costs)
Apgar score of 7 (inability of investment).
Hence, a WUVI depicts risk and the higher the threshold considered, the more “strict” the index becomes in the sense that the utility must have a high Apgar score to move out of the vulnerability zone. Second, we conceptualize a WUVI as an early warning device rather than an “actionable” index.
A high-value WUVI is a symptom of a possible future problem but does not indicate the specifics of that problem. Hence, it is envisioned that managers and policymakers would treat a high-value WUVI as an indication that further diagnostics are desirable to determine the issues faced by a particular
utility and to formulate potential remedies. From this perspective, the estimated WUVI is similar in character to many indicators already in use in other fields—most notably, the life sciences.
The determination of a WUVI is relational rather than causal. It depicts association between current values of APGAR indicators and future water utility performance to predict the likelihood of future performance in the critical range of each threshold. This does not mean that the most closely associated indicator can be taken as the cause of a future problem.
Such a determination would require diagnostic analysis focused on the underlying characteristics of the individual utility.
Water Utility Vulnerability Index (Wuvi)VI is a dynamic version of the IBNET APGAR. It is an estimated probability that a water utility will experience a performance problem as measured by a future APGAR score.average for all years. However, it is an issue for seven PWWA companies - large and small alike.
Benchmarking Report 2016 uto v8.indd 41 2/08/16 12:51 PM

4 2 | B E N C H M A R K I N G R E P O R T
PWWA WUVI
Utility 99.0 – Wuvi Standard 99.1 – Wuvi (5) 99.2 – Wuvi (7)Water Authority of Fiji (WAF) 1% 8% 37%
Caledonienne des Eaux 2% 14% 25%
Palau Public Utilities Corporation (PPUC), Palau 2% 13% 14%
KAJUR, Marshall Islands 3% 45% 100%
American Samoa Power and Water Authority, ASPA 4% 15% 10%
Central Yap State Public Service (CYSPS), Micronesia 4% 23% 23%
Public Works Department, Niue 7% 29% 23%
Northern Yap Gagil Tomil Authority (NYGTA), Micronesia 7% 29% 72%
Polynésienne des Eaux 9% 30% 27%
Southern Yap Water Authority (SYWA), Micronesia 12% 43% 78%
Tonga Water Board, TWB 15% 47% 65%
Eda Ranu 23% 51% 85%
Public Utilities Board, Kiribati 23% 80% 100%
Pohnpei Utilities, Micronesia 26% 95% 100%
Samoa Water Authority (SWA) 34% 81% 100%
Solomon Islands Water Authority (SIWA) 67% 98% 100%
Unelco Vanuatu 71% 98% 100%
Chuuk Public Utilities (CPU), Micronesia 98% 100% 100%
Water PNG 98% 100% 100%
Majuro, Marshall Islands 99% 100% 100%
Please note that the short distribution networks determine the high rate of risk for smaller companies.
WUVI Standard. Probability of financial instability. Majuro, Marshall Islands, Water PNG, PNG, and Chuuk, Micronesia have a relatively high probability of financial troubles in the next three years if the respective authority not provide subsidy to operation and maintenance. UNELCO, Vanuatu and SIWA, Solomon Islands have a probability of failure around 70%. This means that they may need to search for assistance too. The rest of utilities, among ones who were able to report all necessary elements of WUVI, have a lower probability of financial instability.
WUVI 5. Probability of not recovering costs is 100 percent in all the above mentioned utilities and high in Pohnpei, Micronesia, in Samoa Water Authority, Samoa and in Kiribati – all have critically lower probability to recover cost without external support.
WUVI 7. Probability of no investment from own resources. Only ASPA, American Samoa has a good chance to invest from own sources with a risk of 10 percent. Similarly Palau with a risk of 14 percent, Niue and Central Yap with a risk of 23 percent, CdE, New Caledonia CPE French Polynesia both with 25 percent risk have a reasonable probability of investing from own resources. All the rest will need to rely on external resources.
Benchmarking Report 2016 uto v8.indd 42 2/08/16 12:51 PM
B E N C H M A R K I N G R E P O R T | 4 3
Conclusions and recommendationsFive years of PWWA benchmarking proved that this is a very important tool that helps utilities, their managers and authorities to monitor and improve performance. Since 2010, there has been a considerable improvement in the process of data collection, indicators’ calculation and analyses. It is important that all PWWA utilities take part in data collection, data validation and indicator analyses. We propose that all data be submitted to the PWWA by April 1st of each year, and all updates to reflect the status of the utilities performance for that year.
It is important that collected information be used by utilities not only for assessment, but also for development of new projects. The monitoring information can be used as a tool for utilities in decision-making.
A quick analysis of the different indicators shows that a single indicator does not necessarily give an accurate picture of the performance of a utility. An analysis of different non-revenue water indicators,
for instance, shows that different indicators can show differing levels of performance. Hence, when analyzing the performance of a utility, it is important to look at a set of indicators and the context in which the utility is working.
Governments continue to dominate utilities’ performance. Although tariffs (as measured by a proxy of average revenues per cubic meter) have increased over time, the increases were barely enough to cover the operation and maintenance costs of the services. As a result, the operating cost coverage ratio has not shown any significant changes over the last five years.
The level of subsidy, either direct or indirect, is high in many utilities
Benchmarking Report 2016 uto v8.indd 43 2/08/16 12:51 PM
4 4 | B E N C H M A R K I N G R E P O R T
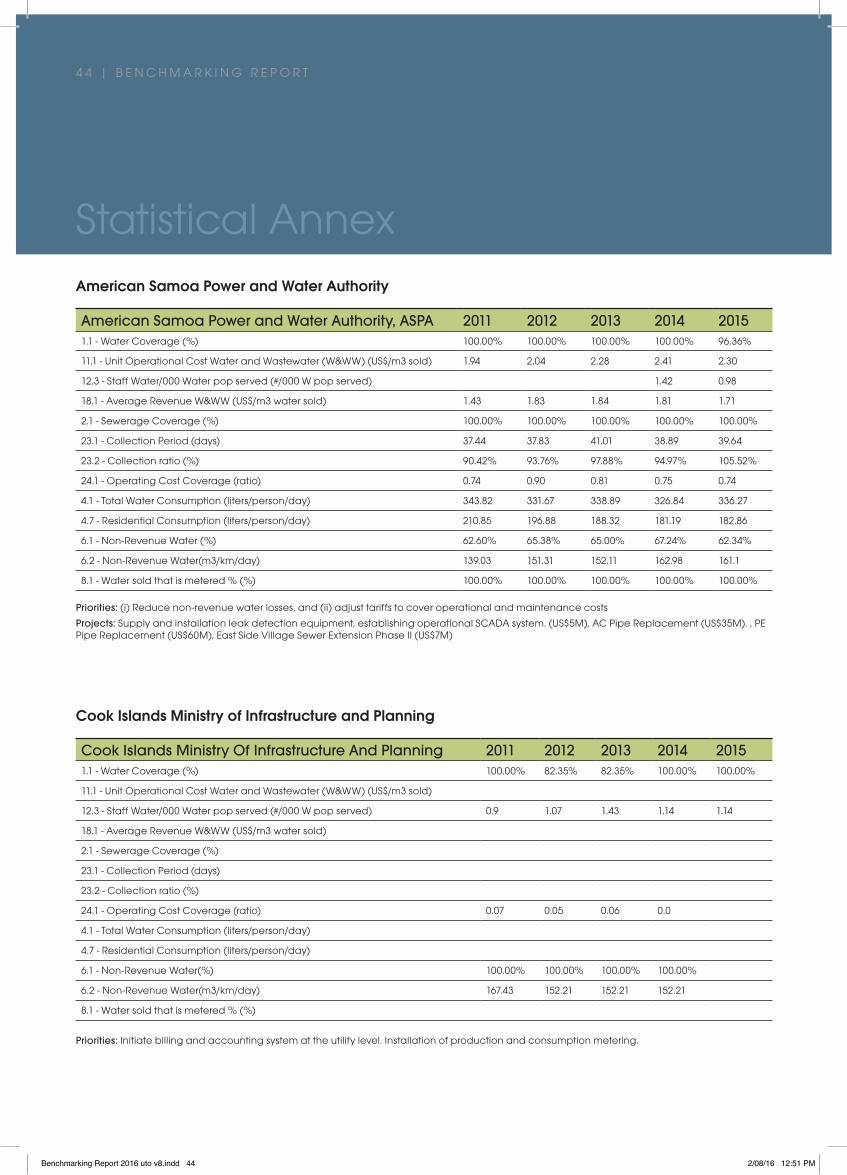
American Samoa Power and Water Authority
American Samoa Power and Water Authority, ASPA 2011 2012 2013 2014 20151.1 - Water Coverage (%) 100.00% 100.00% 100.00% 100.00% 96.36%
11.1 - Unit Operational Cost Water and Wastewater (W&WW) (US$/m3 sold) 1.94 2.04 2.28 2.41 2.30
12.3 - Staff Water/000 Water pop served (#/000 W pop served) 1.42 0.98
18.1 - Average Revenue W&WW (US$/m3 water sold) 1.43 1.83 1.84 1.81 1.71
2.1 - Sewerage Coverage (%) 100.00% 100.00% 100.00% 100.00% 100.00%
23.1 - Collection Period (days) 37.44 37.83 41.01 38.89 39.64
23.2 - Collection ratio (%) 90.42% 93.76% 97.88% 94.97% 105.52%
24.1 - Operating Cost Coverage (ratio) 0.74 0.90 0.81 0.75 0.74
4.1 - Total Water Consumption (liters/person/day) 343.82 331.67 338.89 326.84 336.27
4.7 - Residential Consumption (liters/person/day) 210.85 196.88 188.32 181.19 182.86
6.1 - Non-Revenue Water (%) 62.60% 65.38% 65.00% 67.24% 62.34%
6.2 - Non-Revenue Water(m3/km/day) 139.03 151.31 152.11 162.98 161.1
8.1 - Water sold that is metered % (%) 100.00% 100.00% 100.00% 100.00% 100.00%
Cook Islands Ministry of Infrastructure and Planning
Cook Islands Ministry Of Infrastructure And Planning 2011 2012 2013 2014 20151.1 - Water Coverage (%) 100.00% 82.35% 82.35% 100.00% 100.00%
11.1 - Unit Operational Cost Water and Wastewater (W&WW) (US$/m3 sold)
12.3 - Staff Water/000 Water pop served (#/000 W pop served) 0.9 1.07 1.43 1.14 1.14
18.1 - Average Revenue W&WW (US$/m3 water sold)
2.1 - Sewerage Coverage (%)
23.1 - Collection Period (days)
23.2 - Collection ratio (%)
24.1 - Operating Cost Coverage (ratio) 0.07 0.05 0.06 0.0
4.1 - Total Water Consumption (liters/person/day)
4.7 - Residential Consumption (liters/person/day)
6.1 - Non-Revenue Water(%) 100.00% 100.00% 100.00% 100.00%
6.2 - Non-Revenue Water(m3/km/day) 167.43 152.21 152.21 152.21
8.1 - Water sold that is metered % (%)
Priorities: (i) Reduce non-revenue water losses, and (ii) adjust tariffs to cover operational and maintenance costs
Projects: Supply and installation leak detection equipment, establishing operational SCADA system. (US$5M), AC Pipe Replacement (US$35M). , PE Pipe Replacement (US$60M), East Side Village Sewer Extension Phase II (US$7M)
Priorities: Initiate billing and accounting system at the utility level. Installation of production and consumption metering.
Statistical Annex
Benchmarking Report 2016 uto v8.indd 44 2/08/16 12:51 PM
B E N C H M A R K I N G R E P O R T | 4 5
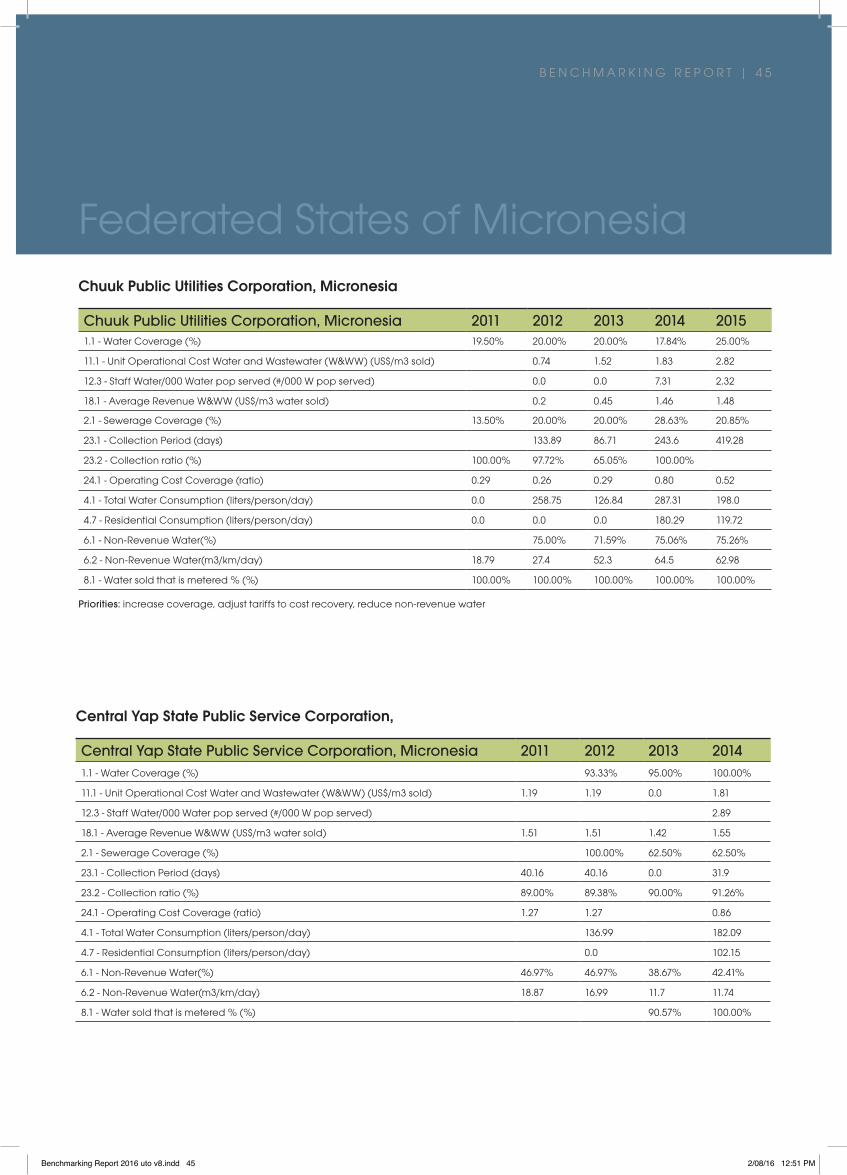
Chuuk Public Utilities Corporation, Micronesia
Chuuk Public Utilities Corporation, Micronesia 2011 2012 2013 2014 20151.1 - Water Coverage (%) 19.50% 20.00% 20.00% 17.84% 25.00%
11.1 - Unit Operational Cost Water and Wastewater (W&WW) (US$/m3 sold) 0.74 1.52 1.83 2.82
12.3 - Staff Water/000 Water pop served (#/000 W pop served) 0.0 0.0 7.31 2.32
18.1 - Average Revenue W&WW (US$/m3 water sold) 0.2 0.45 1.46 1.48
2.1 - Sewerage Coverage (%) 13.50% 20.00% 20.00% 28.63% 20.85%
23.1 - Collection Period (days) 133.89 86.71 243.6 419.28
23.2 - Collection ratio (%) 100.00% 97.72% 65.05% 100.00%
24.1 - Operating Cost Coverage (ratio) 0.29 0.26 0.29 0.80 0.52
4.1 - Total Water Consumption (liters/person/day) 0.0 258.75 126.84 287.31 198.0
4.7 - Residential Consumption (liters/person/day) 0.0 0.0 0.0 180.29 119.72
6.1 - Non-Revenue Water(%) 75.00% 71.59% 75.06% 75.26%
6.2 - Non-Revenue Water(m3/km/day) 18.79 27.4 52.3 64.5 62.98
8.1 - Water sold that is metered % (%) 100.00% 100.00% 100.00% 100.00% 100.00%
Priorities: increase coverage, adjust tariffs to cost recovery, reduce non-revenue water
Central Yap State Public Service Corporation,
Central Yap State Public Service Corporation, Micronesia 2011 2012 2013 20141.1 - Water Coverage (%) 93.33% 95.00% 100.00%
11.1 - Unit Operational Cost Water and Wastewater (W&WW) (US$/m3 sold) 1.19 1.19 0.0 1.81
12.3 - Staff Water/000 Water pop served (#/000 W pop served) 2.89
18.1 - Average Revenue W&WW (US$/m3 water sold) 1.51 1.51 1.42 1.55
2.1 - Sewerage Coverage (%) 100.00% 62.50% 62.50%
23.1 - Collection Period (days) 40.16 40.16 0.0 31.9
23.2 - Collection ratio (%) 89.00% 89.38% 90.00% 91.26%
24.1 - Operating Cost Coverage (ratio) 1.27 1.27 0.86
4.1 - Total Water Consumption (liters/person/day) 136.99 182.09
4.7 - Residential Consumption (liters/person/day) 0.0 102.15
6.1 - Non-Revenue Water(%) 46.97% 46.97% 38.67% 42.41%
6.2 - Non-Revenue Water(m3/km/day) 18.87 16.99 11.7 11.74
8.1 - Water sold that is metered % (%) 90.57% 100.00%
Federated States of Micronesia
Benchmarking Report 2016 uto v8.indd 45 2/08/16 12:51 PM
4 6 | B E N C H M A R K I N G R E P O R T
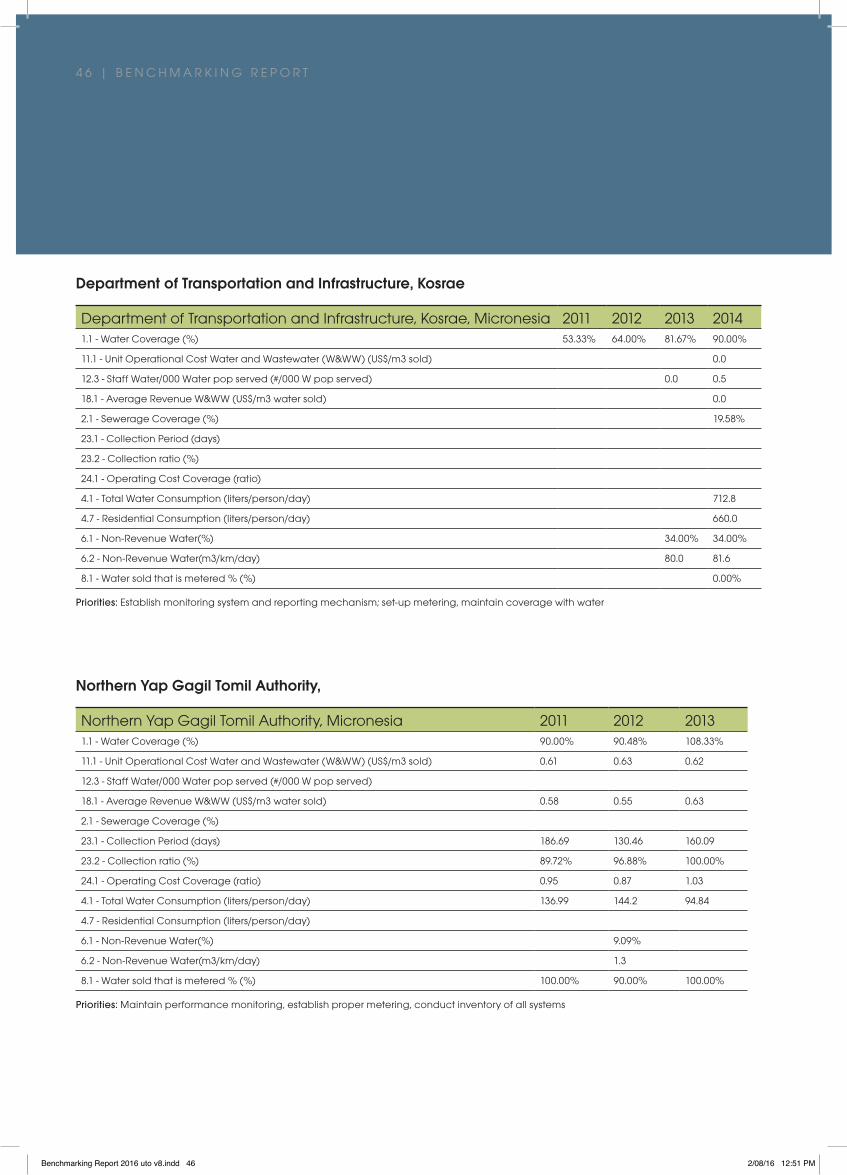
Department of Transportation and Infrastructure, Kosrae
Department of Transportation and Infrastructure, Kosrae, Micronesia 2011 2012 2013 20141.1 - Water Coverage (%) 53.33% 64.00% 81.67% 90.00%
11.1 - Unit Operational Cost Water and Wastewater (W&WW) (US$/m3 sold) 0.0
12.3 - Staff Water/000 Water pop served (#/000 W pop served) 0.0 0.5
18.1 - Average Revenue W&WW (US$/m3 water sold) 0.0
2.1 - Sewerage Coverage (%) 19.58%
23.1 - Collection Period (days)
23.2 - Collection ratio (%)
24.1 - Operating Cost Coverage (ratio)
4.1 - Total Water Consumption (liters/person/day) 712.8
4.7 - Residential Consumption (liters/person/day) 660.0
6.1 - Non-Revenue Water(%) 34.00% 34.00%
6.2 - Non-Revenue Water(m3/km/day) 80.0 81.6
8.1 - Water sold that is metered % (%) 0.00%
Priorities: Establish monitoring system and reporting mechanism; set-up metering, maintain coverage with water
Northern Yap Gagil Tomil Authority,
Northern Yap Gagil Tomil Authority, Micronesia 2011 2012 20131.1 - Water Coverage (%) 90.00% 90.48% 108.33%
11.1 - Unit Operational Cost Water and Wastewater (W&WW) (US$/m3 sold) 0.61 0.63 0.62
12.3 - Staff Water/000 Water pop served (#/000 W pop served)
18.1 - Average Revenue W&WW (US$/m3 water sold) 0.58 0.55 0.63
2.1 - Sewerage Coverage (%)
23.1 - Collection Period (days) 186.69 130.46 160.09
23.2 - Collection ratio (%) 89.72% 96.88% 100.00%
24.1 - Operating Cost Coverage (ratio) 0.95 0.87 1.03
4.1 - Total Water Consumption (liters/person/day) 136.99 144.2 94.84
4.7 - Residential Consumption (liters/person/day)
6.1 - Non-Revenue Water(%) 9.09%
6.2 - Non-Revenue Water(m3/km/day) 1.3
8.1 - Water sold that is metered % (%) 100.00% 90.00% 100.00%
Priorities: Maintain performance monitoring, establish proper metering, conduct inventory of all systems
Benchmarking Report 2016 uto v8.indd 46 2/08/16 12:51 PM
B E N C H M A R K I N G R E P O R T | 4 7
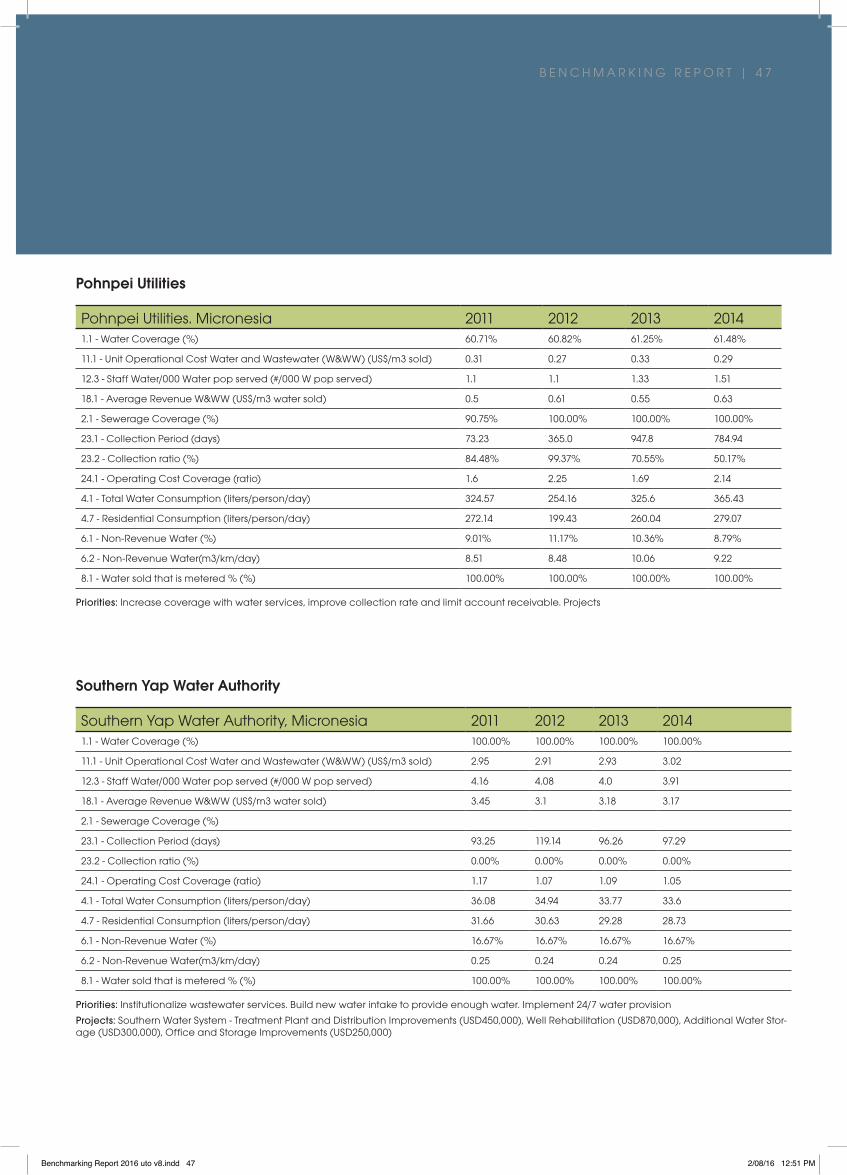
Pohnpei Utilities
Pohnpei Utilities. Micronesia 2011 2012 2013 20141.1 - Water Coverage (%) 60.71% 60.82% 61.25% 61.48%
11.1 - Unit Operational Cost Water and Wastewater (W&WW) (US$/m3 sold) 0.31 0.27 0.33 0.29
12.3 - Staff Water/000 Water pop served (#/000 W pop served) 1.1 1.1 1.33 1.51
18.1 - Average Revenue W&WW (US$/m3 water sold) 0.5 0.61 0.55 0.63
2.1 - Sewerage Coverage (%) 90.75% 100.00% 100.00% 100.00%
23.1 - Collection Period (days) 73.23 365.0 947.8 784.94
23.2 - Collection ratio (%) 84.48% 99.37% 70.55% 50.17%
24.1 - Operating Cost Coverage (ratio) 1.6 2.25 1.69 2.14
4.1 - Total Water Consumption (liters/person/day) 324.57 254.16 325.6 365.43
4.7 - Residential Consumption (liters/person/day) 272.14 199.43 260.04 279.07
6.1 - Non-Revenue Water (%) 9.01% 11.17% 10.36% 8.79%
6.2 - Non-Revenue Water(m3/km/day) 8.51 8.48 10.06 9.22
8.1 - Water sold that is metered % (%) 100.00% 100.00% 100.00% 100.00%
Priorities: Increase coverage with water services, improve collection rate and limit account receivable. Projects
Southern Yap Water Authority
Southern Yap Water Authority, Micronesia 2011 2012 2013 20141.1 - Water Coverage (%) 100.00% 100.00% 100.00% 100.00%
11.1 - Unit Operational Cost Water and Wastewater (W&WW) (US$/m3 sold) 2.95 2.91 2.93 3.02
12.3 - Staff Water/000 Water pop served (#/000 W pop served) 4.16 4.08 4.0 3.91
18.1 - Average Revenue W&WW (US$/m3 water sold) 3.45 3.1 3.18 3.17
2.1 - Sewerage Coverage (%)
23.1 - Collection Period (days) 93.25 119.14 96.26 97.29
23.2 - Collection ratio (%) 0.00% 0.00% 0.00% 0.00%
24.1 - Operating Cost Coverage (ratio) 1.17 1.07 1.09 1.05
4.1 - Total Water Consumption (liters/person/day) 36.08 34.94 33.77 33.6
4.7 - Residential Consumption (liters/person/day) 31.66 30.63 29.28 28.73
6.1 - Non-Revenue Water (%) 16.67% 16.67% 16.67% 16.67%
6.2 - Non-Revenue Water(m3/km/day) 0.25 0.24 0.24 0.25
8.1 - Water sold that is metered % (%) 100.00% 100.00% 100.00% 100.00%
Priorities: Institutionalize wastewater services. Build new water intake to provide enough water. Implement 24/7 water provision
Projects: Southern Water System - Treatment Plant and Distribution Improvements (USD450,000), Well Rehabilitation (USD870,000), Additional Water Stor-age (USD300,000), Office and Storage Improvements (USD250,000)
Benchmarking Report 2016 uto v8.indd 47 2/08/16 12:51 PM
4 8 | B E N C H M A R K I N G R E P O R T
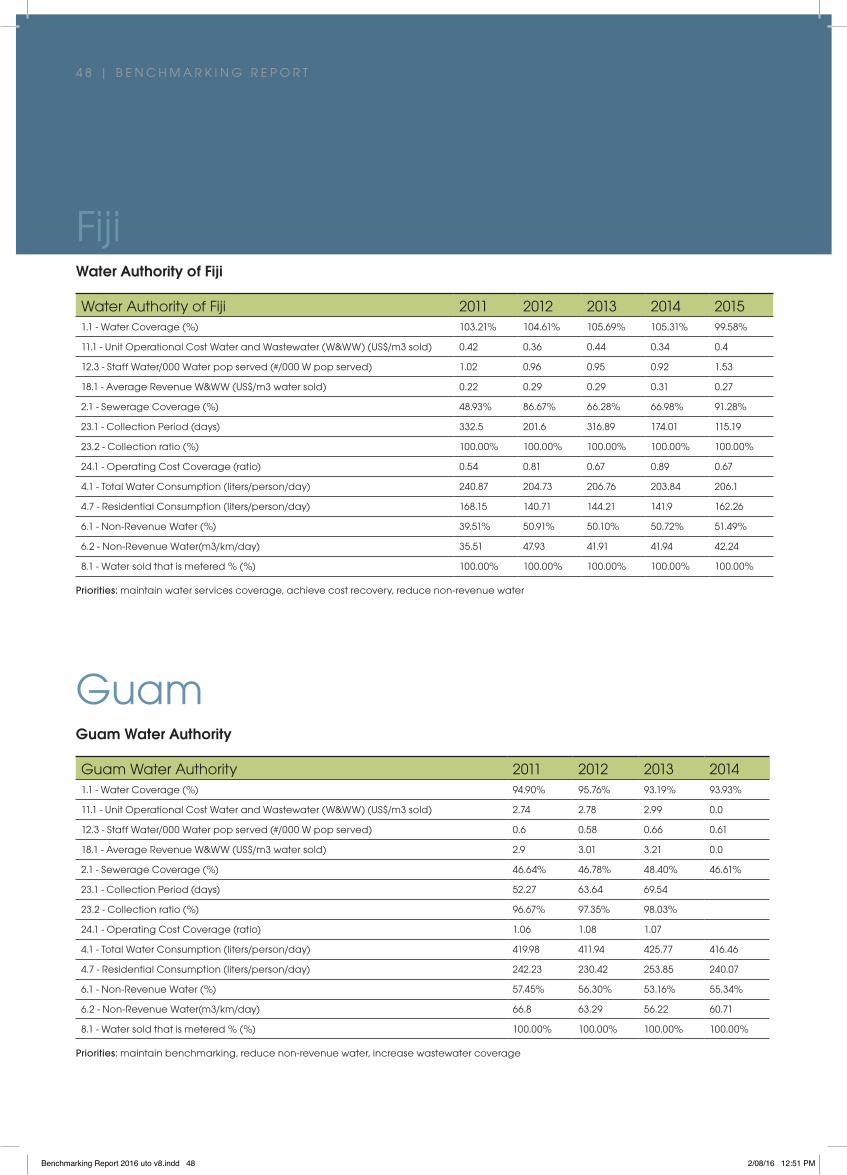
FijiWater Authority of Fiji
Water Authority of Fiji 2011 2012 2013 2014 20151.1 - Water Coverage (%) 103.21% 104.61% 105.69% 105.31% 99.58%
11.1 - Unit Operational Cost Water and Wastewater (W&WW) (US$/m3 sold) 0.42 0.36 0.44 0.34 0.4
12.3 - Staff Water/000 Water pop served (#/000 W pop served) 1.02 0.96 0.95 0.92 1.53
18.1 - Average Revenue W&WW (US$/m3 water sold) 0.22 0.29 0.29 0.31 0.27
2.1 - Sewerage Coverage (%) 48.93% 86.67% 66.28% 66.98% 91.28%
23.1 - Collection Period (days) 332.5 201.6 316.89 174.01 115.19
23.2 - Collection ratio (%) 100.00% 100.00% 100.00% 100.00% 100.00%
24.1 - Operating Cost Coverage (ratio) 0.54 0.81 0.67 0.89 0.67
4.1 - Total Water Consumption (liters/person/day) 240.87 204.73 206.76 203.84 206.1
4.7 - Residential Consumption (liters/person/day) 168.15 140.71 144.21 141.9 162.26
6.1 - Non-Revenue Water (%) 39.51% 50.91% 50.10% 50.72% 51.49%
6.2 - Non-Revenue Water(m3/km/day) 35.51 47.93 41.91 41.94 42.24
8.1 - Water sold that is metered % (%) 100.00% 100.00% 100.00% 100.00% 100.00%
Priorities: maintain water services coverage, achieve cost recovery, reduce non-revenue water
GuamGuam Water Authority
Guam Water Authority 2011 2012 2013 20141.1 - Water Coverage (%) 94.90% 95.76% 93.19% 93.93%
11.1 - Unit Operational Cost Water and Wastewater (W&WW) (US$/m3 sold) 2.74 2.78 2.99 0.0
12.3 - Staff Water/000 Water pop served (#/000 W pop served) 0.6 0.58 0.66 0.61
18.1 - Average Revenue W&WW (US$/m3 water sold) 2.9 3.01 3.21 0.0
2.1 - Sewerage Coverage (%) 46.64% 46.78% 48.40% 46.61%
23.1 - Collection Period (days) 52.27 63.64 69.54
23.2 - Collection ratio (%) 96.67% 97.35% 98.03%
24.1 - Operating Cost Coverage (ratio) 1.06 1.08 1.07
4.1 - Total Water Consumption (liters/person/day) 419.98 411.94 425.77 416.46
4.7 - Residential Consumption (liters/person/day) 242.23 230.42 253.85 240.07
6.1 - Non-Revenue Water (%) 57.45% 56.30% 53.16% 55.34%
6.2 - Non-Revenue Water(m3/km/day) 66.8 63.29 56.22 60.71
8.1 - Water sold that is metered % (%) 100.00% 100.00% 100.00% 100.00%
Priorities: maintain benchmarking, reduce non-revenue water, increase wastewater coverage
Benchmarking Report 2016 uto v8.indd 48 2/08/16 12:51 PM
B E N C H M A R K I N G R E P O R T | 4 9
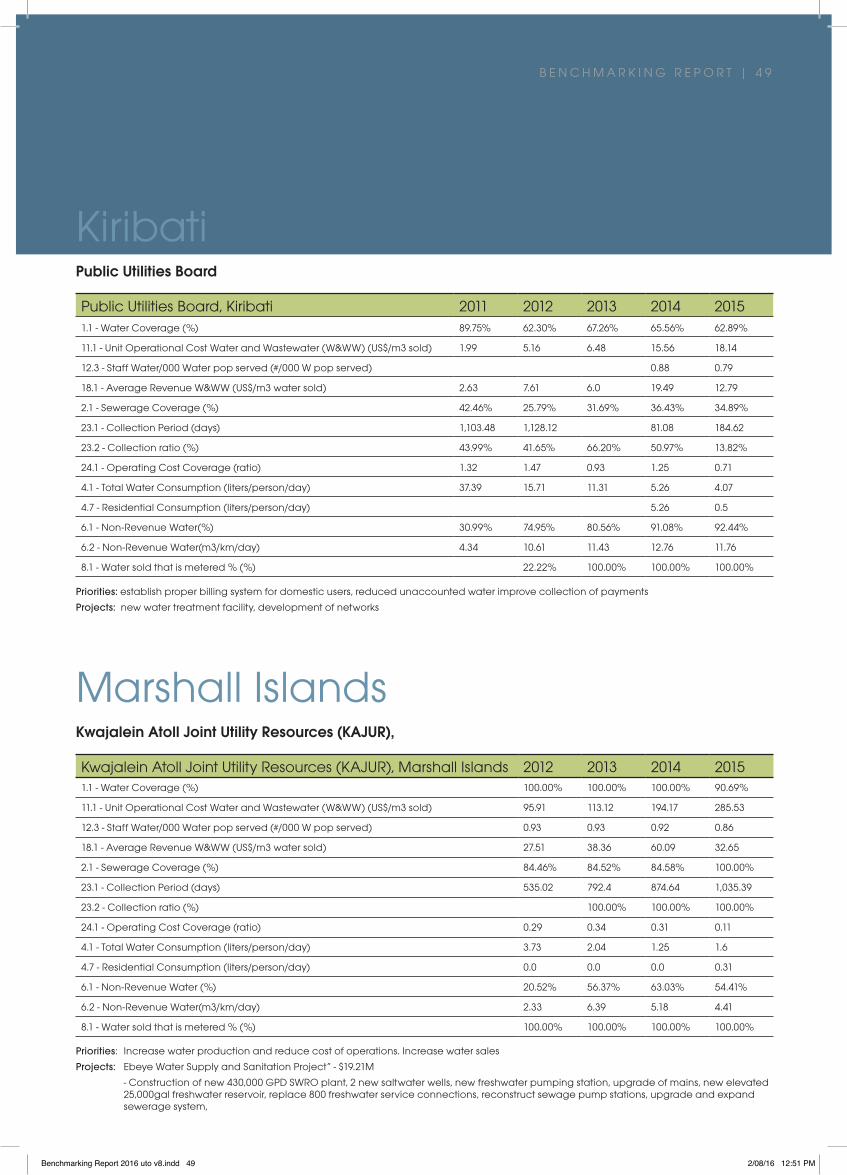
KiribatiPublic Utilities Board
Public Utilities Board, Kiribati 2011 2012 2013 2014 20151.1 - Water Coverage (%) 89.75% 62.30% 67.26% 65.56% 62.89%
11.1 - Unit Operational Cost Water and Wastewater (W&WW) (US$/m3 sold) 1.99 5.16 6.48 15.56 18.14
12.3 - Staff Water/000 Water pop served (#/000 W pop served) 0.88 0.79
18.1 - Average Revenue W&WW (US$/m3 water sold) 2.63 7.61 6.0 19.49 12.79
2.1 - Sewerage Coverage (%) 42.46% 25.79% 31.69% 36.43% 34.89%
23.1 - Collection Period (days) 1,103.48 1,128.12 81.08 184.62
23.2 - Collection ratio (%) 43.99% 41.65% 66.20% 50.97% 13.82%
24.1 - Operating Cost Coverage (ratio) 1.32 1.47 0.93 1.25 0.71
4.1 - Total Water Consumption (liters/person/day) 37.39 15.71 11.31 5.26 4.07
4.7 - Residential Consumption (liters/person/day) 5.26 0.5
6.1 - Non-Revenue Water(%) 30.99% 74.95% 80.56% 91.08% 92.44%
6.2 - Non-Revenue Water(m3/km/day) 4.34 10.61 11.43 12.76 11.76
8.1 - Water sold that is metered % (%) 22.22% 100.00% 100.00% 100.00% Priorities: establish proper billing system for domestic users, reduced unaccounted water improve collection of payments
Projects: new water treatment facility, development of networks
Marshall IslandsKwajalein Atoll Joint Utility Resources (KAJUR),
Kwajalein Atoll Joint Utility Resources (KAJUR), Marshall Islands 2012 2013 2014 20151.1 - Water Coverage (%) 100.00% 100.00% 100.00% 90.69%
11.1 - Unit Operational Cost Water and Wastewater (W&WW) (US$/m3 sold) 95.91 113.12 194.17 285.53
12.3 - Staff Water/000 Water pop served (#/000 W pop served) 0.93 0.93 0.92 0.86
18.1 - Average Revenue W&WW (US$/m3 water sold) 27.51 38.36 60.09 32.65
2.1 - Sewerage Coverage (%) 84.46% 84.52% 84.58% 100.00%
23.1 - Collection Period (days) 535.02 792.4 874.64 1,035.39
23.2 - Collection ratio (%) 100.00% 100.00% 100.00%
24.1 - Operating Cost Coverage (ratio) 0.29 0.34 0.31 0.11
4.1 - Total Water Consumption (liters/person/day) 3.73 2.04 1.25 1.6
4.7 - Residential Consumption (liters/person/day) 0.0 0.0 0.0 0.31
6.1 - Non-Revenue Water (%) 20.52% 56.37% 63.03% 54.41%
6.2 - Non-Revenue Water(m3/km/day) 2.33 6.39 5.18 4.41
8.1 - Water sold that is metered % (%) 100.00% 100.00% 100.00% 100.00%
Priorities: Increase water production and reduce cost of operations. Increase water sales
Projects: Ebeye Water Supply and Sanitation Project” - $19.21M
- Construction of new 430,000 GPD SWRO plant, 2 new saltwater wells, new freshwater pumping station, upgrade of mains, new elevated 25,000gal freshwater reservoir, replace 800 freshwater service connections, reconstruct sewage pump stations, upgrade and expand sewerage system,
Benchmarking Report 2016 uto v8.indd 49 2/08/16 12:51 PM
5 0 | B E N C H M A R K I N G R E P O R T
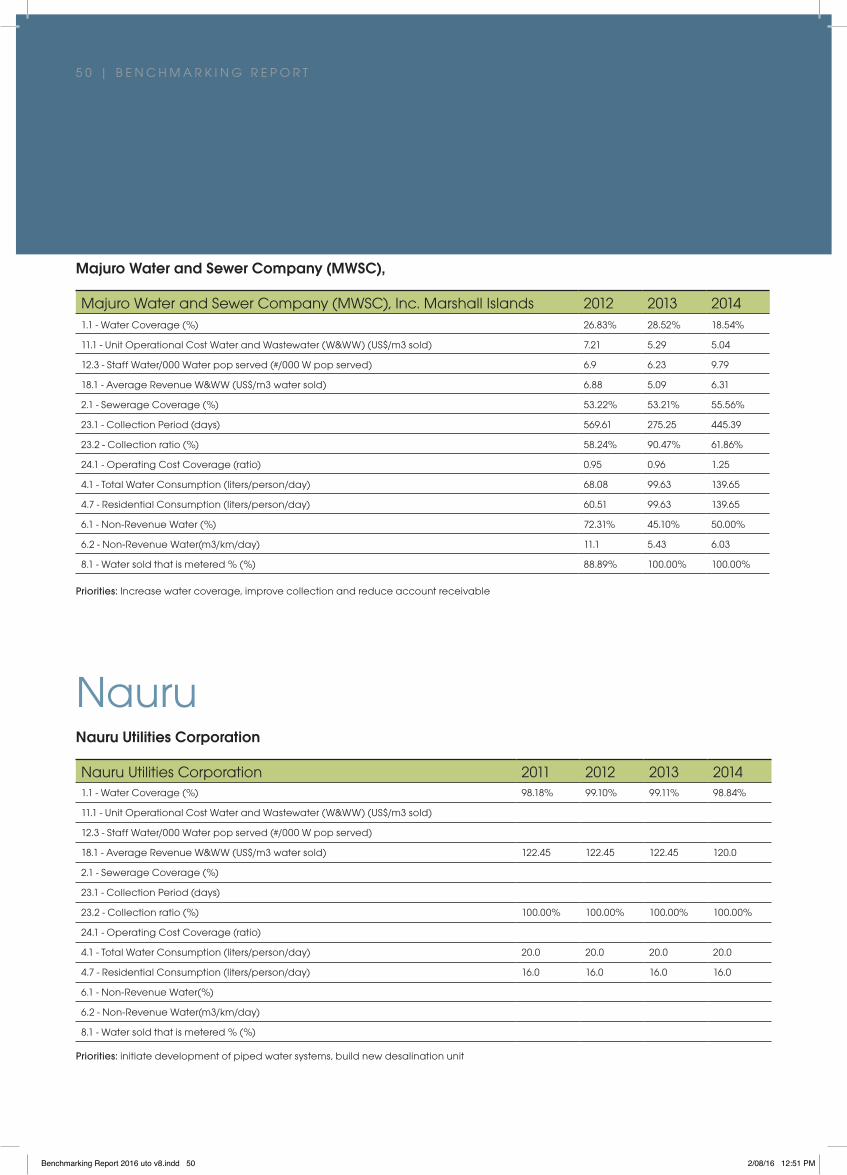
Majuro Water and Sewer Company (MWSC),
Majuro Water and Sewer Company (MWSC), Inc. Marshall Islands 2012 2013 20141.1 - Water Coverage (%) 26.83% 28.52% 18.54%
11.1 - Unit Operational Cost Water and Wastewater (W&WW) (US$/m3 sold) 7.21 5.29 5.04
12.3 - Staff Water/000 Water pop served (#/000 W pop served) 6.9 6.23 9.79
18.1 - Average Revenue W&WW (US$/m3 water sold) 6.88 5.09 6.31
2.1 - Sewerage Coverage (%) 53.22% 53.21% 55.56%
23.1 - Collection Period (days) 569.61 275.25 445.39
23.2 - Collection ratio (%) 58.24% 90.47% 61.86%
24.1 - Operating Cost Coverage (ratio) 0.95 0.96 1.25
4.1 - Total Water Consumption (liters/person/day) 68.08 99.63 139.65
4.7 - Residential Consumption (liters/person/day) 60.51 99.63 139.65
6.1 - Non-Revenue Water (%) 72.31% 45.10% 50.00%
6.2 - Non-Revenue Water(m3/km/day) 11.1 5.43 6.03
8.1 - Water sold that is metered % (%) 88.89% 100.00% 100.00%
Priorities: Increase water coverage, improve collection and reduce account receivable
NauruNauru Utilities Corporation
Nauru Utilities Corporation 2011 2012 2013 20141.1 - Water Coverage (%) 98.18% 99.10% 99.11% 98.84%
11.1 - Unit Operational Cost Water and Wastewater (W&WW) (US$/m3 sold)
12.3 - Staff Water/000 Water pop served (#/000 W pop served)
18.1 - Average Revenue W&WW (US$/m3 water sold) 122.45 122.45 122.45 120.0
2.1 - Sewerage Coverage (%)
23.1 - Collection Period (days)
23.2 - Collection ratio (%) 100.00% 100.00% 100.00% 100.00%
24.1 - Operating Cost Coverage (ratio)
4.1 - Total Water Consumption (liters/person/day) 20.0 20.0 20.0 20.0
4.7 - Residential Consumption (liters/person/day) 16.0 16.0 16.0 16.0
6.1 - Non-Revenue Water(%)
6.2 - Non-Revenue Water(m3/km/day)
8.1 - Water sold that is metered % (%)
Priorities: initiate development of piped water systems, build new desalination unit
Benchmarking Report 2016 uto v8.indd 50 2/08/16 12:51 PM

B E N C H M A R K I N G R E P O R T | 5 1
New CaledoniaCalédonienne des Eaux
Calédonienne des Eaux 20151.1 - Water Coverage (%) 98.96%
11.1 - Unit Operational Cost Water and Wastewater (W&WW) (US$/m3 sold) 1.55
12.3 - Staff Water/000 Water pop served (#/000 W pop served) 0.45
18.1 - Average Revenue W&WW (US$/m3 water sold) 2.37
2.1 - Sewerage Coverage (%) 72.02%
23.1 - Collection Period (days) 76.59
23.2 - Collection ratio (%) 99.29%
24.1 - Operating Cost Coverage (ratio) 1.53
4.1 - Total Water Consumption (liters/person/day) 288.32
4.7 - Residential Consumption (liters/person/day)
6.1 - Non-Revenue Water(%) 22.69%
6.2 - Non-Revenue Water(m3/km/day) 10.66
8.1 - Water sold that is metered % (%) 100.00%
Priorities: Continue benchmarking
Projects: Replacement of lead and old PE connections by new PE connections (600 units per year), Commissioning of Dumbéa new Waste Water Treatment Plant (phase 1, additional 24,000 Population Equivalent)
NiuePublic Works Department
Public Works Department, Niue 20151.1 - Water Coverage (%) 97.78%
11.1 - Unit Operational Cost Water and Wastewater (W&WW) (US$/m3 sold) 2.45
12.3 - Staff Water/000 Water pop served (#/000 W pop served) 7.39
18.1 - Average Revenue W&WW (US$/m3 water sold) 0.03
2.1 - Sewerage Coverage (%)
23.1 - Collection Period (days) 0.05
23.2 - Collection ratio (%)
24.1 - Operating Cost Coverage (ratio) 0.01
4.1 - Total Water Consumption (liters/person/day) 389.17
4.7 - Residential Consumption (liters/person/day)
6.1 - Non-Revenue Water(%) 7.41%
6.2 - Non-Revenue Water(m3/km/day) 0.48
8.1 - Water sold that is metered % (%) 0.00%
Priorities: establish proper benchmarking system, establish billing system for users
Benchmarking Report 2016 uto v8.indd 51 2/08/16 12:51 PM

5 2 | B E N C H M A R K I N G R E P O R T
Northern Marianna Islands
Commonwealth Utilities Corporation, Northern Marianas 2011 2012 20131.1 - Water Coverage (%) 96.15% 96.15% 100.00%
11.1 - Unit Operational Cost Water and Wastewater (W&WW) (US$/m3 sold) 1.84 1.84 2.83
12.3 - Staff Water/000 Water pop served (#/000 W pop served)
18.1 - Average Revenue W&WW (US$/m3 water sold) 1.85 1.76 2.39
2.1 - Sewerage Coverage (%) 61.54% 43.75%
23.1 - Collection Period (days) 43.94 46.17
23.2 - Collection ratio (%) 83.26% 85.42% 118.38%
24.1 - Operating Cost Coverage (ratio) 1.01 0.96 0.84
4.1 - Total Water Consumption (liters/person/day) 373.15 373.15 255.17
4.7 - Residential Consumption (liters/person/day)
6.1 - Non-Revenue Water(%) 47.58% 47.58% 70.01%
6.2 - Non-Revenue Water(m3/km/day) 70.26 70.26 50.97
8.1 - Water sold that is metered % (%) 95.01% 95.01% 98.41%
Priorities: restart benchmarking work, reduce non-revenue water, adjust tariffs to costs.
PalauPalau Public Utilities Corporation (PPUC)
Palau Public Utilities Corporation (PPUC), Palau 2011 2012 20131.1 - Water Coverage (%) 94.74% 99.47%
11.1 - Unit Operational Cost Water and Wastewater (W&WW) (US$/m3 sold) 1.04 1.42 2.11
12.3 - Staff Water/000 Water pop served (#/000 W pop served)
18.1 - Average Revenue W&WW (US$/m3 water sold) 0.23 0.58 0.57
2.1 - Sewerage Coverage (%) 52.63% 58.95%
23.1 - Collection Period (days) 14.15 49.79
23.2 - Collection ratio (%) 98.52% 68.29% 100.00%
24.1 - Operating Cost Coverage (ratio) 0.22 0.41 0.27
4.1 - Total Water Consumption (liters/person/day) 447.49 437.78
4.7 - Residential Consumption (liters/person/day)
6.1 - Non-Revenue Water(%) 41.45% 40.85% 50.49%
6.2 - Non-Revenue Water(m3/km/day) 40.9 36.59 42.19
8.1 - Water sold that is metered % (%) 83.85% 74.83% 69.87%
Priorities: restart benchmarking work, reduce non-revenue water, adjust tariffs to costs.
Benchmarking Report 2016 uto v8.indd 52 2/08/16 12:51 PM
B E N C H M A R K I N G R E P O R T | 5 3
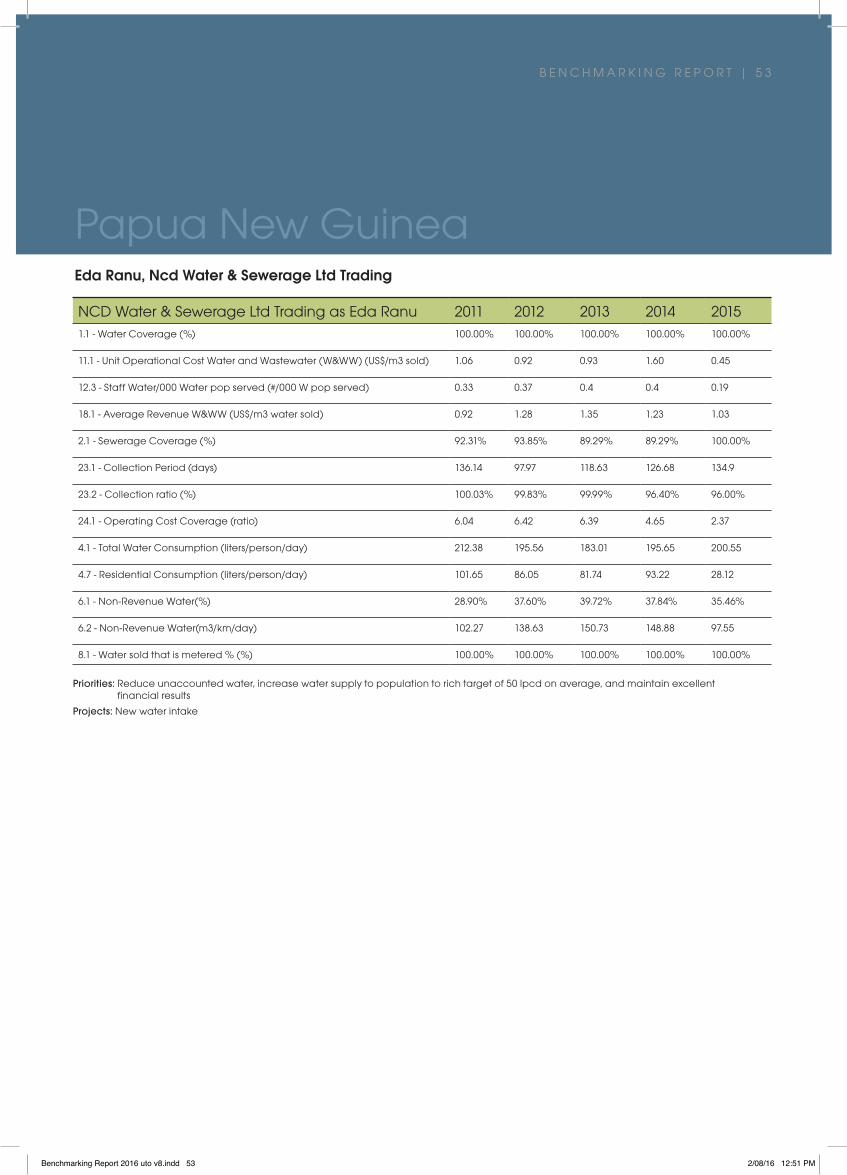
Papua New GuineaEda Ranu, Ncd Water & Sewerage Ltd Trading
NCD Water & Sewerage Ltd Trading as Eda Ranu 2011 2012 2013 2014 20151.1 - Water Coverage (%) 100.00% 100.00% 100.00% 100.00% 100.00%
11.1 - Unit Operational Cost Water and Wastewater (W&WW) (US$/m3 sold) 1.06 0.92 0.93 1.60 0.45
12.3 - Staff Water/000 Water pop served (#/000 W pop served) 0.33 0.37 0.4 0.4 0.19
18.1 - Average Revenue W&WW (US$/m3 water sold) 0.92 1.28 1.35 1.23 1.03
2.1 - Sewerage Coverage (%) 92.31% 93.85% 89.29% 89.29% 100.00%
23.1 - Collection Period (days) 136.14 97.97 118.63 126.68 134.9
23.2 - Collection ratio (%) 100.03% 99.83% 99.99% 96.40% 96.00%
24.1 - Operating Cost Coverage (ratio) 6.04 6.42 6.39 4.65 2.37
4.1 - Total Water Consumption (liters/person/day) 212.38 195.56 183.01 195.65 200.55
4.7 - Residential Consumption (liters/person/day) 101.65 86.05 81.74 93.22 28.12
6.1 - Non-Revenue Water(%) 28.90% 37.60% 39.72% 37.84% 35.46%
6.2 - Non-Revenue Water(m3/km/day) 102.27 138.63 150.73 148.88 97.55
8.1 - Water sold that is metered % (%) 100.00% 100.00% 100.00% 100.00% 100.00%
Priorities: Reduce unaccounted water, increase water supply to population to rich target of 50 lpcd on average, and maintain excellent financial results
Projects: New water intake
Benchmarking Report 2016 uto v8.indd 53 2/08/16 12:51 PM
5 4 | B E N C H M A R K I N G R E P O R T
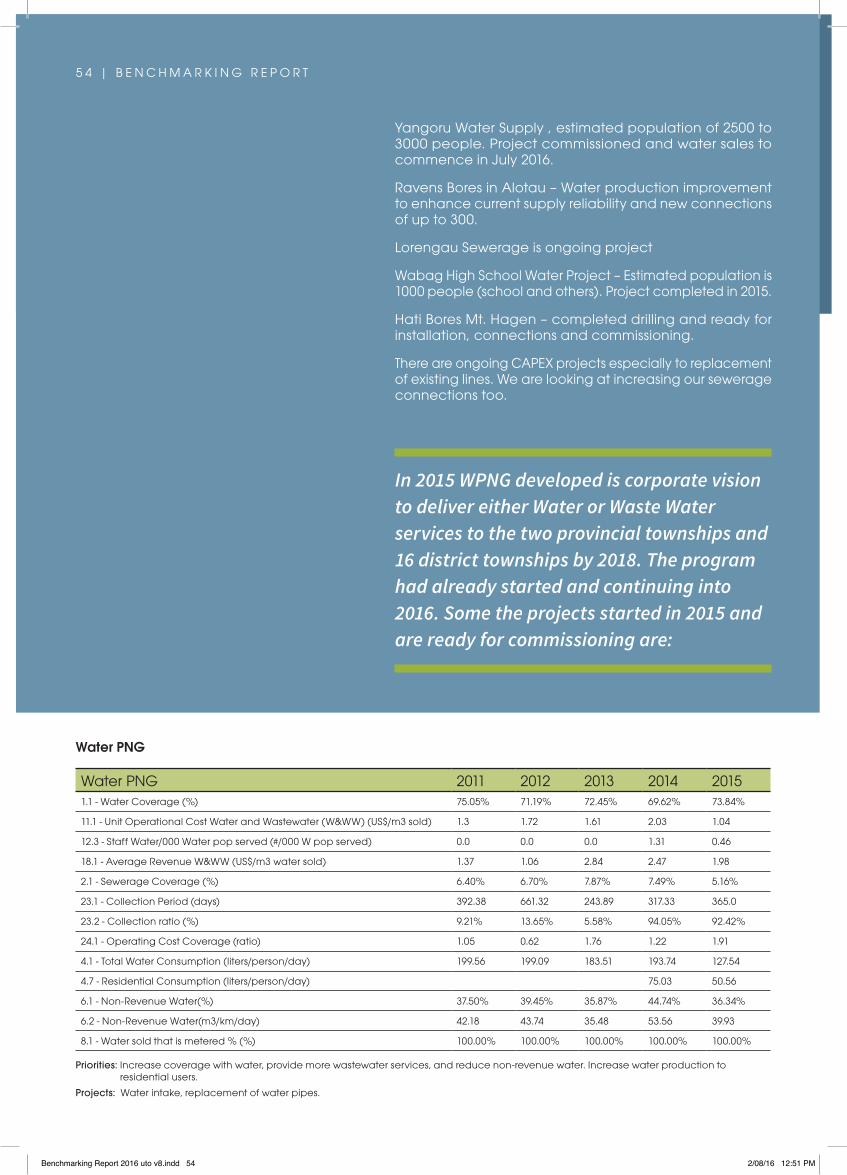
Water PNG
Water PNG 2011 2012 2013 2014 20151.1 - Water Coverage (%) 75.05% 71.19% 72.45% 69.62% 73.84%
11.1 - Unit Operational Cost Water and Wastewater (W&WW) (US$/m3 sold) 1.3 1.72 1.61 2.03 1.04
12.3 - Staff Water/000 Water pop served (#/000 W pop served) 0.0 0.0 0.0 1.31 0.46
18.1 - Average Revenue W&WW (US$/m3 water sold) 1.37 1.06 2.84 2.47 1.98
2.1 - Sewerage Coverage (%) 6.40% 6.70% 7.87% 7.49% 5.16%
23.1 - Collection Period (days) 392.38 661.32 243.89 317.33 365.0
23.2 - Collection ratio (%) 9.21% 13.65% 5.58% 94.05% 92.42%
24.1 - Operating Cost Coverage (ratio) 1.05 0.62 1.76 1.22 1.91
4.1 - Total Water Consumption (liters/person/day) 199.56 199.09 183.51 193.74 127.54
4.7 - Residential Consumption (liters/person/day) 75.03 50.56
6.1 - Non-Revenue Water(%) 37.50% 39.45% 35.87% 44.74% 36.34%
6.2 - Non-Revenue Water(m3/km/day) 42.18 43.74 35.48 53.56 39.93
8.1 - Water sold that is metered % (%) 100.00% 100.00% 100.00% 100.00% 100.00%
Priorities: Increase coverage with water, provide more wastewater services, and reduce non-revenue water. Increase water production to residential users.
Projects: Water intake, replacement of water pipes.
In 2015 WPNG developed is corporate vision to deliver either Water or Waste Water services to the two provincial townships and 16 district townships by 2018. The program had already started and continuing into 2016. Some the projects started in 2015 and are ready for commissioning are:
Yangoru Water Supply , estimated population of 2500 to 3000 people. Project commissioned and water sales to commence in July 2016.
Ravens Bores in Alotau – Water production improvement to enhance current supply reliability and new connections of up to 300.
Lorengau Sewerage is ongoing project
Wabag High School Water Project – Estimated population is 1000 people (school and others). Project completed in 2015.
Hati Bores Mt. Hagen – completed drilling and ready for installation, connections and commissioning.
There are ongoing CAPEX projects especially to replacement of existing lines. We are looking at increasing our sewerage connections too.
Benchmarking Report 2016 uto v8.indd 54 2/08/16 12:51 PM
B E N C H M A R K I N G R E P O R T | 5 5
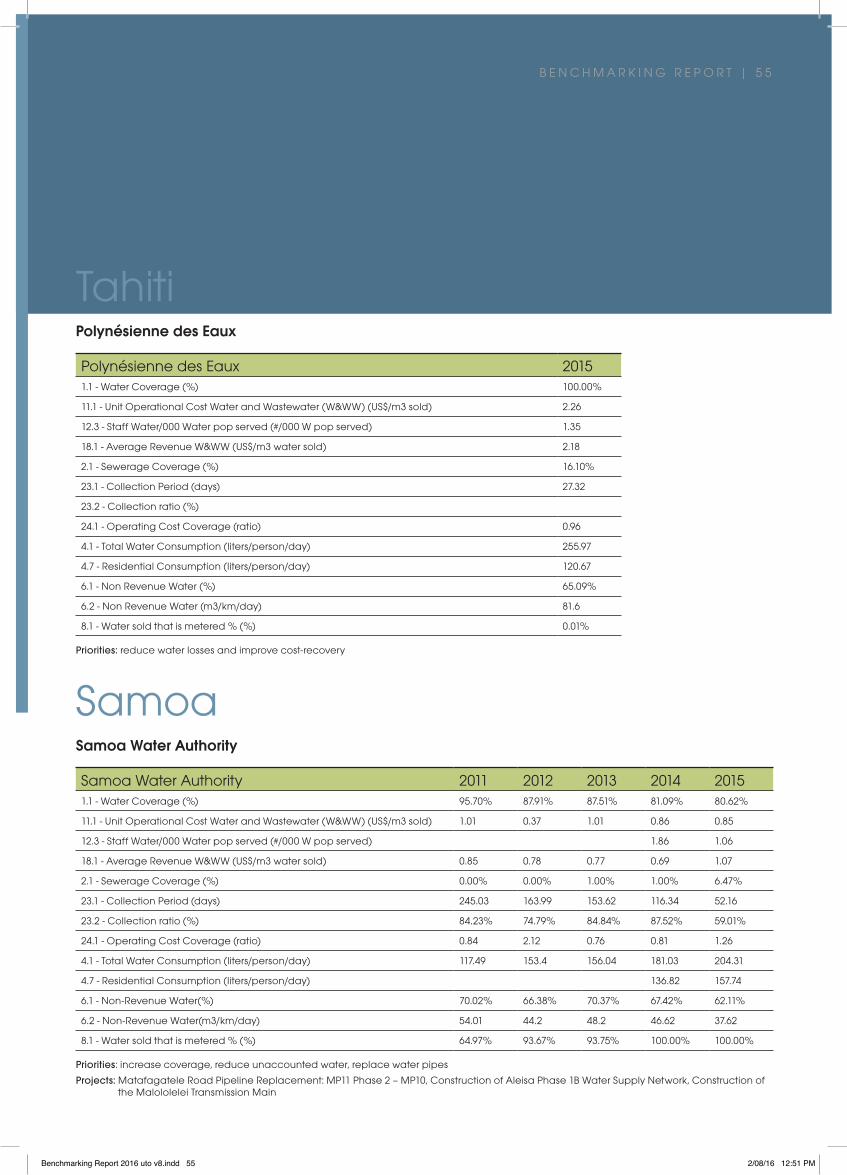
TahitiPolynésienne des Eaux
Polynésienne des Eaux 20151.1 - Water Coverage (%) 100.00%
11.1 - Unit Operational Cost Water and Wastewater (W&WW) (US$/m3 sold) 2.26
12.3 - Staff Water/000 Water pop served (#/000 W pop served) 1.35
18.1 - Average Revenue W&WW (US$/m3 water sold) 2.18
2.1 - Sewerage Coverage (%) 16.10%
23.1 - Collection Period (days) 27.32
23.2 - Collection ratio (%)
24.1 - Operating Cost Coverage (ratio) 0.96
4.1 - Total Water Consumption (liters/person/day) 255.97
4.7 - Residential Consumption (liters/person/day) 120.67
6.1 - Non Revenue Water (%) 65.09%
6.2 - Non Revenue Water (m3/km/day) 81.6
8.1 - Water sold that is metered % (%) 0.01%
Priorities: reduce water losses and improve cost-recovery
SamoaSamoa Water Authority
Samoa Water Authority 2011 2012 2013 2014 20151.1 - Water Coverage (%) 95.70% 87.91% 87.51% 81.09% 80.62%
11.1 - Unit Operational Cost Water and Wastewater (W&WW) (US$/m3 sold) 1.01 0.37 1.01 0.86 0.85
12.3 - Staff Water/000 Water pop served (#/000 W pop served) 1.86 1.06
18.1 - Average Revenue W&WW (US$/m3 water sold) 0.85 0.78 0.77 0.69 1.07
2.1 - Sewerage Coverage (%) 0.00% 0.00% 1.00% 1.00% 6.47%
23.1 - Collection Period (days) 245.03 163.99 153.62 116.34 52.16
23.2 - Collection ratio (%) 84.23% 74.79% 84.84% 87.52% 59.01%
24.1 - Operating Cost Coverage (ratio) 0.84 2.12 0.76 0.81 1.26
4.1 - Total Water Consumption (liters/person/day) 117.49 153.4 156.04 181.03 204.31
4.7 - Residential Consumption (liters/person/day) 136.82 157.74
6.1 - Non-Revenue Water(%) 70.02% 66.38% 70.37% 67.42% 62.11%
6.2 - Non-Revenue Water(m3/km/day) 54.01 44.2 48.2 46.62 37.62
8.1 - Water sold that is metered % (%) 64.97% 93.67% 93.75% 100.00% 100.00%
Priorities: increase coverage, reduce unaccounted water, replace water pipes
Projects: Matafagatele Road Pipeline Replacement: MP11 Phase 2 – MP10, Construction of Aleisa Phase 1B Water Supply Network, Construction of the Malololelei Transmission Main
Benchmarking Report 2016 uto v8.indd 55 2/08/16 12:51 PM
5 6 | B E N C H M A R K I N G R E P O R T
Samoa Independent Water Schemes Association:The Ministry of Women Community and Social Development is the leading agency in driving the development of the Independent Water Schemes project in Samoa assisted by the Independent Water Schemes Association. The Independent Water Schemes has just endorsed its “Community Water Schemes Act 2016” which formally legalized the IWS as a second water service provider in Samoa besides the Samoa Water Authority (SWA), a state owned enterprise.
Thirty-four independent water schemes (IWS) covers some 18% of the water to the popula-tion. These schemes vary in size providing water to a small village of 100 up to district-wide schemes providing water to multiple villages with several thousand connections (size of water schemes vary between 30- 300 household connections). The IWS are managed by the local community through water committees. The schemes are all gravity-fed utilizing water from streams and springs on the hillside with piping systems to households running down to the coastal area. In the past users have not generally been required to pay regular fees for water and as a result there is no regular maintenance system with repairs only being undertaken when absolutely necessary. The schemes are extremely old (most schemes were already built in the beginning of the 1900s during the colonial times or later immediately after independence by the (Public Works department) then and it is impressive that the communities have been able to keep them operating. The traditional community institutions in Samoa are well organized and are able to raise funds quickly to ensure water systems provide sufficient water at all times. However, these schemes are mostly very old and are now in need of major rehabilitation and upgrade.
Twenty four out of thirty-four schemes have completed major upgrade works at their spring and water intakes, storage and sedimentation tanks as well as new household connections connected to new main lines replacing the old iron pipes. Well-qualified contractors and supervising engineer consultants were recruited to construct and moni-tor the quality of implemented works. The MWCSD as the leading agency with the overall monitoring and supervision of the project along with the IWSA ensured all parties involved play their roles to ensure completion of quality works within the assigned timeframe.
The Government has recently introduced national drinking water standards and has commenced a regular monitoring programme of the water supply systems throughout the islands. Given the untreated water supply, only three of the thrity-four schemes have complied with ‘0 ecoli and coliform. The IWSA received funding from the Water Sector Co-ordination Unit early this year 2016 to procure household level treatment devices to help lessen ecoli and coliform at household taps. Four piloted schemes have been installed with forty treatment devices and these are closely monitored by the IWSA and MOH staff. The operation and the implementation of the IWS upgrade works as well as the water quality measures have improved and progressed well from year to year. Thanks to the EU and the Adaptation Fund from UNDP which helped achieved all.
Benchmarking Report 2016 uto v8.indd 56 2/08/16 12:51 PM
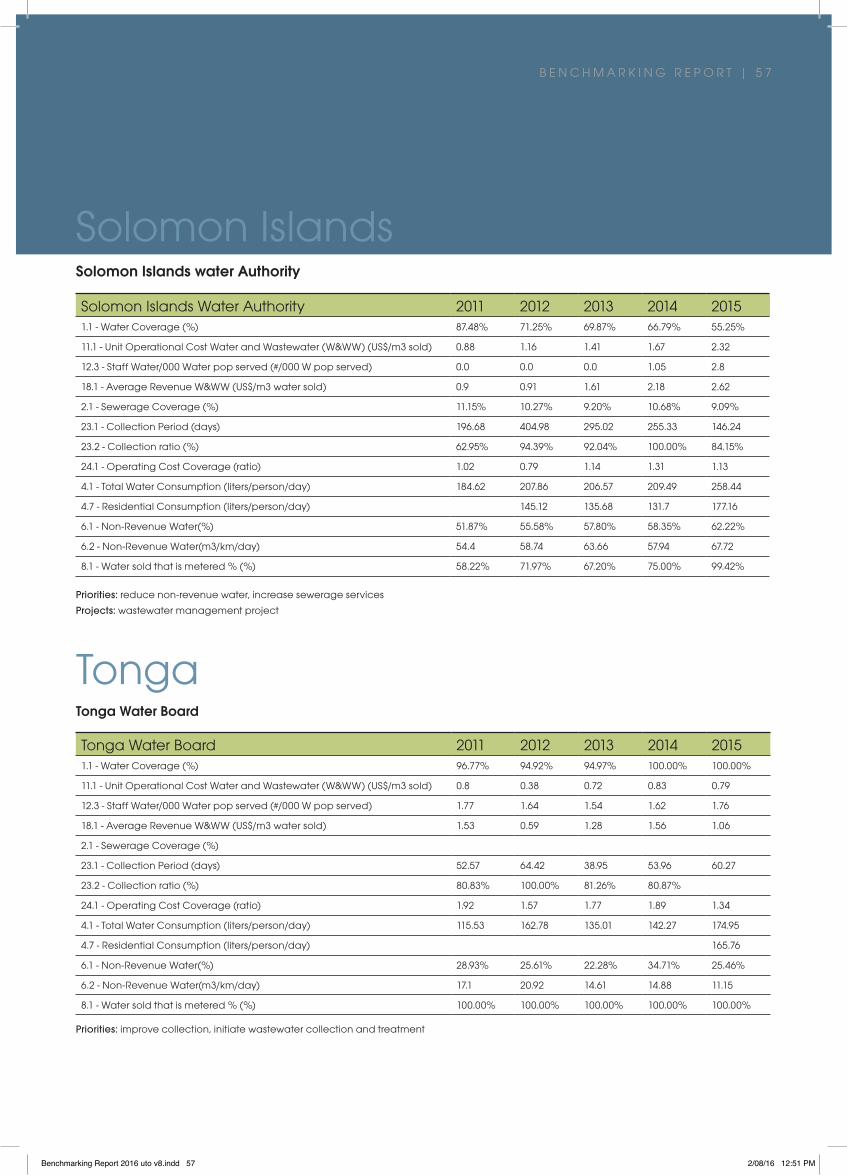
B E N C H M A R K I N G R E P O R T | 5 7
Priorities: reduce non-revenue water, increase sewerage services
Projects: wastewater management project
Solomon IslandsSolomon Islands water Authority
Solomon Islands Water Authority 2011 2012 2013 2014 20151.1 - Water Coverage (%) 87.48% 71.25% 69.87% 66.79% 55.25%
11.1 - Unit Operational Cost Water and Wastewater (W&WW) (US$/m3 sold) 0.88 1.16 1.41 1.67 2.32
12.3 - Staff Water/000 Water pop served (#/000 W pop served) 0.0 0.0 0.0 1.05 2.8
18.1 - Average Revenue W&WW (US$/m3 water sold) 0.9 0.91 1.61 2.18 2.62
2.1 - Sewerage Coverage (%) 11.15% 10.27% 9.20% 10.68% 9.09%
23.1 - Collection Period (days) 196.68 404.98 295.02 255.33 146.24
23.2 - Collection ratio (%) 62.95% 94.39% 92.04% 100.00% 84.15%
24.1 - Operating Cost Coverage (ratio) 1.02 0.79 1.14 1.31 1.13
4.1 - Total Water Consumption (liters/person/day) 184.62 207.86 206.57 209.49 258.44
4.7 - Residential Consumption (liters/person/day) 145.12 135.68 131.7 177.16
6.1 - Non-Revenue Water(%) 51.87% 55.58% 57.80% 58.35% 62.22%
6.2 - Non-Revenue Water(m3/km/day) 54.4 58.74 63.66 57.94 67.72
8.1 - Water sold that is metered % (%) 58.22% 71.97% 67.20% 75.00% 99.42%
TongaTonga Water Board
Tonga Water Board 2011 2012 2013 2014 20151.1 - Water Coverage (%) 96.77% 94.92% 94.97% 100.00% 100.00%
11.1 - Unit Operational Cost Water and Wastewater (W&WW) (US$/m3 sold) 0.8 0.38 0.72 0.83 0.79
12.3 - Staff Water/000 Water pop served (#/000 W pop served) 1.77 1.64 1.54 1.62 1.76
18.1 - Average Revenue W&WW (US$/m3 water sold) 1.53 0.59 1.28 1.56 1.06
2.1 - Sewerage Coverage (%)
23.1 - Collection Period (days) 52.57 64.42 38.95 53.96 60.27
23.2 - Collection ratio (%) 80.83% 100.00% 81.26% 80.87%
24.1 - Operating Cost Coverage (ratio) 1.92 1.57 1.77 1.89 1.34
4.1 - Total Water Consumption (liters/person/day) 115.53 162.78 135.01 142.27 174.95
4.7 - Residential Consumption (liters/person/day) 165.76
6.1 - Non-Revenue Water(%) 28.93% 25.61% 22.28% 34.71% 25.46%
6.2 - Non-Revenue Water(m3/km/day) 17.1 20.92 14.61 14.88 11.15
8.1 - Water sold that is metered % (%) 100.00% 100.00% 100.00% 100.00% 100.00%
Priorities: improve collection, initiate wastewater collection and treatment
Benchmarking Report 2016 uto v8.indd 57 2/08/16 12:51 PM
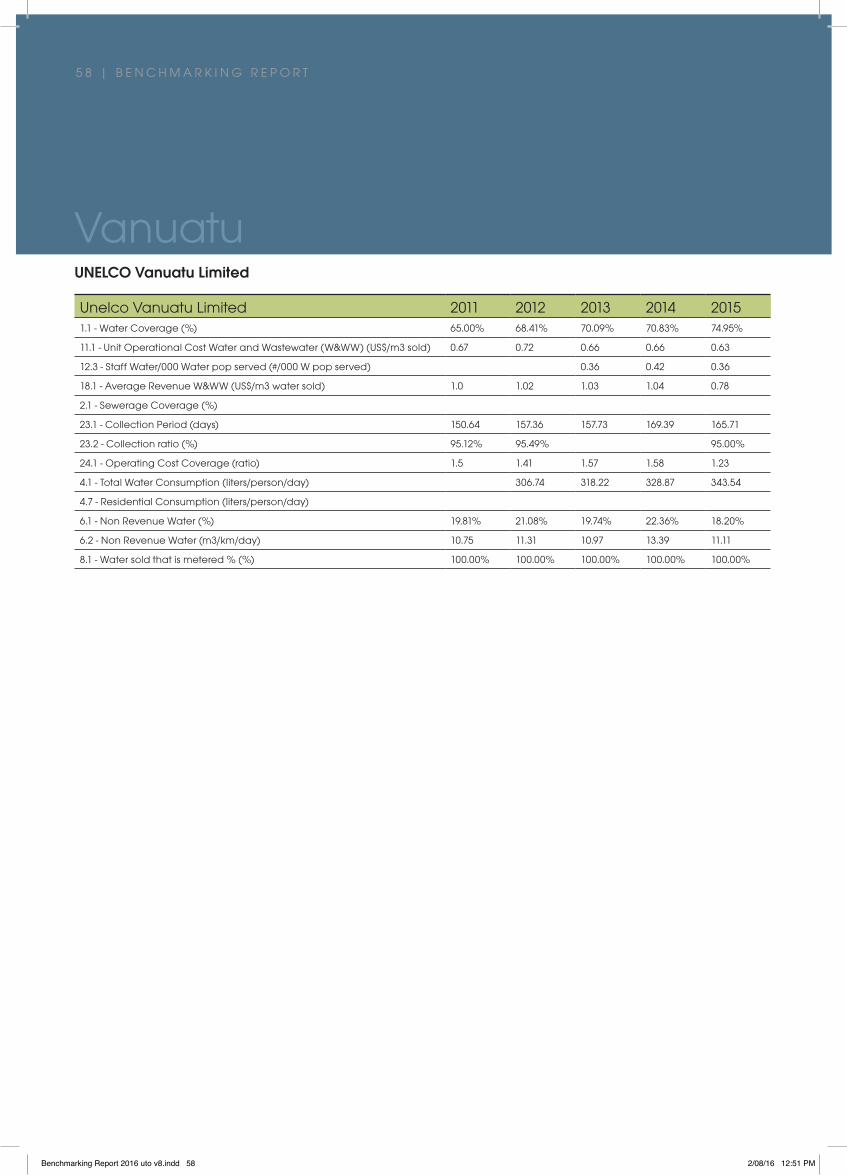
5 8 | B E N C H M A R K I N G R E P O R T
VanuatuUNELCO Vanuatu Limited
Unelco Vanuatu Limited 2011 2012 2013 2014 20151.1 - Water Coverage (%) 65.00% 68.41% 70.09% 70.83% 74.95%
11.1 - Unit Operational Cost Water and Wastewater (W&WW) (US$/m3 sold) 0.67 0.72 0.66 0.66 0.63
12.3 - Staff Water/000 Water pop served (#/000 W pop served) 0.36 0.42 0.36
18.1 - Average Revenue W&WW (US$/m3 water sold) 1.0 1.02 1.03 1.04 0.78
2.1 - Sewerage Coverage (%)
23.1 - Collection Period (days) 150.64 157.36 157.73 169.39 165.71
23.2 - Collection ratio (%) 95.12% 95.49% 95.00%
24.1 - Operating Cost Coverage (ratio) 1.5 1.41 1.57 1.58 1.23
4.1 - Total Water Consumption (liters/person/day) 306.74 318.22 328.87 343.54
4.7 - Residential Consumption (liters/person/day)
6.1 - Non Revenue Water (%) 19.81% 21.08% 19.74% 22.36% 18.20%
6.2 - Non Revenue Water (m3/km/day) 10.75 11.31 10.97 13.39 11.11
8.1 - Water sold that is metered % (%) 100.00% 100.00% 100.00% 100.00% 100.00%
Benchmarking Report 2016 uto v8.indd 58 2/08/16 12:51 PM
B E N C H M A R K I N G R E P O R T | 5 9
TokelauINSTITUTIONAL arrangementThere is no official water system, utility or organization/organizational structure in Tokelau to manage and monitor water resources, water demand and/ or water and sanitation facilities on each atoll.
The current rainwater harvesting systems are much improved compared to the poor conditions prior to the 2011 drought state of emergency. Improved rainwater harvesting systems were enabled under the work of the Pacific Adaptation to Climate Change Project (PACC+). Storage facilities are generally tanks within the foundations of houses, and due to the materials used in most houses constructed more than 20 years ago, these tanks are in a state that require repair work. External plastic tanks are being used more frequently but do not provide the volumes required by each household, and are normally used to supplement the foundation tanks.
FakaofoThe village population is about 600 people. The normal household demand for water is between 80 - 120 litres per person per day with the average household number being eight people, equating to a daily demand of 960 litres per household/ per day; and an annual demand of 350 cubic meters per household. The average storage capacity of a household is approximately 34 cubic meters according to a survey carried out by the Health department prior to the Water, Sanitation and Waste Management Integrated Review in 2010.
It would be difficult to install septic tanks for individual households in Fale (main island of Fakaofo) as the houses are very close to each other. Septic tanks require a disposal system that adds to the treatment process. Ideally these disposal systems should be shallow in nature and run through plants or trees. A piggery is housed on Fenuafala Island and situated well away from the inhabited areas of the village. The piggery poses little health risk to the community due to its location and due to the hand washing facilities provided and normal hygiene practices.
NukunonuThe village population is estimated to be about 450. The average number of people per household is 6 - 7, in 95 houses with about 80 households in the village - not all houses are inhabited. It is estimated that the normal household demand for water is at the top end of the range at 120 litres per person per day with the average household number being 7 people; equating to a daily demand of 840 litres per household per day, and an annual demand of 310 cubic meters per household.
The practice of pouring kerosene in water tanks to prevent mosquitoes is still carried out in the village. Nukunonu has installed predominately dual chamber septic tank systems that discharge
into the ground and directly into the groundwater. There is evidence that some septic disposal pits also exist around the village. Most properties have sealed toilets. A compost toilet trial was carried out for the village and two types of toilets – a normal two pit system and a four container system – were installed. Both toilets were set up as communal public toilets. These toilets found little support from the community and were abandoned due to cultural issues surrounding organic toilets.
There were a number of public ‘over water’ toilets around the village that are located over the lagoon. Only one is left in Nukunonu which is rarely used due to progressive community awareness towards the risks these facilities pose on Tokelau’s fragile environment.
AtafuThe average household is made up of 8 people with an average daily demand of water being 120 litres per person per day, which equates to a daily demand of 960 litres per household. The average storage capacity of households in Atafu is 38 cubic meters giving each household a storage capacity of 40 days based on average daily demand.
Rainwater harvesting is the only means of collecting water. These systems started to upgrade in 2011 after the State of Emergency Drought call. A First Flush Diverter (FFD) was installed in between the guttering and the main chamber to the tank, to filter out all unwanted debris, leaves and bird droppings. A part of the upgrade work includes ensuring that the community roof catchment areas are fully utilized with many large roofed areas not having been used to harvest rainwater in the previous years.
There is an old well that has not been used for many years. This well has a water level that is about two meters deep from ground level. This has been sealed off with cement. There is general concern about the safety of household water, accompanied by a fair knowledge within the community of the issues with safe drinking water quality. Practice of placing kerosene in drinking water tanks to prevent mosquitoes is carried out in this village. It was recommended that kerosene be placed in open tanks not connected to the house.
Dual chamber septic tank systems are the most common sewage treatment system used in the village. These systems are not based on any design criteria to treat sewage but rather are based on the building materials available. The septic tanks discharge directly to the ground and in some case directly into the water table. “Over water” toilets used to be commonplace around the village, and there is some evidence of the pollution on the shore front in the lagoon.
The piggery is outside of the village and poses minimal environmental and health risks to the people due to its location and due to effective hygiene.
Benchmarking Report 2016 uto v8.indd 59 2/08/16 12:51 PM
Benchmarking Report 2016 uto v8.indd 60 2/08/16 12:51 PM