benchmarking quality circles of sport 10th edition
TRANSCRIPT

Benchmarking Quality Circles of Sport
10th Edition
Conclusions Report
2012
Report made by:

2
Contents
1. Introduction .............................................................................................................1
2. Global Indicator analysis.........................................................................................10
2.1. Policy / Strategic goals dimension................................................................................ 10
2.2. Customer satisfaction dimension ................................................................................ 15
2.3. Human Resources & business process dimension ....................................................... 18
2.4. Financial management dimension ............................................................................... 21
2.5. Environment dimension .............................................................................................. 29
3. Workshop analysis..................................................................................................32
4. Conclusions ............................................................................................................35
Index of tables
Table 1. Participating Councils at the Sports BQC by segment population in 2012. ............... 6
Table 2. Summary with indicator’s changes ............................................................................ 7
Index of figures
Figure 1. Participation evolution at the Benchmarking Quality Circles of Sport .................... 5
Figure 2. Distribution of indicators by dimensions .................................................................. 7
Figure 3. 2011-2012 Comparison of the evolution of % of occupancy hours in pavilions in range
of 16 to 24 hours .................................................................................................................... 13
Figure 4. 2011-2012 Comparison of the evolution of % of occupancy
hours in fields in range of 16 to 24 hours .............................................................................. 13
Figure 5. Correlation between pavilions and football fields volume occupancy (from 17h. to
23h.) ....................................................................................................................................... 14
Figure 6. % of occupancy intensity in a standard week in a sports complex ........................ 15
Figure 7. Municipalities Distribution by its average monthly price ....................................... 17
Figure 8. Sports workers distribution..................................................................................... 18
Figure 9. Comparison of the percentage of employed women with the total number of
municipal workers in other services participating at BQC 2012 ............................................ 19
3
Figure 10. Comparison of the percentage of sick leave hours on total work days with different
services participating at BQC 2012 ........................................................................................ 20
Figure 11. Comparison of formative hours per employee with other participant services at BQC
2012........................................................................................................................................ 21
Figure 12. Comparison of the indirect and direct management percentage of the sports service
with other participating services at BQC 2012....................................................................... 22
Figure 13. Comparison of current expenditure per inhabitant in sports with other services that
have participated in BQC 2012............................................................................................... 23
Figure 14. Correlation between current expenditure in sport (including concessions) per capita
and % of population registered and / or paid to local sports services on total population .. 23
Figure 15. Expenditure breakdown per hour by typology of activity, for years 2011 and 2012
……………………………………………………………………………………………………………………………………………25
Figure 16. Comparison of funding distribution for years 2010, 2011 and 2012.................... 26
Figure 17. Comparison of % self-financing of sports services with the other services involved in
BQC 2012................................................................................................................................ 27
Figure 18. Expenditure breakdown in power supplies for years 2011 and 2012 .................. 28
Figure 19. Distribution of total employed people by type in sports entities......................... 29

4
1. INTRODUCTION
Gerència de Serveis d’Esports is working on a set of baseline studies in order to expand
knowledge of the local sports system and contribute to the improvement of municipal
sports services. In this scenario of research and innovation, there is a need to share
comparable information on a platform that facilitates and allows having clear
references to boost municipal policies. For this reason, Gerència de Serveis d’Esports
and Servei de Programació are promoting the Benchmarking Quality Circles of Sport
(hereinafter BQC) with the aim of improving sporting services as a shared methodology
for other municipal services, allowing comparison.
The Sports BQC allows the comparison of indicators for the management of local
sports system between different municipalities in the province of Barcelona of over
10,000 inhabitants. This document presents the information concerning the results of
the Report Summary for the year 2012 with the following objectives:
� Analyze the results of the management indicators for the 53 municipalities of
the province of Barcelona, taking into account the average of all municipalities,
changes from previous editions and differences by population brackets.
� Collect the strengths and opportunities for improvement in management that
are extracted from the indicators.
� Submit reflections made by the different groups in the workshop to improve
this year, explaining the strengths which have helped to improve the indicators
that each group worked on.
� Present the main study conclusions.
This year is the 10th edition of Sports BQC with 53 municipalities over of 10,000
inhabitants (except two municipalities of over 7,000) and 73 local sports technicians1,
increasing the number of municipalities participating in recent editions.
1 In some municipalities is participating more than one technician.
5
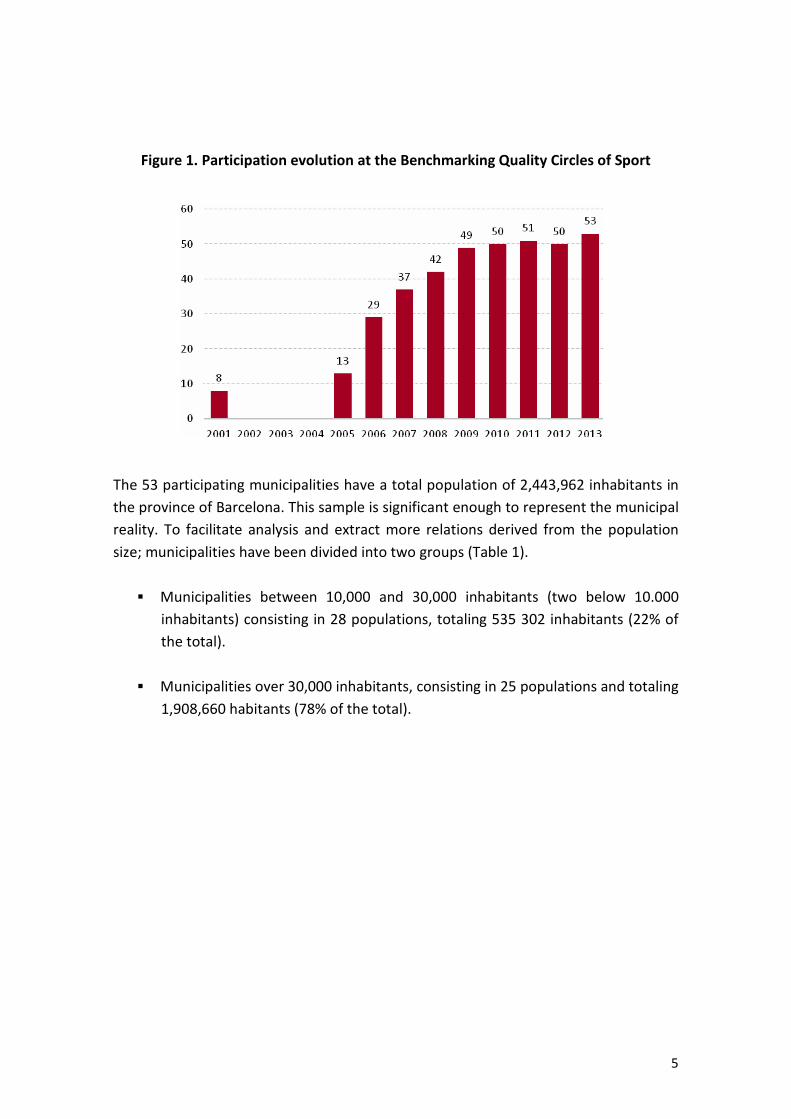
Figure 1. Participation evolution at the Benchmarking Quality Circles of Sport
The 53 participating municipalities have a total population of 2,443,962 inhabitants in
the province of Barcelona. This sample is significant enough to represent the municipal
reality. To facilitate analysis and extract more relations derived from the population
size; municipalities have been divided into two groups (Table 1).
� Municipalities between 10,000 and 30,000 inhabitants (two below 10.000
inhabitants) consisting in 28 populations, totaling 535 302 inhabitants (22% of
the total).
� Municipalities over 30,000 inhabitants, consisting in 25 populations and totaling
1,908,660 habitants (78% of the total).

6
Table 1. Participating Councils at the Sports BQC by segment population in 2012
Councils + 10 Inhabitants
2012 Councils + 30
Inhabitants
2012
Sant Esteve Sesrovires 7,510 Barberà del Vallès 32,436
Matadepera 8,669 Sant Joan Despí 32,792
Abrera 11,870 Sant Adrià de Besòs 34,482
Castellbisbal 12,407 Ripollet 37,422
Sant Sadurní d'Anoia 12,482 Vilafranca del Penedès 39,035
Vilanova del Camí 12,585 Igualada 39,198
Torelló 13,883 Vic 41,191
Palau-solità i Plegamans 14,484 Sant Feliu de Llobregat 43,671
Garriga, La 15,472 Gavà 46,488
Sant Just Desvern 15,874 Esplugues de Llobregat 46,726
Berga 16,845 Mollet del Vallès 52,242
Sant Celoni 17,076 Cerdanyola del Vallès 57,892
Cardedeu 17,427 Granollers 59,954
Parets del Vallès 18,492 Castelldefels 62,989
Calella 18,529 Prat de Llobregat, El 63,162
Franqueses del Vallès,
Les 19,023 Viladecans 65,188
Vilassar de Mar 19,918 Vilanova i la Geltrú 66,591
Manlleu 20,416 Rubí 74,484
Esparreguera 21,856 Manresa 76,570
Castellar del Vallès 23,363 Sant Boi de Llobregat 83,070
Molins de Rei 24,805 Sant Cugat del Vallès 84,946
Santa Perpètua de
Mogoda 25,606 Cornellà de Llobregat 87,458
Pineda de Mar 26,066 Sabadell 207,938
Sant Andreu de la Barca 27,306 Terrassa 215,678
Martorell 28,070 Hospitalet de Llobregat, L' 257,057
Sant Vicenç dels Horts 28,084
Premià de Mar 28,145
Sitges 29,039
This edition has kept the indicators that were redefined in the previous edition: 40
indicators divided into 4 dimensions and 7 environmental data.
Political dimension is the one with a higher volume of indicators, followed by the
economic dimension and organizational settings. The environmental data is those that
allow a better understanding and interpretation of the data analysis.

7
Figure 1. Distribution of indicators by dimensions
This year, there have been some changes in indicators or definitions for the
improvement and unification of criteria for data collecting. Changes are shown in the
following table:
Table 1. Summary with indicator’s changes
DIMENSION MODIFIED INDICATORS DESCRIPTION
I. POLICY /
STRATEGIC
GOALS
DIMENSION
• % of people who do
physical activity of
the total population
aged 16+
Indicator's title is removed from concept; and it starts
by counting total number of people over 16 years
doing physical activity out of the total population
over 16 years; regardless of their regularity (includes
non-daily uses). This variable is obtained from the
response to the survey question of habits "Do you
practice sport?" Answer will include conscious
activity practice.
• % Under 16 years
users
Indicator's title is removed from concept; and it starts
counting total number of people below 16 years
doing physical activity on total population below 16
years; regardless of their regularity (includes non-
daily uses). This variable is not included this year, but
remains inside the table, waiting on a clear and
homogenous way to calculate this indicator.

8
• % People using town
sports facilities with +16
years
Indicator's title is removed from concept; and
it starts by counting the total number of
people aged over 16 who use municipality
sports facilities on the total population over
16 years; regardless of their regularity
(includes non-daily uses). This variable is
obtained from the response to the survey
question of habits "Do you use sport facilities
of your municipality?”
• % Public schools users
per 1,000 inhabitants
Indicator's title is removed from concept; and
it starts by counting total users in public
schools on total population, regardless of
their regularity (includes non-daily uses).
This indicator is now calculated per 1,000
inhabitants instead of per 100 regular users.
I. POLICY /
STRATEGIC GOALS
DIMENSION
• % Weekly uses in
pavilion (PAV) from
17:00 to 23:00 in hours
• % weekly uses in fields
(CAM) from 17:00 to
23:00 in hours
Both indicators’ title now includes "from
17:00 to 23:00h".
II. CUSTOMER
SATISFACTION
DIMENSION
• Average price of a single
monthly payment at a
sports complex
This indicator specifies that the average price
of a single monthly payment in a sports
complex must refer to the variable value on
December 31st of the studied year.
• Number of municipal
full-time workers in
sport for each 10,000
inhabitants
• % Female employees of
total municipal workers
• Annual training hours
for municipal workers
Nomenclature changes: municipal worker
tells us about “contracted people” instead of
working days.
III. HUMAN
RESOURCES &
BUSINESS PROCESS
DIMENSION
• Number of full-time
workers in service
contracts per 10,000
inhabitants
Breakdown indicator: service contract
workers and employees of concessions.
Nomenclature changes: service companies
become "service contracts" and from now

9
• Number of full-time
workers in concessions
per 10,000 inhabitants
on, variables' definitions tells us about
"contracted persons" instead of working
days.
• % Current expenses on
indirect management
The % on indicator’s title now refers to
current expenses.
• % Full-time workers in
indirect management
(concessions) of total
workers
New indicator.
V. ENVIRONMENT
DIMENSION
• Number of persons
employed in the sports
sector per 100
inhabitants
Variable “Number of persons employed in the
sports sector" now includes per 100
inhabitants.
Regarding the indicator "overall customer satisfaction in a sports complex" a new
methodology has been launched this year for collecting information, and results will be
visible in the next edition. This methodology consists of conducting an online survey,
promoted by Diputació de Barcelona, in all municipal sports centers of the
municipalities participating in the BQC. To carry out the poll, different questionnaires
were distributed via email and via posters, with QR2 codes, that led to custom
satisfaction surveys for each center. Afterwards, results were analyzed and the value
of the indicator "overall customer satisfaction in a sports complex" was obtained. Each
municipality shall have the specific database of its facilities and of the rest, to keep
track of the information obtained.
2 “Quick response code”: It is a module for storing information in a two-dimensional array of points
which can be read from any mobile device using the corresponding application.

10
2. GLOBAL INDICATOR ANALYSIS
To understand the following analysis, it is important to follow the four dimensions
included in the table of indicators table: Policy / Strategic goals dimension, Customer
satisfaction dimension, Human Resources & business process dimension, Financial
management dimension and Environment dimension. To improve the analysis
different perspectives will be used in the results interpretation:
• Data analysis of the year 2012.
• Time perspective, comparing previous years’ indicators that have been
measured in the same way.
• Perspective by population brackets previously mentioned.
• Correlations between indicators, in the cases in which there is
correlation or to find the ones which seem to be correlation but in fact
do not.
• Indicators comparison that allows cross-context sports services with
other municipal services.
2.1. POLICY / STRATEGIC GOALS DIMENSION
The political dimension indicators include those related to users, both in terms of
access to practice, supply and promotion of this and the place in which it is performed.
In relation to the aim 'Promote the sport in town' we note that there is an average of
49% people who do regular physical activity on total population aged 16 or more. On
the other hand in relation to users under 16 years, the process of validating
methodology used for data collecting is still ongoing.
The aim indicator 'Promote sports associative network' allow us to see the weight of
sporting entities on the municipal sports system. The aim indicator 'Promote the sport
associative network' lets us see the weight of sporting entities on the municipal sports
system. Sport organizations represent 19% on the total population, increasing by two
points from the previous year. The percentage of users of sport organizations on total
population increased from 7% to 8%.

11
Promote sports associative network 2011 2012
% social mass sports organizations on total population
17 % 19 %
% sports users on total population 7 % 8 %
In the sub dimension 'Promote social cohesion' users who receive public aid per 1,000
inhabitants increases from 3.8 to 5.2. This increase is particularly evident in
municipalities with more than 30,000 inhabitants with a growth of 2 points, while in
municipalities below 30,000 inhabitants value remains at the same level as in the past
year. Notably, despite the increase, this element still has no significant impact on the
municipal budget. If the upward trend continues in coming years, their impact in terms
of budget might be more relevant, as it happens in other municipal services.
Promote social cohesion 2011 20123.75 5.16 average
2.4 2.4 + 10,000 inhab
4.0 6.0 + 30,000 inhab
Users who receive subentions per 100 inhabitants
In relation to the aim 'Facilitate public access to sports' we note that this trend has the
same value as the past year in terms of available places in continuous activities per
1,000 inhabitants. In offered places from sport entities there is an increase from 63 to
66.
Facilitate public access to sports 2008 2009 2010 2011 2012Available places in continuing activities per 1000 inhabitants
140 129 150 132 133 →Available places in continuing activities per 1000 inhabitants in sports organization
59 59 62 63 66
In relation to the aim 'Facilitate citizens access to activities' we note that there is an
increase in number of hours of continuous activities per 1,000 inhabitants, going from
319 in 2011 to 328 in 2012. After reducing the number of hours of specific activities
per 1,000 inhabitants, need to say that has risen 1 point up to 7 hours of specific
activity per 1,000 inhabitants.

12
Facilitate citizens access to activities 2008 2009 2010 2011 2012Number of hours of continuous activities per 1,000 inhabitants
278 269 274 319 328 ↑Number of hours of specific activities per 1,000 inhabitants
13 8 9 6 7
In the objective 'Promote use of sports facilities' those indicators related to sporting
facilities in the municipality. Like the past year, 34% of the population over 16 years
uses sports facilities. Moreover, there has been a decrease in the use of public school
sport spaces, going from 35 to 27 users per 1,000 inhabitants. If this indicator is
analyzed by municipalities by population brackets shows that this indicator increases in
the municipalities of 10,000 to 30,000 inhabitants, going from 25 to 28 users. On the
other hand, municipalities over 30,000 inhabitants have seen an important change,
decreasing from 37 to 27 practitioners. A possible explanation for this item decrease is
that resources in stimulating and guiding 'open playground' programs existing in a
quite municipalities, has also registered a decrease.
In relation to usage volume in a pavilion for a standard week, they have the same ratio
than the past year from 17 to 23 hours with a 92% of use. In case of football fields it
increases by 4%, going from 74% to 78%.
The following figure shows the evolution of occupied hours average on total opening
hours throughout the afternoon in pavilions, from 16 to 24 hours, between years 2011
and 2012. There is a slight increase in total average.

13
Figure 2. 2011-2012 Comparison of the evolution of % of occupied hours in
pavilions in range of 16 to 24 hours
In relation to football fields uses there is an important variation between 2012 data,
regarding the 2011 season. It is noted that, in particular from 17 to 18 hours, exists an
increase by 11% in volume, going from 33% to 44%.
Figure 3. 2011-2012 Comparison of the evolution of % of occupied
hours in fields in range of 16 to 24 hours
Making a correlation between these two indicators we observe that there is a trend
where municipalities with a larger volume of occupancy in pavilions also have a high
volume in football fields.

14
Figure 4. Correlation between pavilions and football fields volume
occupancy (from 17h. to 23h.)
An indicator incorporated in the last edition is the % of occupancy intensity in a
standard week in a sports complex, with a result of 49% for 20123. This calculation
takes into account the total number of participants in offered activities at swimming
pools and activity rooms and use of free-form pool. The intensity of each of these
activities on their total capacity is shown in the following figure. Swimming lessons are
those with a larger volume of occupancy in relation to existing supply, whereas the
free use is the one with a smaller occupancy, also considering that being a free activity
and being open the whole day, it is the activity with more available spaces.
3 Notably, unlike the analysis of the occupation of pavilions and fields, in the case of the intensity of use
of a sports complex, is taken into account the whole opening hours, supply and demand with number of
spaces.

15
Figure 5. % of occupancy intensity in a standard week in a sports complex
The last indicator of political dimension refers to m2 of sport facilities per 1,000
inhabitants. Infrastructure is one of the most important features to ensure the quality
of sports. Average result for municipalities analyzed is 1,296m2 of sports facilities per
1,000 inhabitants.
2.2. CUSTOMER SATISFACTION DIMENSION
This dimension includes indicators that provide data of the municipal sport services
users. The aim 'Promote the use of municipal sport services' shows that the
percentage of people registered to local sports services is 12.9% on the total
population and a decreasing trend has been observed in recent years. Population
percentage that paid a municipal sports complex remains constant around 10%
population.
Promote the use of municipal sport services 2008 2009 2010 2011 2012
% of the population registered to municipal continuating sports services on total population
14.5% 14.2 % 13.4 % 13.34 % 12.9 % ↓
% of the population registered to a sportive municipal complex on total population
10.2 % 9.9 % 9.9 % 10.1 % 9.9 %

16
If this data is segmented by municipalities in 2 population sections, it is shown that
both indicators are inversely proportional to size population. Smallest population has a
higher percentage of the population paid and / or registered, between 12.5 in bigger
municipalities and 14.6 in smallest population.
Promote the use of municipal sport services 2011 201213.34 % 12.86 % average
17.1 % 14.6 % + 10,000 inhab
12.6 % 12.5 % + 30,000 inhab
10.1 % 9.9 % mitjana
12.7 % 11.6 % + 10,000 inhab
9.7 % 9.5 % + 30,000 inhab
% of the population registered to municipal continuating sports services on total population
% of the population registered to a sportive municipal complex on total population
The price of single monthly payment at a sports complex is defined as share of a
municipal sports complex that includes the free use of the sports facilities of the pool,
the fitness room and a minimum of 15 hour of activities led on a week. There was an
increase in the average price of the share between 2011 and 2012. VAT on sports
services increased from 8% to 21% on September 1st
, 2012, through reduced VAT on
general VAT. Contrary to what one might expect, 15 municipalities with a direct
management model of its municipal sports complex increase in 2 € the monthly
payment, and 24 municipalities with indirect management, increased by only 1 €4.
Considering that subscription prices in direct management models are proportionally
lower than indirect management, it follows that tax effect has not had effect in 2012. It
is possible that the need to reduce equipment costs has caused those who had lower
prices increase them.
Provide a quality service 2011 2012
Price of single monthly payment at a sports complex 34.49 35.55
4 There are 48 municipalities with sportive complex. 24 with an indirect management, 15 with direct
management and 11 with different management modalities because there is more than one sportive
complex in the municipality.

17
If the volume of municipalities for each range of price in the monthly payment of the
previous edition is compared, it is evident that the 36 municipalities, which in 2011
were located in the middle belt, in 2012 5 of them are in the more than 43 €/month
range. 4 new municipalities, or the ones that did not provide data in 2011, are located
in the middle range and 1 in the highest range5.
Figure 6. Municipalities Distribution by its average monthly price
Has not been detected a correlation between the individual subscription price and the
modality management. Neither with the % of population subscribed on total
population.
This data is supplemented with the ones obtained in the recent study 'Survey about
the use and management of sports facilities with an indoor pool in Catalonia'
conducted by the General Secretariat of Sports (SGE) 20136. This study highlights the
large price difference between direct and indirect management in public centers.
Complete Monthly bonus N €
Public Ownership 136 36.8 €
Council Direct 31 25.5 €
Public Entity Direct 30 33.4 €
Associative Entity Direct 31 40.7 €
Entrepreneurial Society 44 43.9 €
Private Ownership 23 51.7 €
General Total 159 38.5 €
5 There are participant 2 municipalities in 2011 edition which are not participating in 2012.
6 This study has been done with 2013 data, and the current study with 2012 data.

18
SGE study is hardly comparable with the data obtained from BQC. Firstly, the SGE
study is focused on the complex and BQC study provide global municipal results.
Secondly, the data of this study are from 2013 and the analyzed data in BQC are from
2012.
2.3. HUMAN RESOURCES & BUSINESS PROCESS DIMENSION
This dimension includes those indicators related to service organization in human
resources terms and the direct or indirect management of these. This year in the
dimension which reflects human resources there has been a distinction between:
1. Council workers, sports patronage or municipal companies with a public capital
of 100%.
2. Services companies, contracted by the council, workers.
3. Companies contracted in administrative concessions workers.
The following figure shows that group 3 workers correspond to 36% of total workforce.
Then group 3 workers correspond to 34% and group 2 to 30%. The distribution is quite
equal among the three groups.
Figure 7. Sports workers distribution
19
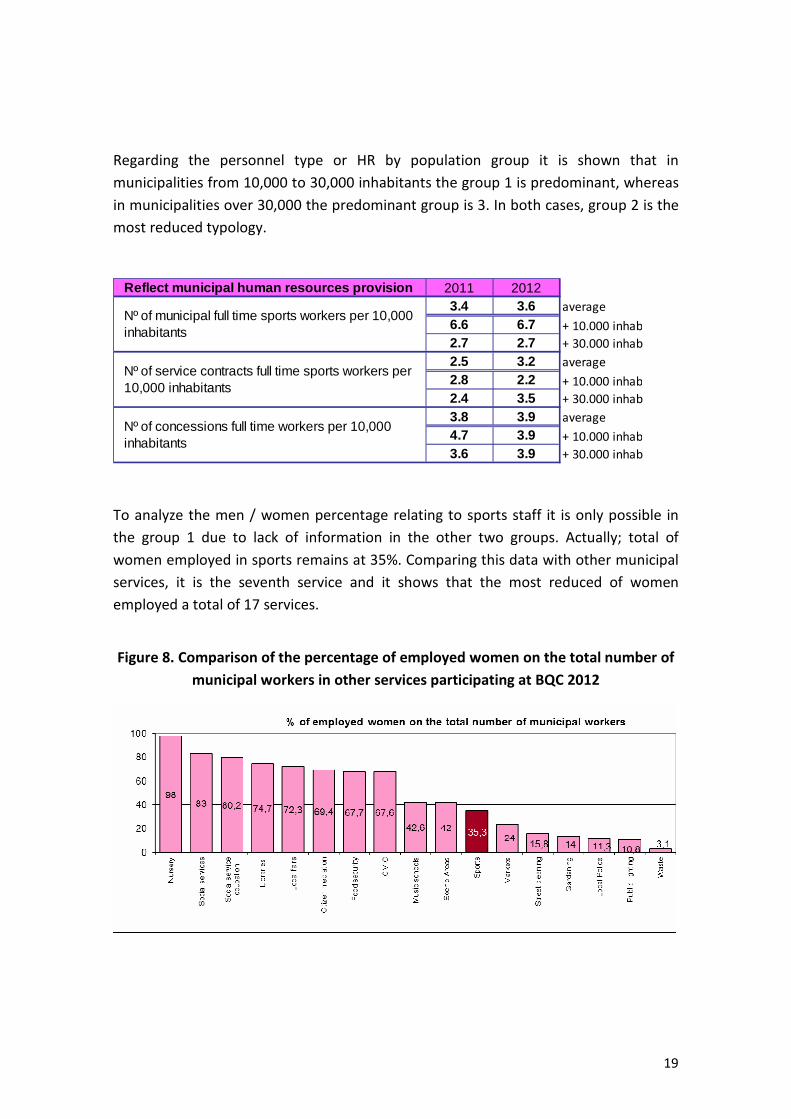
Regarding the personnel type or HR by population group it is shown that in
municipalities from 10,000 to 30,000 inhabitants the group 1 is predominant, whereas
in municipalities over 30,000 the predominant group is 3. In both cases, group 2 is the
most reduced typology.
Reflect municipal human resources provision 2011 20123.4 3.6 average
6.6 6.7 + 10.000 inhab
2.7 2.7 + 30.000 inhab
2.5 3.2 average
2.8 2.2 + 10.000 inhab
2.4 3.5 + 30.000 inhab
3.8 3.9 average
4.7 3.9 + 10.000 inhab
3.6 3.9 + 30.000 inhab
Nº of concessions full time workers per 10,000 inhabitants
Nº of municipal full time sports workers per 10,000 inhabitants
Nº of service contracts full time sports workers per 10,000 inhabitants
To analyze the men / women percentage relating to sports staff it is only possible in
the group 1 due to lack of information in the other two groups. Actually; total of
women employed in sports remains at 35%. Comparing this data with other municipal
services, it is the seventh service and it shows that the most reduced of women
employed a total of 17 services.
Figure 8. Comparison of the percentage of employed women on the total number of
municipal workers in other services participating at BQC 2012

20
In the aim "Promote a positive work environment for municipal employees" it was
observed that a gross wage based monitor / municipal sports was decreasing from
22,176 € to 21,232 € per year. A slight increase in the percentage of sick days from
2.4% to 2.7% was also observed.
Promote a positive work environment for municipal employees
2011 2012
% of sick leave days on total working days 2.38 % 2.66 %
Municipal workers gross basic salary 22,176 21,232
When sports services are compared with other municipal services participating in BQC
it is observed that sports occupies a central position but below average and similar to
local employment services and markets.
Figure 9. Comparison of the percentage of sick leave hours on total work days with
different services participating at BQC 2012

21
In the aim 'Improve workers skills' it was apparent that there was a decrease in the
percentage of municipal employees who have done some training in 2012 as well as
the annual training hours of training per municipal employee.
Improve workers skills 2011 201249 % 47 % average
42 % 38 % + 10.000 inhab
54 % 55 % + 30.000 inhab
12.2 8.1 mitjana
6.8 5.2 + 10.000 inhab
15.1 10.0 + 30.000 inhab
% of workers who had attend to courses on total municipal workers
Annual training hours per employee
If we compare by population range, it is observed that in towns over 30,000 there is a
higher number of workers who attended training courses, as well as a higher volume
of training hours.
Comparing the average number of training hours for each municipal employees -8.1
hours- with other services participants at BQC it is observed that sports services are 5
positions down.
Figure 10. Comparison of formative hours per employee with other participant
services at BQC 2012

22
Indirect management percentage calculation in the aim "Managing service with
different managing ways" is done keeping in mind the current expenditure on sports
concessions in relation to the total current expenditure on sports including
concessions.
This stands at 45%. Comparing this data with other services participating at BQC 2012,
Sports remains the service with a greater balance between direct and indirect
management model.
Figure 11. Comparison of the indirect and direct management percentage of the
sports service with other participating services at BQC 2012
2.4. FINANCIAL MANAGEMENT DIMENSION
The fourth dimension includes those indicators related to the development of the
municipal sports services resources funding. The aim 'Having the adequate resources
for the Sports Section' show that the usual expense on sports (grants included) per
capita is 62.9 € which shows a small increase over the previous edition. Following the
same tendency as in previous editions, there is a significant difference according to
sections. The more inhabitants the lower expense per capita due to the ease of
generating economies of scale where more people inhabit.

23
Provide adequate resources for the sports service 2011 2012
59.52 62.93 average
73.43 74.5 + 10,000 inhab
56.9 60.0 + 30,000 inhab
Usual expense on sports (concessions included) per inhabitant
This datum would be the second compared to the other sections involved in the BQC,
only behind the District Police.
Figure 12. Comparison of current expenditure per inhabitant in sports with other
services that have participated in BQC 2012
Bearing in mind the possible correlation with usual expense per inhabitant, it becomes
clear that there is a connection between the expense amount and the % of subscribers
and / or registered in the municipal sport services. From this correlation we could work
out that a higher amount of financial resources earmarked to the promotion of sport
along with a network of qualified sports facilities, derives a bulk of the population
practicing and user programs and local sports facilities. In this context, it has also
found a positive correlation between current expenditure on sport (grants included)
per inhabitant and the % of population registered and/or subscribed to continuing
local sports services on total of population.

24
Figure 13. Correlation between current expenditure in sport (including concessions)
per capita and % of population registered and / or paid to local sports services on
total population
Within the target itself we observe that the usual expenses percentage on sports
(including grants) of the total district expenses is 7.6% with a growing tendency in the
last three years. This growth does not seem to be caused by an increase of importance
of itself in town but due to the high volume of fixed costs from the sports facilities
management, such as staff or consumption.
Provide adequate resources for the sports service
2010 2012 2012
Usual expense on sports (concessions included) on total municipal expense
6.9% 7.19% 7.56%
Regarding the aim 'Provide adequate resources for the sports service' we notice an
increase in usual expense per inhabitant up to 9.9 €, being in 2011 of 9.6 € per
inhabitant. Therefore, this increase takes place in both sections of the population, as
well as in larger municipalities such expense in activities per inhabitant is lower due to
economies of scale.
Provide adequate resources for the sports service
2011 2012
9.57 9.94 average
12.26 12.66 + 10,000 inhab
8.82 8.96 + 30,000 inhab
Usual expense on activities per inhabitant

25
On the other hand, the usual expense of activities per hour decreased to 23.7 € from
26.4 €.
Provide adequate resources for the sports service 2011 2012
23.7Usual expense on activities per hour 26.4
If we reconcile the % of population registered and / or subscribed and the usual
expense in activities per inhabitant, we conclude the higher usual expense the more %
of population registered and / or subscribed. However, some municipalities have been
detected as able to have a population of % registered highly above the average due to
the economic resources destined, as well as a town with a big expense that has a % of
registered population below 10%.
It is worth highlighting that the increase in usual expense per inhabitant activity has
not been translated into a registered population increasing to local sports services.
Whereas current spending has increased 0.3 € per capita, % of registered population
has decreased from 13.5% to 12.9%. Current expenditure, as observed for each hour of
activity, has decreased from 26.4 € in 2011 to 23.7 € in 2012, i.e. 10.2%. Data reflects
that quality is changing versus quantity municipal sports offer, in both programming
activities like in service supply.
When expenditure distribution is analyzed by activity type, it shows that this decrease
happens in both continuing operations and in specific activities.

26
Figure 14. Expenditure breakdown per hour by typology of activity, for years 2011
and 2012
In the objective 'Support the promotion of sport entities' the downward trend
continues in the displayed expenditures in current transfers to sports organizations per
capita, although this has not a notorious magnitude in relation to existing decline in
previous editions.
Support the promotion of sport entities
2009 2010 2011 2012
Expenditure on current transfers to sport entities per inhabitant
5.89 4.92 3.95 3.92 ↓
In the objective 'Suitable funding service' there is a continuity trend in self-funding for
taxes and public prices with a 57.6% which is a slight decrease from the previous
edition. This decrease reflects the increase by town funding.
Suitable funding service 2009 2010 2011 2012% Self-financing by rates and public prices
57.17% 59.04% 60.18% 57.58%
% Self-financing by contributions from other institutions
1.88 2.12 0.73 0.7
% Self-financing by the council 40.63 38.83 39.07 41.72
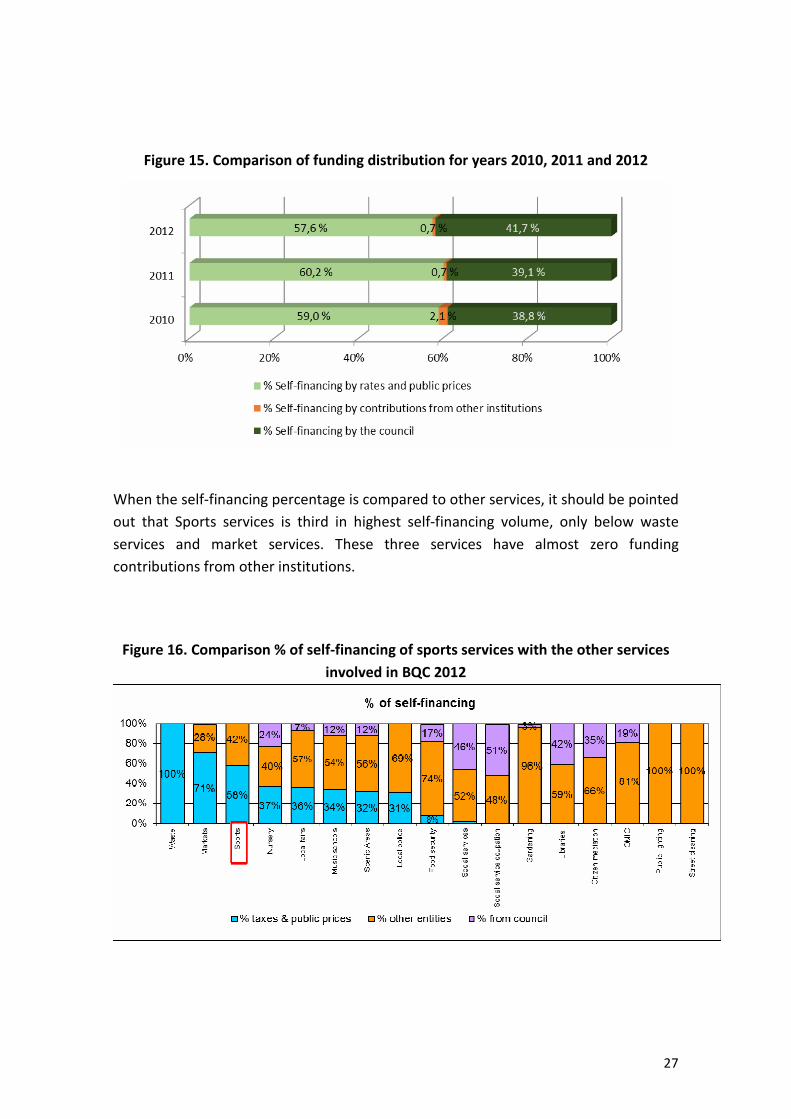
27
Figure 15. Comparison of funding distribution for years 2010, 2011 and 2012
When the self-financing percentage is compared to other services, it should be pointed
out that Sports services is third in highest self-financing volume, only below waste
services and market services. These three services have almost zero funding
contributions from other institutions.
Figure 16. Comparison % of self-financing of sports services with the other services
involved in BQC 2012

28
The ultimate aim of the economic dimension refers to 'Provide adequate resources in
sport facilities'. Percentage of investment in sports (including concessions) on total
municipal investment (past 5 years) stood at 9.4%, close to the previous edition's value
set at 9.1%.
Provide adequate resources in sport facilities
2012
% of investment in sports (including grants) of total municipal investment (last 5 years)
9.4%
Regarding the indicator % of current expenditure on repair and maintenance (including
concessions) of total current expenditure in sports, there is a decrease in relation to
the previous year. The current economic situation, coupled with budget reductions,
forces municipalities to act only in corrective maintenance and preventive
maintenance. This strategy will not be sustainable in medium and long term.
Provide adequate resources for the sports service
2011 2012
7.8% 7.2% average
7.0% 6.0% + 10,000 inhab
8.0% 7.6% + 30,000 inhab
% of current expenditure on repair and maintenance (including concessions) of total current expenditure in sports
Regarding the indicator percentage of current expenditure on supplies (including
concessions) on total current expenditure in sports, it has increased from 11.2% to
12.7%. Although municipalities are devoting efforts to reduce consumption in sport
facilities with savings measures, this increase could be explained by two
considerations: a) increase in supply rates, and b) VAT increases from 18% to 21% as of
September 1st
2012, increasing supplies costs for those municipalities which manage
their own equipment.
Provide adequate resources for the sports service
2011 2012
% of usual expense in supplies (including grants)
11.2% 12.7%

29
Costs are divided into three supply sources: water, electricity and fuel. The following
figure is an analysis of the distribution of each power supply on total spending
comparing to 2011, where the volume of fuel has increased.
Figure 17. Expenditure breakdown in power supplies for years 2011 and 2012
2.5. ENVIRONMENT DIMENSION
Data that facilitate control panel’s interpretation are included in this dimension. First,
note that the trend verified last year continues, resulting from incorporation of
municipalities with medium-small size that have a lower average population than last
year's average at BQC.
2010 2011 2012Population 53.420 51.108 46.112
In relation to the number of people employed in the sports sector (employed persons
are those who are actively involved promoting sport, regardless of if they have a full-
time contract, partial or non-contract time) per 100 inhabitants, like the previous

30
edition, there is an increase of 0.9%. Therefore, we can conclude that for every 100
inhabitants, one person is engaged, fully or partially in a sports sector.
If the distribution of total employed persons by type is analyzed, regardless if a
contractual relationship exists, it is noted that the bulk of people that take part in
sports entities, do it without a contractual relationship.
Figure 18. Distribution of total employed people by type in sports entities
It is interesting to follow the evolution of this item in current willingness to regulate
the non-profit sports entities by the Ministry of Labor. Many people employed in
sports sectors dedicated few hours a week monitoring tasks but it is not their main
occupation. Sport sector is an important sector to young people for labor market
incorporation, due to it being a sector where you can combine studies with working in
different sports activities. Moreover, keep in mind that although you can receive a
payment, this payment used to be a token amount in the context of sport promotion
within sport organization7.
Another environmental data factor is the number of people employed in the sport
sector per 100 inhabitants. In 2012 has remained the same value as in 2011, with 0.9%
of individuals per 100 inhabitants, i.e., an average of about 1 in 100 people in town are
occupied in the sports sector.
7 Currently the Diputació de Barcelona and the Observatori Català de l’Esport are conducting a study on
the situation of the labor market in sport. Results will explain vision and characteristics of people linked
to this sector.

31
Finally, environmental dimension also includes weight analysis of economic sport
indicators in local level. At the end of the study, data for 12 minicipalities were
available. In economic terms, sport average weight per capita for available
municipalities is 95 €. This figure is smaller than the result from the 2011 study, where
the result from 10 participating municipalities was 116 €.
2011 2012
116 95average
161 150 + 10.000 inhab
92 81 + 30.000 inhab
Economic weight per capita
Decreasing value is explained by two reasons: first one, due to one municipality
participating with low population but an important economic weight of sport. Second,
this year has involved one of the most populous municipalities in province. Despite
having a large and consolidated sports system, its economic value is diluted by high
population size. It should be mentioned that current sample is not representative.
This data was embedded in the last edition and it requires a complex data collecting.
Moreover only 12 of 53 participating municipalities was taken into account in BQC,
that represents the 23% of total amount of participating municipalities. At the end of
this year 2013, data from 9 new municipalities will be added to the existing data, and a
representative sample is expected from which we will be able to derive more precise
and extensive conclusions.

32
3. WORKSHOP ANALYISIS
Workshops related to the improvement phase allow experience exchanges between
technicians and manager involved in the different participating municipalities. There
were two classroom sessions, which allowed us to identify improvements that could be
implemented in municipal service through group dynamics where the aim was to
create shared understanding between different sports technicians. The conference had
4 main blocks:
1. Results presentation in a plenary
2. Individual evaluation of strengths and opportunities for improvements
3. Analysis of strengths through group work
4. Group work presentation in a plenary and conclusions
In the context of the current economic uncertainty, an analysis of strengths was the
chosen methodology to conduct workshops. This positive analysis consisted of finding
success factors that technicians considered necessary to achieve a good score in
certain indicators. Success factors were different facilitating factors from the
characteristics and management of the environment (environment, political
environment and users) and from the internal service management (team,
organizational processes, implementation and evaluation and material resources)
necessary to achieve the proposed purpose.
When success factors were found, possible obstacles that could hinder or prevent the
strength achievement were sought.

33
In the first working session 24 municipalities were divided into 5 working groups in this
way:
In the second working session there were 4 working groups totalling 20 participating
municipalities.

34
Once each group working sessions finished, each group spokesperson presented the
work in an oral presentation, explaining the main conclusions in a plenary. The plenary
allowed the other participants to ask questions and comment at the end of each
presentation. This new methodology was evaluated globally as very positive by the
participants.

35
4. CONCLUSIONS
The most important results in this Sports BQC edition are summarized in the following
points:
1. Number of users who receive public help increases per 1,000 inhabitant, with
an average from 3.8% to 5.2% sports users.
2. An increasing leadership for sportive entities to boost the sportive practice:
8% of people who practice do it in a sportive entity.
3. The municipal offers remains constant, both from the number of places in
activities as the number of activities despite the tendency to reduce the
number of inscriptions in municipal services.
4. A 3.2% increase in the sportive complex individual payment, from 34.5 € to
35.6 €. 10% of population is subscribed, and this percentage has remained.
5. Of the total full time workers in sports in the municipality, 36% work in an
administrative concession in sporting facilities. Municipality workers
represent 34% and the service companies 30%.
6. Municipal workers salary reduction (from 22.176 € in 2011 to 21.232 € in
2012).
7. Indirect management percentage has evolved from 42% in 2011 to 45% in
2012. It will be interesting to see next year’s evolution and it will be more
interesting to see their evolution in the coming years given the current trend
to establish mechanisms for greater collaboration between the public and the
private sectors.
8. Sports costs (including grants) stood at 62.9 € per capita and current activities
costs stood at 9.9 € per inhabitant.
9. It is observed that, although there is an increase in the volume of hours in
continuing and specific operations, there is a cost reduction per activity hour
(10.2%) resulting in a better resources optimization and new collaboration
forms ways research between departments and organizations.
10. Maintenance costs reduction (7.8% in 2011, 7.2% in 2012). But there is a
significant increase in consumption costs (11.2% in 2011 and 12.7% 2012),
despite the savings measures implementation derived from the increasing
rate in 2012.
Data obtained from Sports BQC allows us to interpret a transitional situation, in which
large budget cuts and service definition have already taken place, and they have been
36
reflected in the indicators. In this respect, it seems that municipal services sports
reacted to the situation in recent years. Their ability in self-financing compared with
other municipal services, tendency to diversify practice both in conventional spaces in
the urban and in natural environment, and tradition of public-private partnership in
the sector, have allowed maintaining municipal sport as one of the greater services in
local impact. It is probable that the evolution of this will largely be determined by the
still needed review collaboration models between local government and the private
sector, both as trade associations.