benchmarking private equity performance - signal...
TRANSCRIPT

Benchmarking Private Equity Performance8 June 2007
EVCA Institute – Finance & Administration Course, Nice
David [email protected]
1
Overview
What are we measuring and why is it so difficult?
What/how do we benchmark?
What are the actual results for the industry?
2
Current Environment
Increased transparency of the asset class for fund raising, fund reporting, asset allocation and fund due diligence, as well as individual transactions
Less disclosure around individual fund returns, and impact of FOIA
Confusion: What is the return being reported? How was it derived? How can you put it in context?
Valuation guidelines (www.privateequityvaluation.com) being adopted and endorsed internationally, including ILPA
Part 1
What are we measuring and why is it so complicated?
4
Is a return of 200% good enough?
A return of 200%?200% total return: having invested €1m, we get €2m back
200% percentage change: we get €3m back (let’s assume this)
Over what time period?Over two years -- great at 73% per year (1.73^2=3)Over ten? --- hmmm!! At 11.6% per year (1.116^10=3)
Is it return on the investments the fund made or is it the return to the investors in the fund?
Is it the return of a single fund or the return of a portfolio of funds?
IRR Since Inception / Investment Horizon IRR / Time-Weighted IRR / Realised Multiple / Unrealised Multiple?
5
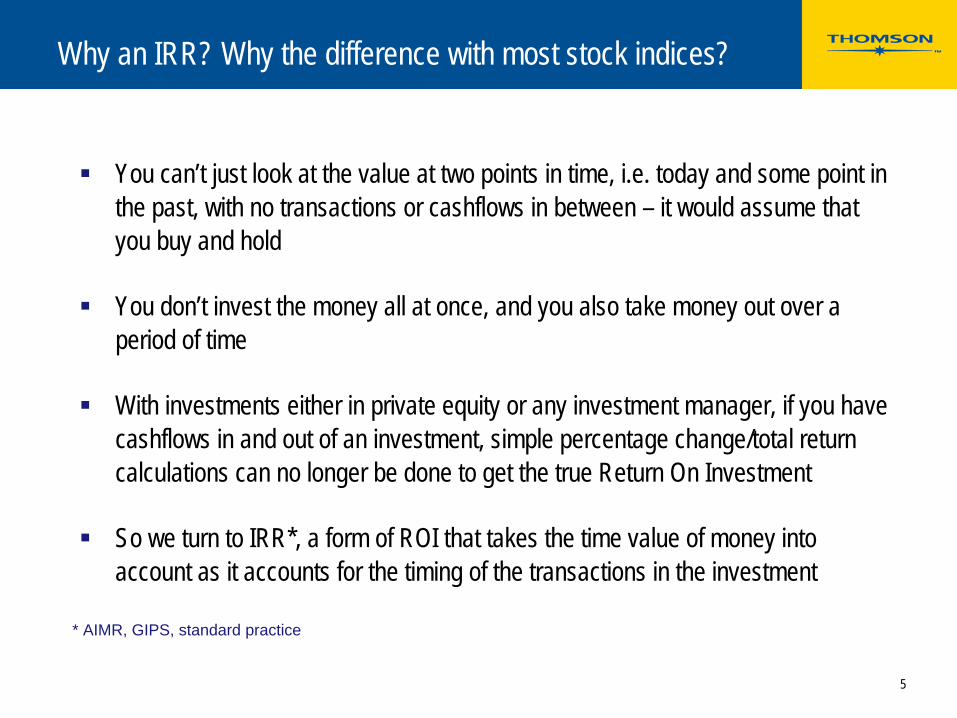
Why an IRR? Why the difference with most stock indices?
You can’t just look at the value at two points in time, i.e. today and some point in the past, with no transactions or cashflows in between – it would assume that you buy and hold
You don’t invest the money all at once, and you also take money out over a period of time
With investments either in private equity or any investment manager, if you have cashflows in and out of an investment, simple percentage change/total return calculations can no longer be done to get the true Return On Investment
So we turn to IRR*, a form of ROI that takes the time value of money into account as it accounts for the timing of the transactions in the investment
* AIMR, GIPS, standard practice
Part 2
What/how do we benchmark?

7
Why a benchmark?
Return is mathematical algorithm – it is an absolute measure
Performance is a relative measure – can only be determined by comparing return to something else – for example past returns, benchmarks, etc.
So you need a benchmark
8
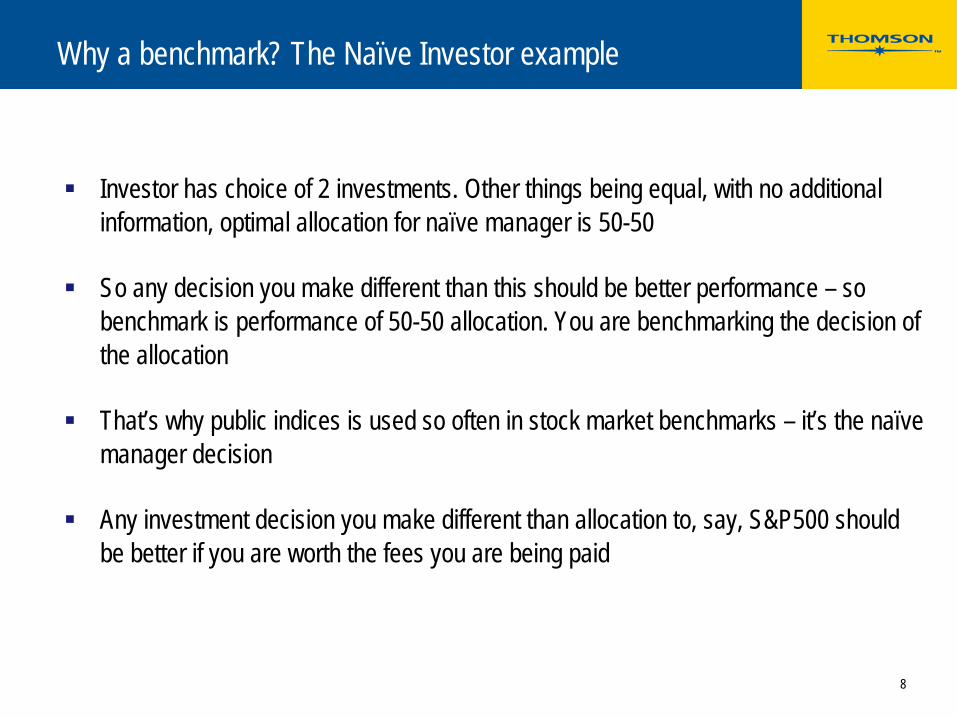
Why a benchmark? The Naïve Investor example
Investor has choice of 2 investments. Other things being equal, with no additional information, optimal allocation for naïve manager is 50-50
So any decision you make different than this should be better performance – so benchmark is performance of 50-50 allocation. You are benchmarking the decision of the allocation
That’s why public indices is used so often in stock market benchmarks – it’s the naïve manager decision
Any investment decision you make different than allocation to, say, S&P500 should be better if you are worth the fees you are being paid
9
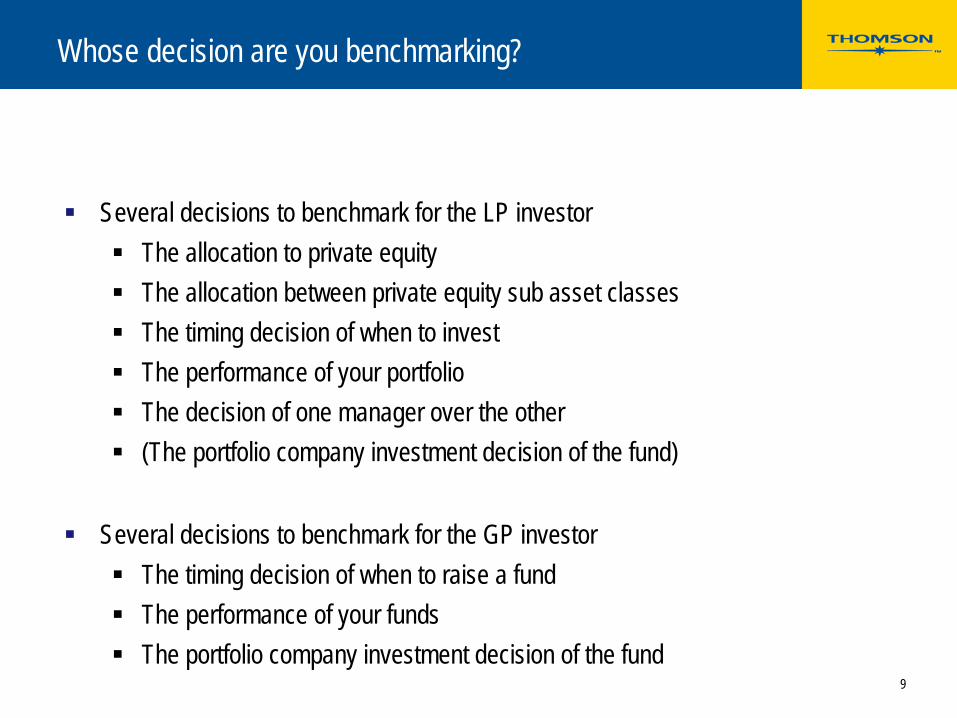
Whose decision are you benchmarking?
Several decisions to benchmark for the LP investorThe allocation to private equityThe allocation between private equity sub asset classesThe timing decision of when to investThe performance of your portfolioThe decision of one manager over the other(The portfolio company investment decision of the fund)
Several decisions to benchmark for the GP investorThe timing decision of when to raise a fundThe performance of your fundsThe portfolio company investment decision of the fund
10
Principal benchmarks
Cumulative IRR
Cumulative Realisation Multiples
Time Weighted Return
Investment Horizon Return
Public Market Comparables – Index method
11
Some definitions (1/2)
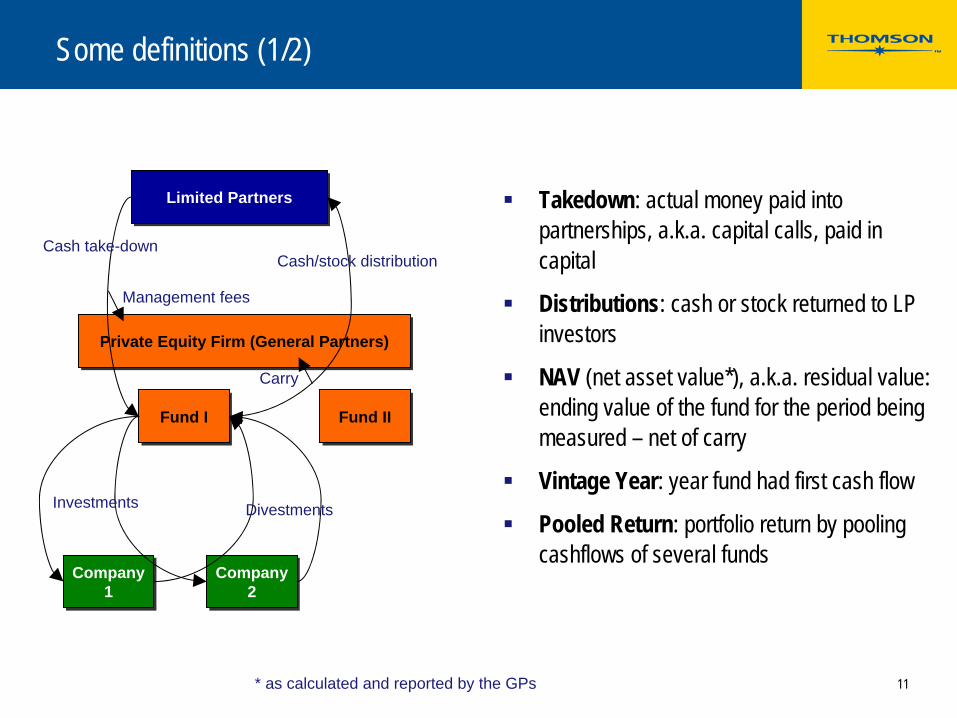
Limited PartnersLimited Partners
Private Equity Firm (General Partners)Private Equity Firm (General Partners)
Fund IFund I Fund IIFund II
Company 1
Company 1
Company 2
Company 2
Cash take-downCash/stock distribution
Takedown: actual money paid into partnerships, a.k.a. capital calls, paid in capital
Distributions: cash or stock returned to LP investors
NAV (net asset value*), a.k.a. residual value: ending value of the fund for the period being measured – net of carry
Vintage Year: year fund had first cash flow
Pooled Return: portfolio return by pooling cashflows of several funds
Management fees
Carry
* as calculated and reported by the GPs
Investments Divestments
12
Some definitions (2/2)
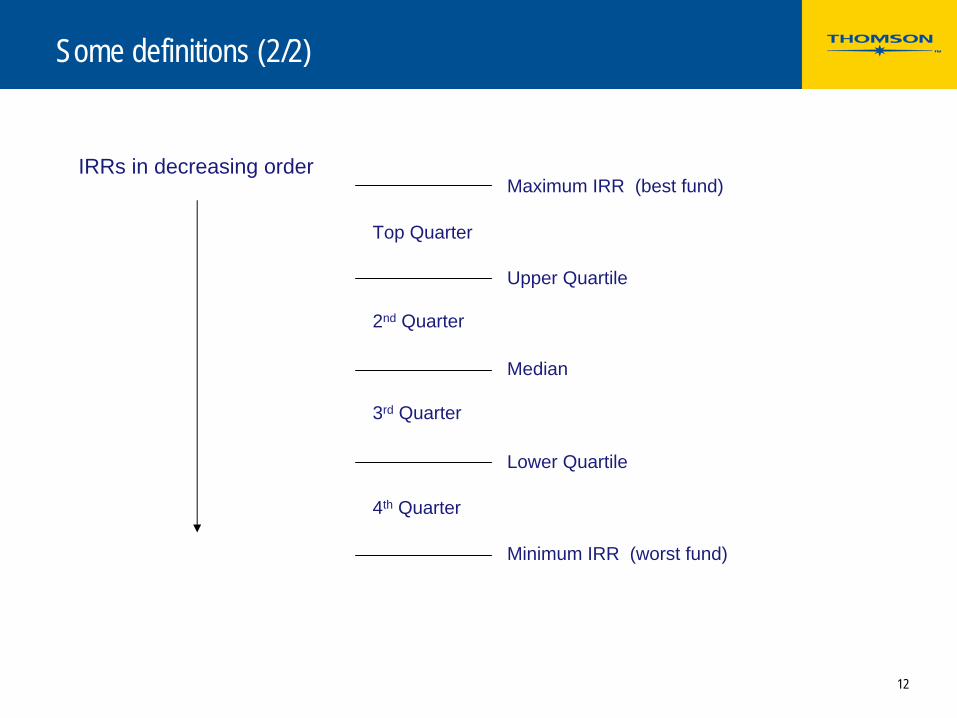
IRRs in decreasing orderMaximum IRR (best fund)
Upper Quartile
Median
Lower Quartile
Minimum IRR (worst fund)
Top Quarter
2nd Quarter
3rd Quarter
4th Quarter
13
r -i
Fund Returns Calculations
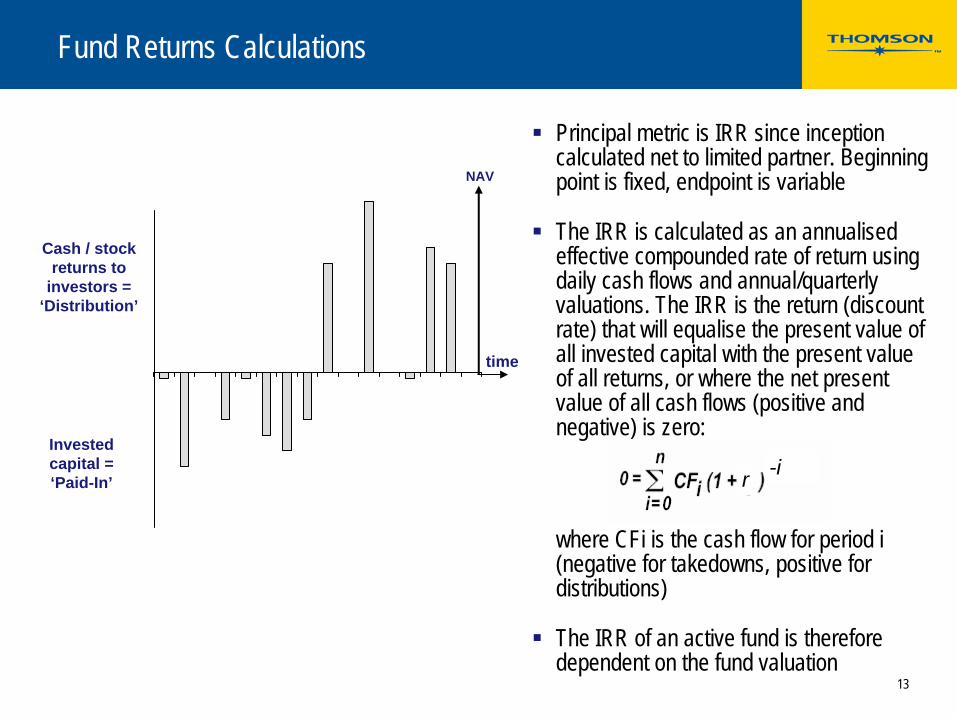
Cash / stock returns to
investors = ‘Distribution’
Invested capital = ‘Paid-In’
time
Principal metric is IRR since inception calculated net to limited partner. Beginning point is fixed, endpoint is variable
The IRR is calculated as an annualised effective compounded rate of return using daily cash flows and annual/quarterly valuations. The IRR is the return (discount rate) that will equalise the present value of all invested capital with the present value of all returns, or where the net present value of all cash flows (positive and negative) is zero:
where CFi is the cash flow for period i (negative for takedowns, positive for distributions)
The IRR of an active fund is therefore dependent on the fund valuation
NAV

14
Typical Fund Cashflow - Simple Example of IRR Calculation
Year Takedowns Distribution s
NAV
1992 (5,201.8) 5,201.81993 (12,749.5) 17,300.21994 (15,299.4) 32,246.01995 (5,099.8) 7,988.0 49,128.11996 (5,099.8) 73,777.11997 (7,649.7) 30,770.5 66,416.41998 16,740.9 38,853.71999 11,484.7 25,046.8
-5.201.81 + IRR1995
+-12,749.5
(1 + IRR1995 )2+-15.299.4
(1 + IRR1995 )3= 0
-5,099.8 + 7,988.0 + 49,128.1+
Column ARow 1 (5,201.8)Row 2 (12,749.5)Row 3 (15,299.4)Row 4 52,016.3
THE RAW DATA THE CALCULATION IN MS EXCEL
THE FORMULA
=irr(A1:A4,0)=28.9%
IRR1995
Note: in this example, we are calculating an IRR based on a net cash flow for the year rather than daily or monthly cash flows, which is a very simplistic approach and used only for illustration purposes
15
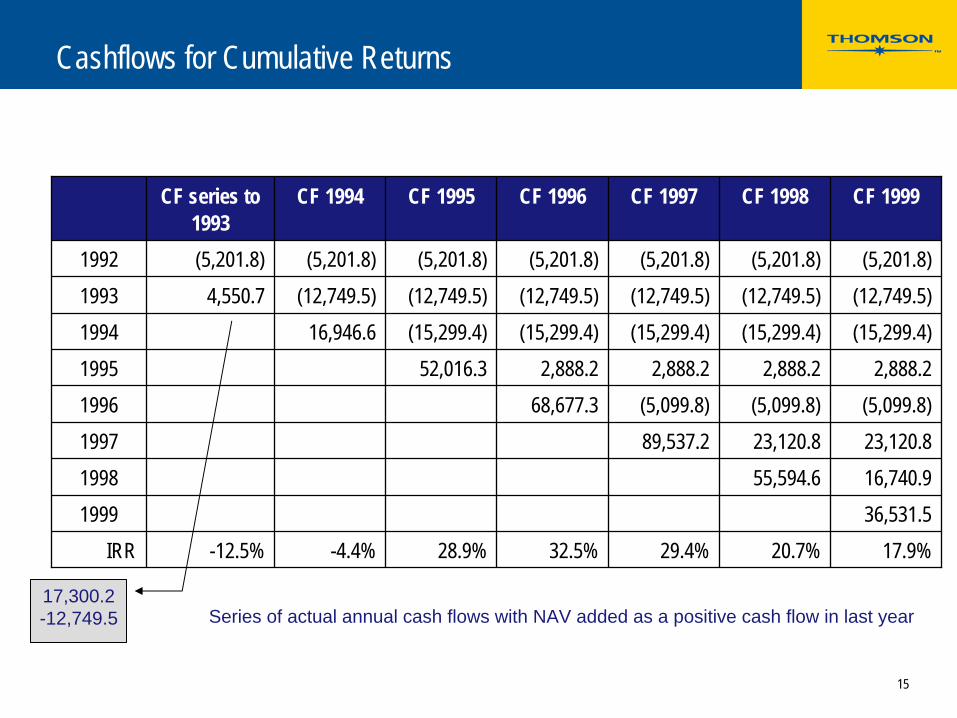
Cashflows for Cumulative Returns
CF series to 1993
CF 1994 CF 1995 CF 1996 CF 1997 CF 1998 CF 1999
1992 (5,201.8) (5,201.8) (5,201.8) (5,201.8) (5,201.8) (5,201.8) (5,201.8)1993 4,550.7 (12,749.5) (12,749.5) (12,749.5) (12,749.5) (12,749.5) (12,749.5)1994 16,946.6 (15,299.4) (15,299.4) (15,299.4) (15,299.4) (15,299.4)1995 52,016.3 2,888.2 2,888.2 2,888.2 2,888.21996 68,677.3 (5,099.8) (5,099.8) (5,099.8)1997 89,537.2 23,120.8 23,120.81998 55,594.6 16,740.91999 36,531.5
IRR -12.5% -4.4% 28.9% 32.5% 29.4% 20.7% 17.9%
Series of actual annual cash flows with NAV added as a positive cash flow in last year17,300.2 -12,749.5
16
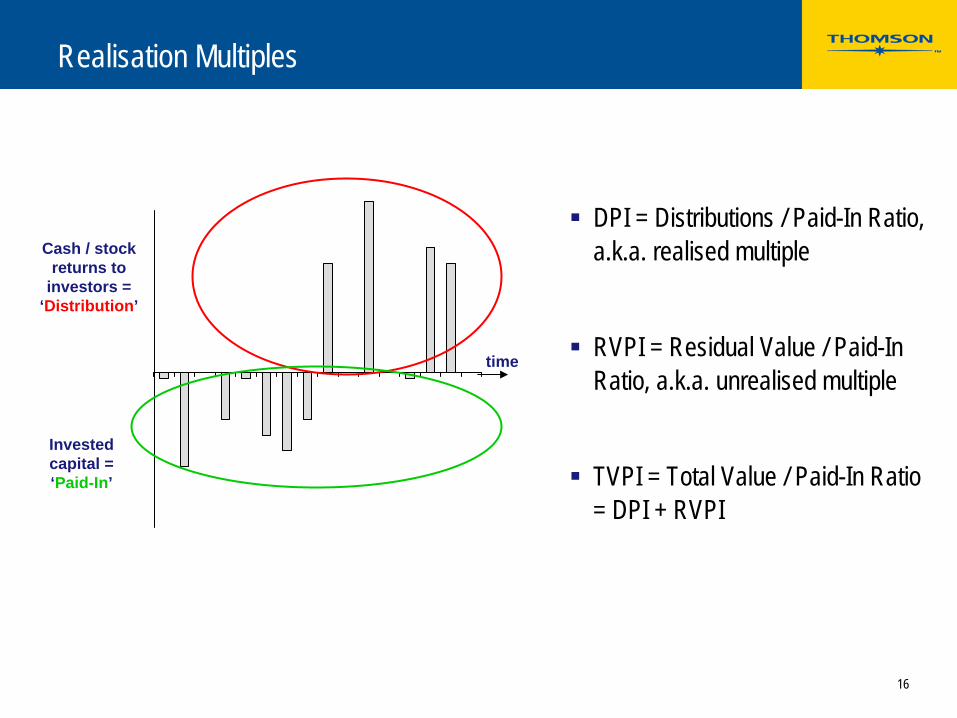
Realisation Multiples
Cash / stock returns to
investors = ‘Distribution’
Invested capital = ‘Paid-In’
time
DPI = Distributions / Paid-In Ratio, a.k.a. realised multiple
RVPI = Residual Value / Paid-In Ratio, a.k.a. unrealised multiple
TVPI = Total Value / Paid-In Ratio = DPI + RVPI
17
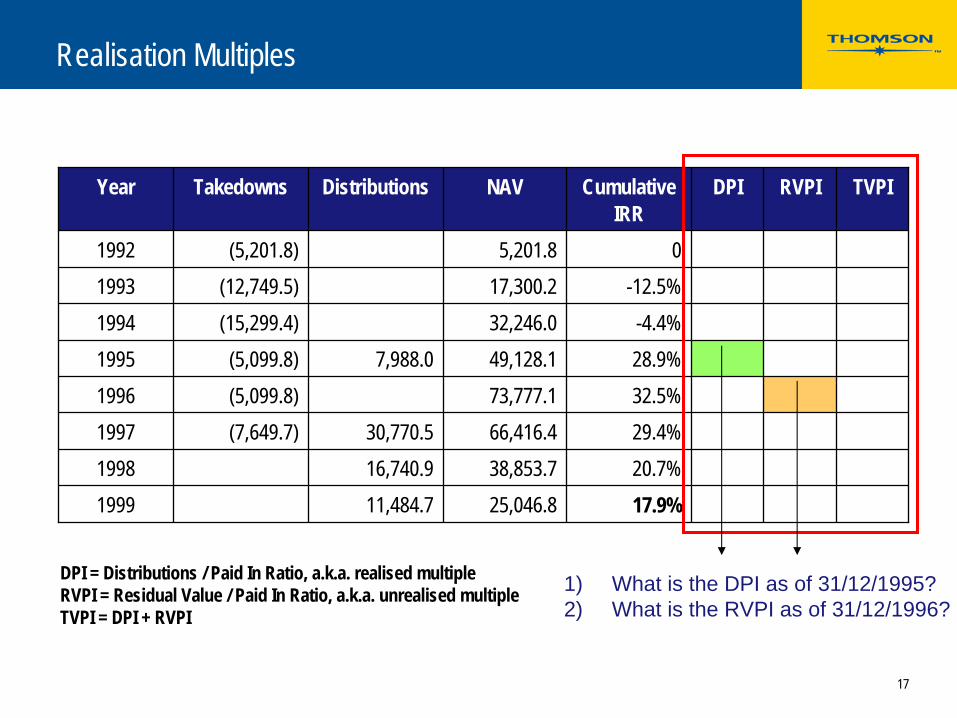
Realisation Multiples
DPI = Distributions / Paid In Ratio, a.k.a. realised multiple RVPI = Residual Value / Paid In Ratio, a.k.a. unrealised multiple TVPI = DPI + RVPI
Year Takedowns Distributions NAV Cumulative IRR
DPI RVPI TVPI
1992 (5,201.8) 5,201.8 01993 (12,749.5) 17,300.2 -12.5%1994 (15,299.4) 32,246.0 -4.4%1995 (5,099.8) 7,988.0 49,128.1 28.9%1996 (5,099.8) 73,777.1 32.5%1997 (7,649.7) 30,770.5 66,416.4 29.4%1998 16,740.9 38,853.7 20.7%1999 11,484.7 25,046.8 17.9%
1) What is the DPI as of 31/12/1995?2) What is the RVPI as of 31/12/1996?
18
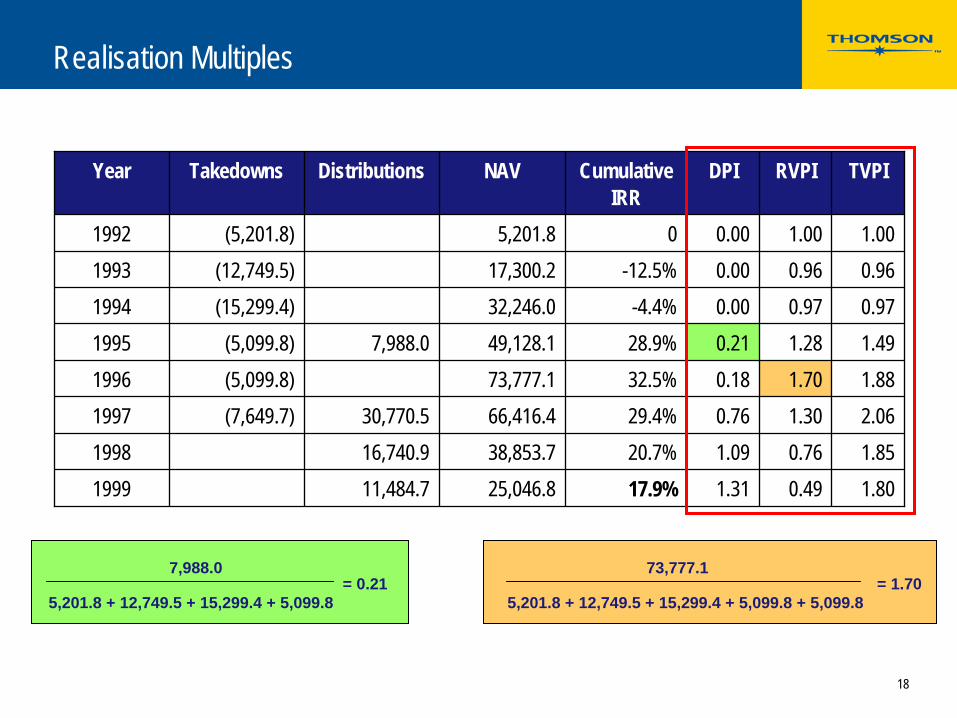
Realisation Multiples
Year Takedowns Distributions NAV Cumulative IRR
DPI RVPI TVPI
1992 (5,201.8) 5,201.8 0 0.00 1.00 1.001993 (12,749.5) 17,300.2 -12.5% 0.00 0.96 0.961994 (15,299.4) 32,246.0 -4.4% 0.00 0.97 0.971995 (5,099.8) 7,988.0 49,128.1 28.9% 0.21 1.28 1.491996 (5,099.8) 73,777.1 32.5% 0.18 1.70 1.881997 (7,649.7) 30,770.5 66,416.4 29.4% 0.76 1.30 2.061998 16,740.9 38,853.7 20.7% 1.09 0.76 1.851999 11,484.7 25,046.8 17.9% 1.31 0.49 1.80
5,201.8 + 12,749.5 + 15,299.4 + 5,099.8
7,988.0= 0.21
5,201.8 + 12,749.5 + 15,299.4 + 5,099.8 + 5,099.8
73,777.1= 1.70

19
Time Weighted Returns
Time weighted return calculates a return for each period – quarterly, annuallyBeginning point is variable, endpoint is variableCalculate using net asset value at beginning and end of period and cashflows between periodsCalculate IRR for each period and then compound togetherShortfalls
Creates aberrations: 100 + 20% = 120120 - 20% = 96
Returns heavily dependent on valuations. Wrong valuations affect future returnsAssumes money can come and go freely at the beginning and end of each period
1997 1998 1999 2000 2001 2002
NAV
NAV
NAV
NAV
NAV
NAV
NAV
NAV
NAV
NAV
NAV
NAV

20
Cashflows for Time Weighted Returns
Year 1 Year 2 Year 3 Year 4 Year 5 Year 6 Year 71992 (5,201.8)1993 4,550.7 (17,300.2)1994 16,946.6 (32,246.0)1995 52,016.3 (49,128.1)1996 68,677.3 (73,777.1)1997 89,537.2 (66,416.4)1998 55,594.6 (38,853.7)1999 36,531.5
TWR -12.5% -2.0% 61.3% 39.8% 21.4% -16.3% -6.0%
32,246.0 -15,299.4
21
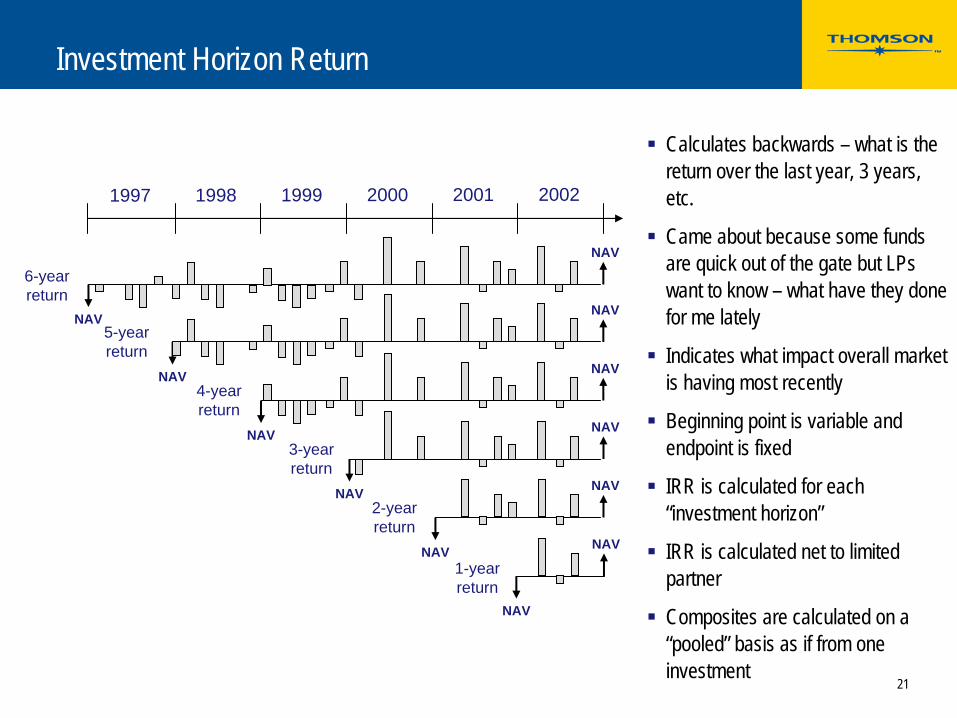
Investment Horizon Return
Calculates backwards – what is the return over the last year, 3 years, etc.
Came about because some funds are quick out of the gate but LPs want to know – what have they done for me lately
Indicates what impact overall market is having most recently
Beginning point is variable and endpoint is fixed
IRR is calculated for each “investment horizon”
IRR is calculated net to limited partner
Composites are calculated on a “pooled” basis as if from one investment
1997 1998 1999 2000 2001 2002
NAV
NAV
NAV
NAV
NAV
NAV
NAV
NAV
NAV
NAV
NAV
NAV
1-year return
2-year return
3-year return
4-year return
5-year return
6-year return
22
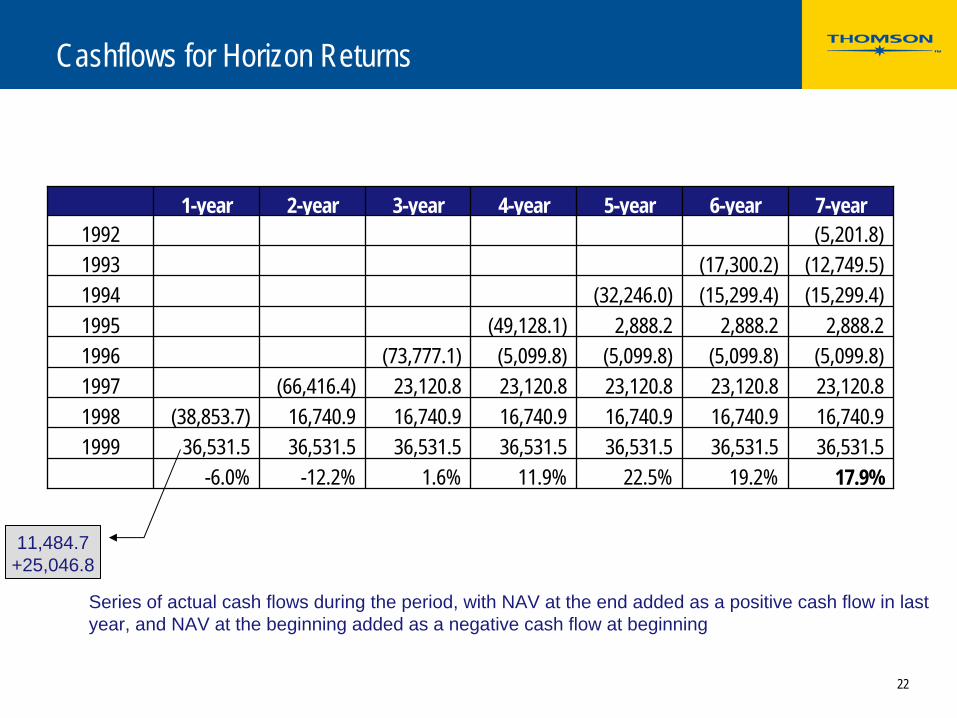
Cashflows for Horizon Returns
1-year 2-year 3-year 4-year 5-year 6-year 7-year1992 (5,201.8)1993 (17,300.2) (12,749.5)1994 (32,246.0) (15,299.4) (15,299.4)1995 (49,128.1) 2,888.2 2,888.2 2,888.21996 (73,777.1) (5,099.8) (5,099.8) (5,099.8) (5,099.8)1997 (66,416.4) 23,120.8 23,120.8 23,120.8 23,120.8 23,120.81998 (38,853.7) 16,740.9 16,740.9 16,740.9 16,740.9 16,740.9 16,740.91999 36,531.5 36,531.5 36,531.5 36,531.5 36,531.5 36,531.5 36,531.5
-6.0% -12.2% 1.6% 11.9% 22.5% 19.2% 17.9%
Series of actual cash flows during the period, with NAV at the end added as a positive cash flow in last year, and NAV at the beginning added as a negative cash flow at beginning
11,484.7 +25,046.8

23
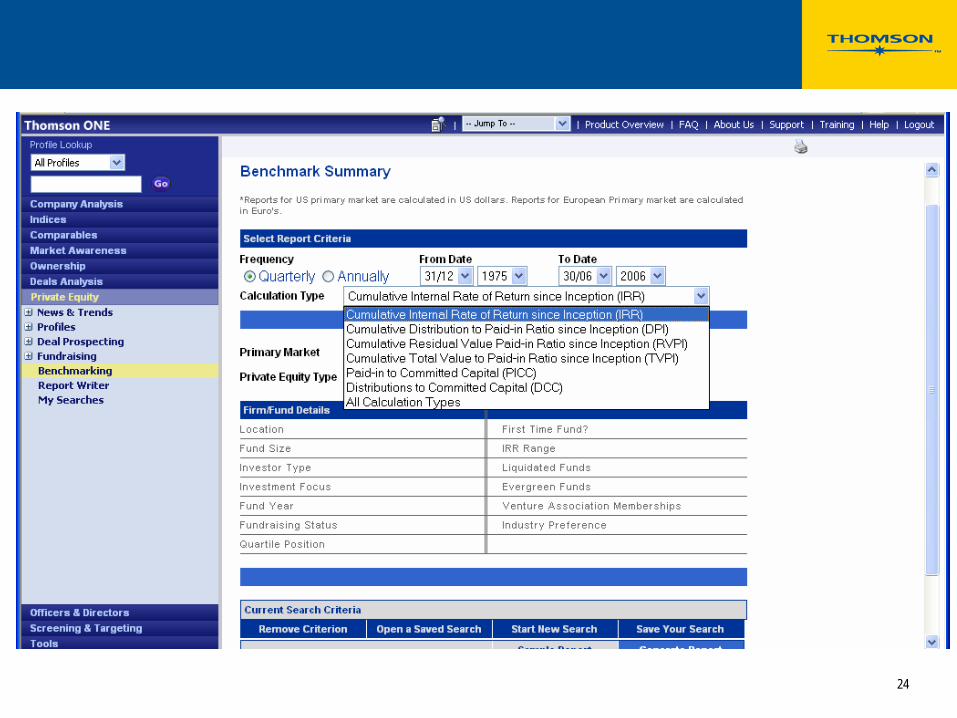
Thomson Financial’s Private Equity Performance Database
Maintained by Venture Economics (now Thomson Financial) since 1988, online since 1991
Available online in VentureXpert and Thomson ONE, where you can define your own performance sample (by country, vintage, size, focus, etc.)
1833 US funds formed 1969-2006, in partnership with NVCA
1141 European funds formed 1979-2006, in partnership with EVCA
170 Canadian funds formed 1981-2006, in partnership with CVCA
135 Asia-Pacific funds formed 1980-2006
81 funds of funds
24
25
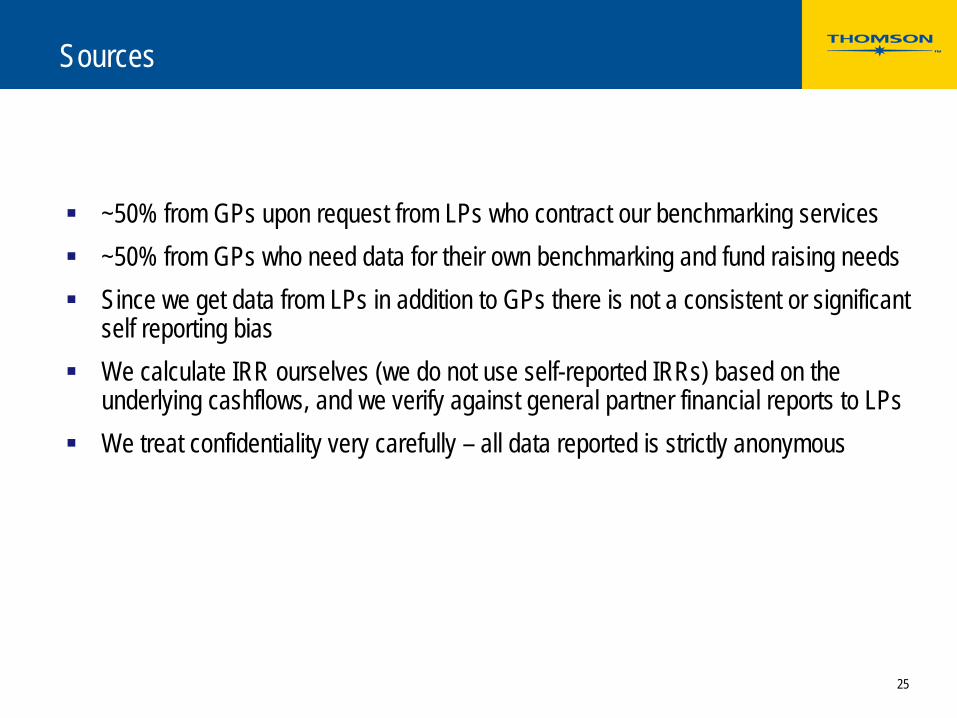
Sources
~50% from GPs upon request from LPs who contract our benchmarking services~50% from GPs who need data for their own benchmarking and fund raising needsSince we get data from LPs in addition to GPs there is not a consistent or significant self reporting biasWe calculate IRR ourselves (we do not use self-reported IRRs) based on the underlying cashflows, and we verify against general partner financial reports to LPsWe treat confidentiality very carefully – all data reported is strictly anonymous
Part 3
What are the actual results for the industry?
27
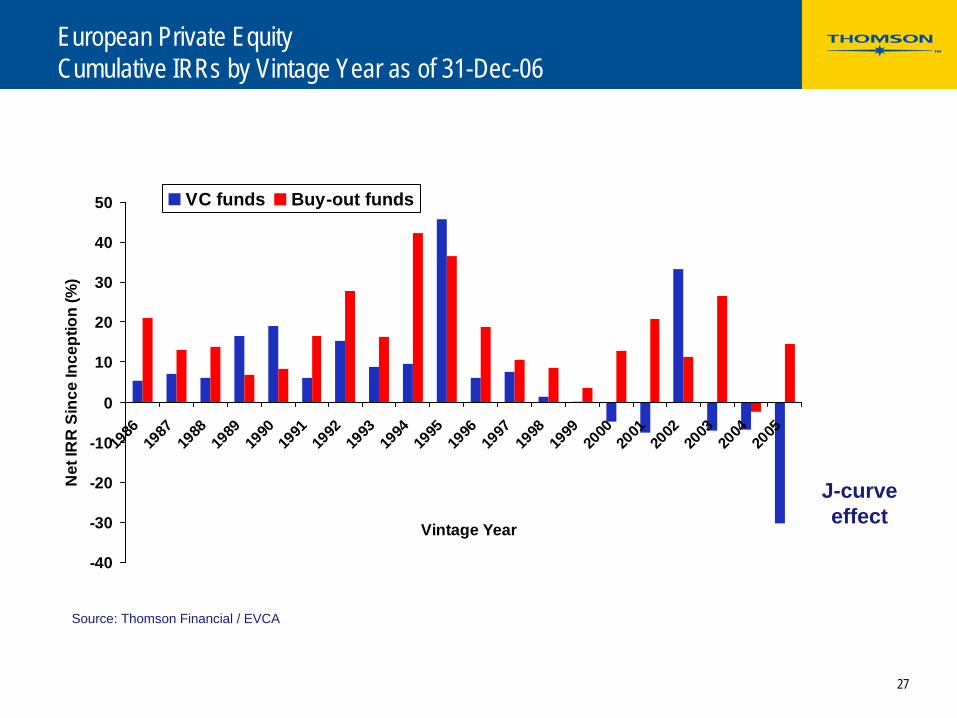
European Private Equity Cumulative IRRs by Vintage Year as of 31-Dec-06
-40
-30
-20
-10
0
10
20
30
40
50
1986
1987
1988
1989
1990
1991
1992
1993
1994
1995
1996
1997
1998
1999
2000
2001
2002
2003
2004
2005
Vintage Year
Net
IRR
Sin
ce In
cept
ion
(%)
VC funds Buy-out funds
Source: Thomson Financial / EVCA
J-curveeffect
28
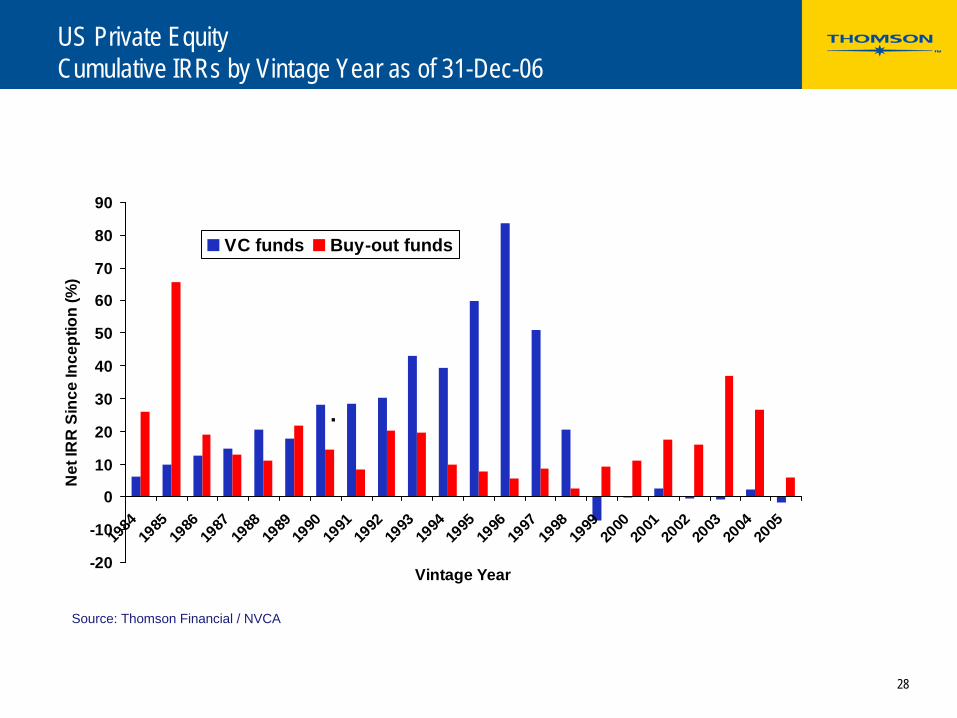
US Private Equity Cumulative IRRs by Vintage Year as of 31-Dec-06
-20
-10
0
10
20
30
40
50
60
70
80
90
1984
1985
1986
1987
1988
1989
1990
1991
1992
1993
1994
1995
1996
1997
1998
1999
2000
2001
2002
2003
2004
2005
Vintage Year
Net
IRR
Sin
ce In
cept
ion
(%)
VC funds Buy-out funds
.
Source: Thomson Financial / NVCA
29
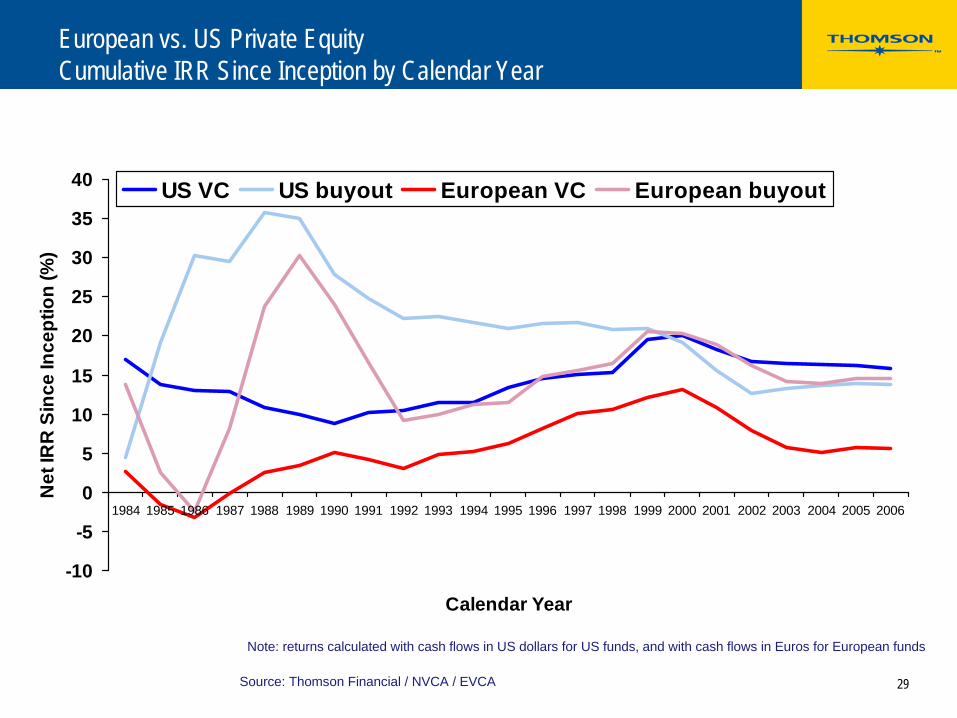
European vs. US Private Equity Cumulative IRR Since Inception by Calendar Year
-10
-5
0
5
10
15
20
25
30
35
40
1984 1985 1986 1987 1988 1989 1990 1991 1992 1993 1994 1995 1996 1997 1998 1999 2000 2001 2002 2003 2004 2005 2006
Calendar Year
Net
IRR
Sin
ce In
cept
ion
(%)
US VC US buyout European VC European buyout
Source: Thomson Financial / NVCA / EVCA
Note: returns calculated with cash flows in US dollars for US funds, and with cash flows in Euros for European funds
30
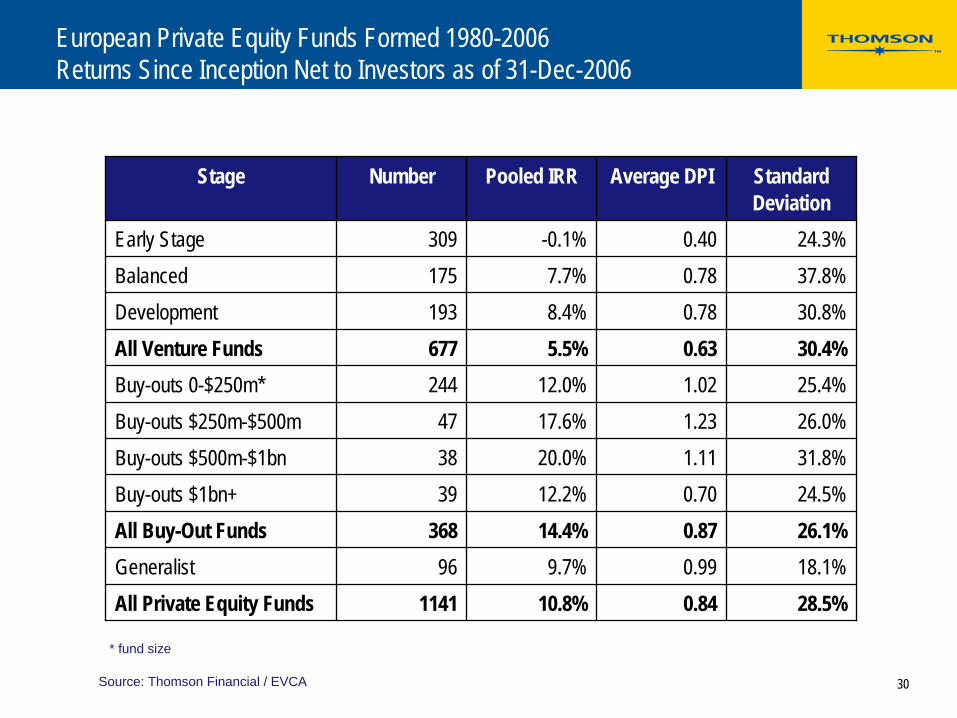
European Private Equity Funds Formed 1980-2006 Returns Since Inception Net to Investors as of 31-Dec-2006
Stage Number Pooled IRR Average DPI Standard Deviation
Early Stage 309 -0.1% 0.40 24.3%Balanced 175 7.7% 0.78 37.8%Development 193 8.4% 0.78 30.8%All Venture Funds 677 5.5% 0.63 30.4%Buy-outs 0-$250m* 244 12.0% 1.02 25.4%Buy-outs $250m-$500m 47 17.6% 1.23 26.0%Buy-outs $500m-$1bn 38 20.0% 1.11 31.8%Buy-outs $1bn+ 39 12.2% 0.70 24.5%All Buy-Out Funds 368 14.4% 0.87 26.1%Generalist 96 9.7% 0.99 18.1%All Private Equity Funds 1141 10.8% 0.84 28.5%
Source: Thomson Financial / EVCA
* fund size
31
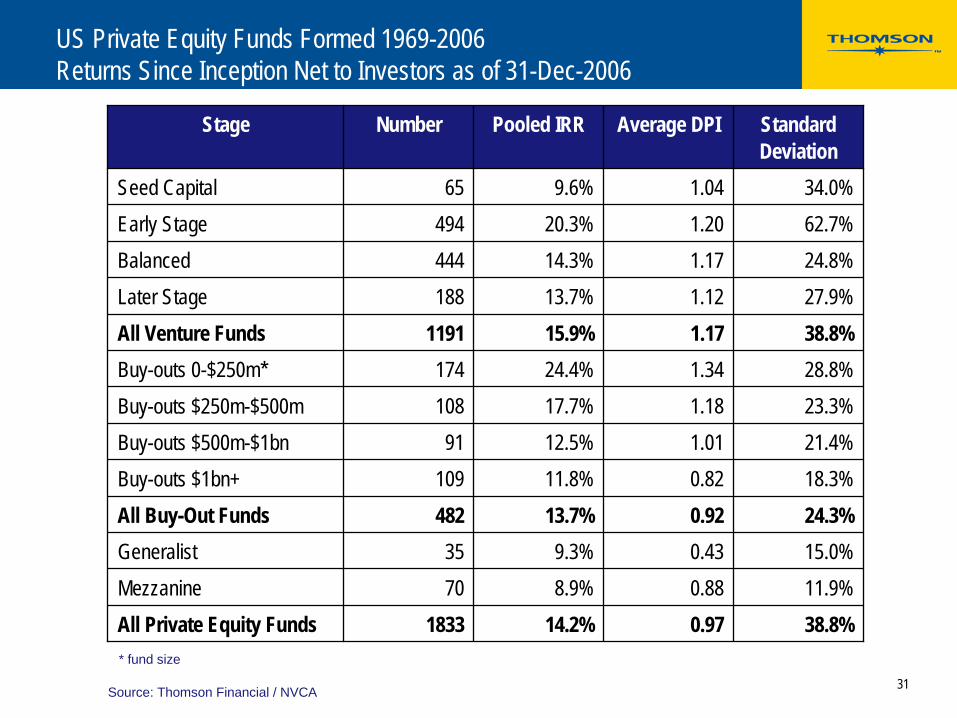
US Private Equity Funds Formed 1969-2006 Returns Since Inception Net to Investors as of 31-Dec-2006
Stage Number Pooled IRR Average DPI Standard Deviation
Seed Capital 65 9.6% 1.04 34.0%Early Stage 494 20.3% 1.20 62.7%Balanced 444 14.3% 1.17 24.8%Later Stage 188 13.7% 1.12 27.9%All Venture Funds 1191 15.9% 1.17 38.8%Buy-outs 0-$250m* 174 24.4% 1.34 28.8%Buy-outs $250m-$500m 108 17.7% 1.18 23.3%Buy-outs $500m-$1bn 91 12.5% 1.01 21.4%Buy-outs $1bn+ 109 11.8% 0.82 18.3%All Buy-Out Funds 482 13.7% 0.92 24.3%Generalist 35 9.3% 0.43 15.0%Mezzanine 70 8.9% 0.88 11.9%All Private Equity Funds 1833 14.2% 0.97 38.8%
Source: Thomson Financial / NVCA
* fund size
32
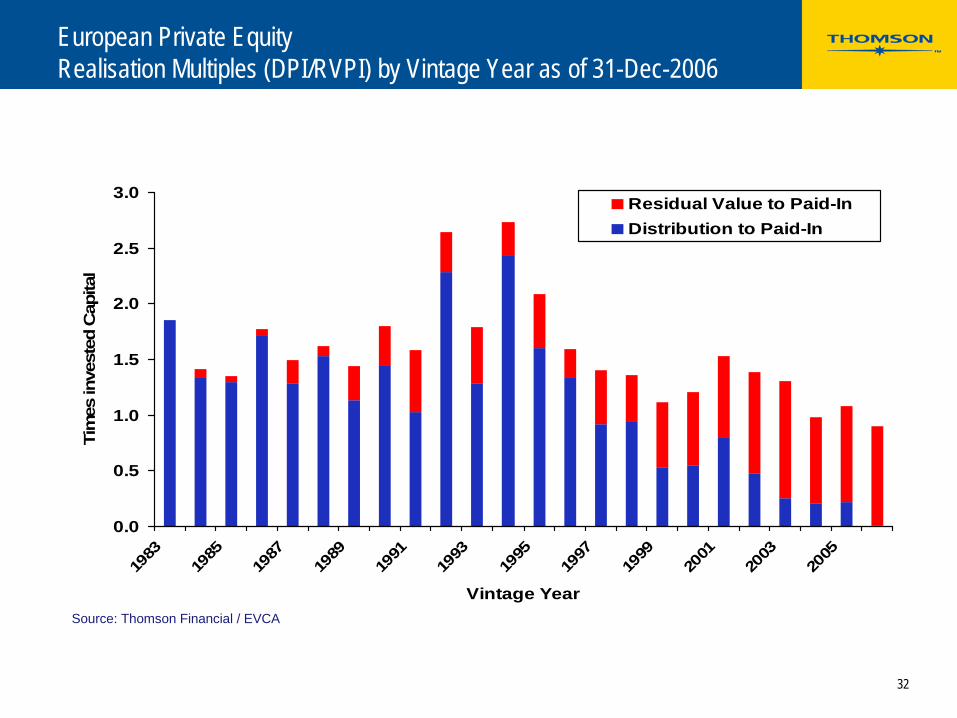
European Private Equity Realisation Multiples (DPI/RVPI) by Vintage Year as of 31-Dec-2006
0.0
0.5
1.0
1.5
2.0
2.5
3.0
1983
1985
1987
1989
1991
1993
1995
1997
1999
2001
2003
2005
Vintage Year
Tim
es in
vest
ed C
apita
l
Residual Value to Paid-InDistribution to Paid-In
Source: Thomson Financial / EVCA
33
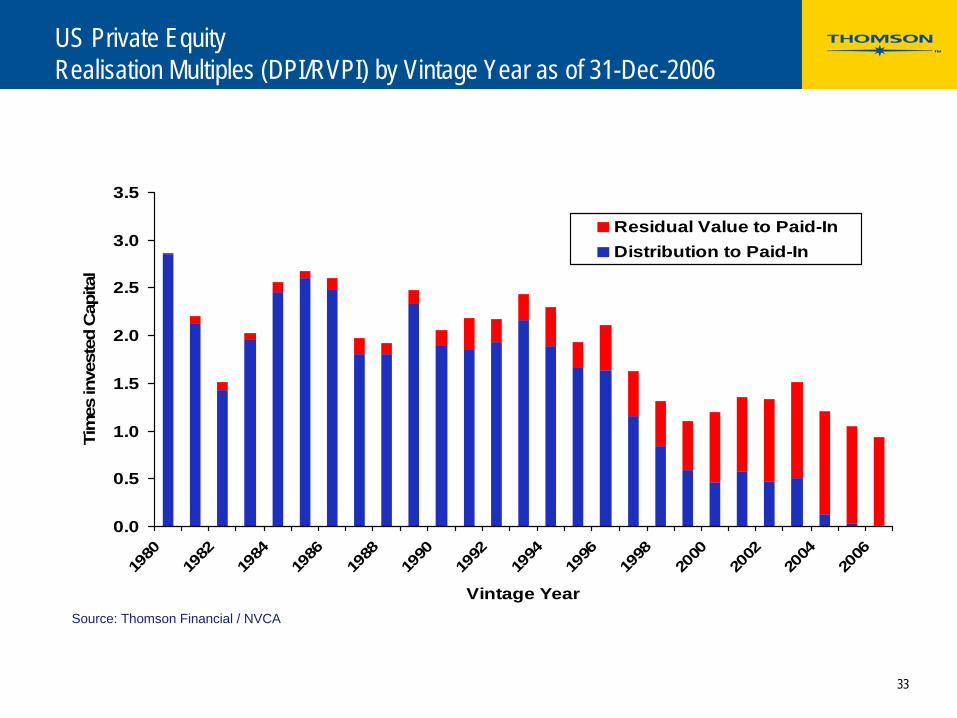
US Private Equity Realisation Multiples (DPI/RVPI) by Vintage Year as of 31-Dec-2006
0.0
0.5
1.0
1.5
2.0
2.5
3.0
3.5
1980
1982
1984
1986
1988
1990
1992
1994
1996
1998
2000
2002
2004
2006
Vintage Year
Tim
es in
vest
ed C
apita
l
Residual Value to Paid-InDistribution to Paid-In
Source: Thomson Financial / NVCA
34
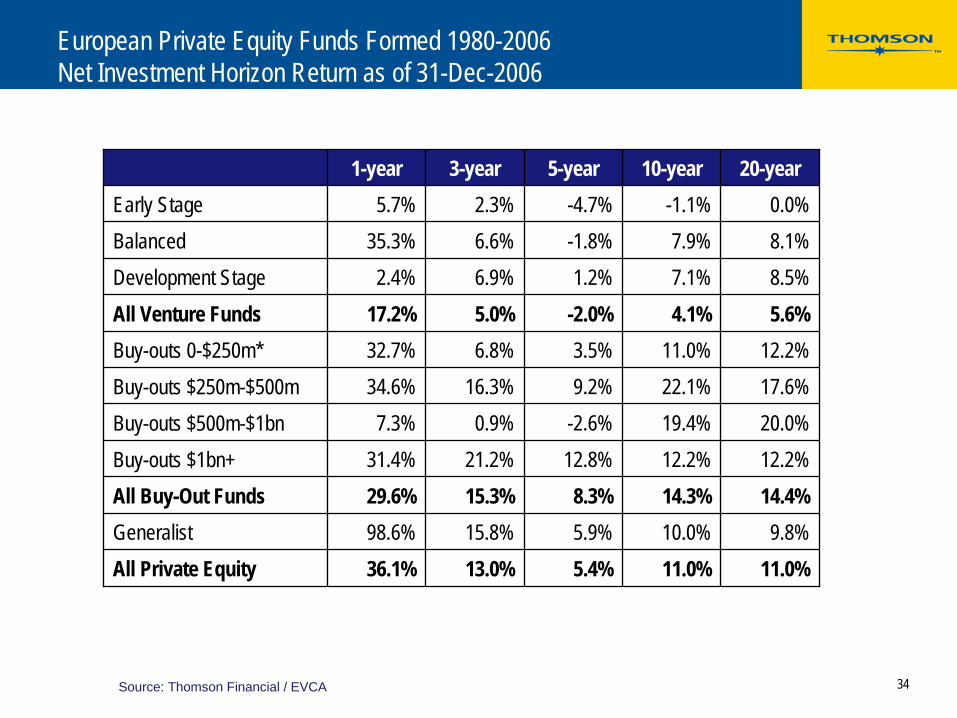
European Private Equity Funds Formed 1980-2006 Net Investment Horizon Return as of 31-Dec-2006
1-year 3-year 5-year 10-year 20-yearEarly Stage 5.7% 2.3% -4.7% -1.1% 0.0%Balanced 35.3% 6.6% -1.8% 7.9% 8.1%Development Stage 2.4% 6.9% 1.2% 7.1% 8.5%All Venture Funds 17.2% 5.0% -2.0% 4.1% 5.6%Buy-outs 0-$250m* 32.7% 6.8% 3.5% 11.0% 12.2%Buy-outs $250m-$500m 34.6% 16.3% 9.2% 22.1% 17.6%Buy-outs $500m-$1bn 7.3% 0.9% -2.6% 19.4% 20.0%Buy-outs $1bn+ 31.4% 21.2% 12.8% 12.2% 12.2%All Buy-Out Funds 29.6% 15.3% 8.3% 14.3% 14.4%Generalist 98.6% 15.8% 5.9% 10.0% 9.8%All Private Equity 36.1% 13.0% 5.4% 11.0% 11.0%
Source: Thomson Financial / EVCA
35
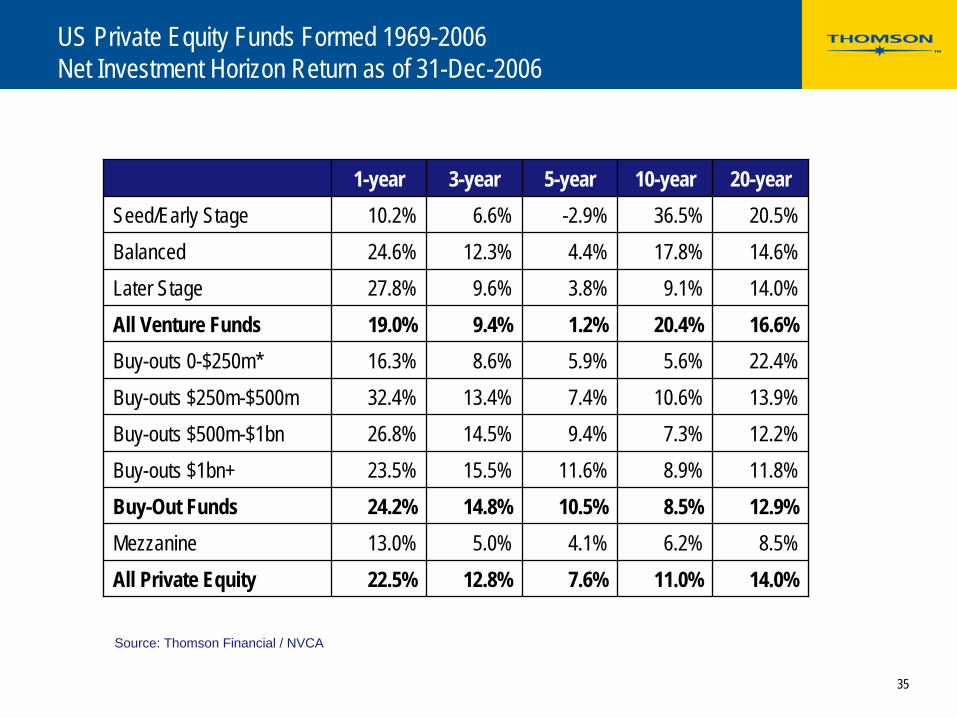
US Private Equity Funds Formed 1969-2006 Net Investment Horizon Return as of 31-Dec-2006
1-year 3-year 5-year 10-year 20-yearSeed/Early Stage 10.2% 6.6% -2.9% 36.5% 20.5%Balanced 24.6% 12.3% 4.4% 17.8% 14.6%Later Stage 27.8% 9.6% 3.8% 9.1% 14.0%All Venture Funds 19.0% 9.4% 1.2% 20.4% 16.6%Buy-outs 0-$250m* 16.3% 8.6% 5.9% 5.6% 22.4%Buy-outs $250m-$500m 32.4% 13.4% 7.4% 10.6% 13.9%Buy-outs $500m-$1bn 26.8% 14.5% 9.4% 7.3% 12.2%Buy-outs $1bn+ 23.5% 15.5% 11.6% 8.9% 11.8%Buy-Out Funds 24.2% 14.8% 10.5% 8.5% 12.9%Mezzanine 13.0% 5.0% 4.1% 6.2% 8.5%All Private Equity 22.5% 12.8% 7.6% 11.0% 14.0%
Source: Thomson Financial / NVCA
36
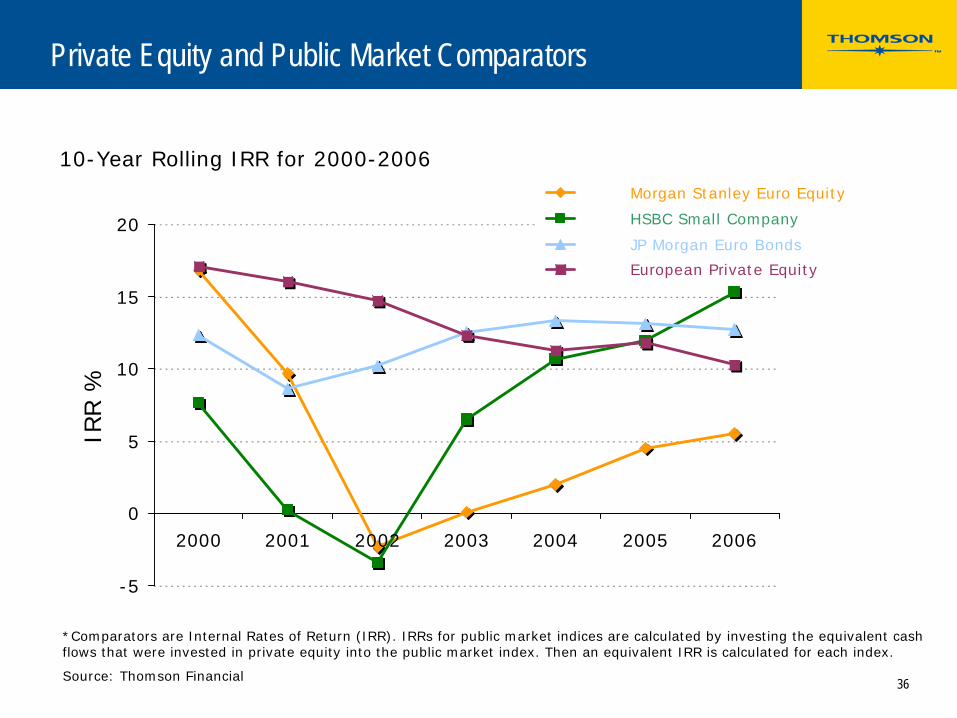
Private Equity and Public Market Comparators
-5
0
5
10
15
20
2000 2001 2002 2003 2004 2005 2006
IRR %
Morgan Stanley Euro Equity
HSBC Small Company
JP Morgan Euro Bonds
European Private Equity
*Comparators are Internal Rates of Return (IRR). IRRs for public market indices are calculated by investing the equivalent cash flows that were invested in private equity into the public market index. Then an equivalent IRR is calculated for each index.
Source: Thomson Financial
10-Year Rolling IRR for 2000-2006
37
Want to know more?
VentureXpert, the most complete private equity database globally(www.venturexpert.com)
Profiles and directories (LPs, firms & funds, portfolio companies)
Analytics (includes investments, divestments, fund raising, fund performance)
Also integrated in Thomson ONE
[email protected], +44 20 7336 1930
Data contributions & surveys: [email protected], +44 20 7014 1203
www.thomsonfinancial.com
Thank you