belsi~n - welcome to ices doccuments/1980/k/1980_k32.pdf · energy is rccycled into the ecosystem...
TRANSCRIPT

-,
- \
This paper not to be cited without prior reference to the author
International Oouncil for theExploration of the Sea
)
O.M. 198o/K : 32Shellfish OommitteeRef. Biological Oceanography
Oommittee
Population dynamics of brown shrimps (Orangon crangon)
in the Belsi~n c6astni'waters*
1. Oonsumption-production-model
F. Redant
Fisheries Research Station, Ostend, Belgium
Abstract.
A quantitative model, describing the most important trophic relationshipsof the shrimp stock (Orangon crangon) in the Belgian coastal waters isformulated. This model includes estimates of total abundance and biomassof the post-larval shrimp population, consumption of food, production ofeggsand larvae, production by growth, mortality during the embryonicstage, predation-mortality due to demersal fishes and fishing mortality.
e Resume.
Un modele quantitatif, qui decrit les plus importantes relations trophiques "de la population crevettiere (Orangon crangon) dans les eaux cotieres belges,est formule. Oe modele comprend des estimations de l'abondance et da labiomasse totales de la population de crevettes post-larvaires, l'ingestionde nourriture, la production d'oeufs et de larves, Ia production parcroissance, Ia mortalite durant les stades embryonaires, la mortalite duea Ia predation par les poissons demersaux et la mortalite due a. la peche.
* This study was performed in cooperation with the Laboratory for Ecologyand Systematics, Vrije Universiteit Brussel, Brussels, Belgium.
r,
•
e,
2.
1. Introduction.
In order to clarify some problems in the ecology of brown shrimp (Orangen
crangon) a quantitative study on its trophic relationships was started
in 1973. The most important results are discussed in this contribution.
The objectives of this study comprise :
a. adetermination of the abundance and biomass of postlarval shrimp
in the Belgian coastal waters ;
b. a quantitative analysis on a yearly basis of the consumption and
production by this population, including a detailed description of
fishing- and predation mortality ;
c. the formulation of a quantitative consumption-production-model which
describes the trophic relationships of this populationo
2 0 Qualitative consumption-production-model.
The population of postlarval Orangon crangon in the Belgian coastal waters
is considered as a "black box". This implies that the intraspecific rela
tionships between individual organisms belonging to the same "black box"
(eog. cannibalism), are left out of consideration. Only the ecological
relationships between the "black box" of brown shrimp and the other compart
ments of the eaosystem are subject to further investigationso
The Belgian coastal watrrs comprise an aren with a total surface of 1150 km2 ,
bordered in the SE by the outermost offshore limit of the shrimps' nursery
area (i.e. the 4 m isobath), in the SW and NE by respectively the Belgian
French and the Belgian-Dutch border und in the NW by a parallel to the coast
line, 10 miles offshore (figure 1).
The ecological relationships of the Crangon population in this area can
be summarized as follows (figure 2). Postlarval Orangon extract organic
matter and energy from the ecosystcm by consumption (0). The main food

sotnr:'ces are m'eiobenthos (0 ), macrobenthos (C ),. epi- and hyperbenthosmc ma(C
eh) , hypoplankton (Ohp) und detritus (Com) (BLEGVAD, 1915 HAVINGA,
1930 ; PLAGMANH, 1939 ; GERLACH, 1969)0 Part of the ingested matter and
energy is rccycled into the ecosystem as a consequence of defecation (F),
respiration (R) and excretion (U) (HAGERMAN, 1970 ; SUSCHENYA, 1970).
The other part is transformed into specific orgnnic substanees by meta
bolie activity, leading to thc production (P) by thc population.
Part of this production scrves for growth and weight-inerease of the
individuals in thc population (Pg
) (TIEWS, 1954 ; MEIXNER, 1966, 1969a ;,
SCHOCKAERT, 1968 ; DEOLR~OK and REDANT, 1972 and others). During moulting
same of thc organie production is recyclcd into the ecosystem as exuvae
(P ) (PASSANO, 1960 ; MEIXNER, 1966, 1969a). A final part of the pro-exduction is used in ovogenesis (P ) (JENSEN , 1958 ; TIEWS, 1967cSUSCHENYA, 1970 and others). A fraction of the eggs is lost, mainly
due to mortality of ovigerous females (p ) (BODDEKE and BECKER, 1976)emthe other eggs develop into planktonic larvae (WILLIAMSON, 1901 ; HAVINGA,
1930 ; PANDIAN, 1967 ; WEAR, 1974 and others).
The biomass increase (P ) .and the lasses of eggs (p ) are "eonsumed"g em
by natural mortality (i.e. non-predatory mortality) (p ) (MEIXNER, 1969a,omb ; SCHLOTFELDT, 1972), fishing mortality (Pfi ) (MISTAKIDIS, 1958 ;
BODDEKE, 1970, 1972 ; SCHUMACHER and TIEWS, 1976 and others), predation
mortality by Laridae (Pla) (KOCK, 1974) and by demersal predators (PdP
)
(GILIS, 1952 ; TIEWS, 1965, 1975 ; BODDEKE and DAAN, 1971 and others).
Finally apart of the produetion leaves the population by emigration
(M ).e
The in- and outputs of matter and energy by immigration (M.) and emigrationJ.
(M ) are greatly independent of the physiological eonsumption-productione
process. Both immigration and emigration proceod in two directions :
immigration during autumn from the nurserys and in early spring from the
wintering areas further offshore, emigration during winter to the wintering
areas and in late spring to the nurserys (HAVINGA, 1930 ; BODDEKE, 1963;

.-.. 4•
1975, 1976 ; TIEWS, 1969 and others) (a complete list of references can
be found in REDANT, 1978).
3. Abundance and biomasse
3.1. ~~~E!!~~_~~~~~~~.
The estimates of abundance (i.e. population size in number of individuals)
and biomass of postlarval Crangon crangon are based on in situ investiga
tions, which lasted from 07.1973 till 06.1976. Monthly samplings were
carried out with an ottertrawl~2.2m)headrope, 18 mm mesh size in the cod
end) on 10 fixed stations : 5 stations inshore along the Belgian W-coast
and 5 stations offshore along the E-coast (figure 1). Additional spring
and autumn surveys on 30 sampling stations, covering the whole of the
Belgian coastal watrs, were performed with a beamtrawl (6 m beam length,
18 mm mesh size in the codend) (figure 1). Neither otter-, nor beamtrawl
were electrified or rigged with tickler chainso Each experimental haul
lasted 15 minutes. The area swept by the trawl was calculated from the
towing distance and the horizontal opening of the trawL (6 m for the
beam trawl, 12.4 m on average for the opening between the doors of the
ottertrawl). Sampling always took place between 8 a.m. and 6 p.m.
On each station a random shrimp sampIe of 1500 ce was collected a~d
preserved in a 20 %formaline solution. The laboratory analyses of the
shrimp samples included counting and weighing of the total numbar of
individuals, grading of the shrimps into 5 mm length classes (total
length from tip of scaphocerite to tip of uropods), counting of the
number of ovigerous females and determination of the stage of develop
ment of the abdominal eggs, using Meyer's colour scala (MEYER, 1935).
3.2. Efficiency of the sampling gear.--------------------------------It is generally admitted that shrimp trawls only "catch" a fraction of
::
•
the fauna present on the seafloor (REYS and SALVAT, 1971)0 The efficiency
with which a trawl collects burrowing organisms like Crangon, largely
depends upon the disturbing effect of the trawl on these organismso This
effect can be intensified by tickler chains or electrical pulses (BOONSTRA
and DE GROOT, 1970 ; DE WIT, 1973)0 Comparative trials on shrimp trawls
with 4 tickler chriins and without tickler chains however showed no marked
difference between tho shrimp catches in both nets (DE GROOT, 1973).
Similar comparative oxperi~ents with an olectrified trawl on the other
hand clearly demonstrated that such a trawl catches on average 2.00 times
more shrimp than anormal trawlo This proportion was the same for all
size groups of shrimp (BOONSTRA and DE GROOT, 1970, 1974 ; VAN DEN BROUCKE,
1973). From these data we concluded that the standard shrimp trawl used
during our investigations collected maximally 50 %of the shrimps present
in or,on the seabed.
The efficiency with which a trawl retains the collected shrimps mainly
depends upon the mesh sizo of the gear (i.e. the selectivity of the
trawl). The codend as well as the large-meshed anterior part of the
net contribute to its selectivity (BOHL and KOURA, 1962 BOHL, 1963).
Comparative trials with a completely small meshod trawl and anormal
shrimp trawl showed that the former one catches 1.27 times more undersized
shrimp (smaller thon 50 mm) and 1.11 times more commercial shrimp (larger
than 50 mm) (BOHL, 1963}0 These proportions give an iden about the in
fluence of selectivity in the anterior part of the net on the composition
of the catcheso
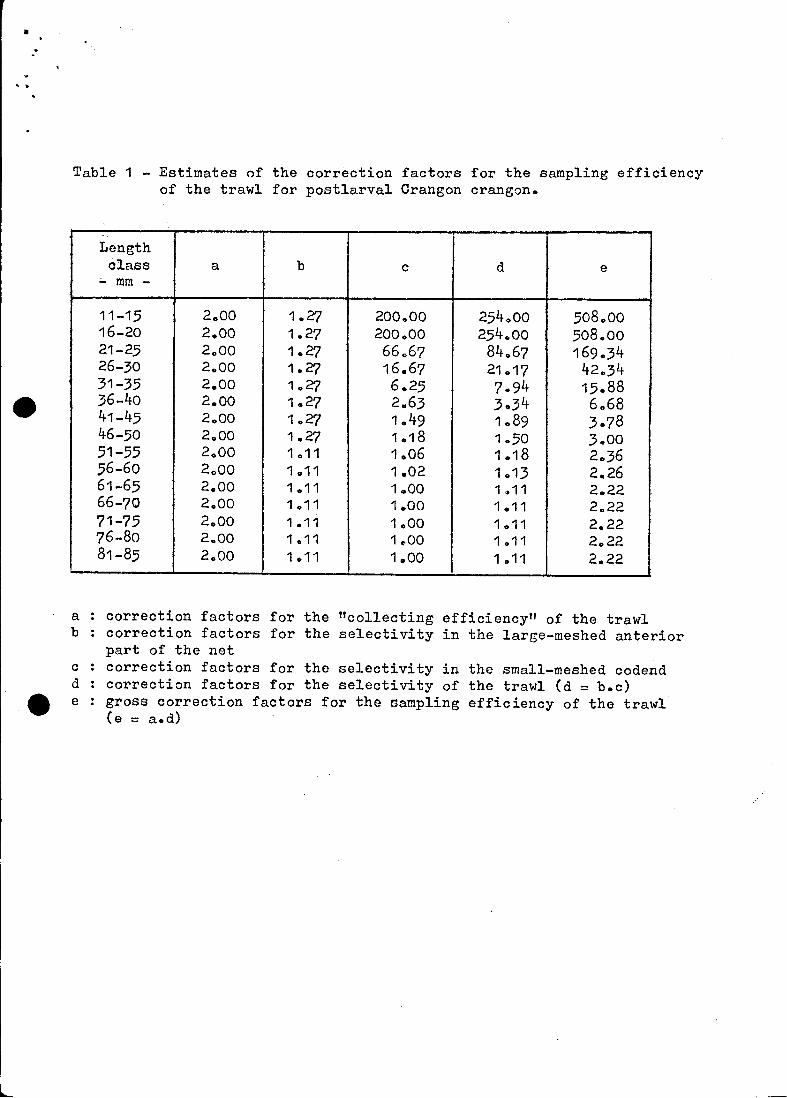
'In order to evaluate the influence of selectivity in the codend we used
a hypothetical selectivity curve (figure 3) with a 100 %retention value
for shrimps of 60 mm and over (BOHL md KOURA, 1962). Combination of the
correction factors for the selectivity in the lnrge-meshed anteior part
of the trawl and the reciprocals of the retention-values for the codend
leads to overall correction factors for the influence of selectivity ~r
"retaining efficiency" for each size group of shrimp (table 1)0 Combination

:
of these values with the overall correction factors for the f1c9llecting ef
ficiencyfl of the trawl (see first paragraph of this section) results in grass
carrection factors for the sampling efficiency of the trawl (table 1).
303. Estirnates of abundance and biomasso
The samplings and analyses of the postlarval shrimp population produced
values for its abundance and biomass observed on each sampling station and·
for each sampling month. Next, these values were corrected for the sampling
efficiency of the trawl and for the loss of weight due to formaline preser-
4t vation, resulting in estimat~of the real abundance and biomass of the
population on each station and in each month. The yearly average abundance
and biomass of shrimp on each station was derived fram these data, taking
into account the different time-intervals between succesive samplings.
From this set of yearly averages per station (10 sampling stations) and
per year (3 years of investigations) were calculated the final estimates
of average abundance and biomass of postlarval shrimp in the coastal area
as a whole.
The average abundance of pastlarv&l Crangon in the Belgian coastal waters
was estimated at 7.11 ± 3.78 individuals/m~o From these 0.20 ± 0.13 were
larger than 50 mm total length. The average biamass of the population
waS 1830 ± 1088 mg wet weight/m2
or 106 ± 63 mg_c/m2
(figure 4).
4. Consumption.
The daily food uptake of the population was comp~ted from
(1) the results of aquarium experiments on the cumulative faod uptake
and the growth of Urangon (MEIXNER, 1966, 1969a),
(2) the relation between total longth and weight of Crangon,
(3) the estimated length distribution of the individuals ~n the population
and
(4) thc sex ratio of the various length classes (BODDEKE, 1962
1967)~
TIEWS,
The total amount of food ingestcd by male or female shrimp to grow
from length L (i.e. 10.5 mm) to length L2 , or consumption C 2' for ao 0-
number of discrete lengths L2 (20, 30,40,50 and 55 mm), were derived
from Meixner's original cumulative food uptake curvcs, obtained from
aquarium experiments (MEIXNER, 1966). The quantities of food ingested
to grow from length L1 to length L2 or specific consumption C1
_2 for
each growth interval L1_2 , were, deduced from the Co
_2 values (ta~ 2).
Next, the ages A1 at length L1
and A2 at length L2 for males and females
were derived from Meixner's growth curves of Crangon under similar~uarium
conditions (MEIXNER, 1969a).
The difference dA = A2 - A1 is the number of days male or female shrimp
need to grow from L1
to L2 (table 2). The quotient C1
_2/dA gives the
daily food uptake per individual shrimp, Cd I' expressed in units weight/,day. The average weight W of the individuals in each growth interval
or size class L1
_2 was calculated from the biometrie relation between
~ length (L) and live weight (W) of Crnngon. Thc regression between these
parameters is expressed by
W = 3.212 • 10-6 L30178
(r ~ 0.999)
(number of observations n = 1200)
The quotient Cd~I/W is the daily food uptakc of each sex and size class,
expressed in units weight/day/unit- weight of Crangon, Cd,W (table 2).
Finally, thc average daily food uptake of, the population as a whole,
Cd,P' was calculated, taking into account the relative importance of
each size class in the population and under·different assumptions on the
sex ratio of the various length classes, related to the eventual occurrence

of a sex change in male Orangon. The resulting values of the daily food
uptake showed no marked differenco, whatever assumption was made on the
sex ratio, and amounted 0.032 mg O/day/mg 0 Orangon.
The mean yearly consumption (0) by tho population, computed as the
product of the daily food uptake multiplied by the mean biomass and
by 365, is 1238 ~ 736 mg 0/m2
(figuro 4).
~ Since no quantitative data on the food composition of Orangon were
available, any detailed estimate of the fluxes connecting the shrimp
black box with the other benthic compartments of the ecosystem was
excluded. Live preys seem to be more attraetive to Crangon than dead
organic matter (DAHM, 1975), indicating that detritus is not the major
food component for shrimp. From the living food sources maerobenthic,
epi- and hyperbenthic and hypoplanktonic organisms are probably the most
important. Meiobenthos indeed is eonsidored as a complementary·food
source for shrimp (GERLAOH, 1969).
50 Production.
5.1. ~~~~~~~~~~_~l_~~~~~~.
The gross growth-effieieney or Ivlov's K1 (SUSOHENYA, 1970 j WINBERG,
1970) was calculatod in analogy to the daily food uptake. The average
gross growth-effieiency of postlarval Orangon is 51.2 %. It is difficult
to compare this value with bibliographie data beeause most of them refer
to pelagic organisms (KINNE, 1970 ; SUSOHENYA, 1970). In comparison to
tho few benthic organisms for which K1
-values are known, the gross growth
efficiency of Orangon is fairly high. The roason for this can be found
in the kind of food, namely Artemin, uscd durine Meixner's aquarium
experiments (MEIXNER, 1966, 1969a). Indeed, Artemia is very rich in .

protein and energy (SLOBODKIN and RIOHMAN, 1961)0 As a cons9quence
it is likely that the shrimp's gross growth-efficiency will be lower in
vivo than under aquarium conditions and that the in vive consumption by
the population, needed to obtain a Same production by growth, will be
higher than the one estimated (see previous scction)o
The production by growth (Pg) Was computed from the consumption of the
population and the average gross growth-efficiency and Was 633 ~ 3762
mg O/m /year. The production of eXUvae (p ) was not estimated becauseexdata on the weight or carbon content of the exuvae were not available
.. (figure 4)0
The turn-over (production by growth/biomass) of the population of
postlarval Orangon is 600/year. Turn-over values for benthic species,
as far as they are known, vary between 005 and 20 00/yenr (VOROBEV, 1949
and SHORYGIN, 1952 in WINBERG, 1970). The turn-over of Orangon seems
to be in good agreement with these findingso
The egg-production was calculated from
(1) the menn density of fertile females in the population,
(2) the mean number of eggs per ovipoation (HAVINGA, 1930 ; NEYER, 1937
JENS:ftlN.·1958) ,
(3) the mean number of ovipositions per female per year (HAVINGA, 1930
TIEWS, 1954) und
(4) the chemical composition of eggs (PANDIAN, 1967)02The yearly egg-production (P ) averages 2015 eggs/m or 6.7 + 402 mg 0/
2 em (figure 4)0
The total number of larvae produced per year (PoL) was computed in analogy
to the total egg-ptoduction. In this case however the calculations started
from the mean density of ovigerous females with well-developed abdominal
eggs (dark-blue or black coloured eg€s) 0 The production of .larvae Was

100
estimated at 560 larvae/m2/year with an initial egg-weight of 1.9 mg
C/m2/yenr (figure 4). Thus only 27.8 % of the eggs produced yearly
develop into plank'conic larvae while 72.2 %are lost during the embryonie
phase (P ).em
The total production by thc population, excluding the production of2
exuvae, amounts to 640 + 376 mg Olm Iyear (p + p). From this 1.9- g e
mg C/m2/year ends up, as larvae, in the plankton. The remaining part,
2 '638 ~ 376 mg C/m Iyear, is available for emigration (Me)' natural
mortality (Pom ) , fishery (Pfi ) , predation by demersal predators (Pdp )
and by the Laridae (P~~) (figure 4).
60 Mortality.
The production of the Crangon populEtion is "consumed" by higher trophic
levels (demersal predators, man, Laridae) or is returned into the eco
system by natural, non-predatory mortality. The investigations concen
trated on fishing- and predation mortality because these could be
expected to be the main mortality causes of postlarval shrimp. More
over our knowledge on natural mortality of shrimp (e.go due to disease,
moulting or pollution) is rather scarce, making any reliable estimation
of these mortality factors impossible.
The ichthyofauna of the coastal area comprises about 60 fish specieso
These were classified according to their abundance in the coastal
waters and to their food preference for postlarval shrimp.
Quantitative research of predation mortality focused on the most im
portant predators : Odontogadus merlangus, Trisopterus luscus, Gadus
-- . 11.
morhua, Ciliata mustela, Pomatoschistus species, Tri6la species, Agonus
cataphractus and Liparis liparis.
Predation mortality of postlarval Crangon was eomputed from
(1) the average yearly abundanee and biomass of the predators,
(2) the rcsults of quantitative stomaeh analyses ~n these predators and
(3) bibliographie data on digestion time and daily food uptake of fishes.
These investigations are diseusscd in~Mft1980/K:33.
Total predation mortality, exprcssed in numbers of Orangon amoUnts to
14.12 ± 5.66 Crangon/m2/year~ This vnluc should be eonsidered as uminimal estimate of thc real year1y predation mortality sinee only the
eight most important vertebrate and none of thc invertebrate predators
(e.g. Maeropipus) were taken into aeeount. The greatest"mortality is
eaused by Pomatosehistus, followcd by Odontogadus, Trisopterus, Trigla,
Agonus, Liparis, Gadus and Ciliata (table 3).
Total predation mortality, expressed in weight units of Crangon (Pd')
is minimally 126 ± 40 and maximally 789 ± 236 mg C/m2/year (figure ~) •.
Odontogadus is the most important predator, followed by Trisopterus,
Trigla, Gadus, Liparis, Pomatosehistus, Agonus and C~liata (table 3).
Fishing mortality was dedueed from national landing statistics. During
the period 01.1973 - 06.1976 yearly 1702 ~ 455 tons of eooked shrimp,
eorresponding to 1975 ± 527 tons live weißht, were landed in Belgian
harbours. Fishing mortality thon is 1.14 + 0.30 individuals/m2/year
or 100 ± 27 mg C/m2/year (Pfi )" (figure 4),-asSuming that the eomplete
eateh originates fror.! the area defined as "Belgian coastal waters"
(see section 2).
A comparison of these data2
m ) shows that only 0.20 %size (larger than 50 mm).
with the yearly production of larvae (560 Larvae/
of the larvae grow into shrimp of eommercial
This proportion is in good agreement with the

l
•
findinGs for the Dutch shrimp stock, where 0.17 %of the larvae reach
a commercial size (BODDEKE and BECKER, 1976).
Predation mortality of postlarval CranGon is on average 12.4 timen
greater than fishing mortality (both cxprossed in numbers of Crangon).
This relation is clearly highor than in tho German Bight where the
ratio predation/fishing mortality WaS found to vary between 1.7 and
12.9 (TIEWS, 1965). It should however be noted that predation mortality
of shrimp in the German Bight is to some cxtent undcrestimated, due to
the lack of data on predation during winter (IOES, 1979). Thc real
magnitude of predation mortality in the German waters and consequently
also the ratio predation/fishing mortality, are higher than the estimates
which have been published (TIEWS, 1965, 1975). The difference between
the valucs of this ratio for the shrimp populations in the Belgian and
German waters gets smaller when this underestimation is taken into
account.
Fishing activities also cause casualties among juvenile, undersized
shrimp. Analyses showed that the unsorted catches of Belgian shrimp
vessels consist for 70.7 %of undcrsized shrimp. Maximally 25 %of
them do not survive the manipulation of the catch (MISTAKIDIS, 1958),
mainly as a consequence of desiccation (ICES, 1979). The resulting "in
direct" fishing mortality was estimated at 0.69 + 0.18 Crangon/m2/year
or 19 ~ 5 mg C/m2/year. Part of the discarded, :ndcrsized shrimp, alive
or dead, are eaten by Laridaeo The importance of this output still
remains unknown. The others sink or swimm to the bottom. Indications
were found that demersal fishes may feed on dead, di~carded shrimps.
A" certain degree of overlapping bctween predation mortality and "indirect"
fishing mortality may thus not be excluded.
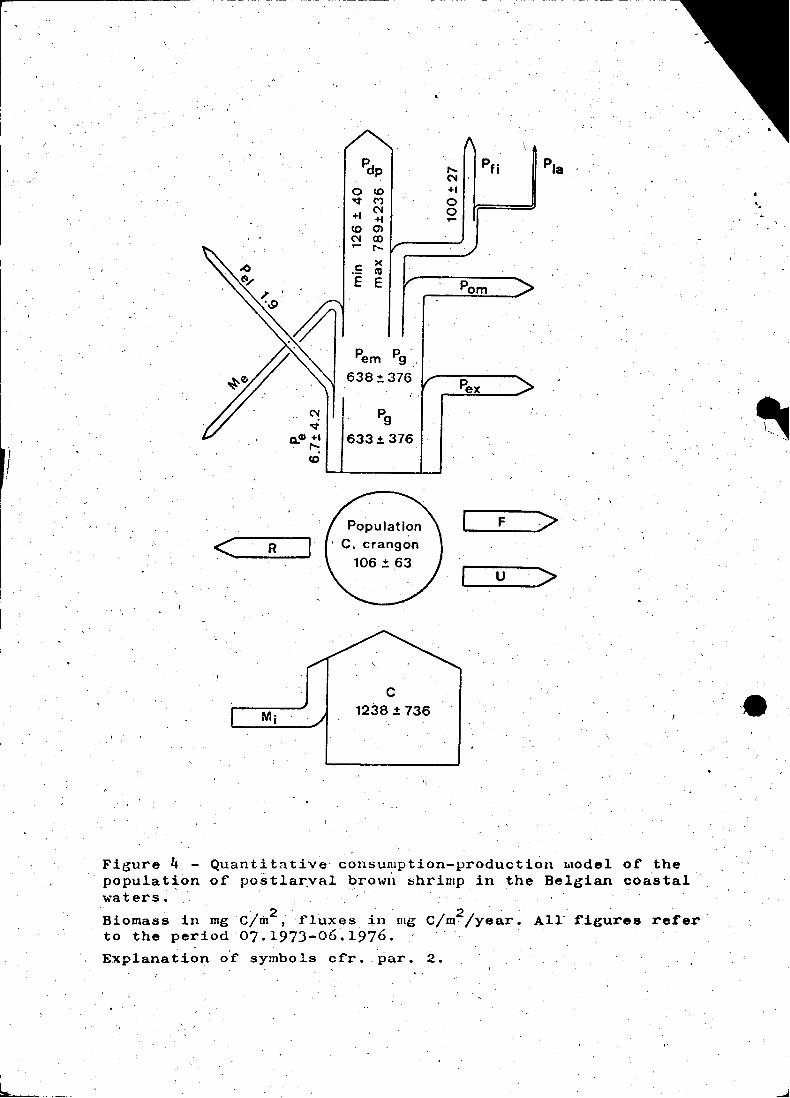
7. Quantitative model.
The estimates of biomass, consumption, production by growth, production
of eggs and "larvae, fishing- und predation mortali ty were assembled into

l
13.
a quantitative connumption-production-model of the Crangon population
(figure 4)0 Thc carbon fluxes for respiration, cxcretion, defecation,
production of exuvac, natural mortality, predation by Laridae and
migration still remain unestimated. Most of them refer to physiological.
proeesses of Crangon, upon whieh our knowledge is ultimately searee.
The sum of predation - and fishing mortality (minimally 226 ~ 48 and
maximally 889 ~ 238 mg C/m2/year) is in good agreement with the estimate
of the part of the produetion which is available for higher trophic levels
or for natural mortality (638 ± 376 mg C/m2/year). This proves that at
least the estimatcs 'of the produetion of the population are reliable.
The results of this study confirm the concurrential relationship between
predation and Lhrimp fishery and thc vulnerable situation of the latter.
They also indicate that regulatory measures for the shrimp fishery should
be considered with critieismo Indeed, the eventual positive effeets of
such measures may easily be annihilated by predationo
From the larvae which are produced yearly by Crangon only 2 0 7 % on
average end up in thc stomaehs of prcdators or in the eommereial eatehes.
Mortality during the larval and early postlarval stages may be of major
importanee. This mortality may be caused by pelagie earnivores as weIl
as by lethaI physieo-chemical eonditions. These findings indioate that
the yearly fluctuations in the catches of commercial shrimp should be
attributed mainly to fluctuations in broodsize and in survival of the
larvaeo
8. Bibliography.
BLEGVAD, Ho (1915) : Food and conditions of nourishment ~mong the communities of invertebrate animals found in or on the sea bottom inDanish watersoRep. Dan. Biolo Stato, 22 0

. 14.
BODDEKE, R. (19b2) : Resultaten vnn drie jnar garnalenonderzoek.Visserij-nieuws, 15(5).
BODDEKE, R. (1963) : lnfluence of the severe winter 1962-1~63 in Dutchconstnl watersolCES, Near Northern Seas Commo, paper no 119 (mimeo)o
BODDEKE, Ro' (1970) : The crisis in the Dutch shrimp-fisheries in 1969.lOES, Shellfish and Benthos Comm., CM 1970/K : 15 (mimeo).
BODDEKE, R~ (1972) : Fluctuntions of the brown shrimp stock along theDutch toast during the period 1959-1972 0
lCES, Shellfish and Benthos Commo, OM 1972/K : 4 (mimeo).
BODDEKE, R. (1975) : Autumn migration and vertical distribution of thebrown shrimp Crnngon crangon Lo in relation to environmental conditionsoProco 9th Europo Mar. Biol. Sympo, Ed. Ho Bnrnes, AberdeenUniversity Press.
BODDEKE, R. (1976) : The seasonnl migration of the brown shrimp OrangoncrangonoNeth o J o Sen Res., 10(1).
BODDEKE, Ro en BECKER, Ho (1976) : A quantitative study of the fluctuations of the stock of brown shrimp (Crangon crangon) along the coastof the netherlands.lCES, Special Meeting Population Assessments Shellfish Stocks',paper noo 58 (mimeo).
BODDEKE, Ro en DAAN, N. (1971)Visserij , 24 (7).
Wanr zijn de garnalen gebleven ?
BOHL, He (1963) : Weitere Untersuchungen über die Selektivität derGarnalenkurren vor der nordfriesischen Küste.Protoko zur Fischereitechnik, 38 (8).
BOHL, H. en KOURA, R. (1962) : Selektionsversuche mit GarnoIenkurrenvor der nordfriesischen Küste.Protoko zur Fischereitechnik, 35 (8).
BOONSTRA, Go en DE GROOT, So (1970) : Report on the development of anelectrified shrimp trawl in the NetherlandsolCES, Genr und Behaviour Comme, CM 1970/B : 5 (mimeo).
BOONSTRA, Go en DE GROOT, So (1974) : Notes on the further developmentof an electrified shrimp trawl in the NetherlandsolCES, Gear and Behaviour Oomme, CM 1974/B : 5 (mimeo)o
DARM, E. (1975) : Untersuchungen zum Nahrungserwerb von Orangon crangon L.Bero Dto Wisse Komm. Meeresforscho, 24 (2/3).

r---- ~--~------- -- - ---
15 .. '
DE CLERCK, Ro en REDANT, ro (1972) : On the use of the floating meanmethod in shrimp investigationsoICES, Shellfish and Benthos Comm., CM 1972/K ; 23 (mimeo)o
DE GROOT, So (1973) De invloed von trawlen op de zeebodem.Visser!j, 26 (7).
DE WIT, J. (1973) : Effects of trawls and dredges on the sea bed.ICES, Gear and Behaviour Comm., CM 1973/B : 2 (mimeo).
GERLACH, S. (1969) : On the importance of marine meiofauna for benthiccommunities ..ICES, Shellfish und Benthos Comm., CM 1969/K : 37 (mimeo).
GILIS, Ch. (1952) : De garnaalvisserij op de Bclgische kust : haarevolutie in da loop van de jaren 1935-1951 en haar invloed opde garnalenstapel.Ed. ZWI, Oostendc, verhandeling no 8.
HAGERMAN, L. (1970) : The oxygen consumption of Crangen vulgaris(Fabr.) in relation to salinityoOphelia, 70
HAVINGA, B. (1930) : Der Granat (Crangon vulgaris Fabr~) in denholländischen Gewässern.J. du Conseil, 5 (1).
ICES (1979) : Report of the Working Group on Crangonid Shrimps.ICES, Shellfish Comm., CM 1979/K:7 (mimeo).
JENSEN, J .. (1958) : The relation betwcen body size and number ofeggs in marine MalacostracaoMedd. fra Danm. Fisk .. og Havunders., NS 2 (19).
KINNE, 0 .. (1970) : Marine Eoology, Chapter 3. Temperature, 3.3. Animals, 3.3.1. Invertebrates.In : Marine Ecology, 1 (1) Ed. O. Kinne.Ed. Wiley, Interscience.
KOCK, K.. (1974) : Nahrungsökologische Untersuchungen an Mantelmöwen(Larus marinus) auf RelgolandoHelgoländer Wisse Meeresunterso, 26 (1).
MEIXNER, R. (1966) : Thc effects of food supply on moulting, growthund spawning of the shrimp Orangon crangon (L.).ICES, Shellfish Comm., CM 1966/M : 5 (mimeo).
MEIXNER, R. (1969a) : Wachstum, Häutung und Fortplanzung von Crangonorangon (L.) bei Einzelaufzucht.Ber. Dt. Wiss. Komm. Meeresforsch., 20 (2)0
MEIXNER, R. (1969b) : Is thore a spot disease in Crangon crangon CL.) ?ICEB, Shellfish and Benthos Comm .. , CM 1969/K : 15 (mimeo).

•
I
MEYER, P9 (1935) : Ein Beitrag zur Frage der Laiehperiodizitätbei der Nordseekrabbe (Granat) Crangon vulgaris Fabr.Zool. Anze, 109 (1/2).
MEYER, P. (1937) : Ein Beitrag zur Frage der Brutbiologie der Ostseekrabbe Leander adspersus (Rathke) var. Fabrieii Rathke inder Wismareer,BuehtoZool. Anz., 117 (7/8).
MISTAKIDIS, M. (1958) : Compnrative fishing trials with shrimp nets(1954-1956)~Fishe Invest. MAFF, Serie II, 22 (1).
PANDIAN, T. (1967) : Preliminary report on chemieal changes andealorie content of developing eggs of the shrimp Crangon crangon.tOES, Shellfish Commo, CM 1967/K : 12 (mimeo).
PASSANO, L. (1960) : Molting and its control.In : The Physiology of Crustacea, Ed. T. l{aterman.Ed. Academic Press, New York.
PLAGMANN, J. (1939) : Ernährungsbiologie der Garnale (Crangon vulgarisFabr.).Helgoländer Wisse Meeresunters., 2 (1).
REDANT, F. (1978) : Konsumptie en produktie van post-larvale Crangoncrangon in de Belgische.kustwateren.PhD thesis, Vrije Universiteit Brussel.
REYS, J. en SALVAT, B. (1971) : L'echantillonnage de la maerofaunedes sediments meubles marins.In : Problemes d'ecologie : l'echantillonnage des peuplements
animaux des milieux aquatiques, Ed. Lamotte, M. et Bourliere, F.
Ed. Masson et co, Paris.
SCHLOTFELDT, Ho (1972) : Jahreszeitliche Abhängigkeit der 'Sehwarzfleckenkrankheit' bei den Garnele Crangon crangon L.Ber. :Dt. Wisse Kommo Meeresforseh., 22 (3).
SCliOCKAERT, E. (1968) : Contribution a l'etude de la croissanee etde la reproduetion de la crevette grise (Crangon crangon L.)au large de la eote belge.Biol. Jaarbo, 36.
SCHUMACHER, A. and TIEWS, K. (1976) : On the population dynamicsof the brown shrimp (Crangon crangon) off the German coast.ICES, Spec. Meeting Popo Assessm. Shellfish Stocks, paper 31(mimeo)9
l
SLOBODKIN, Lo en RICHMAN, S. (1961)animals.Nature, 191 (4785).
Calories/gm. in speeies of
17.
SUSGHENYA, L. (1970) : Food rations, metabolism and growth of crustaceans.In : Marine food chains, Ed. J. Steele~
Ed. Univ. of Galifornia Press, Los Angeles.
TIEWS, K. (1954) Die biologische Grundlagen der Büsumer Garnelenfischerei.Ber. Dt~ Wisse Komm. Meeresforsch., 13 (3).
TIEWS, K. (1965) : An attempt to estimate the predation of shrimps(Grangon crangon) causcd by predatory fishes on the German coast.IGES, Shellfish Gomm., paper no 24 (mimeo).
TIEWS, K. (1967) : Synopsis of biological data on the common shrimpGrangon crang~ (L.).FAO Fisheries Synopsis, no 91.
TIEWS, K. (1969) : Die Markierung von 60.000 Nordseegarnelen Grangoncrangon (L.) und ihre Ergebnisse.Arch. Fischereiwiss., 20 (1).
TIEWS, K. (1975) : Prey-predator-relationship between fish populations and the stock of brown shrimp (Grangen crangon L.) inGerman coastal waters.IGES, Shellfish and Benthos Gomm., GM 1975/K : 4 (mimeo).
VANDEN BROUGKE, G. (1973) : Further investigations on electricalfishing.IGES, Gear and Behaviour Gomm., GM 1973/B : 14 (mimeo).
WEAR, R. (1974) : Incubation of British decapod Grustacea and theeffects of temperature on the rate und succes of embryonic development.J. Mar. Biol. Ass. UK, 54 (3).
WILLIAMSON, H. (1901) : On the larval stages of Decapod Grustaceathe shrimp Grangon vulgaris Fabr.Ann. Rep. Fish. Bd. Scotland, 19 (3).
WINBERG, G. (1970) : Methods for the estimation of production inaquatic animals.Ed. Academic Press, Landen (translated from Russian).
•
, .
Table 1 - Estimates cf the correction factors for the sampling efficiencyof the trawl for postlarval Orangon crangon.
Lengthclass a b c d e
;;.. mm -
11-15 2.00 1.27 200.00 254000 508.0016-20 2.00 1.27 200.00 254 .. 00 508.0021-25 2 000 1.27 66 .. 67 84.67 169.3426-30 2.00 1.27 16.67 21.17 42 .. 3431-35 2.00 1.27 6 025 7.94 15.8836-40 2 .. 00 1 .. 27 2 .. 63 3.34 6.6841-45 2 000 1.27 1.49 1089 3.7846-50 2.00 1.27 1018 1 .. 50 3.0051-55 2 000 1.11 1.06 1.18 203656-60 2 0 00 1 .. 11 1.02 1 .. 13 2.2661-65 2.00 1.11 1 .. 00 1,,11 2 .. 2266-70 2.00 1.11 1.00 1.11 2 .. 2271-75 2.00 1.11 1000 1011 2.2276-80 2 .. 00 1011 1 .. 00 1 .. 11 2.2281-85 2.00 1.11 1.00 1 011 2.22
a correction factors for the "collecting efficiencyfl of the trawlb correction factors for the selectivity in the large-meshed anterior
part of the netc correction fnctors for the selectivity in the small-meshed codendd correction factors for the selectivity of the trawl (d = b.c)e e gross correction factors for the sampling efficiency of the trawl
(e = a.d)
L

. ,
.\ .
Table 2 - Daily food uptake of postlarval Crangon crangon.
LO L1 L2C
O_
2C
1_
2 A1 A2 dA Cd,I W Cd,w Cd,p
;;:ro 0
f:lO"'-r-f !lO 6;;: ;;: tQ tQ tQ >'CIS ;;:
~ ~6 6 6 ro ro >. >. >. m ~ :;:s s s CIS CIS CIS roro CIS CISro ro ro , •..-l f:lO ro rof:lO f:lO ;;: P
~ "'-S 6 ro '..-l 0ro ro !lO!lOS:: 6S '..-l !lO
6
:
l'emales
1005 10 05 20.0 19.4 19.4 18 110 92 0.21 0.02 36.3620.5 30 .. 0 106.9 87.5 110 168 58 1.51 0.10 52.0230.5 4000 223.8 11609 168 200 32 3.65 0027 46.6640.5 50.0 378.4 154.6 200 245 45 3044 0 .. 59 20.085005 55.0 600.7 222.3 245 289 44 5 .. 05 0.96 18.15
Males 0.032:
10.5 10.5 20.0 21.2 21.2 181 118 100 0.21 0.B2 36 ..,~20.5 30.0 130.9 109.7 118 175 57 1092 0.10 66.3630.5 40.0 252.4 12105 175 212 37
1
3 028 0.27 410944005 50.0 447.1 19407 212 278 66 2.95 0.59 17.2450.5 55 .. 0 770.5 323.4 278 352 74 4.37 0.96 j 15.70, I
e ww: wet weightdw : dry weight
explanation of symbols see section 4 .. 1

•
1, .
L
Table 3 - Predation ~ortality of postlarval Crangon crangon caused bydemersal fishes.
22 mg C/m /year
Predator species n/m /yearminimum maximum
Odontogadus merlangus 1.48 8~.2 42101.. 1.20 z: 36 • .5 + 182.6-Trisopterus luscus 0089 24.4 244.2
.±. 0,40 + 1408 .±. 148.3- \
Gadus morhua 0.06 7.6 38.0+ 0.02 + 2.0 + 10.0- -
Ciliata mustela 0.03 0.2 2.2+ 0.02 + 0.1 + 1.0- -
Pomatoschistus species 10086 2 01 4.2.± 5 .. 51 + 1.1 + 2.2- -
Trigla species 0.41 605 6409.:!:. 0.23 + 1 .. 1 + 1100
Agonus cataphractus 0 .. 25 0.5 4 .. 8.±. 0.19 + 0.:,) + 2 .. 6-
Liparis liparis 0.14 1.0 9.9+ 0.08 + 008 + 7.7- -
Total 14012 126.5 789.3.:!:. 5066 .±. 39.5 .±. 235 .. 9
all figures refer to the period 07.1973-06.1976
..

1
Zeebrugge
Fieur~ 1 - Po~itions or the sampling stations in the Belgiancoastal waters :o W-coast inshore~ monthly samp1inss,• E-coast of'f'shore, lJIollthly snmplings,• spring - and autumn surveys.
The boundaries of the area defined as "Belgian coastal waters"are also indicated in this figura.
oC'?o?'"\I)
oN-e..-It)
......

.. -
_1/1t1l ....1/1 0.... -Cl! t1lE"OCl! ~00.
»....Cl!~1/1
-u..
Cl!t1l,
"0..t1l
..J
F
u
1/1o~....eCl!
.Ll0'
'Qj~
1/1Q~-e
'1:o....Ut1l~
-1/1o~
"Oe e~'Cl!
.Ll
I Q.- 0.'0.»LU~
.~ e010t1l-~'Cl! e0.t1l»~a.
- 0t1l 0CO N
Figure 2 - Review of thc'fluxes .'coullQcting the population'orpostlarval brown'shrimp with the other compartments of' theecosystem. Explanation of symbols cf'r. par. 2.

70 '
Lcrangon (m~)
60
.\
50403020
Figure J -, Hypo thetical sclectivi ty curve o'r:"th:~':'i8>üuri'trawlcodend f'or post larval brown shrimp.
- 1001IlC
..- 1Il 90.c....>-
JJ 80e0- 70
_ .......... ""'.MOe1Il-1Il 60..
<X
,,-
50 \
40
'" 30
20
10 I~,
\
i,
Pdp ..... Pfi P'aC'l
0 tO +1V (Y) 0 ,
C'l 0.
+1 +l ....tO 0)C'l CO.... .....
.E)(
CUE E Pom
Pg
633 ± 376
Pem Pg ,
638± 376
C'l
~
a.CIl +1.....tOl
F >< R
U. >
M'1
C1238 j; 736
Figure 4 - Quanti tative consunlption-production hlodel of thepopula tion of postlar,val browl'l shrimp in the Belgian coastalwaters.
Biomass in mgC!m2 , 'f'luxes in mg C/m2/year. AIr t'igures ret'er'to the period07·.197J-06.1976.Explanation o'i' symbo ls ci'r •. par. 2.
j