behaviour of gang-nail plated timber joints in tension...
TRANSCRIPT
University of Southern Queensland
Faculty of Engineering and Surveying
Behaviour of Gang-Nail Plated Timber
Joints in Tension Perpendicular
to the Grain
A dissertation submitted by
Craig Desmond Klinge
In fulfilment of the requirements of
Courses: ENG4111 & ENG4112 Research Project
Towards the degree of
Bachelor of Engineering (Civil)
Submitted: October 2012
i
Abstract
According to the American Wood Association, a tension perpendicular to the grain
failure is the evil of all wood connections. However there are very limited studies
conducted to address this issue. This project aims to investigate the behaviour of
timber joints using Gang-Nail Plates.
A failure of a joint in a prefabricated timber roof truss as a result of tension
perpendicular to the grain has the potential to be a catastrophic accident. The current
method of analysing timber joints subject to a tensile force perpendicular to the grain
is based on a professional engineers’ theoretical analysis without the physical test
data. AS1720.1 Section 4 suggests a procedure to calculate the design capacity of
timber joints using screws, bolts and nails but not for gang-nail plates.
Through physical testing, the strength of timber joints with gang-nail plates was
determined and the results were analysed to propose a new method of design. By
this, destructive testing in accordance with AS1649-2001 has been conducted to find
the failure mechanism and ultimate failure force. This was then analysed to find the
relationship between the force, timber properties and plate geometry.
It was found that the failure load of the timber joint increases with increasing bite
depth. Similarly the joints with a 125mm plate exhibited a higher failure load
compared to 75mm and plates at 45 degrees for a similar bite depth. Failure in
tension perpendicular to the grain occurred just below the bottom row of teeth. All
failures of the tested samples were observed to be along the grain in a similar
location.
From the analysis, it was found that the relationship between the bite per mm depth
and the bite (or plate) width produced the equation for the design force of:
( )
This equation produced more consistent results when compared to the current MiTek
method, however, as only one species and grade of timber was used during this
investigation, the equation is only a fit for this material. Further investigation will
now be required to confirm this equation’s fit with other materials by conducting a
similar testing regime with other species, grades and engineered wood products.
ii
University of Southern Queensland
Faculty of Engineering and Surveying
ENG4111 Research Project Part 1 &
ENG4112 Research Project Part 2
Limitations of Use
The Council of the University of Southern Queensland, its Faculty of Engineering
and Surveying, and the staff of the University of Southern Queensland, do not accept
any responsibility for the truth, accuracy or completeness of material contained
within or associated with this dissertation.
Persons using all or any part of this material do so at their own risk, and not at the
risk of the Council of the University of Southern Queensland, its Faculty of
Engineering and Surveying or the staff of the University of Southern Queensland.
This dissertation reports an educational exercise and has no purpose or validity
beyond this exercise. The sole purpose of the course pair entitled “Research
Project” is to contribute to the overall education within the student's chosen degree
program. This document, the associated hardware, software, drawings, and other
material set out in the associated appendices should not be used for any other
purpose: if they are so used, it is entirely at the risk of the user.
Professor Frank Bullen
Dean
Faculty of Engineering and Surveying

iii
CERTIFICATION
I certify that the ideas, designs and experimental work, results, analyses and conclusions
set out in this dissertation are entirely my own effort, except where otherwise indicated
and acknowledged.
I further certify that the work is original and has not been previously submitted for
assessment in any other course or institution, except where specifically stated.
Craig Desmond Klinge
0050041591
____________________________ Signature
____________________________
Date

iv
Acknowledgements
The idea for this dissertation originated from discussions with MiTek Australia’s
Technical Services Manager Mr Robert Tan. His support, encouragement and
guidance in getting the project off the ground were essential and I would like to
thank him for this.
I would also like to thank Dr Allan Manalo as my supervisor for his guidance, advice
and direction when needed. Also thanks to Ernesto Guades and Mohan Trada from
USQ for their assistance during the testing of my samples.
Thanks to MiTek Australia for their support in time off work, provision of materials
and for support and advice from various members of the engineering and
management team. Thanks also to TrussTec Pty Ltd for the use of their equipment in
producing my test samples and Hyne and Son Pty Ltd for the donation of timber.
Finally I would like to thank my wife and children for their support, patience and
understanding during the entire time studying this degree including the time away
from home it has taken.
Craig Klinge
2012
v
Table of Contents
Abstract ........................................................................................................................ i
Acknowledgements .................................................................................................... iv
Table of Contents ....................................................................................................... v
List of Figures ......................................................................................................... viii
List of Tables ............................................................................................................. ix
Nomenclature.............................................................................................................. x
Glossary ....................................................................................................................... x
Chapter 1 Introduction .............................................................................................. 1
1.1 What is a Roof Truss ......................................................................................... 1
1.2 History of Timber Roof Trusses ....................................................................... 4
1.3 Project Aim and Objectives .............................................................................. 5
1.4 Overview .......................................................................................................... 5
Chapter 2 Literature Review .................................................................................... 7
2.1 Introduction ........................................................................................................ 7
2.2 Truss Mechanics ................................................................................................. 7
2.3 Truss Joints ........................................................................................................ 9
2.4 Tension Perpendicular ..................................................................................... 10
2.5 Standards .......................................................................................................... 12
2.5.1 Australian Standards ................................................................................. 12
2.5.2 International Standards .............................................................................. 13
2.5.3 Current Plate and Software Suppliers ........................................................ 15
2.6 Current MiTek Method..................................................................................... 15
Chapter 3 Materials and Methods .......................................................................... 17
3.1 Introduction ...................................................................................................... 17
3.2 Materials ........................................................................................................... 17
3.2.1 Timber ....................................................................................................... 17
3.2.2 Gang-Nail Plates ....................................................................................... 20

vi
3.3 Manufacture of Samples ................................................................................... 22
3.4 Testing Method ................................................................................................. 25
3.4.1 Introduction ................................................................................................ 25
3.4.2 Testing Setup ............................................................................................. 26
3.4.3 Testing Procedure ...................................................................................... 28
3.5 Health and Safety ............................................................................................. 29
Chapter 4 Experimental Results and Observations .............................................. 30
4.1 Introduction ..................................................................................................... 30
4.2 Forces .............................................................................................................. 30
4.3 Failure Mechanisms......................................................................................... 31
4.3.1 125 mm Width Range ............................................................................... 31
4.3.2 75 mm Width Range ................................................................................. 35
4.3.3 Rotated at 45 degrees Range ..................................................................... 41
4.3.4 Conclusion of Observation ....................................................................... 47
Chapter 5 Discussion................................................................................................ 49
5.1 Introduction ..................................................................................................... 49
5.2 Effect of Bite Depth on Strength and Failure Mechanism .............................. 50
5.3 Effect of Bite Width on Strength and Failure Mechanism .............................. 51
5.4 Effect of Bite Area on Strength and Failure Mechanism ................................ 53
5.5 Effect of Plate Angle on Strength and Failure Mechanism ............................. 54
5.6 Effect of Timber Properties on Strength and Failure Mechanism ................... 54
5.7 Effect of Tooth Quantity on Strength and Failure Mechanism ....................... 55
5.8 Conclusion ....................................................................................................... 56
Chapter 6 Proposed Design Calculation ................................................................ 57
6.1 Introduction ..................................................................................................... 57
6.2 New method to achieve Ultimate Failure Force .............................................. 57
6.3 New method to achieve Design Failure Force ................................................ 62
6.4 Comparison to existing TPIC method ............................................................. 64
6.4 Conclusion ....................................................................................................... 65
vii
Chapter 7 Conclusion and Recommendations ...................................................... 66
7.1 Summary.......................................................................................................... 66
7.2 Achievement of Project Objectives ................................................................. 68
7.3 Conclusion ....................................................................................................... 69
7.4 Recommendations ........................................................................................... 70
References ................................................................................................................. 71
Appendix A – Project Specification ........................................................................ 75
Appendix B – Sample Material Densities............................................................... 77
Appendix C.1 – Avery Testing Machine Reports .................................................. 78
Appendix C.2 – Sample individual test output ...................................................... 82
Appendix D – Testing Results ................................................................................. 86
Appendix E – Analysis Data .................................................................................... 90
Appendix F.1 – New Calculation Method .............................................................. 93
Appendix F.2 – New Design Calculation Method – 5th
Percentile Probability ... 97
Appendix G – Risk Assessment ............................................................................... 99
viii
List of Figures
Figure 1.1 - Roof Trusses in use (during construction) ....................................................................... 2
Figure 1.2 - Deformation of shapes with applies loads........................................................................ 2
Figure 1.3 - Gang-Nail connector plates............................................................................................. 3
Figure 1.4 - Evolution of the truss ...................................................................................................... 4
Figure 2.1 - Force direction on members ............................................................................................ 8
Figure 2.2 - Common Tension Perpendicular Failure (Enjily, 2001) ................................................ 11
Figure 2.3 - Exert from Truss Certificate from MiTek's 20/20 program............................................. 12
Figure 3.1 - Weighing of sample members ........................................................................................ 19
Figure 3.2 - Tension Perpendicular test as per AS1649 .................................................................... 22
Figure 3.3 - Tension Perpendicular is assumed to not occur in the 45 degrees from straps ............... 23
Figure 3.4 - Pressing of test samples ................................................................................................ 23
Figure 3.5 - Failure within plate area during pressing at 20 mm bite ............................................... 24
Figure 3.6 - Avery Test Machine at USQ Toowoomba ...................................................................... 26
Figure 3.7 – Accessories for Testing Machine (MiTek Australia) ...................................................... 27
Figure 3.8 - Avery Test Machine Software during a test .................................................................... 28
Figure 4.1 - ID5 Failure at bottom row of teeth ................................................................................ 32
Figure 4.2 - ID5 failure below the plate ............................................................................................ 32
Figure 4.3 - Sloping failure along grain. End fibres remain intact .................................................... 33
Figure 4.4 - Small fracture length along grain .................................................................................. 33
Figure 4.5 - ID1 with failure 100 mm either side of plate .................................................................. 34
Figure 4.6 - Timber fibres failure laterally with appearing like plate withdrawal ............................. 35
Figure 4.7 - Fracture follows grain in cross section.......................................................................... 36
Figure 4.8 - Fractures following grain around knots and other defects ............................................. 36
Figure 4.9 - Two noticeable fracture lines on front ........................................................................... 37
Figure 4.10 – Tension perpendicular failure restricted by support from over straps ......................... 38
Figure 4.11 - Possible fracture restricted by over straps ................................................................... 38
Figure 4.12 - Full fracture following grain around defects ............................................................... 39
Figure 4.13 - Lateral movement of timber fibres. Minor plate bending ............................................. 40
Figure 4.14 - Minor fracture along bottom row of teeth both top and bottom .................................... 40
Figure 4.15 - Small crack appeared as dark lines at 8 - 10 kN .......................................................... 41
Figure 4.16 - Final failure at varying depths .................................................................................... 42
Figure 4.17 - Cracks appeared in area that was under compressive forces - bottom 1/4 of member .. 42
Figure 4.18 - Tension perpendicular failure even after plate withdrawal .......................................... 43
Figure 4.19 - Occurrence of substantial plate withdrawal ................................................................ 44
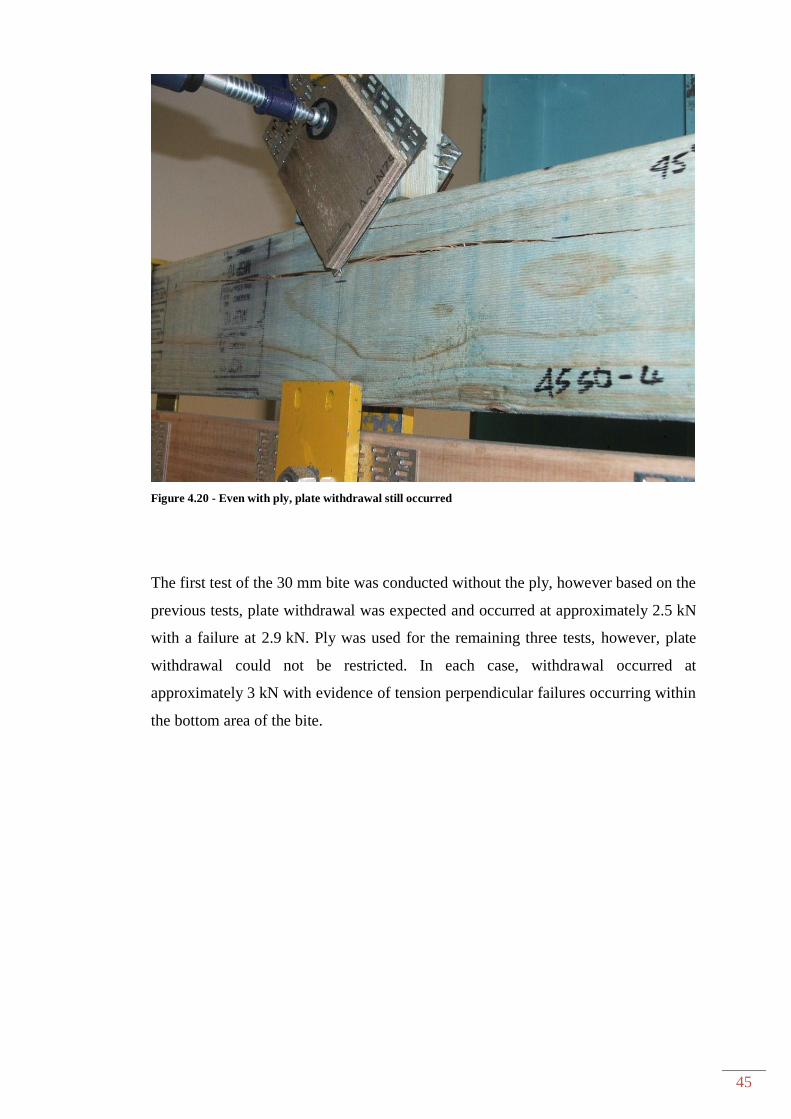
Figure 4.20 - Even with ply, plate withdrawal still occurred ............................................................. 45
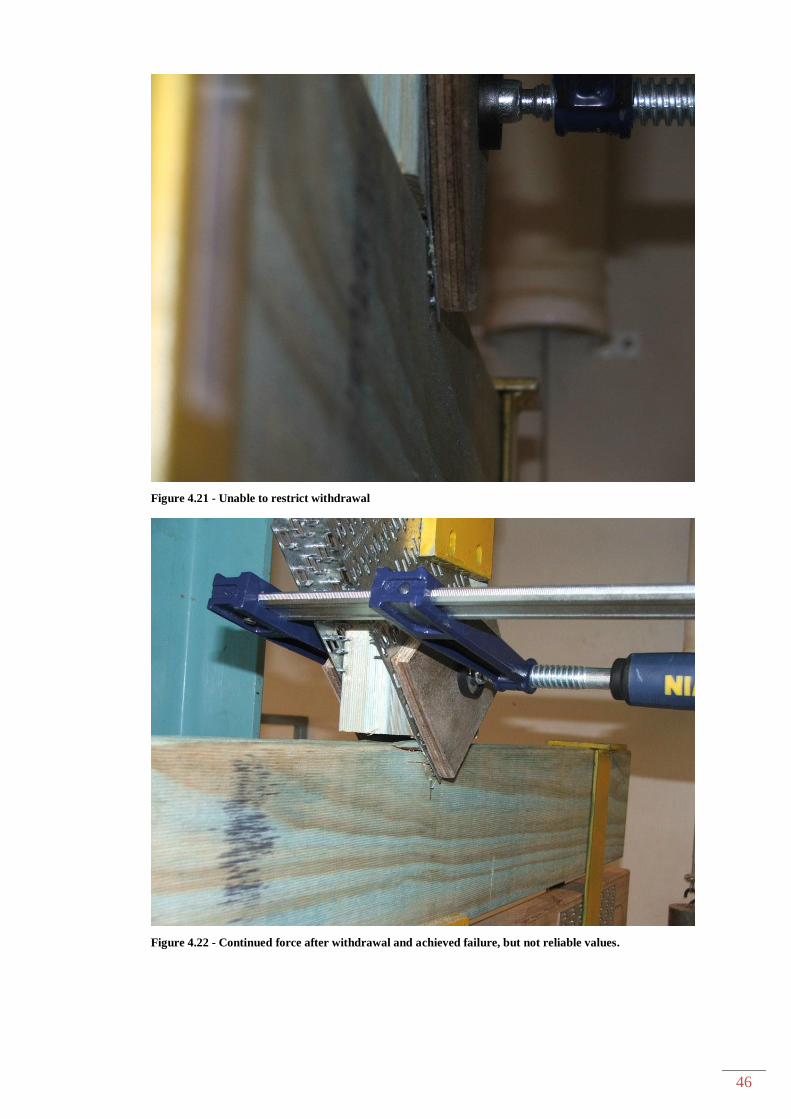
Figure 4.21 - Unable to restrict withdrawal ...................................................................................... 46
Figure 4.22 - Continued force after withdrawal and achieved failure, but not reliable values. .......... 46
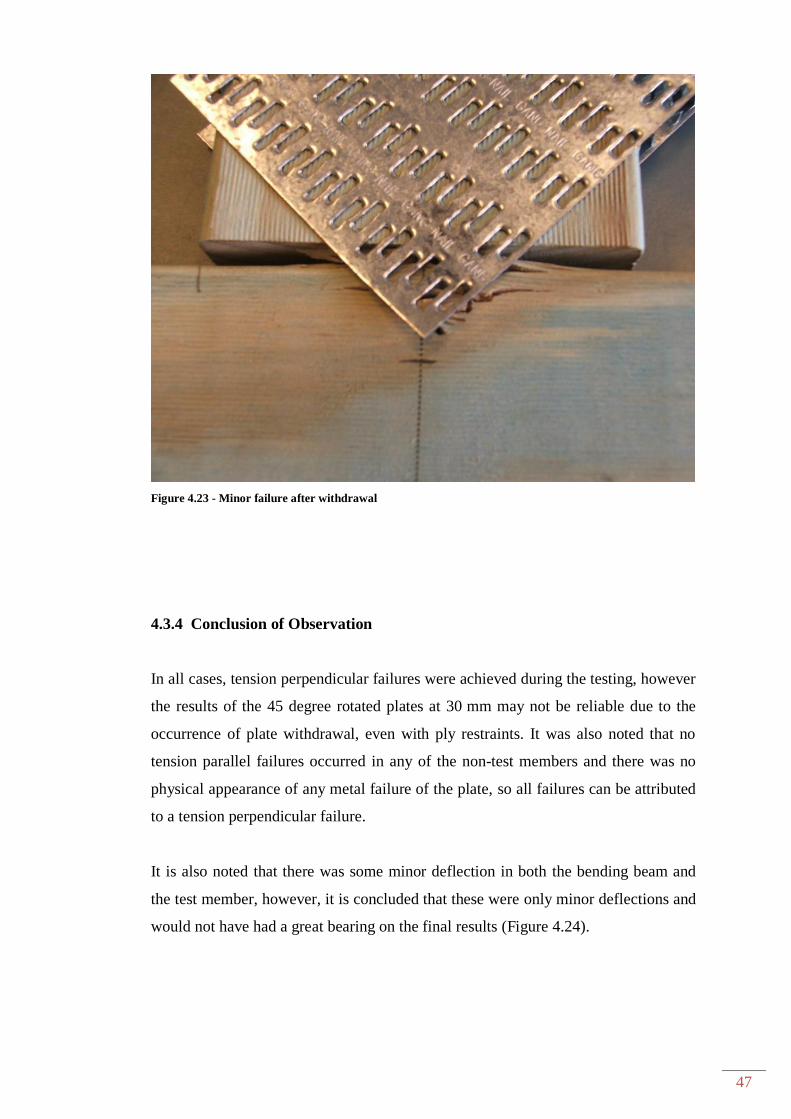
Figure 4.23 - Minor failure after withdrawal .................................................................................... 47
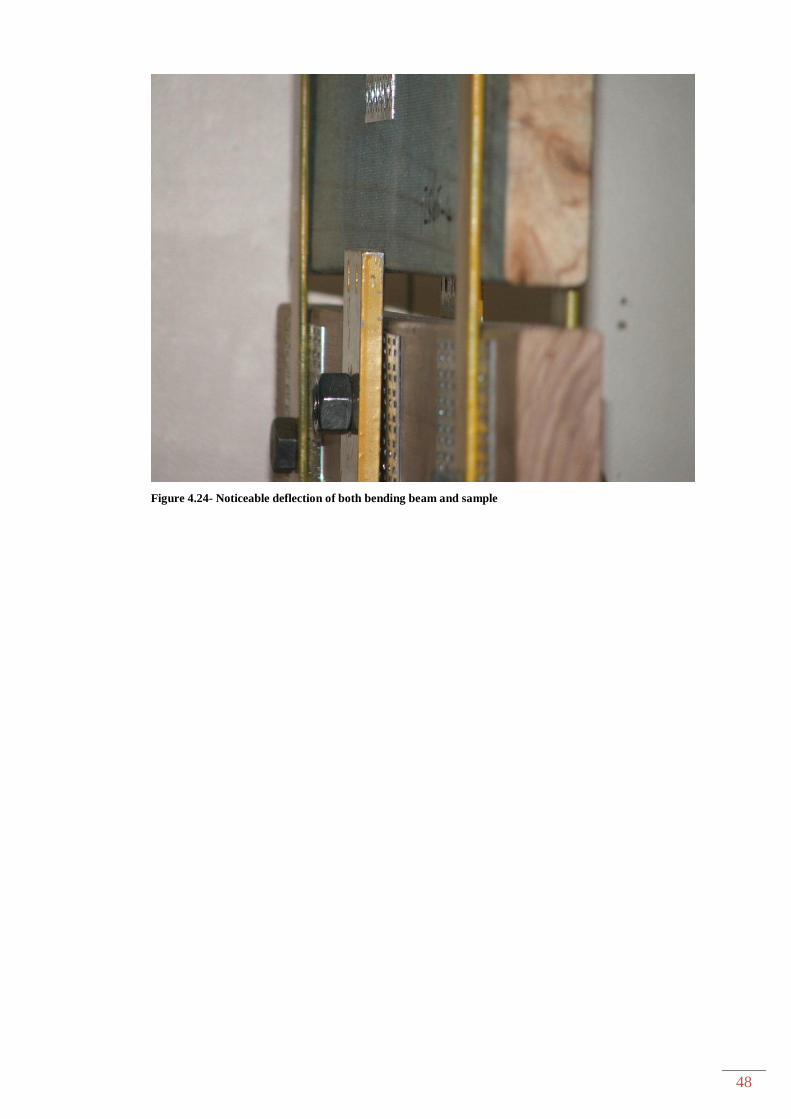
Figure 4.24- Noticeable deflection of both bending beam and sample ............................................... 48
Figure 5.1 – Relationship of failure load and bite depth for all tests ................................................. 50
ix
Figure 5.2 - Relationship of Force to bite width ................................................................................ 52
Figure 5.3 - Average force v Bite Area.............................................................................................. 53
Figure 6.1 - Force/mm bite depth v width plot .................................................................................. 58
Figure 6.2 - What is the bite depth and width for the rotated plates? ................................................ 59
Figure 6.3 - Force/mm bite depth v width including 45 degree orientation plates ............................. 60
Figure F.1 - Plot of Force/mm bite depth v width for square plates only ........................................... 93
Figure F.2 - Plot of Force/mm bite depth v width including 45 degree orientation plates.................. 95
List of Tables
Table 2.1 - Estimated Ultimate Failure Load in Tension Perpendicular ............................................ 16
Table 3.1 - Characteristic Values from AS1170.1-2010..................................................................... 18
Table 3.2- Mean Density ranges from AS1649-2001 ......................................................................... 18
Table 3.3 - Characteristic Capacity for Steel Qs ............................................................................... 20
Table 3.4 - Design Shear Capacity – value in kN .............................................................................. 21
Table 3.5- Revised Estimated Ultimate Failure Load in Tension Perpendicular ................................ 25
Table 4.1- Average Actual UFL ........................................................................................................ 30
Table 5.1 - Estimated v Average Actual UFL .................................................................................... 49
Table 5.2 - Strength per mm bite depth ............................................................................................. 51
Table 5.3 - Bite area and loads ......................................................................................................... 53
Table 5.4 - Tension Perpendicular Characteristic Values ................................................................. 55
Table 5.5 - Force per tooth ............................................................................................................... 55
Table 6.1 - Proposed ultimate failure force ....................................................................................... 59
Table 6.2 - Actual v Proposed failure force including 45 degree plates ............................................. 61
Table 6.3 - Proposed Design Failure Force ...................................................................................... 63
Table 6.4- Comparison of Spruce and Douglas-Fir to Actual ............................................................ 64
Table 6.5 - Comparison of Current method to proposed new method ................................................ 65
Table 7.1 - Comparison of Current method to proposed new method ................................................ 67
Table F.1 - Calculation of Force for all orientations using equation from Figure F.1 ....................... 94
Table F.2 - Force based on proposed equation from Figure F.2 ....................................................... 96
Table G.1 - Measure of consequence ................................................................................................ 99
Table G.2 - Measure of Likelihood.................................................................................................... 99
Table G.3 - Risk Assessment Matrix ................................................................................................ 100
Table G.4 - Legend for Risk Level ................................................................................................... 100

x
Nomenclature
FD Design Force (in tension perpendicular)
Ftpw Force / mm bite depth for a given width
Fu Ultimate Failure Force
ftp Tension Perpendicular to grain Characteristic Value
kN Kilo-Newton
k1 Duration of Load Factor
k11 given by (
)
where V0 is 107
Ntp Force in Tension Perpendicular
thk Thickness of the truss
tp Bite depth
UL Ultimate Load
w Plate width
ρ Density
Ø Capacity factor
Glossary
ABCB Australian Building Codes Board
AS Australian Standard
BCA Building Code of Australia
EWP Engineered Wood Products
MGP Machine Graded Pine
MiTek MiTek Australia Ltd
UFL Ultimate Failure Load
USQ University of Southern Queensland
TPI Truss Plate Institute (America)
TPIC Truss Plate Institute Canada
1
Chapter 1 Introduction
With the design and shape of most residential homes today, their open plan living
areas and limited internal walls, buildings using a “pitched rafter” design with
rafters, strutting and hanging beams are becoming part of our history. Most builders
today will tell you that prefabricated trusses “are the only way to go” (Raftertales,
2008).
There are many benefits of using trusses over the conventionally pitched roof. These
include:
Ecological sound choice – timber used is a renewable resource
Members are of smaller section size that span greater distances
Light weight – enabling fast and efficient construction
(Wood solutions, 2012)
However, one result of the use of trusses also means that these lighter members are
required to transfer the applied loads via joints. While many forces act on the joints,
a tension perpendicular to the grain failure within a timber roof truss can cause a
catastrophic collapse that could result in the death or injury of anyone inside the
building at the time. Therefore truss design packages need to account for all the
various forces that act within the joints of the truss and resist against failure. This
means that design checks of the timber and plates need to be analysed.
1.1 What is a Roof Truss
A roof truss is a prefabricated structural framing component that supports the roof
and ceiling material. It was the first major component of residential buildings to be
fully prefabricated in the factory and delivered to site (MiTek 2012). The members
of a truss act as strut and ties, which once all connected together can act as a beam to
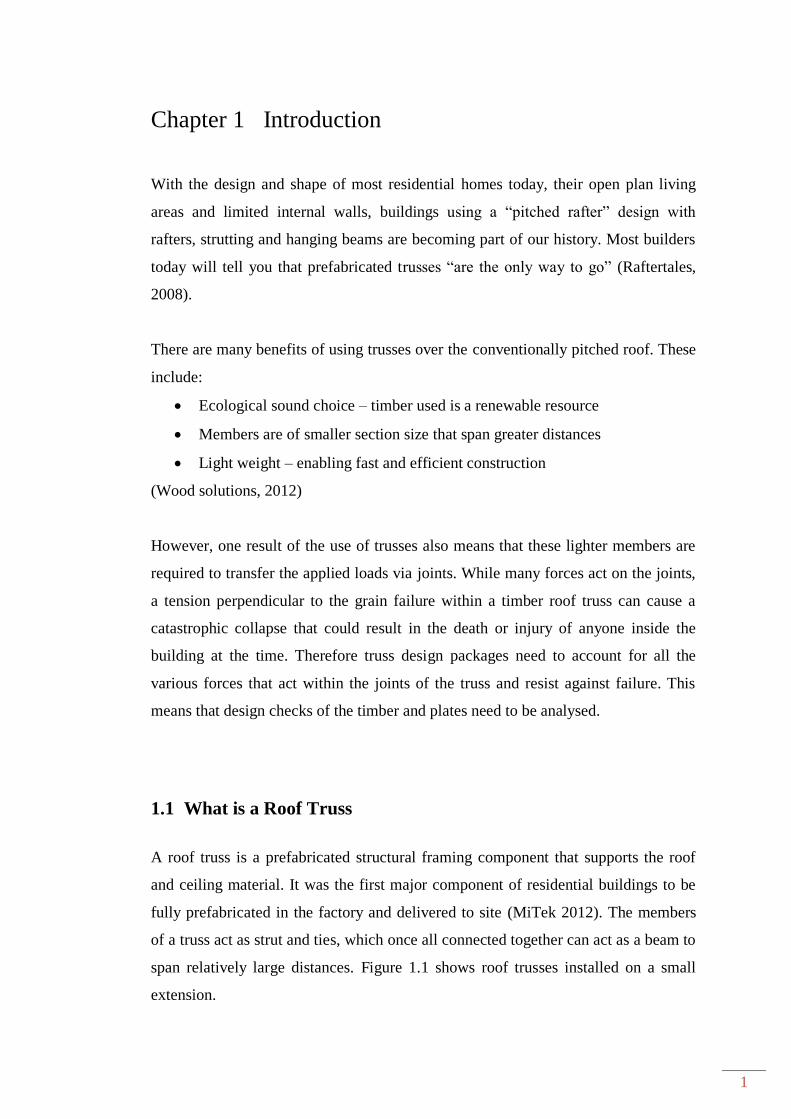
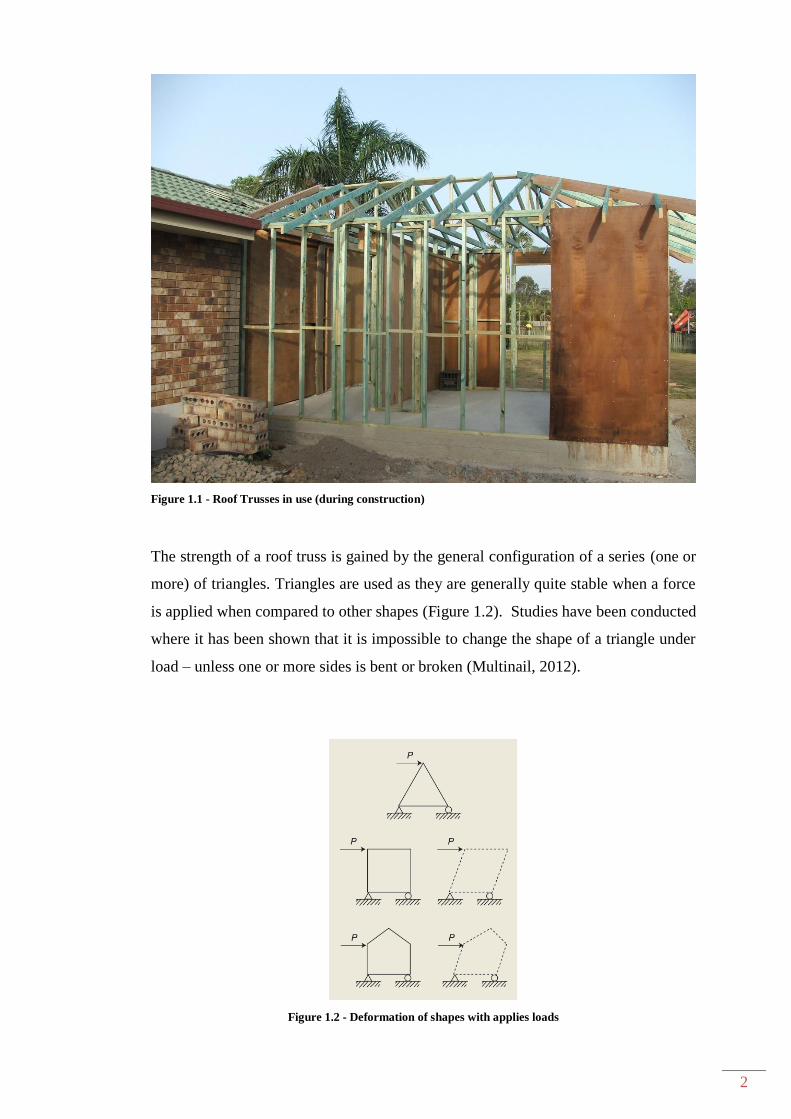
span relatively large distances. Figure 1.1 shows roof trusses installed on a small
extension.
2
Figure 1.1 - Roof Trusses in use (during construction)
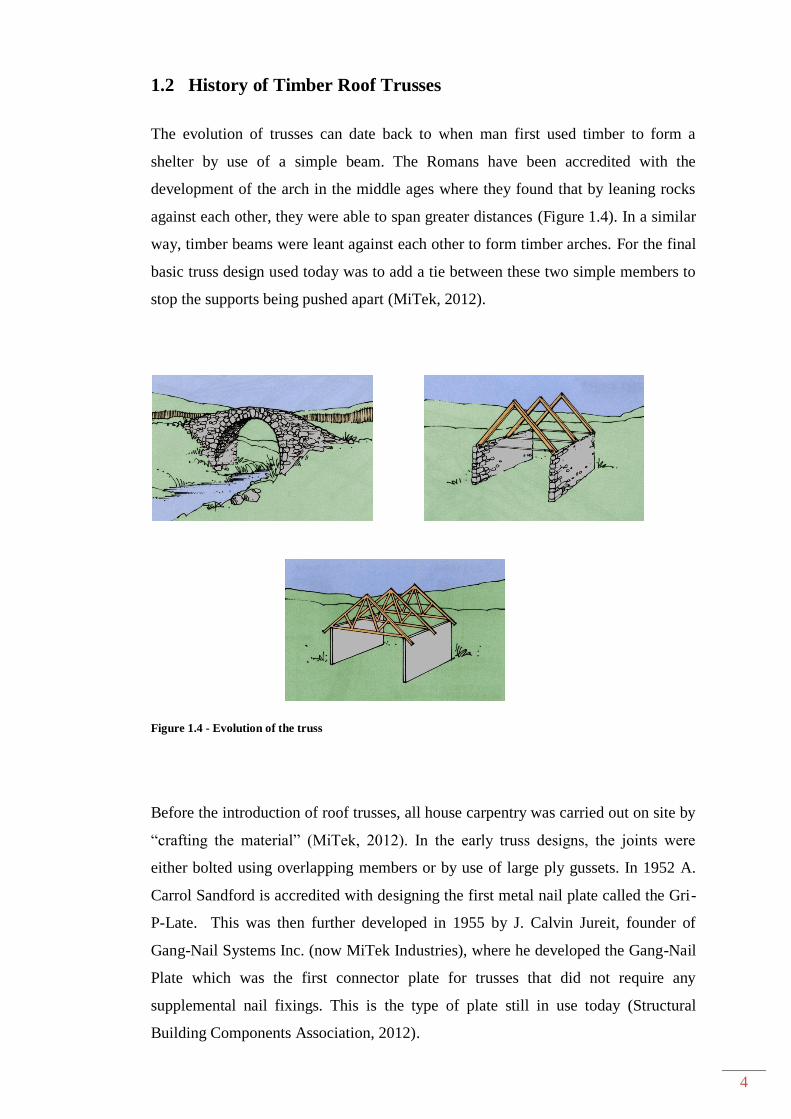
The strength of a roof truss is gained by the general configuration of a series (one or
more) of triangles. Triangles are used as they are generally quite stable when a force
is applied when compared to other shapes (Figure 1.2). Studies have been conducted
where it has been shown that it is impossible to change the shape of a triangle under
load – unless one or more sides is bent or broken (Multinail, 2012).
Figure 1.2 - Deformation of shapes with applies loads

3
The benefits of roof trusses are numerous. By using the triangulation, they are able to
span further distances than conventional rafters, with small dimensional members.
Being light weight and quick to install, trusses are a cost-effective way of
construction. Almost any shape is achievable, as long as the basic principal of
triangulation is maintained.
Today, they are generally constructed using timber that has been joined together at
joints using metal gang-nail plates (Figure 1.3) however some steel trusses are also
made.
Figure 1.3 - Gang-Nail connector plates
4
1.2 History of Timber Roof Trusses
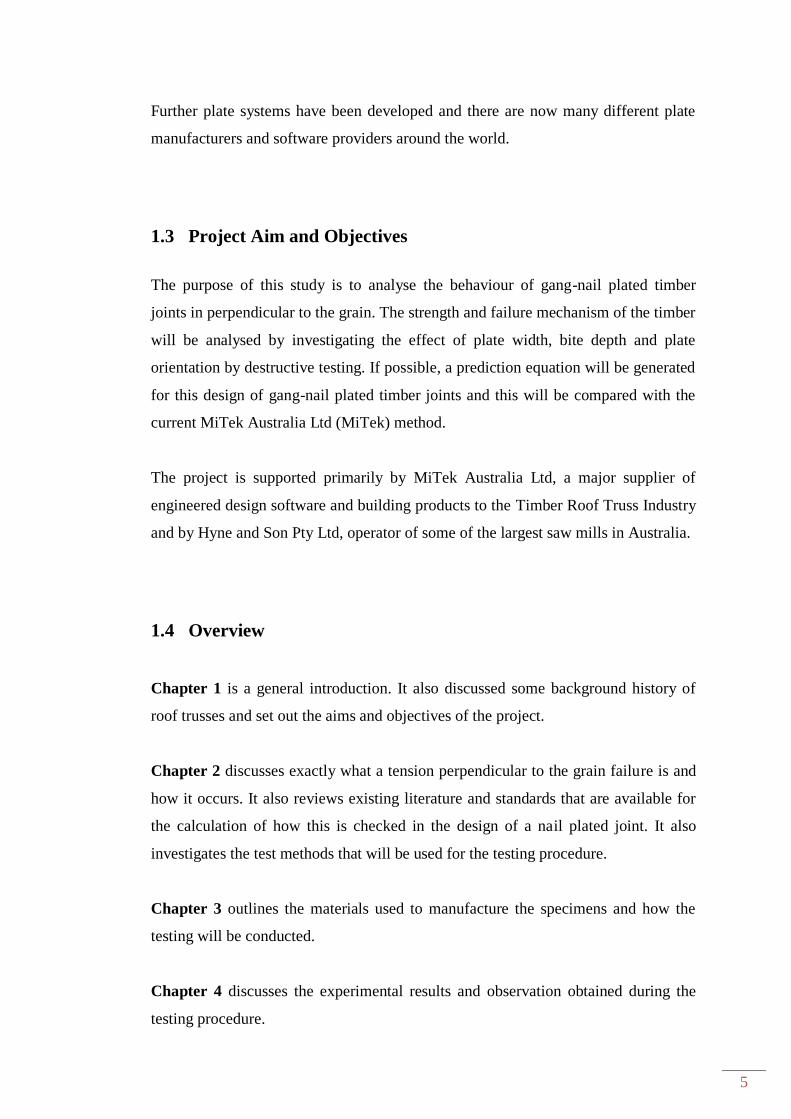
The evolution of trusses can date back to when man first used timber to form a
shelter by use of a simple beam. The Romans have been accredited with the
development of the arch in the middle ages where they found that by leaning rocks
against each other, they were able to span greater distances (Figure 1.4). In a similar
way, timber beams were leant against each other to form timber arches. For the final
basic truss design used today was to add a tie between these two simple members to
stop the supports being pushed apart (MiTek, 2012).
Figure 1.4 - Evolution of the truss
Before the introduction of roof trusses, all house carpentry was carried out on site by
“crafting the material” (MiTek, 2012). In the early truss designs, the joints were
either bolted using overlapping members or by use of large ply gussets. In 1952 A.
Carrol Sandford is accredited with designing the first metal nail plate called the Gri-
P-Late. This was then further developed in 1955 by J. Calvin Jureit, founder of
Gang-Nail Systems Inc. (now MiTek Industries), where he developed the Gang-Nail
Plate which was the first connector plate for trusses that did not require any
supplemental nail fixings. This is the type of plate still in use today (Structural
Building Components Association, 2012).
5
Further plate systems have been developed and there are now many different plate
manufacturers and software providers around the world.
1.3 Project Aim and Objectives
The purpose of this study is to analyse the behaviour of gang-nail plated timber
joints in perpendicular to the grain. The strength and failure mechanism of the timber
will be analysed by investigating the effect of plate width, bite depth and plate
orientation by destructive testing. If possible, a prediction equation will be generated
for this design of gang-nail plated timber joints and this will be compared with the
current MiTek Australia Ltd (MiTek) method.
The project is supported primarily by MiTek Australia Ltd, a major supplier of
engineered design software and building products to the Timber Roof Truss Industry
and by Hyne and Son Pty Ltd, operator of some of the largest saw mills in Australia.
1.4 Overview
Chapter 1 is a general introduction. It also discussed some background history of
roof trusses and set out the aims and objectives of the project.
Chapter 2 discusses exactly what a tension perpendicular to the grain failure is and
how it occurs. It also reviews existing literature and standards that are available for
the calculation of how this is checked in the design of a nail plated joint. It also
investigates the test methods that will be used for the testing procedure.
Chapter 3 outlines the materials used to manufacture the specimens and how the
testing will be conducted.
Chapter 4 discusses the experimental results and observation obtained during the
testing procedure.
6
Chapter 5 includes an analysis of the test data to find suitable parameters that can be
investigated further for the proposal of a new calculation method
Chapter 6 presents the proposed new calculation method for both ultimate failure
and design failure based on the test results and materials used
Chapter 7 presents the conclusions that can be drawn from this project and discuss
any further recommendations for future work
References and Appendices provide all the supporting documentation referred to
throughout this dissertation
7
Chapter 2 Literature Review
2.1 Introduction
The current MiTek method for determining the tension perpendicular to the grain
failure has not yet been proven by any formal study. It has been determined as a
conservative theoretical estimate by a professional engineer based on the values for
various connection types in AS1720.1 along with their technical experience with
gang-nail plates.
While AS1720.1 discusses the tension perpendicular calculation for various joints
including nailed, screwed and bolted, it does not cover the use of gang-nail plates.
Therefore this chapter aims to identify literature to support the project objectives and
to identify methods for achieving these. It will also investigate the current methods
used in the United States of America and in Canada by the Truss Institutes in these
countries.
Through discussions with the Technical Services Manager of MiTek, Mr Robert
Tan, it was indicated that there was a need to verify the current MiTek method for
determining the tension values with some physical research and testing. He indicated
that he was not aware of any previous work within Australia and research on this
topic has concluded as such.
2.2 Truss Mechanics
Trusses are designed to support all the loads applied to them and to transfer the loads
through its members into the supports. These include:
Dead Loads – Permanent loads due to weight of materials and truss self-
weight (e.g. Roof and Ceiling materials, Air-conditioner Units, Hot Water
Units, etc.);
Live Loads – Temporary load due to traffic, construction, maintenance (e.g.
people and their tools)
Wind Loads – Load applied to the roof by the wind
(Gang-Nail Truss Systems, 2009)
8
All the trusses in a structure are designed for their worst case of the above combined
loads. These loads cause the members of the truss to be in (usually) either tension or
compression, which then transfers these loads through the joints.
Tension forces These have the effect of pulling on the member causing it to
stretch.
Compression Force These have the opposite effect of pushing on the end of the
member, causing it to buckle.
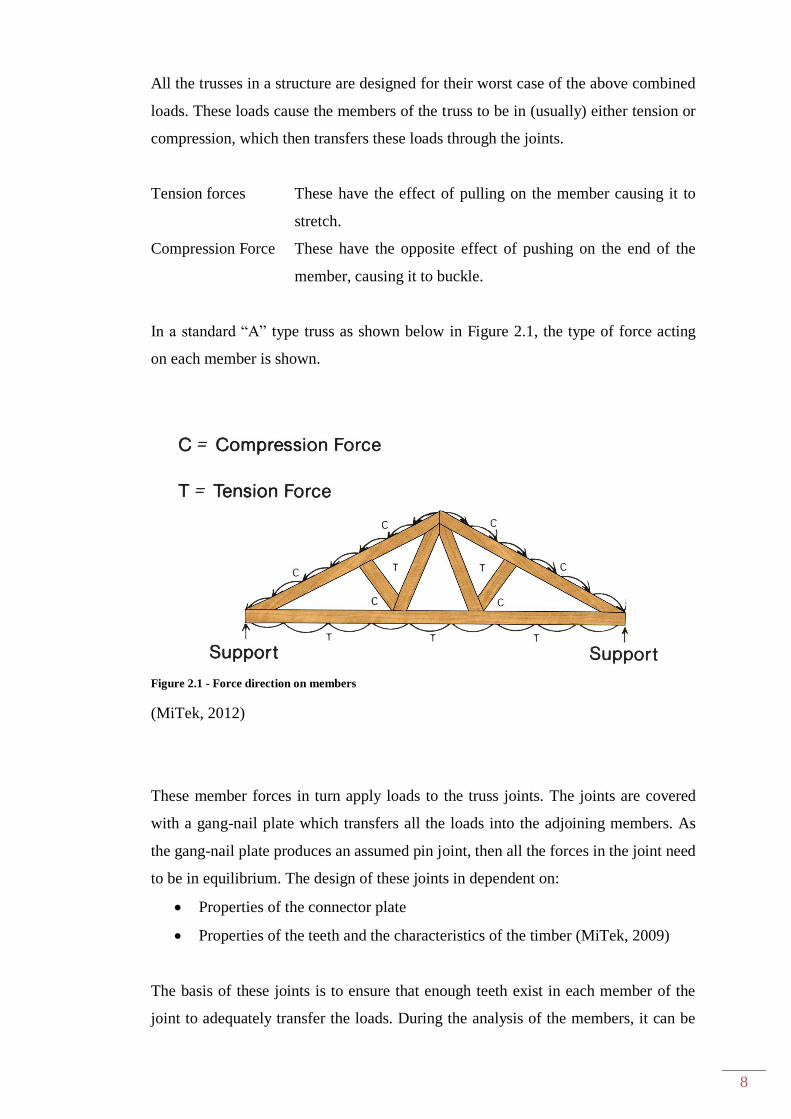
In a standard “A” type truss as shown below in Figure 2.1, the type of force acting
on each member is shown.
Figure 2.1 - Force direction on members
(MiTek, 2012)
These member forces in turn apply loads to the truss joints. The joints are covered
with a gang-nail plate which transfers all the loads into the adjoining members. As
the gang-nail plate produces an assumed pin joint, then all the forces in the joint need
to be in equilibrium. The design of these joints in dependent on:
Properties of the connector plate
Properties of the teeth and the characteristics of the timber (MiTek, 2009)
The basis of these joints is to ensure that enough teeth exist in each member of the
joint to adequately transfer the loads. During the analysis of the members, it can be
9
found that a member force may exert a tension perpendicular to the grain force in the
joining member. Therefore this force needs to be accounted for in the design
software to ensure that no failures will occur.
2.3 Truss Joints
A joint in a timber roof truss is a node point at the intersection of two or more
members. Today, the most common connector is a multi-tooth plate, but they have
been constructed using many different methods since their conception. These could
be:
Overlapped and bolted/pinned (dowel type connectors)
Ply gussets
Metal gussets
The connection transfers the forces from each member back to the supporting
structure. Therefore, the timber used in the roof truss and each connector must be
able to withstand the applied forces to provide a satisfactory design.
Schoenmakers and Jorissen (2011) investigated the failure mechanisms of dowel-
type fastener connections perpendicular to the grain and found that the failure could
be either ductile or brittle. Under tensile stresses, cracking was the primary failure,
and this is also what is predicted to occur with the gang-nail plate.
They also found that many studies have been done that deal with the splitting of
timber in tension perpendicular; however, these have been limited to the dowel-type
connections. Many empirical and theoretical models have been reported.
The use of gusset type connectors assisted in the reduction of tension perpendicular
failure occurring, as generally the gusset covered the entire member with multiple
fasteners used. However, Todd and Turnbull (1970) found in their analysis of the
tensile strength of plywood gussets that the previous assumed theory of nailed ply
gussets (that were commonly used in the 1970’s for truss manufacture) was that the
nails simply parted the fibres of the timber, but didn’t reduce the strength. They
10
found in fact that when subjected to tensile forces, the nails did reduce the tensile
strength of the timber and the gusset.
When bolts or rivets are used, it was customary to account for the section area of the
material removed when performing the design. Greater care was also taken in
regards to the formulation of minimum edge distances to ensure that the forces could
be transferred around these fixings.
Regardless of the connection type used, tension perpendicular stresses will exist and
will need to be accounted for in the design.
2.4 Tension Perpendicular
The American Wood Council describes tension perpendicular to the grain as “the
evil of wood connections” (AWC, 2001). A tension perpendicular failure will often
lead to sudden catastrophic failures and should be avoided at all cost. However it is
not possible to always avoid it from occurring.
The strength to weight ratio of timber is relatively high when the load is applied
parallel to the grain, however it is considered weak when loaded perpendicular.
Under compression it will cause significant deformations and under tensile forces it
may result in a brittle failure (Jensen, 2012).
Many truss collapses around the world can be attributed to a tension perpendicular
failure. Burdzik wrote in his 2004 paper to the South African Institute of Civil
Engineering that, due to recent timber roof truss failures in South Africa of large
span trusses, a rethink about the analysis was required.
A tension perpendicular to the grain force occurs at the intersection of two members
where the butting member is acting under tension. A common place for this to occur
is at the intersection of the bottom chord of the truss and a vertical web, at an internal
support or in a half truss. These forces tear the fibres of the timber along the grain
(see Figure 2.2). The results of testing by Vahik Enjily (2001) in the performance of

11
trusses recommends that tension perpendicular to the grain failure in the vicinity of
joints must be considered during the design process
Figure 2.2 - Common Tension Perpendicular Failure (Enjily, 2001)
Soltis and Ritter (1996) in their paper wrote that “Eccentric loading is produced at
connections when the resultant member forces are offset at the connection.
Eccentricity in connections induces tension perpendicular to grain which can
severely reduce the capacity of the members. The strength of eccentric connections is
difficult to evaluate and connections of this type must be avoided unless tests are
employed in design to insure members can safely carry applied loads.”
It is not always possible to avoid a tension perpendicular force, so ways must be
found of adequately designing the truss joints to avoid a failure from occurring.
Beebe (2012), in her presentation Wood Design for Architects discussed the
importance of “Load Path Continuity” to help avoid a tension perpendicular failure.
This is best done by the use of suitable fasteners and avoiding drilling and notching
where possible.
Hansson (2011), in her paper to the Engineering Structures Journal regarding failures
(collapses) under high snow loads during the 2005/2006 winter in Germany and
12
Austria, found that joints were involved in 23% of the failures. Of this, 11% was
attributed to tension perpendicular to the grain and punched metal plates were
involved in 10% of these cases. Her recommendations were that the majority of these
could have been avoided if available knowledge had been utilised and that to
“include control of risk for perpendicular to the grain failure in design control
procedures” and that the “design of joints should be of high priority in timber
engineering research, education and Quality Assurance procedures”.
It must also be noted that the force may not be perpendicular to the grain but at an
angle to the grain. The effect of this on the timber is outside the scope of this project.
2.5 Standards
2.5.1 Australian Standards
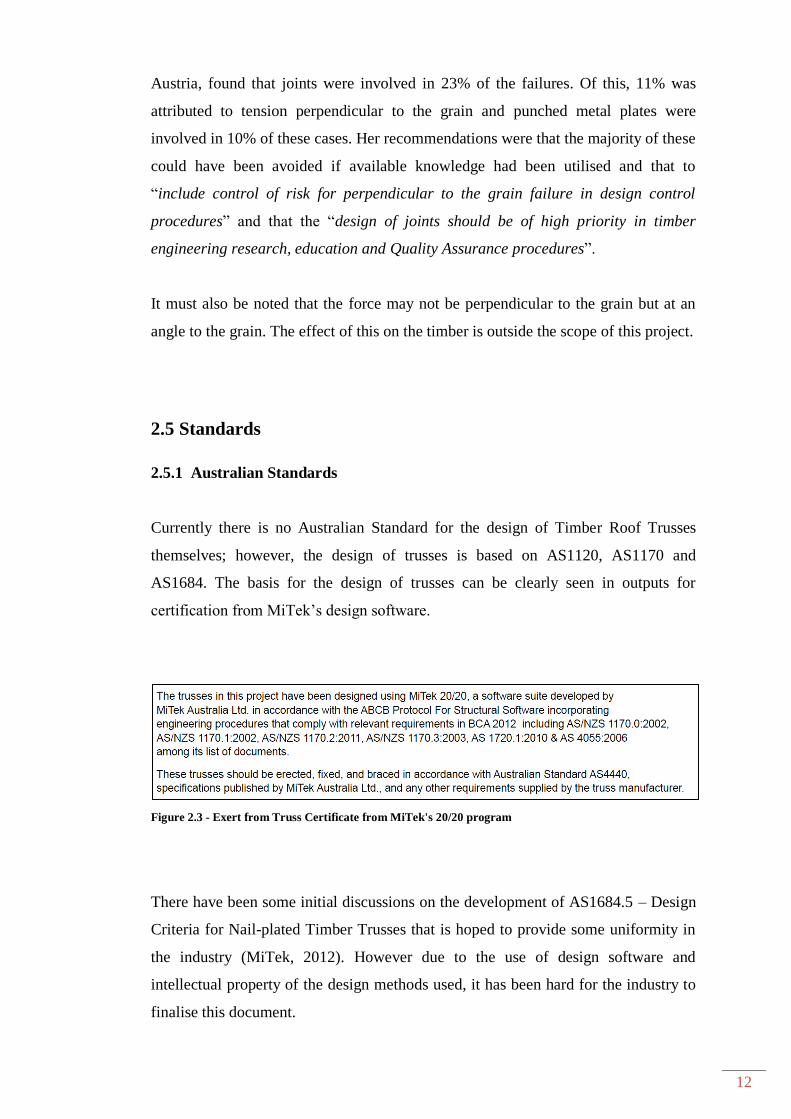
Currently there is no Australian Standard for the design of Timber Roof Trusses
themselves; however, the design of trusses is based on AS1120, AS1170 and
AS1684. The basis for the design of trusses can be clearly seen in outputs for
certification from MiTek’s design software.
Figure 2.3 - Exert from Truss Certificate from MiTek's 20/20 program
There have been some initial discussions on the development of AS1684.5 – Design
Criteria for Nail-plated Timber Trusses that is hoped to provide some uniformity in
the industry (MiTek, 2012). However due to the use of design software and
intellectual property of the design methods used, it has been hard for the industry to
finalise this document.

13
The BCA 2012 has introduced a new reference document called ABCB “Protocol for
Structural Software”. It refers to design software that is used by non-engineers like
truss detailers. To comply, the software must be based on the provisions of the BCA
and reference documents (Australian Standards) and its users must fully understand
any limitations of the package. Users must also be kept up to date with training in the
version of the software they wish to use (GN Guideline 177, MiTek, 2012).
2.5.2 International Standards
The Truss Plant Institutes of America and Canada provide the provisions for
designing joints allowing for Tension Perpendicular. Section 7.5.3 and 8.10 of
ANSI/TPI 1-2007 (American National Standard) discuss the required modifications.
Section 7.5.3.2.1 discusses the testing of 8x2 (200 x 50 mm) lumber loaded in
tension perpendicular to the grain using various bite depths and was found to have a
safe recommended concentration load of 800 lbs. (approx. 360 kg or 3.6 kN). After
this, the plate is required to extend past the centre line of the member. Through this
testing, the failure was attributed to a combination of tension across the grain and
horizontal shear.
Even our MiTek office in the United States allows for this in the designing of
trusses, even though the same basic software structure is used globally. MiTek US
state:
5. Plating for Tension Perpendicular to the Grain –
MiTek Engineering contains new calculations to determine the minimum
distance a connector plate must extend past the centreline of a member under
the following conditions:
The net tension force is perpendicular to the grain
The net tension force exceeds the allowable value of 400 set by TPI 2007
and the joint is less than 5x the depth from the end of the member OR
The net tension
14
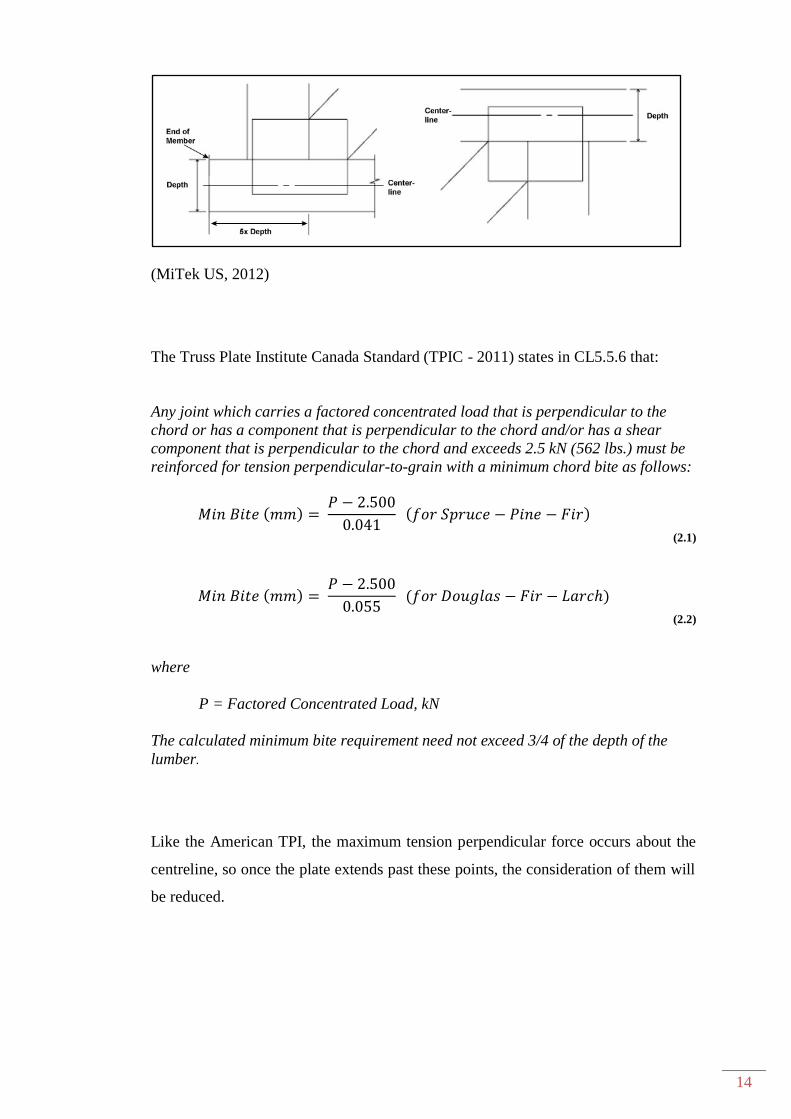
(MiTek US, 2012)
The Truss Plate Institute Canada Standard (TPIC - 2011) states in CL5.5.6 that:
Any joint which carries a factored concentrated load that is perpendicular to the
chord or has a component that is perpendicular to the chord and/or has a shear
component that is perpendicular to the chord and exceeds 2.5 kN (562 lbs.) must be
reinforced for tension perpendicular-to-grain with a minimum chord bite as follows:
( )
( )
(2.1)
( )
( )
(2.2)
where
P = Factored Concentrated Load, kN
The calculated minimum bite requirement need not exceed 3/4 of the depth of the
lumber.
Like the American TPI, the maximum tension perpendicular force occurs about the
centreline, so once the plate extends past these points, the consideration of them will
be reduced.
15
2.5.3 Current Plate and Software Suppliers
Within Australia, there are currently three different plate and design software
suppliers. These are MiTek, Multi-Nail and Pryda. While each nail plate serves the
same purpose in truss manufacture, each company manufactures their plates slightly
differently. This means that the way a joint is designed and functions within their
own design software packages will be different.
However, it is expected that if the metal strength and grip are satisfied for a joint
regardless of the plate supplier used, it could be expected that the tension
perpendicular failure for the same bite depth/width will be the same. The objective is
ultimately a timber failure in tension perpendicular to the grain below or at the
bottom edge of the plate. Therefore it could be reasonably expected that the results
found through this project and from further testing could be utilised in standard
design guidelines as an Australian Standard.
2.6 Current MiTek Method
The current MiTek method allows for an ultimate estimated failure loads as shown in
Table 2.1. These values have been determined using:
( )
(2.3)
Where:
k1 is the Duration of Load Factor
Ø is a capacity factor
ftp Tension Perpendicular to grain Characteristic Value
thk is the thickness of the truss
tp is the bite depth
w is the plate width
k11 is given by (
)
where V0 is 107
and:
( ) (2.4)
16
When computing these values in Table 2.1, the following constants have been used:
k1 0.57 (AS 1720.1-2010, Table 2.3)
Ø 0.9 (AS 1720.1-2010, Table 2.1)
ftp 0.5 MPa (AS 1720.1-2010, Table H3.1)
thk 35mm
tp range of 20, 40, 60 mm and 30, 50, 70 mm
w 75 and 125mm
k11 is given by (
) where V0 is 10
7
The value for Ntp from equation 2.3 is multiplied by a 3.5 safety factor in order to
find the ultimate failure load.
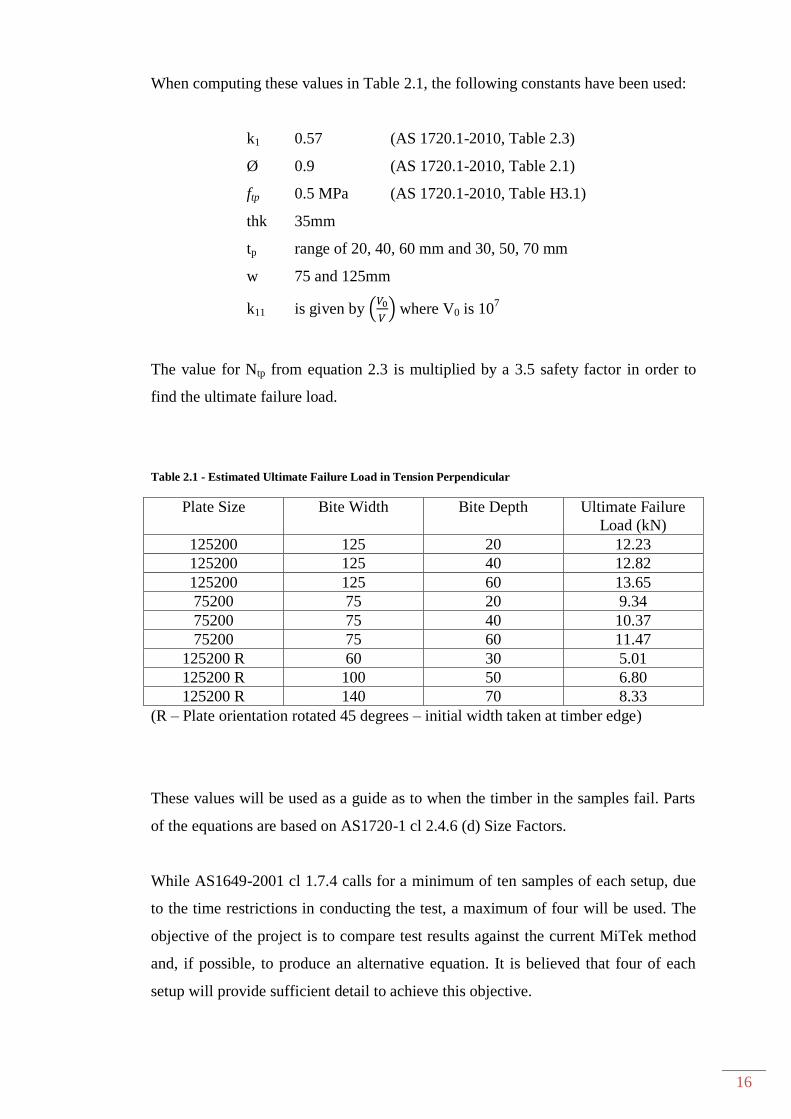
Table 2.1 - Estimated Ultimate Failure Load in Tension Perpendicular
Plate Size Bite Width Bite Depth Ultimate Failure
Load (kN)
125200 125 20 12.23
125200 125 40 12.82
125200 125 60 13.65
75200 75 20 9.34
75200 75 40 10.37
75200 75 60 11.47
125200 R 60 30 5.01
125200 R 100 50 6.80
125200 R 140 70 8.33
(R – Plate orientation rotated 45 degrees – initial width taken at timber edge)
These values will be used as a guide as to when the timber in the samples fail. Parts
of the equations are based on AS1720-1 cl 2.4.6 (d) Size Factors.
While AS1649-2001 cl 1.7.4 calls for a minimum of ten samples of each setup, due
to the time restrictions in conducting the test, a maximum of four will be used. The
objective of the project is to compare test results against the current MiTek method
and, if possible, to produce an alternative equation. It is believed that four of each
setup will provide sufficient detail to achieve this objective.

17
Chapter 3 Materials and Methods
3.1 Introduction
In order to find when tension perpendicular occurs in a truss member, testing will be
conducted on specimens plated in a T configuration. The objective is to achieve a
tension perpendicular failure in the timber, so any other possible failures need to be
eliminated. The other failures that can occur in this configuration include:
Metal failure of the gang-nail plate
Plate withdrawal (gang-nail plate teeth withdrawing from the members)
Tension parallel in non-test member
.
3.2 Materials
3.2.1 Timber
The timber that is being used for the testing is Australian Radiata Pine sourced from
Hyne and Son Pty Ltd from their saw mill at Tumbarumba in New South Wales.
Radiata Pine would be the most common material used in the manufacture of trusses
in varying stress grades from MGP 10, 12 and 15. The most common sizes used are
90x35 mm for the chords and 70x35 mm for webs, however heavily loaded trusses
and special shapes may utilise larger end sections.
For the purpose of this study, 140x35 mm MGP10 has been used as it is a common
member in trusses that support the heavier loads that will be exposed to the higher
internal forces. The material supplied has been treated using a T2 treatment,
however, this will have no effect on the performance of the material during the
testing.
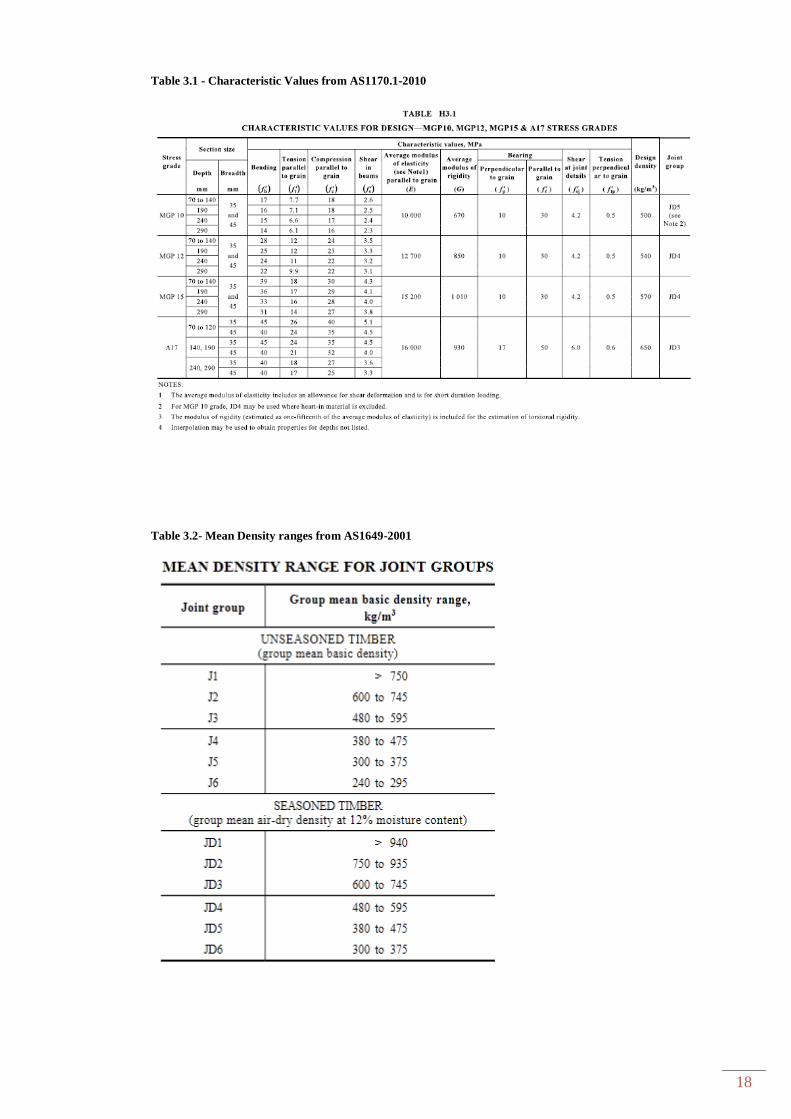
Generic timber properties are available in AS1170.1 and AS1649 (Table 3.1 and 3.2
below). The densities of the materials used in the specimens will need to be verified
against these properties to ensure that they conform to the standard. The verification
of the grade and characteristic values of the material is outside the scope of this
project.
18
Table 3.1 - Characteristic Values from AS1170.1-2010
Table 3.2- Mean Density ranges from AS1649-2001
19
In accordance with AS1649 cl 1.6.1, it has been assumed that the timber supplied
from a commercial supplier is compliant with the standard moisture contents for dry
timber. The material was supplied in a standard pack as it would be to any truss
manufacturer. This material was transported with the cover as installed by the
supplier and kept inside buildings/sheds during every process to keep the moisture
content constant.
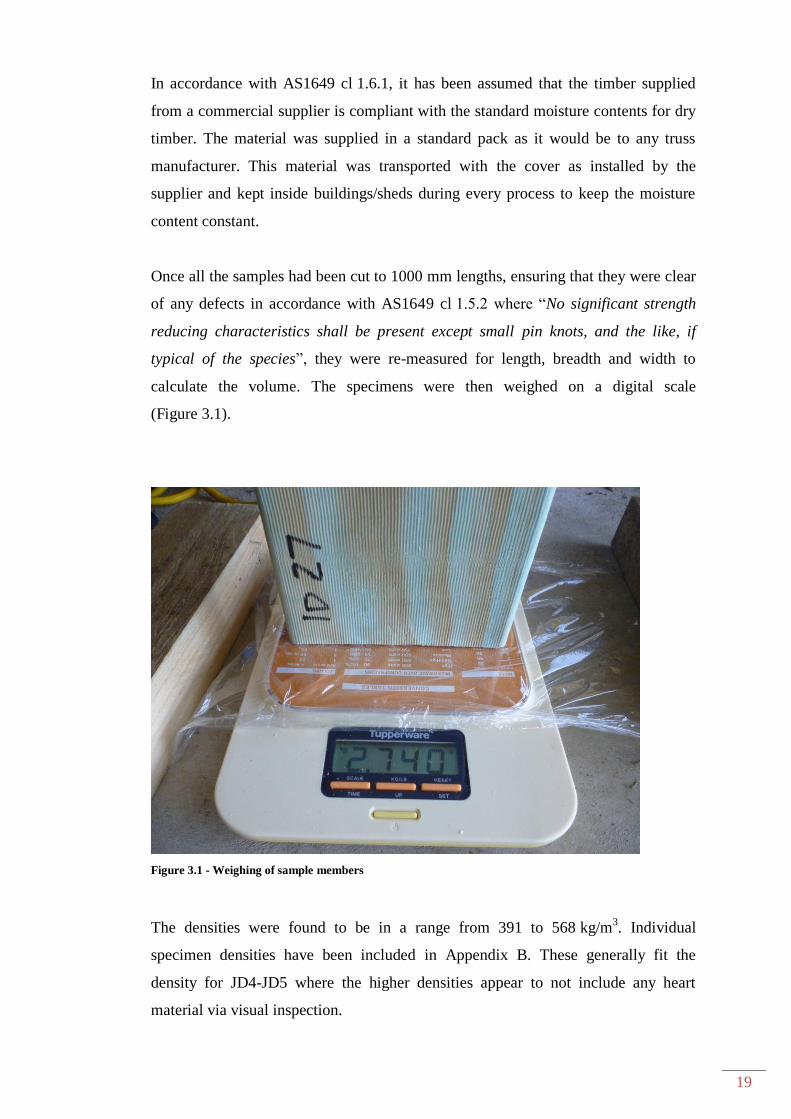
Once all the samples had been cut to 1000 mm lengths, ensuring that they were clear
of any defects in accordance with AS1649 cl 1.5.2 where “No significant strength
reducing characteristics shall be present except small pin knots, and the like, if
typical of the species”, they were re-measured for length, breadth and width to
calculate the volume. The specimens were then weighed on a digital scale
(Figure 3.1).
Figure 3.1 - Weighing of sample members
The densities were found to be in a range from 391 to 568 kg/m3. Individual
specimen densities have been included in Appendix B. These generally fit the
density for JD4-JD5 where the higher densities appear to not include any heart
material via visual inspection.
20
3.2.2 Gang-Nail Plates
Gang-nail connector plates are a punched steel plate where teeth (or spikes) are
formed during the punching process. There is not one single plate that produces the
optimum solution in all situations, so the plates are available in a wide range of sizes
and MiTek supply three different steel grades. These are:
GQ – 20 Gauge (1.0 mm thick)
GE – 18 Gauge (1.2 mm thick)
GS – 16 Gauge (1.6 mm thick)
The steel used in the manufacture of the gang-nail plates is galvanised coil to
AS1397, with a zinc coating to Z275 (MiTek, 2012)
Since the testing is to find the failure force perpendicular to the grain, no steel failure
can occur. The shear force that the plate can resist is given by:
(4.2)
Where:
Qs is the Connector Plate Strength in N/mm for steel (Table 3.3)
Ø is a capacity factor (0.9)
Shear Length is the plate width of 75 and 125 mm respectively.
Table 3.3 - Characteristic Capacity for Steel Qs
Type of Stress GQ GE GS
Longitudinal
Tension
263 387 578
Lateral Tension 187 226 272
Longitudinal Shear 197 297 408
Lateral Shear 178 215 323
Note: Longitudinal axis is parallel with the slots
MiTek, 2012

21
As the slots will be perpendicular to the sample piece, the lateral shear values will be
used. The two plate widths selected to give a range of values are 75 mm and
125 mm. The design capacities are shown below in Table 3.4.
Table 3.4 - Design Shear Capacity – value in kN
Plate Size GQ GE GS
75x200 12.015 14.512 21.802
125x200 20.025 24.197 36.337
NOTE: These are design capacities not Ultimate Failure Capacities
As the above values are design capacities and our testing will provide an ultimate
failure load, we can apply a value of 1.5 times the design capacities to check that the
ultimate capacity will be satisfied. Using GE plates in the selected sizes, the ultimate
failure loads for 75 mm and 125 mm widths will be 21.8 kN and 36.3 kN
respectively. These forces can be applied without a metal failure occurring, which is
greater than the predicted tension perpendicular failure expected as discussed in
Section 2.6.
By using a plate that is 200 mm long and only relatively short bite depths, the
additional length in the plate will restrict a tension parallel failure in the non-test
vertical member by providing sufficient bite.
There is a concern that plate withdrawal may occur as the bite reduces, which was
discussed with Robert Tan prior to the testing. If this does occur during the testing of
the first specimen of each setup, 12 mm ply will be clamped over the plate in order
to restrict plate withdrawal, but without exerting sufficient pressure of the plate over
the specimen that will interfere with the test procedure.

22
3.3 Manufacture of Samples
The test piece was calculated at needing to be a minimum of 700 mm to allow for a
sufficient span for a tension perpendicular failure to occur. This was calculated based
on the use of 140x35 mm timber for both the test piece and the vertical member.
AS1649-2001 cl 2.2.6.1 (ii) states that for a perpendicular type test (Figure 3.2), the
length of the specimen is to be not less than 450 mm or 5a where a is the plate
width. Therefore the minimum length of the actual sample can be 625 mm and the
distance between the supports is to be 3w3 where w3 is the width of the vertical
member (420 mm).
Figure 3.2 - Tension Perpendicular test as per AS1649
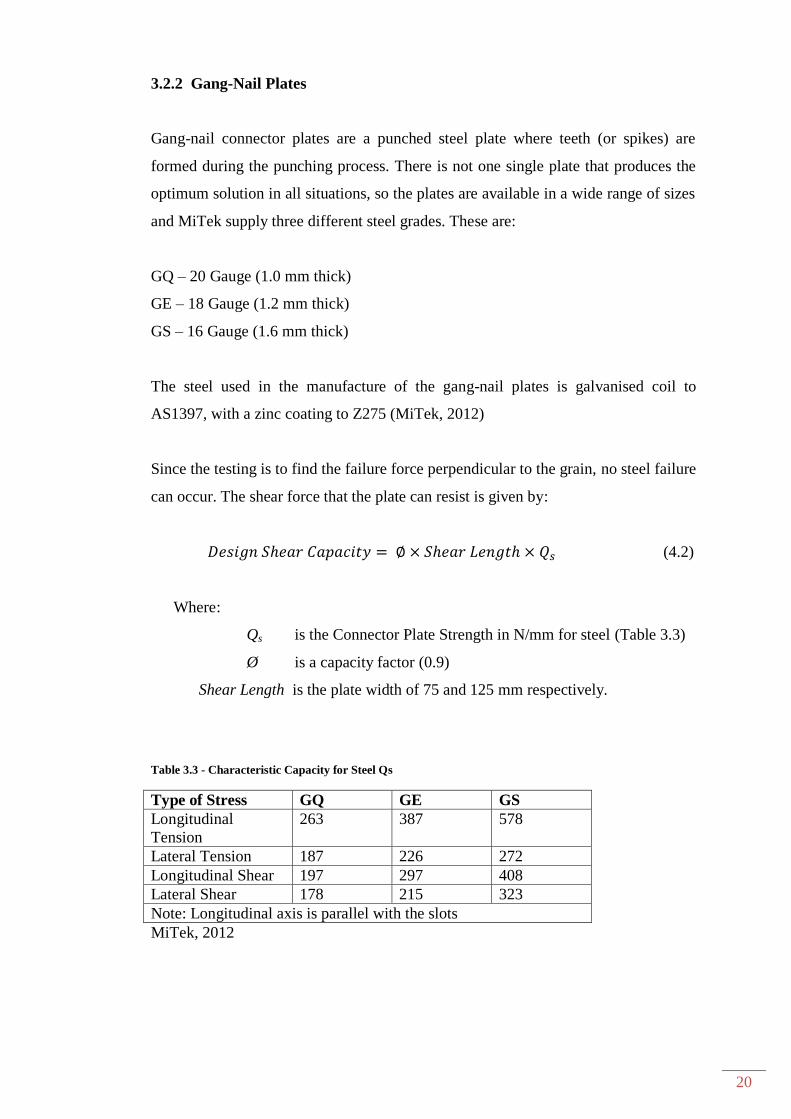
However, due to the over straps in the test accessories, it can be assumed that the
straps will provide support to the timber and a tension perpendicular failure will not
occur in the 45 degree triangle from this point (Figure 3.3). Therefore the length
between the supports will be taken as 5w which will be 700 mm.
23
Figure 3.3 - Tension Perpendicular is assumed to not occur in the 45 degrees from straps
The height will also be governed at maximum 700 mm due to height restriction on
the Avery Testing Machine.
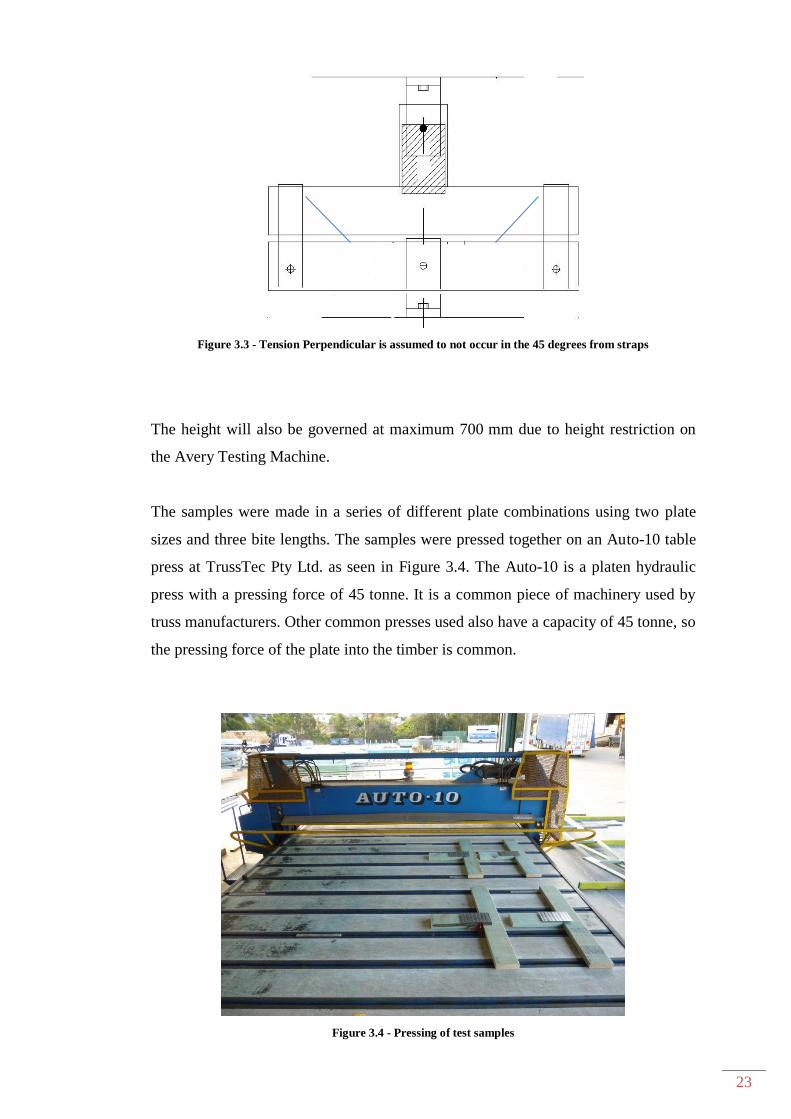
The samples were made in a series of different plate combinations using two plate
sizes and three bite lengths. The samples were pressed together on an Auto-10 table
press at TrussTec Pty Ltd. as seen in Figure 3.4. The Auto-10 is a platen hydraulic
press with a pressing force of 45 tonne. It is a common piece of machinery used by
truss manufacturers. Other common presses used also have a capacity of 45 tonne, so
the pressing force of the plate into the timber is common.
Figure 3.4 - Pressing of test samples

24
During the pressing of the first sample using the 125200 plate with 20 mm bite, it
was observed that the pressing process caused cracking of the timber within the
expected tension perpendicular area (Figure 3.5). This caused an immediate
recalculation of the samples that would be used, as any failure during the pressing
would give a false failure during the tests.
Figure 3.5 - Failure within plate area during pressing at 20 mm bite
25
A second sample was pressed using a 25 mm bite and no cracking was observed. The
remaining samples with a 25 mm bite were pressed with no further pressing issues.
Therefore, to ensure that the step in bite distances were consistent, the bites were
finally pressed at 25, 45 and 65 mm for the 75200 and 125200 plates.
Similar issues were encountered during the manufacture of the 45 degree rotated
plates. Both at 20 mm and 25 mm, failure occurred due to the small bite area.
Trialling 5mm increases; it was found that no timber failure occurred at 30 mm, so
30, 50, 70 mm bite depths were adopted for this orientation.
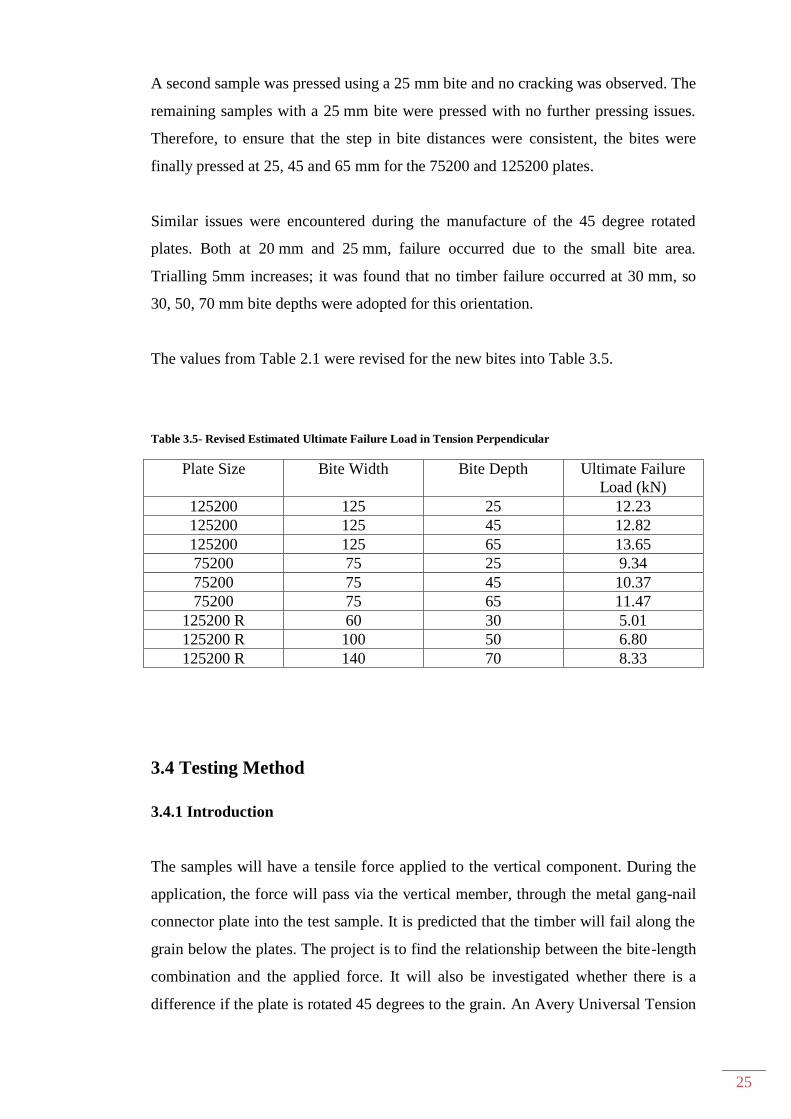
The values from Table 2.1 were revised for the new bites into Table 3.5.
Table 3.5- Revised Estimated Ultimate Failure Load in Tension Perpendicular
Plate Size Bite Width Bite Depth Ultimate Failure
Load (kN)
125200 125 25 12.23
125200 125 45 12.82
125200 125 65 13.65
75200 75 25 9.34
75200 75 45 10.37
75200 75 65 11.47
125200 R 60 30 5.01
125200 R 100 50 6.80
125200 R 140 70 8.33
3.4 Testing Method
3.4.1 Introduction
The samples will have a tensile force applied to the vertical component. During the
application, the force will pass via the vertical member, through the metal gang-nail
connector plate into the test sample. It is predicted that the timber will fail along the
grain below the plates. The project is to find the relationship between the bite-length
combination and the applied force. It will also be investigated whether there is a
difference if the plate is rotated 45 degrees to the grain. An Avery Universal Tension
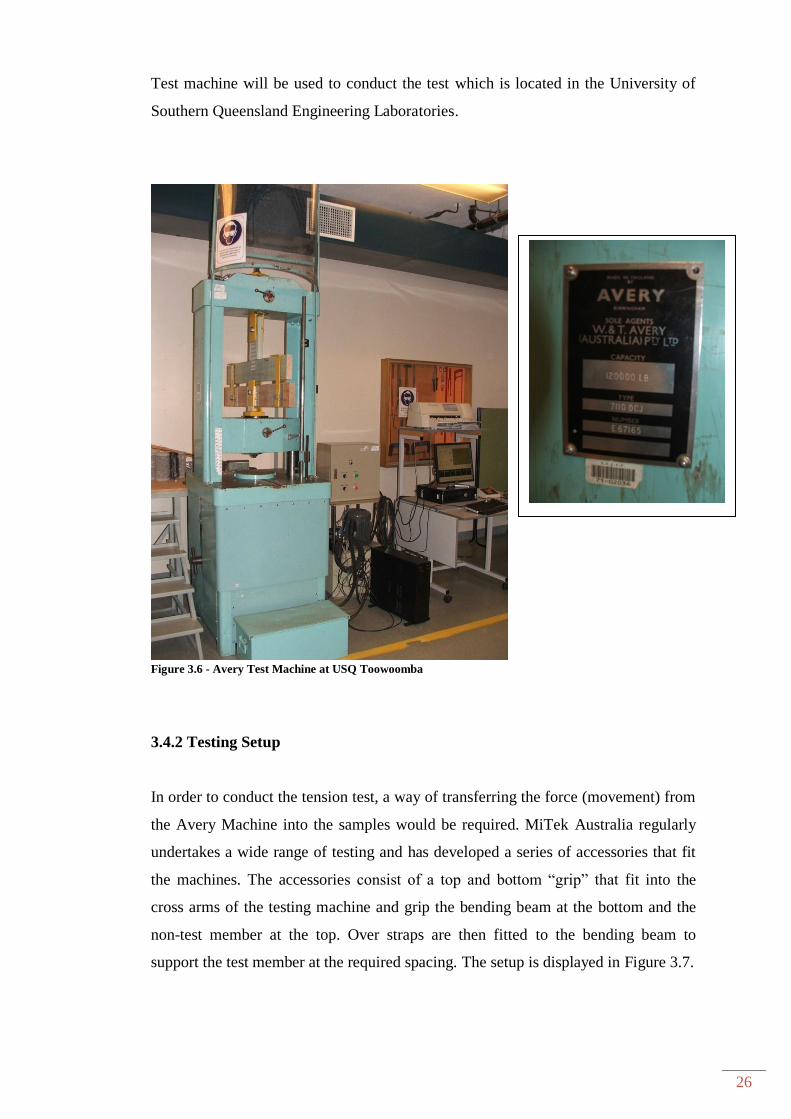
26
Test machine will be used to conduct the test which is located in the University of
Southern Queensland Engineering Laboratories.
Figure 3.6 - Avery Test Machine at USQ Toowoomba
3.4.2 Testing Setup
In order to conduct the tension test, a way of transferring the force (movement) from
the Avery Machine into the samples would be required. MiTek Australia regularly
undertakes a wide range of testing and has developed a series of accessories that fit
the machines. The accessories consist of a top and bottom “grip” that fit into the
cross arms of the testing machine and grip the bending beam at the bottom and the
non-test member at the top. Over straps are then fitted to the bending beam to
support the test member at the required spacing. The setup is displayed in Figure 3.7.
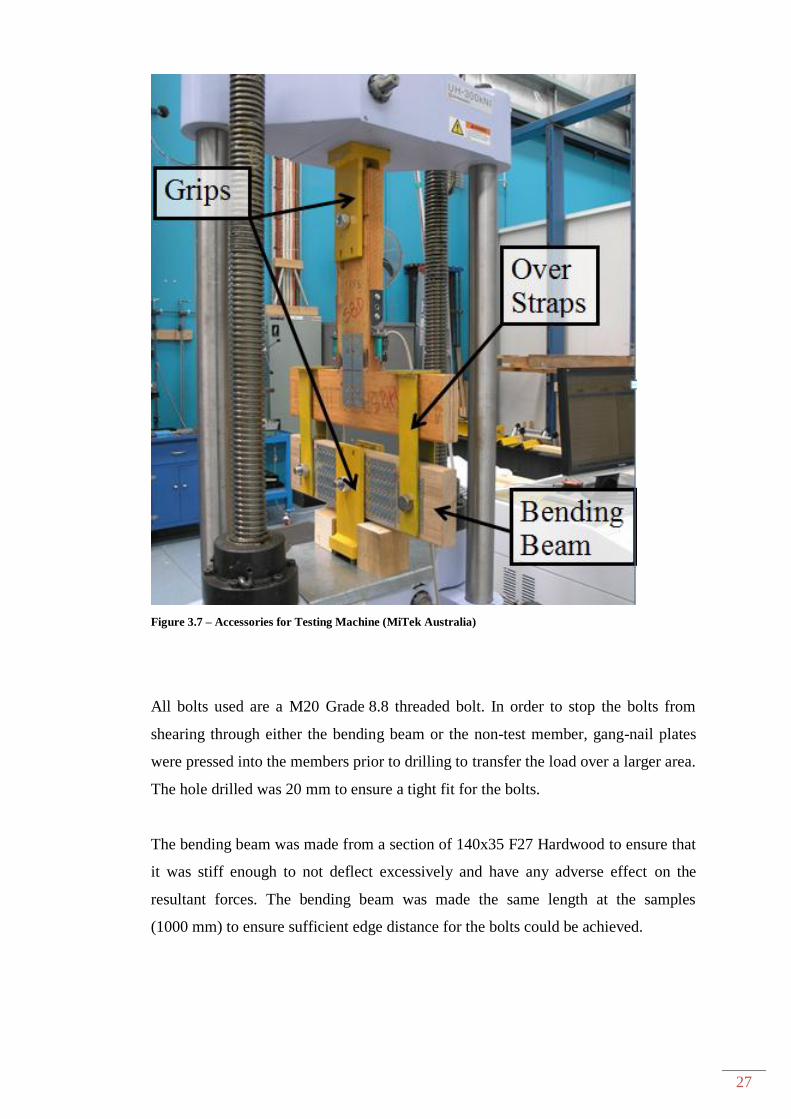
27
Figure 3.7 – Accessories for Testing Machine (MiTek Australia)
All bolts used are a M20 Grade 8.8 threaded bolt. In order to stop the bolts from
shearing through either the bending beam or the non-test member, gang-nail plates
were pressed into the members prior to drilling to transfer the load over a larger area.
The hole drilled was 20 mm to ensure a tight fit for the bolts.
The bending beam was made from a section of 140x35 F27 Hardwood to ensure that
it was stiff enough to not deflect excessively and have any adverse effect on the
resultant forces. The bending beam was made the same length at the samples
(1000 mm) to ensure sufficient edge distance for the bolts could be achieved.

28
3.4.3 Testing Procedure
Apart from the minimum number of samples required for testing, all tests were
conducted in accordance with AS1649-2001 Timber—Methods of test for
mechanical fasteners and connectors—Basic working loads and characteristic
strengths.
As each new sample was loaded into the test rig, the bolt of the top bolt into the
cross arms was tightened until the point where there was a slight force applied – just
enough to hold the sample in place. The sample member was then checked that it
was horizontal and the load was then applied at a rate of 1.3 mm per minute in
accordance with AS 1649 cl 2.2.6.1.
Using the software attached to the testing machine (Figure 3.8), the applied force in
kN was measured every 0.4 seconds and saved into a text file. The maximum force
at failure point was recorded as the Ultimate Failure Load (UFL). The UFL and
method of failure will be recorded and photographed
Figure 3.8 - Avery Test Machine Software during a test

29
3.5 Health and Safety
Taking proper precautions during the manufacture and testing of the samples was
important for my safety and those assisting me and also to protect the property of the
building and equipment. The equipment used ranged from general handyman tools
like drops saws and drill presses through to commercial hydraulic presses that are
used for the manufacture of timber roof trusses. For testing, an Avery Tensile Test
machine was used. Therefore, risk assessments (refer Appendix G) were conducted
for each step of the manufacture and testing procedures to minimise the impact on
health and safety.
With previous training in all truss manufacturing equipment, a site induction with Mr
Shane Moore was all that was required before I could operate the Auto-10 table press
at TrussTec Pty Ltd. Training was provided by Mr Mohan Trada on the Avery
machine at the University of Southern Queensland prior to the tensile tests being
conducted.
During all stages of the manufacture and testing, Personal Protective Equipment
(PPE) was worn in accordance with the risk assessment.
30
Chapter 4 Experimental Results and Observations
4.1 Introduction
During the conduction of the tests, records were kept in regards to the sample
number (ID), what its plate orientation was, and the order that the test was
conducted. As the sample failed, the Ultimate Failure Force was noted along with the
visual appearance of the failure and anything that occurred during the test. The data
collected via the Avery Test Machine is included in Appendix C.1 with a sample
individual report in Appendix C.2. Full data is attached to the supplementary file.
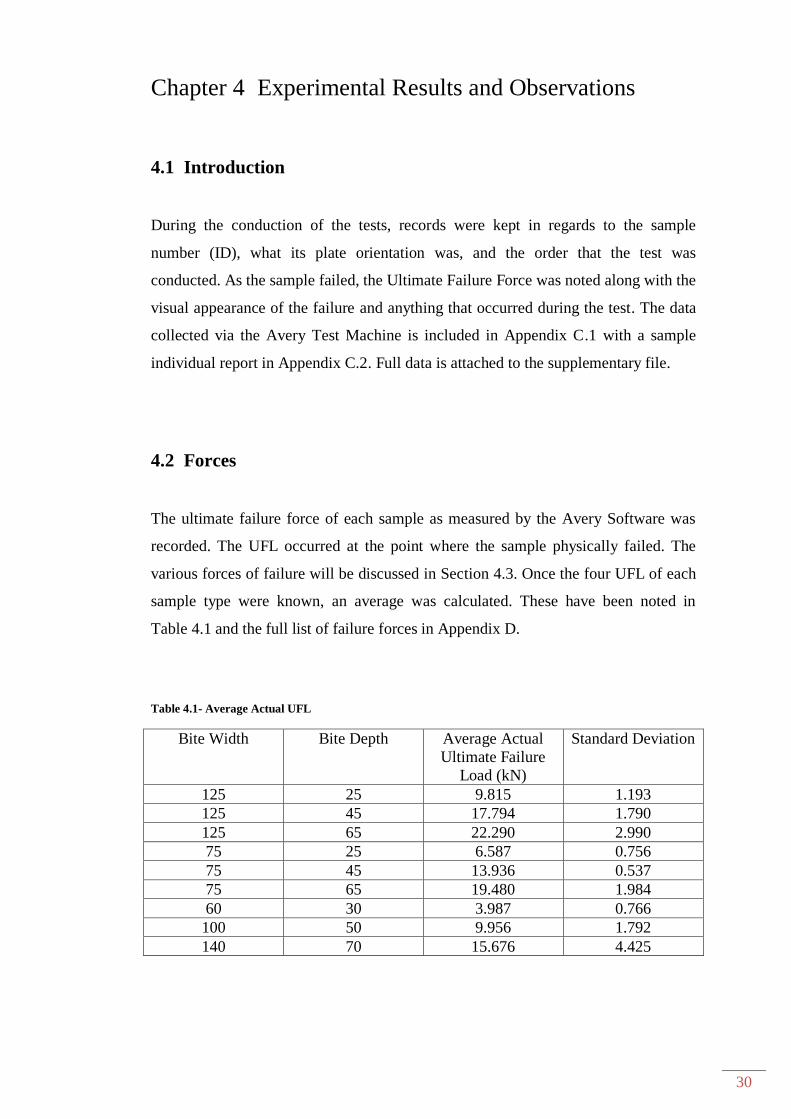
4.2 Forces
The ultimate failure force of each sample as measured by the Avery Software was
recorded. The UFL occurred at the point where the sample physically failed. The
various forces of failure will be discussed in Section 4.3. Once the four UFL of each
sample type were known, an average was calculated. These have been noted in
Table 4.1 and the full list of failure forces in Appendix D.
Table 4.1- Average Actual UFL
Bite Width Bite Depth Average Actual
Ultimate Failure
Load (kN)
Standard Deviation
125 25 9.815 1.193
125 45 17.794 1.790
125 65 22.290 2.990
75 25 6.587 0.756
75 45 13.936 0.537
75 65 19.480 1.984
60 30 3.987 0.766
100 50 9.956 1.792
140 70 15.676 4.425
31
4.3 Failure Mechanisms
4.3.1 125 mm Width Range
When using the 125 mm wide plate, all bite depths experienced a major tension
perpendicular failure where the sample member fully fractured. After the first few
tests, it was noted that even though a major failure occurred, the samples only broke
into two parts. No pieces from the samples left the testing area that could have
resulted in damage or injury. Once this was observed, closer inspections during the
test cycle were possible, however a small distance was still kept from the samples
and appropriate protective equipment was worn at all times.
There were no visible signs of plate withdrawal occurring during the testing and this
was monitored closely. It was noted that after the failure, some plate withdrawal had
occurred, however this was put down to have occurred during the failure.
For the 65mm bite depth, all four samples fractured at the bottom row of connector
teeth with the fracture following the grain of the timber from end to end. It was also
notes that audible cracking noises were heard at approximately 10 kN for ID12 and
18 kN for ID10 however at the time there were not visible cracks appearing.
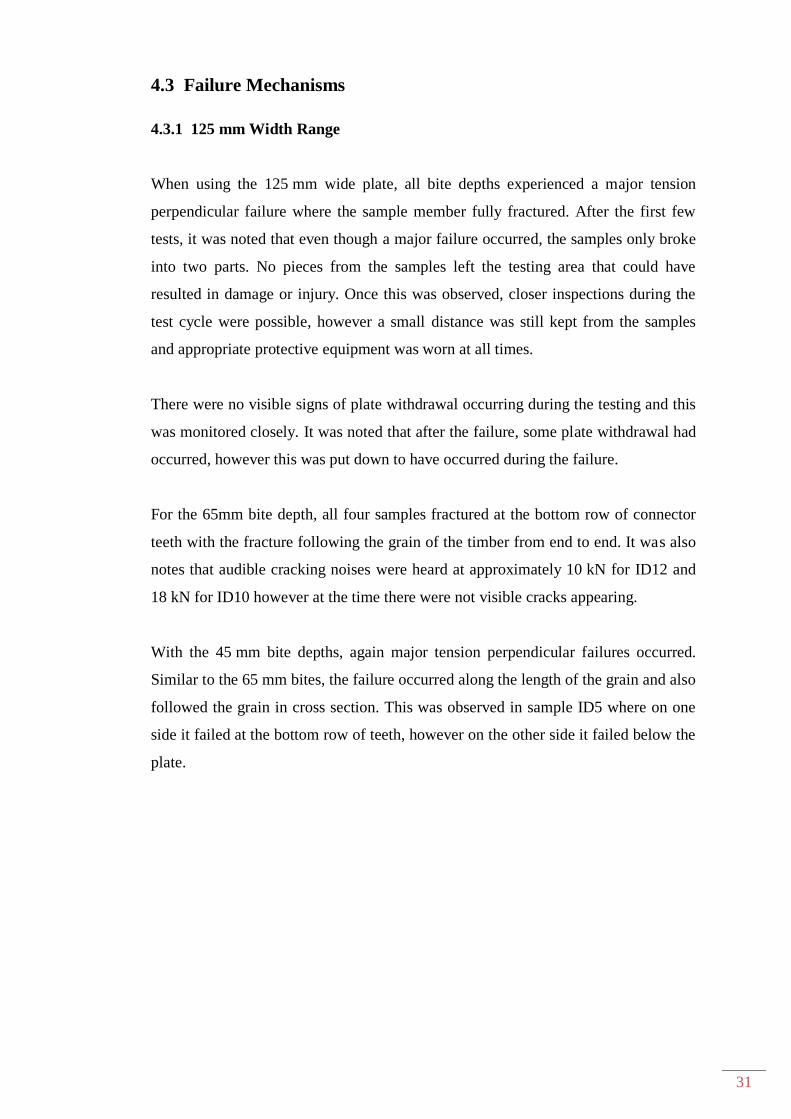
With the 45 mm bite depths, again major tension perpendicular failures occurred.
Similar to the 65 mm bites, the failure occurred along the length of the grain and also
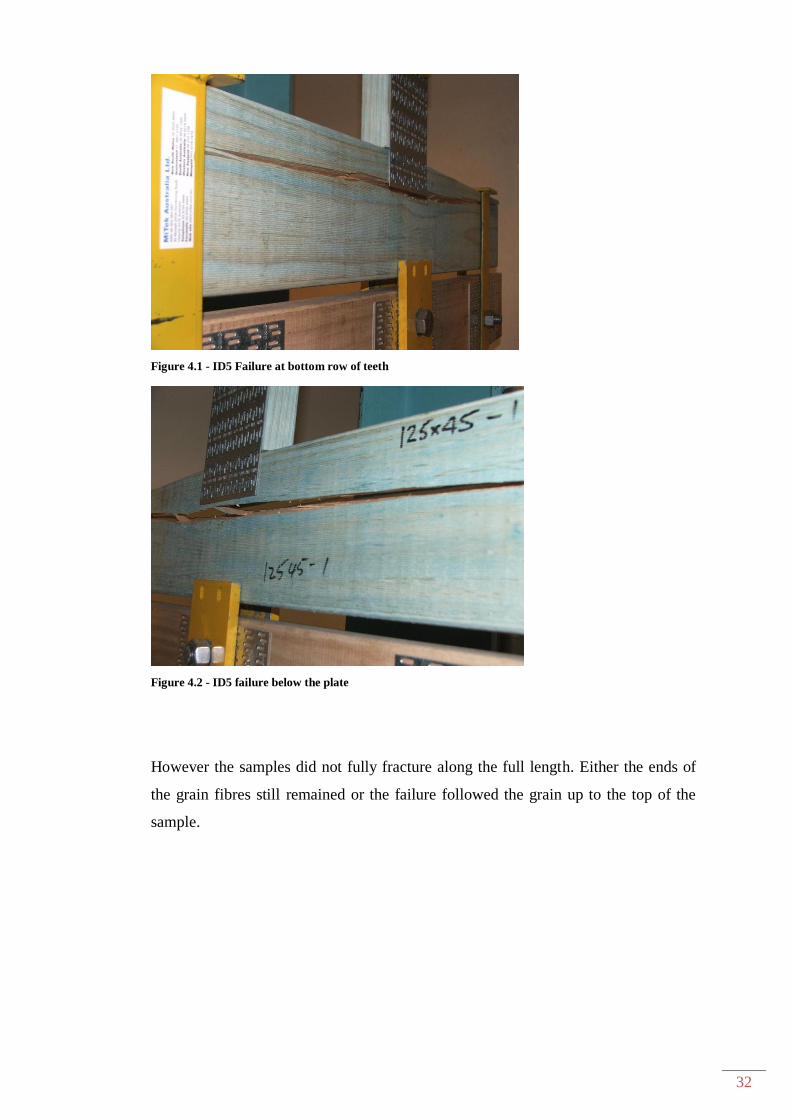
followed the grain in cross section. This was observed in sample ID5 where on one
side it failed at the bottom row of teeth, however on the other side it failed below the
plate.
32
Figure 4.1 - ID5 Failure at bottom row of teeth
Figure 4.2 - ID5 failure below the plate
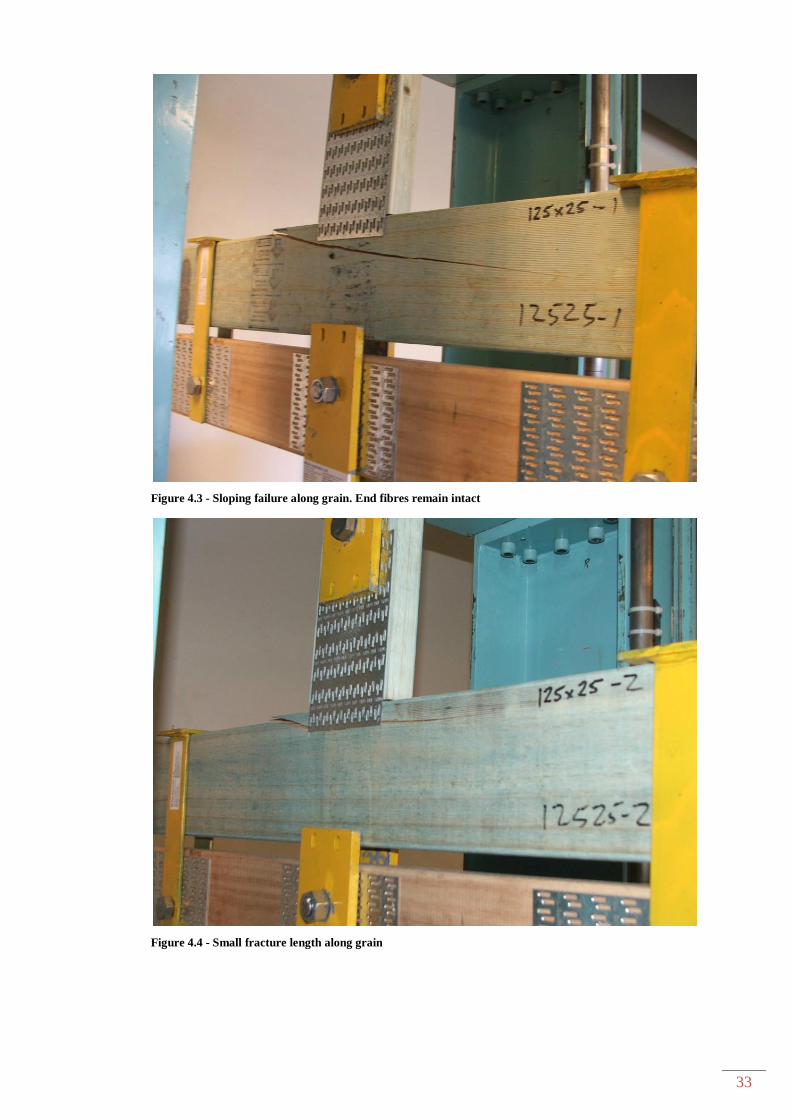
However the samples did not fully fracture along the full length. Either the ends of
the grain fibres still remained or the failure followed the grain up to the top of the
sample.
33
Figure 4.3 - Sloping failure along grain. End fibres remain intact
Figure 4.4 - Small fracture length along grain

34
When testing the 25 mm bite depths, the initial concern that plate withdrawal may
occur was eliminated. No withdrawal occurred on any of the four samples. The
failures were not as significant as the larger bites. Generally they only fractured a
few hundred millimetres either side of the vertical non-test member. Depth of failure
varied from test 1 which failed well below the plate along the timber grain, to failing
at the bottom edge of the teeth similar to the larger bite depths.
Sample ID1 (Figure 4.5) only produced a minor failure with fibre separation for
100 mm either side of the vertical member. The timber also failed laterally which
gave the effect of plate withdrawal, however closer observation saw that the teeth
were still fully embedded into the timber and it was the timber itself pushing
outwards (Figure 4.6).
Figure 4.5 - ID1 with failure 100 mm either side of plate

35
Figure 4.6 - Timber fibres failure laterally with appearing like plate withdrawal
4.3.2 75 mm Width Range
Using the second plate width of 75 mm again all depths did produce a tension
perpendicular failure. Similarly to the wider 125 mm plate, the larger the depth, the
greater the effect of the failure.
With a bite of 65 mm, major failures were produced in all four samples. All failed
along the bottom row of teeth and followed the grain of the timber (Figure 4.7),
including around timber knots that were outside the test region (Figure 4.8).

36
Figure 4.7 - Fracture follows grain in cross section
Figure 4.8 - Fractures following grain around knots and other defects
37
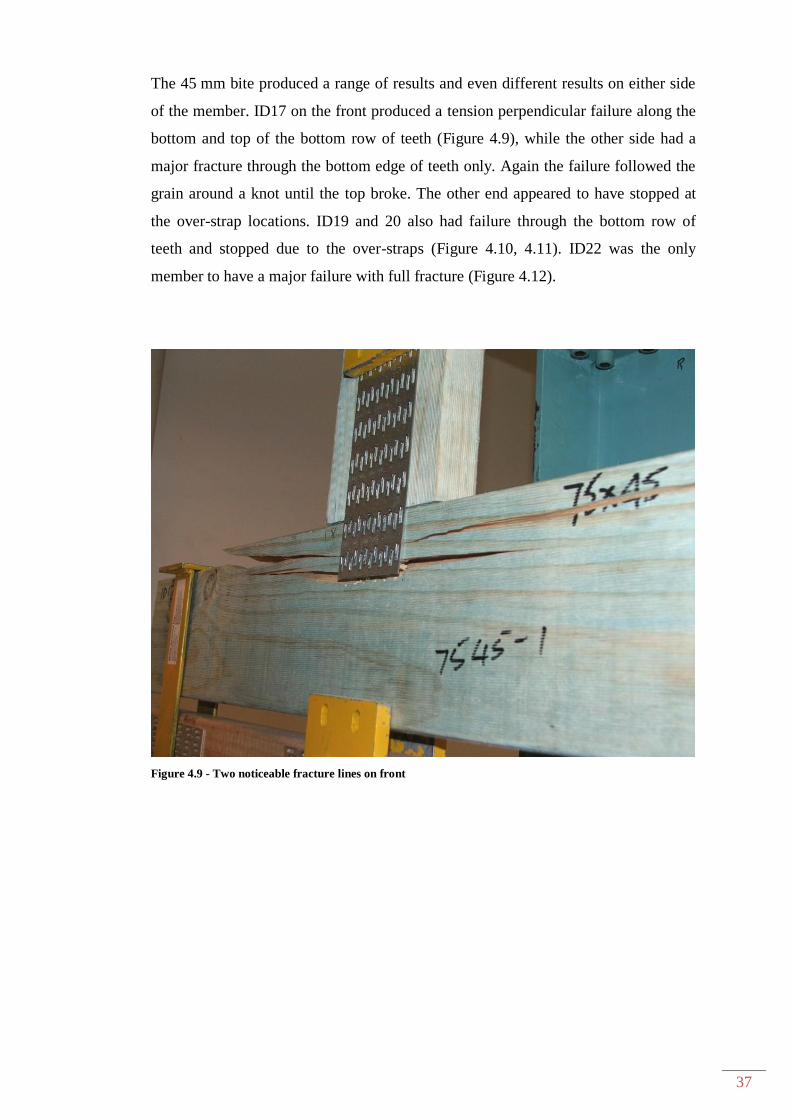
The 45 mm bite produced a range of results and even different results on either side
of the member. ID17 on the front produced a tension perpendicular failure along the
bottom and top of the bottom row of teeth (Figure 4.9), while the other side had a
major fracture through the bottom edge of teeth only. Again the failure followed the
grain around a knot until the top broke. The other end appeared to have stopped at
the over-strap locations. ID19 and 20 also had failure through the bottom row of
teeth and stopped due to the over-straps (Figure 4.10, 4.11). ID22 was the only
member to have a major failure with full fracture (Figure 4.12).
Figure 4.9 - Two noticeable fracture lines on front

38
Figure 4.10 – Tension perpendicular failure restricted by support from over straps
Figure 4.11 - Possible fracture restricted by over straps
39
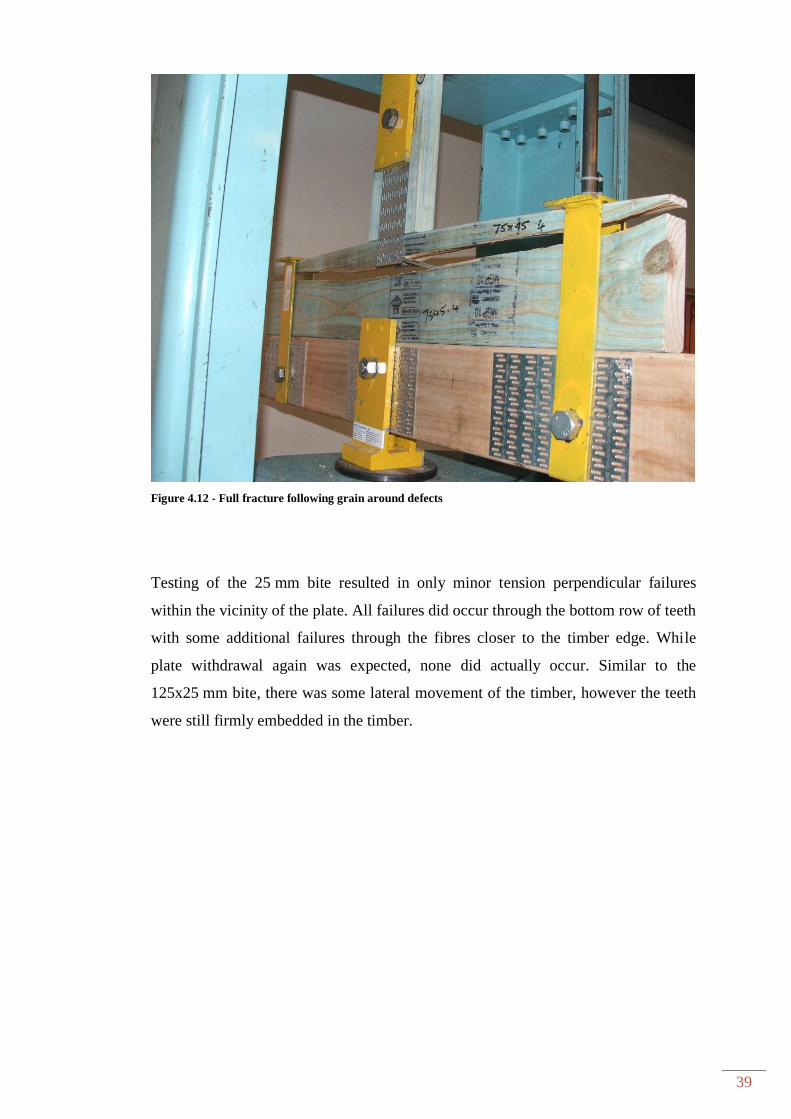
Figure 4.12 - Full fracture following grain around defects
Testing of the 25 mm bite resulted in only minor tension perpendicular failures
within the vicinity of the plate. All failures did occur through the bottom row of teeth
with some additional failures through the fibres closer to the timber edge. While
plate withdrawal again was expected, none did actually occur. Similar to the
125x25 mm bite, there was some lateral movement of the timber, however the teeth
were still firmly embedded in the timber.
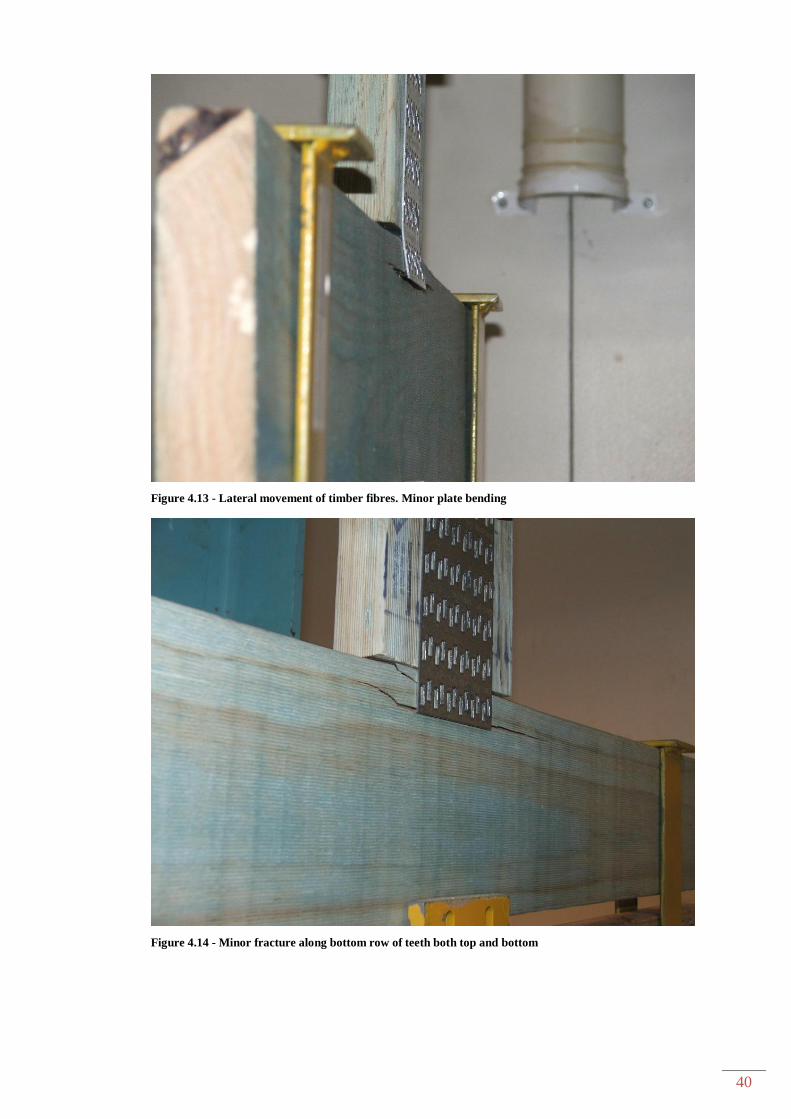
40
Figure 4.13 - Lateral movement of timber fibres. Minor plate bending
Figure 4.14 - Minor fracture along bottom row of teeth both top and bottom

41
4.3.3 Rotated at 45 degrees Range
Testing of the plates rotated at 45 degrees to the test sample produced some varying
results. While the largest depth of 70 mm produced similar failures to the square
plates, the smaller bite depths were greatly reduced.
With a bite of 70 mm, small cracks began to appear at forces between 8 and 10 kN
(Figure 4.15). This didn’t have a significant reduction in the rate the force was
applied. The final failure also varied from a major failure, with fracture within the
bottom 15mm of the plate that followed the grain of the timber, to several failure
lines at varying depths within the plate area (Figure 4.16). It was also noted that
ID33 developed cracking within the bottom quarter of the member (i.e. within the
area of the sample that would have been under compression) (Figure 4.17).
Figure 4.15 - Small crack appeared as dark lines at 8 - 10 kN

42
Figure 4.16 - Final failure at varying depths
Figure 4.17 - Cracks appeared in area that was under compressive forces - bottom 1/4 of member
43
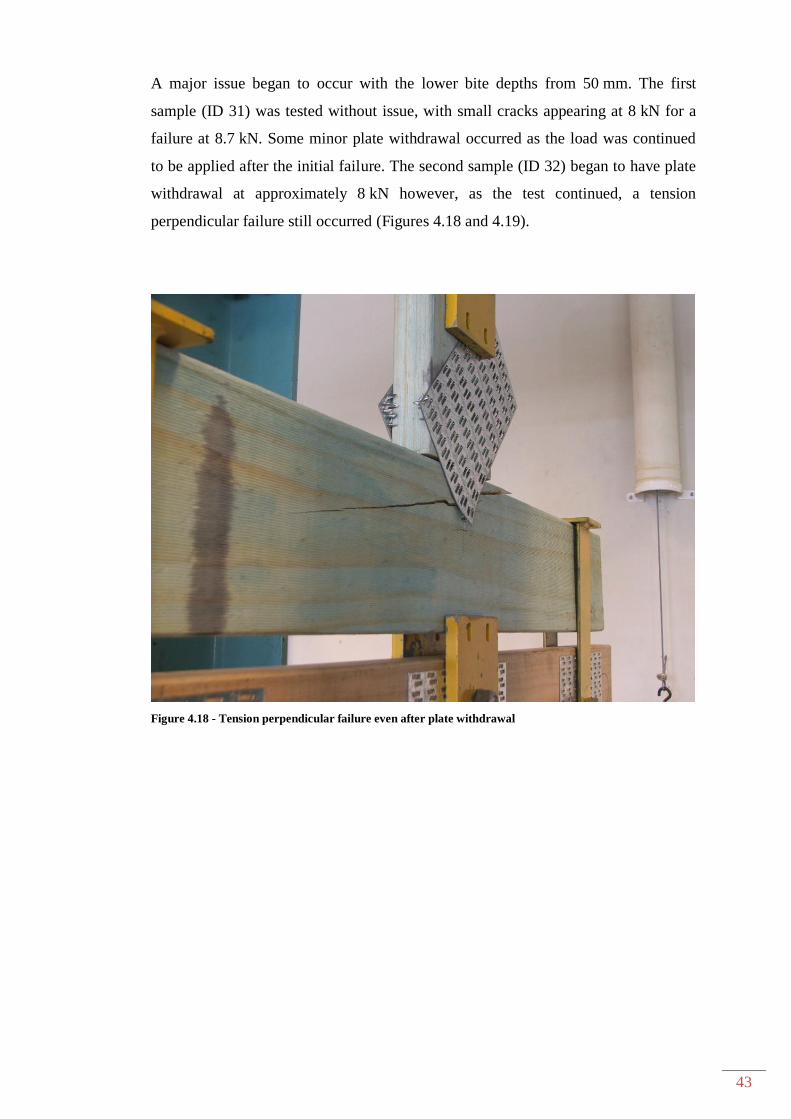
A major issue began to occur with the lower bite depths from 50 mm. The first
sample (ID 31) was tested without issue, with small cracks appearing at 8 kN for a
failure at 8.7 kN. Some minor plate withdrawal occurred as the load was continued
to be applied after the initial failure. The second sample (ID 32) began to have plate
withdrawal at approximately 8 kN however, as the test continued, a tension
perpendicular failure still occurred (Figures 4.18 and 4.19).
Figure 4.18 - Tension perpendicular failure even after plate withdrawal
44
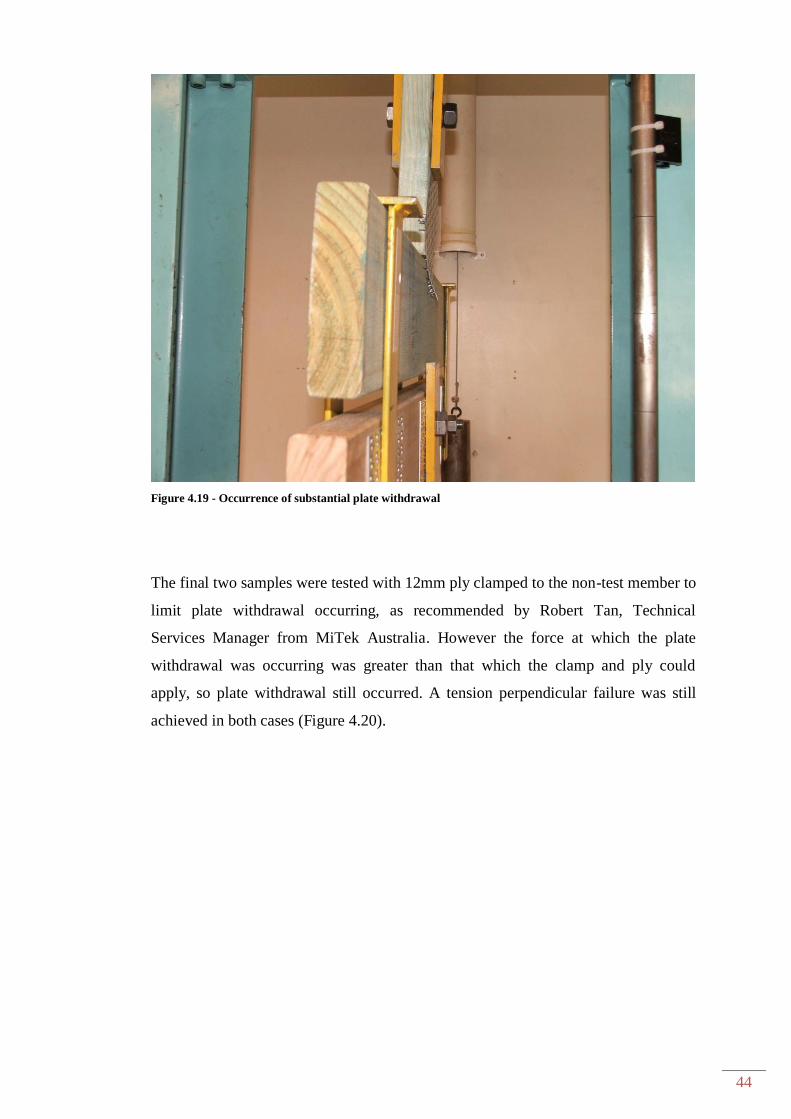
Figure 4.19 - Occurrence of substantial plate withdrawal
The final two samples were tested with 12mm ply clamped to the non-test member to
limit plate withdrawal occurring, as recommended by Robert Tan, Technical
Services Manager from MiTek Australia. However the force at which the plate
withdrawal was occurring was greater than that which the clamp and ply could
apply, so plate withdrawal still occurred. A tension perpendicular failure was still
achieved in both cases (Figure 4.20).
45
Figure 4.20 - Even with ply, plate withdrawal still occurred
The first test of the 30 mm bite was conducted without the ply, however based on the
previous tests, plate withdrawal was expected and occurred at approximately 2.5 kN
with a failure at 2.9 kN. Ply was used for the remaining three tests, however, plate
withdrawal could not be restricted. In each case, withdrawal occurred at
approximately 3 kN with evidence of tension perpendicular failures occurring within
the bottom area of the bite.
46
Figure 4.21 - Unable to restrict withdrawal
Figure 4.22 - Continued force after withdrawal and achieved failure, but not reliable values.
47
Figure 4.23 - Minor failure after withdrawal
4.3.4 Conclusion of Observation
In all cases, tension perpendicular failures were achieved during the testing, however
the results of the 45 degree rotated plates at 30 mm may not be reliable due to the
occurrence of plate withdrawal, even with ply restraints. It was also noted that no
tension parallel failures occurred in any of the non-test members and there was no
physical appearance of any metal failure of the plate, so all failures can be attributed
to a tension perpendicular failure.
It is also noted that there was some minor deflection in both the bending beam and
the test member, however, it is concluded that these were only minor deflections and
would not have had a great bearing on the final results (Figure 4.24).
48
Figure 4.24- Noticeable deflection of both bending beam and sample

49
Chapter 5 Discussion
5.1 Introduction
In order to verify the current MiTek method or propose a new calculation, the results
of the testing require analysis to find a common trend that occurs between the
different sample setups. By comparing the current MiTek method where there was
only a small variation in force when changing bite depths, the average results of the
testing showed a higher variation could be expected. The variation is the estimated v
average actual from the testing as shown in Table 5.1.
Table 5.1 - Estimated v Average Actual UFL
Bite Width Bite Depth Estimated
Ultimate
Failure Load
(kN)
Average Actual
Ultimate Failure
Load (kN)
125 25 12.23 9.815
125 45 12.82 17.794
125 65 13.65 22.290
75 25 9.34 6.587
75 45 10.37 13.936
75 65 11.47 19.480
60 30 5.01 3.987
100 50 6.80 9.956
140 70 8.33 15.676
The average actual will be analysed based on a range of available variation in design
factors to see if there is any correlation between:
Bite depth
Bite width
Plate angle
Bite area
Timber properties
Number of gang-nail teeth
50
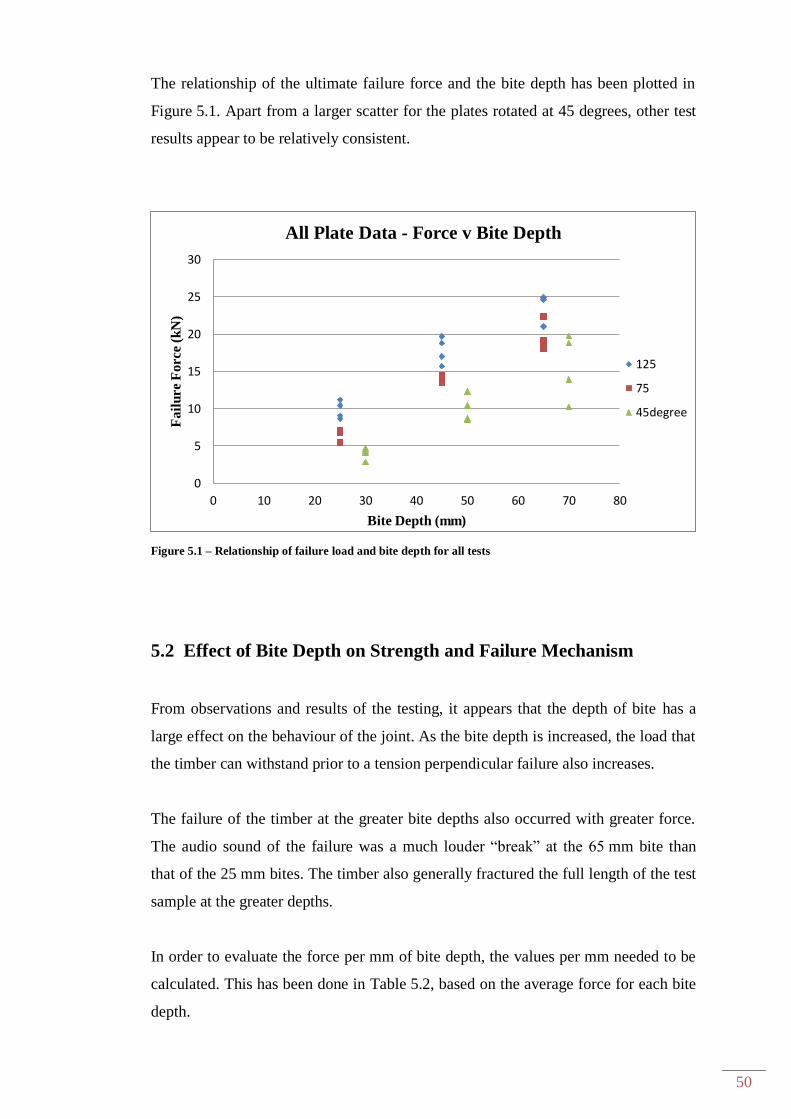
The relationship of the ultimate failure force and the bite depth has been plotted in
Figure 5.1. Apart from a larger scatter for the plates rotated at 45 degrees, other test
results appear to be relatively consistent.
Figure 5.1 – Relationship of failure load and bite depth for all tests
5.2 Effect of Bite Depth on Strength and Failure Mechanism
From observations and results of the testing, it appears that the depth of bite has a
large effect on the behaviour of the joint. As the bite depth is increased, the load that
the timber can withstand prior to a tension perpendicular failure also increases.
The failure of the timber at the greater bite depths also occurred with greater force.
The audio sound of the failure was a much louder “break” at the 65 mm bite than
that of the 25 mm bites. The timber also generally fractured the full length of the test
sample at the greater depths.
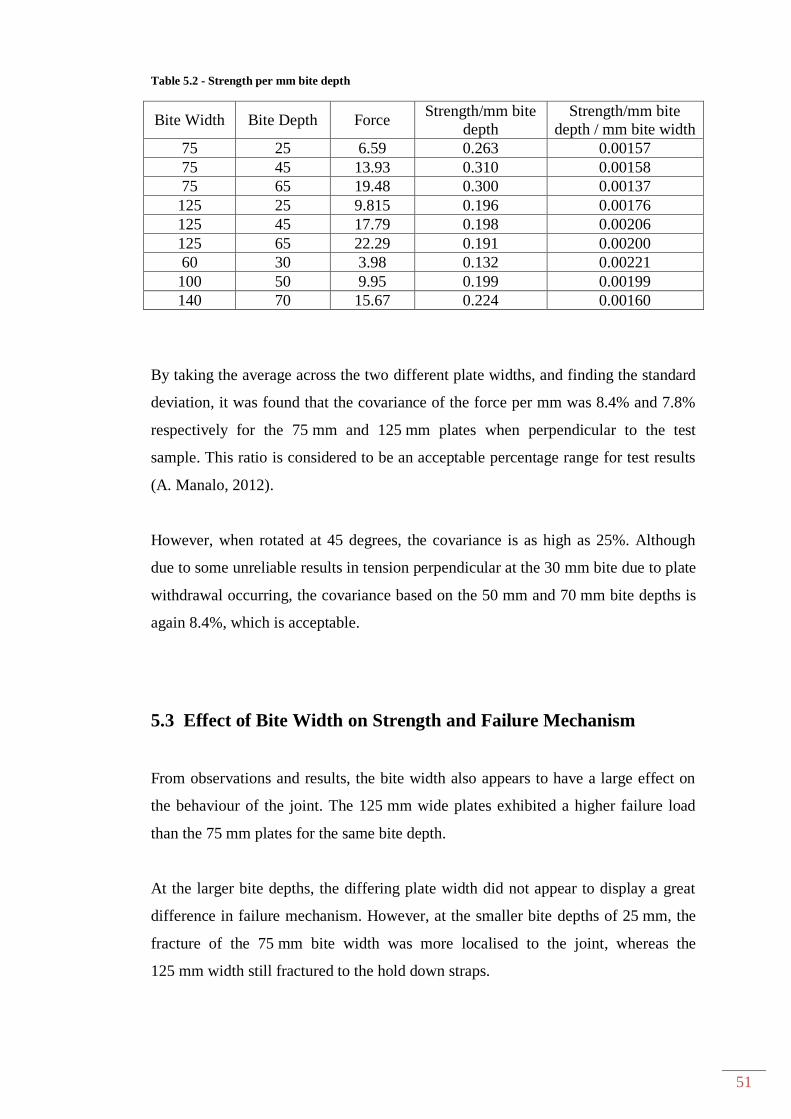
In order to evaluate the force per mm of bite depth, the values per mm needed to be
calculated. This has been done in Table 5.2, based on the average force for each bite
depth.
0
5
10
15
20
25
30
0 10 20 30 40 50 60 70 80
Fa
ilu
re F
orce (
kN
)
Bite Depth (mm)
All Plate Data - Force v Bite Depth
125
75
45degree
51
Table 5.2 - Strength per mm bite depth
Bite Width Bite Depth Force Strength/mm bite
depth
Strength/mm bite
depth / mm bite width
75 25 6.59 0.263 0.00157
75 45 13.93 0.310 0.00158
75 65 19.48 0.300 0.00137
125 25 9.815 0.196 0.00176
125 45 17.79 0.198 0.00206
125 65 22.29 0.191 0.00200
60 30 3.98 0.132 0.00221
100 50 9.95 0.199 0.00199
140 70 15.67 0.224 0.00160
By taking the average across the two different plate widths, and finding the standard
deviation, it was found that the covariance of the force per mm was 8.4% and 7.8%
respectively for the 75 mm and 125 mm plates when perpendicular to the test
sample. This ratio is considered to be an acceptable percentage range for test results
(A. Manalo, 2012).
However, when rotated at 45 degrees, the covariance is as high as 25%. Although
due to some unreliable results in tension perpendicular at the 30 mm bite due to plate
withdrawal occurring, the covariance based on the 50 mm and 70 mm bite depths is
again 8.4%, which is acceptable.
5.3 Effect of Bite Width on Strength and Failure Mechanism
From observations and results, the bite width also appears to have a large effect on
the behaviour of the joint. The 125 mm wide plates exhibited a higher failure load
than the 75 mm plates for the same bite depth.
At the larger bite depths, the differing plate width did not appear to display a great
difference in failure mechanism. However, at the smaller bite depths of 25 mm, the
fracture of the 75 mm bite width was more localised to the joint, whereas the
125 mm width still fractured to the hold down straps.
52
Again referring to Table 5.2, the covariance of the bite depth and width ratio was
also 8.4% and 7.8% respectively.
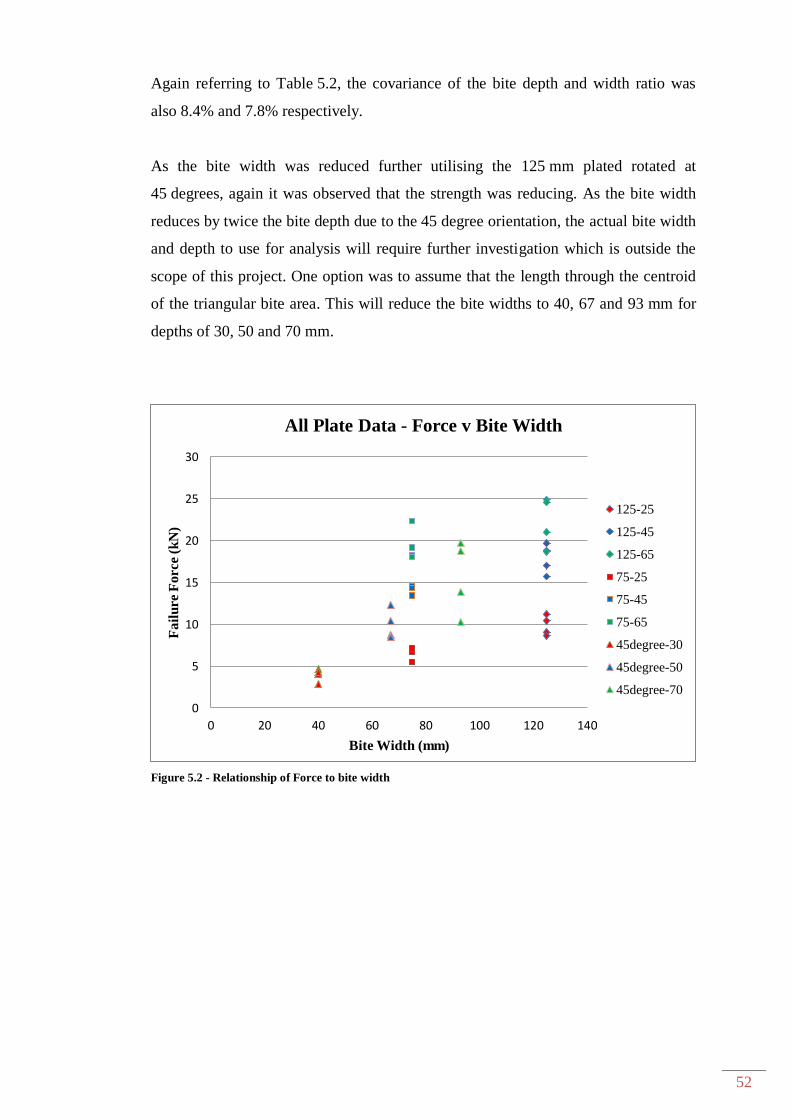
As the bite width was reduced further utilising the 125 mm plated rotated at
45 degrees, again it was observed that the strength was reducing. As the bite width
reduces by twice the bite depth due to the 45 degree orientation, the actual bite width
and depth to use for analysis will require further investigation which is outside the
scope of this project. One option was to assume that the length through the centroid
of the triangular bite area. This will reduce the bite widths to 40, 67 and 93 mm for
depths of 30, 50 and 70 mm.
Figure 5.2 - Relationship of Force to bite width
0
5
10
15
20
25
30
0 20 40 60 80 100 120 140
Fa
ilu
re F
orce (
kN
)
Bite Width (mm)
All Plate Data - Force v Bite Width
125-25
125-45
125-65
75-25
75-45
75-65
45degree-30
45degree-50
45degree-70
53
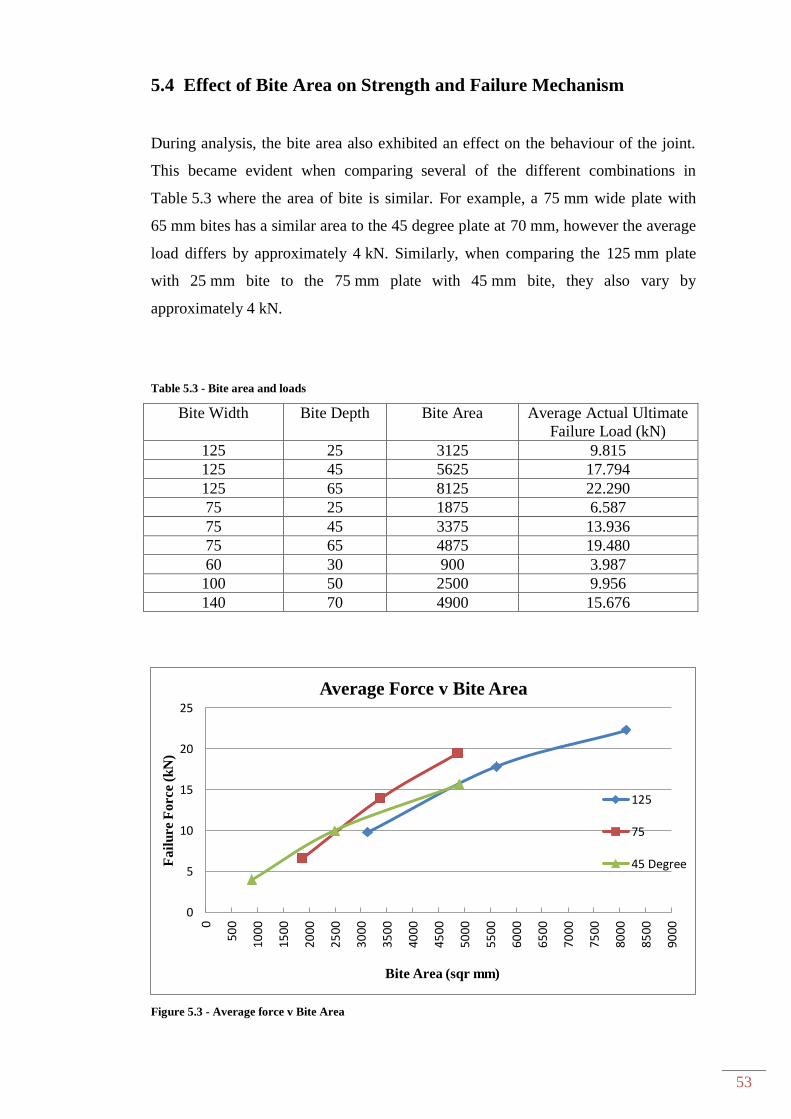
5.4 Effect of Bite Area on Strength and Failure Mechanism
During analysis, the bite area also exhibited an effect on the behaviour of the joint.
This became evident when comparing several of the different combinations in
Table 5.3 where the area of bite is similar. For example, a 75 mm wide plate with
65 mm bites has a similar area to the 45 degree plate at 70 mm, however the average
load differs by approximately 4 kN. Similarly, when comparing the 125 mm plate
with 25 mm bite to the 75 mm plate with 45 mm bite, they also vary by
approximately 4 kN.
Table 5.3 - Bite area and loads
Bite Width Bite Depth Bite Area Average Actual Ultimate
Failure Load (kN)
125 25 3125 9.815
125 45 5625 17.794
125 65 8125 22.290
75 25 1875 6.587
75 45 3375 13.936
75 65 4875 19.480
60 30 900 3.987
100 50 2500 9.956
140 70 4900 15.676
Figure 5.3 - Average force v Bite Area
0
5
10
15
20
25
0
500
1000
1500
2000
2500
3000
3500
4000
4500
5000
5500
6000
6500
7000
7500
8000
8500
9000
Fa
ilu
re F
orce (
kN
)
Bite Area (sqr mm)
Average Force v Bite Area
125
75
45 Degree
54
From these results, bite area alone cannot be considered to be an accurate method for
determining the failure load, as similar areas vary greatly as a function of the bite
depth.
5.5 Effect of Plate Angle on Strength and Failure Mechanism
The 45 degree plate angle appears to have an effect on the strength, however it could
also be related to the bite depth: width ratio. As the bite depth reduces, so too does
the bite width. For example, when the bite depth is 30 mm, the width is only 60 mm
at the timber edge, reducing in width by twice the distance away from the timber
edge until an effective width of zero at the maximum depth.
By having the plate at 45 degrees as per the test samples, the area of bite is one half
when compared to a perpendicular plate at the same width and depth.
5.6 Effect of Timber Properties on Strength and Failure Mechanism
Due to time restraints in performing the testing, only one species and density have
been used for the tests. However, based on previous testing for tension perpendicular
for other fastening methods as shown in AS1720.1, the properties of the material
could be expected to have an effect on the results.
The higher the density, the greater the grip by the plate into the timber will be. This
density will assist the fibres of the timber to hold together withstanding a higher
tension perpendicular force.
The higher density may also assist in testing the smaller bite depths in future tests by
helping to minimise the effect of plate withdrawal that occurred in some of the
testing.
The characteristic value for various materials in AS1720.1 – 2010 are as follows in
Table 5.4. As only MGP material has been tested, I cannot say if the other

55
species/grade will perform in a similar manor. It could be reasonably expected that
material with a similar strength group (SD value) will perform in a similar manor,
however, further testing will be required. Other engineered wood product materials
(e.g. LVL) may also have differing values based on the manufacturer’s
specifications.
Table 5.4 - Tension Perpendicular Characteristic Values
Material Tension Perpendicular Characteristic
Value (MPa)
MGP Radiata Pine (As per sample
material) SD5/SD6
0.5
A17 Hardwood 0.6
Seasoned F-Grade Material SD1 / SD2 0.8
Seasoned F-Grade Material SD3 / SD4 0.6
Seasoned F-Grade Material SD5 / SD6 0.5
Seasoned F-Grade Material SD7 / SD8 0.4
5.7 Effect of Tooth Quantity on Strength and Failure Mechanism
It was considered that each tooth could transfer a similar force per tooth. To prove
this, the number of teeth that existed in the test sample member for each bite depth
was counted and the force per tooth calculated. The results are in Table 5.5.
Table 5.5 - Force per tooth
Bite Width Bite Depth No. of
Teeth
UFL Force per
tooth
75 25 48 6.59 0.137
75 45 84 13.93 0.166
75 65 108 19.48 0.161
125 25 80 9.82 0.122
125 45 140 17.79 0.127
125 65 200 22.29 0.112
60 30 18 3.99 0.221
100 50 54 9.96 0.184
140 70 116 15.68 0.135
56
A covariance of 6.7% was found for the 125mm wide plate, but a value of 13.6%
was found for the 75 mm plate. While this was considered to be satisfactory, it was
on the limit of being outside the acceptable range.
However, it would be expected to see a common value between the different bite
depths. The average difference is around 24% which is considered to be too high of a
variation in results. Therefore, calculating based on the number of teeth would not be
an accurate way of determining the tension perpendicular value.
5.8 Conclusion
Through the analysis of the results, there does appear to be a correlation between the
bite depth, width and angle which may have an effect on the behaviour of a gang-nail
plated timber joint. These parameters will be used in Section 6 in order to propose a
new calculation method.
57
Chapter 6 Proposed Design Calculation
6.1 Introduction
While the depth, width and area appear to be the main factors to be considered in the
proposal of a new calculation method, the properties of the timber should also be
included. Therefore the new calculation will be based on:
Bite depth
Bite width
Bite angle
Once a correlation equation can be achieved for the ultimate failure force, then a
proposed new calculation for the design force should be constructed using:
Any applicable capacity factors in accordance with AS1720
Any applicable k values in accordance with AS1720
6.2 New method to achieve Ultimate Failure Force
To propose a new calculation method, AS1649-2001 cl 3.2.5.1 Basic lateral loads
for Category C fasteners—Failure in timber will need to be followed. This clause
states that:
Basic lateral loads for Category C fasteners, where failure in timber, shall be
derived as follows:
(a) From the tests conducted on specimens of Parallel Type for one orientation of
plate at each of the three moisture conditions, the average maximum load on the
assembly, the corresponding percentage standard deviation of individual values
and 5th percentile lower probability limit (LPL) shall be computed in
accordance with Appendix B.
(d) Basic lateral loads shall be derived from the tests on Perpendicular Type
specimens as indicated for those of Parallel Type
Therefore the average maximum load for each test and the 5th
percentile lower
probability will be used to compute and new equation.
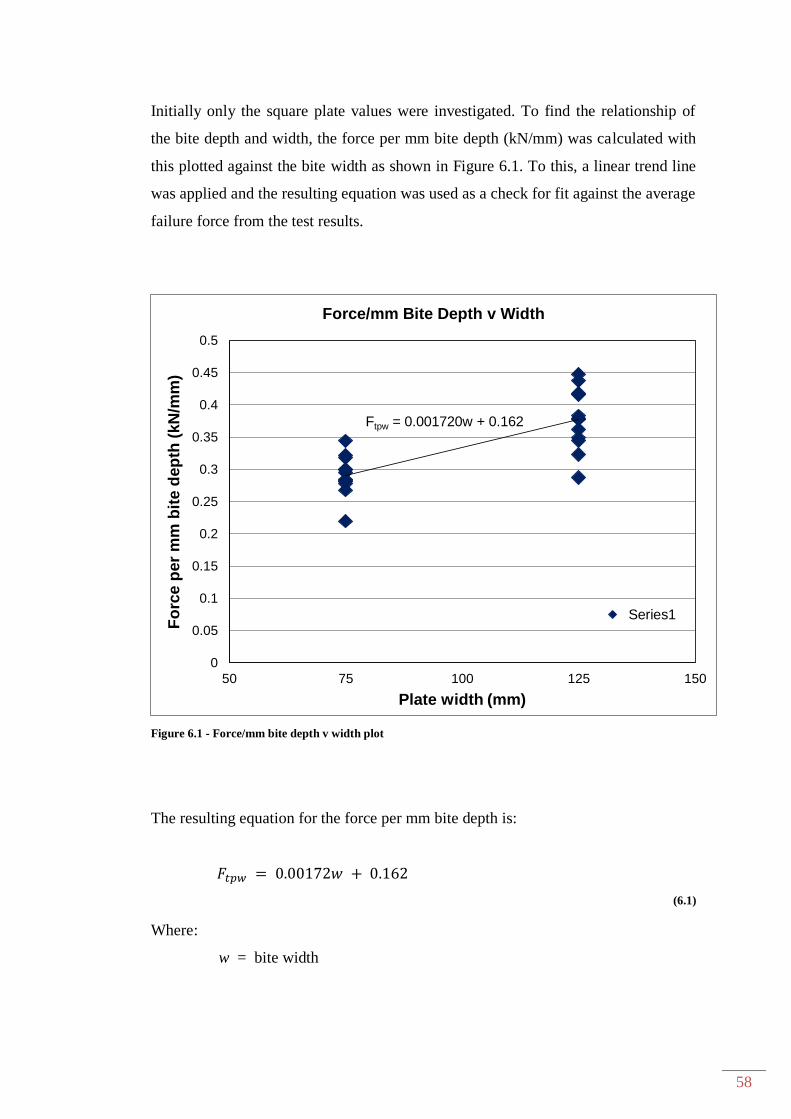
58
Initially only the square plate values were investigated. To find the relationship of
the bite depth and width, the force per mm bite depth (kN/mm) was calculated with
this plotted against the bite width as shown in Figure 6.1. To this, a linear trend line
was applied and the resulting equation was used as a check for fit against the average
failure force from the test results.
Figure 6.1 - Force/mm bite depth v width plot
The resulting equation for the force per mm bite depth is:
(6.1)
Where:
w = bite width
Ftpw = 0.001720w + 0.162
0
0.05
0.1
0.15
0.2
0.25
0.3
0.35
0.4
0.45
0.5
50 75 100 125 150
Fo
rce p
er
mm
bit
e d
ep
th (
kN
/mm
)
Plate width (mm)
Force/mm Bite Depth v Width
Series1

59
By multiplying Eq 6.1 by the tested bite depths to give Eq 6.2, the results comparing
the proposed and actual are shown in Table 6.2:
(6.2)
Table 6.1 - Proposed ultimate failure force
Bite
Width
Bite
Depth
Actual
Failure
Force
Proposed
Failure
Force
(UFave)
Variation
between Actual
and Proposed
125 25 9.82 9.42 3.99%
125 45 17.79 16.96 4.68%
125 65 22.29 24.50 -9.92%
75 25 6.59 7.27 -10.41%
75 45 13.94 13.09 6.06%
75 65 19.48 18.91 2.92%
If the values for the 45° orientated plates are now added to the plots, the equations
vary slightly. The difficulty with this is to find out what the bite depth and limits of a
plate not orientated square with the member subject to the tension perpendicular
force might be.
Figure 6.2 - What is the bite depth and width for the rotated plates?
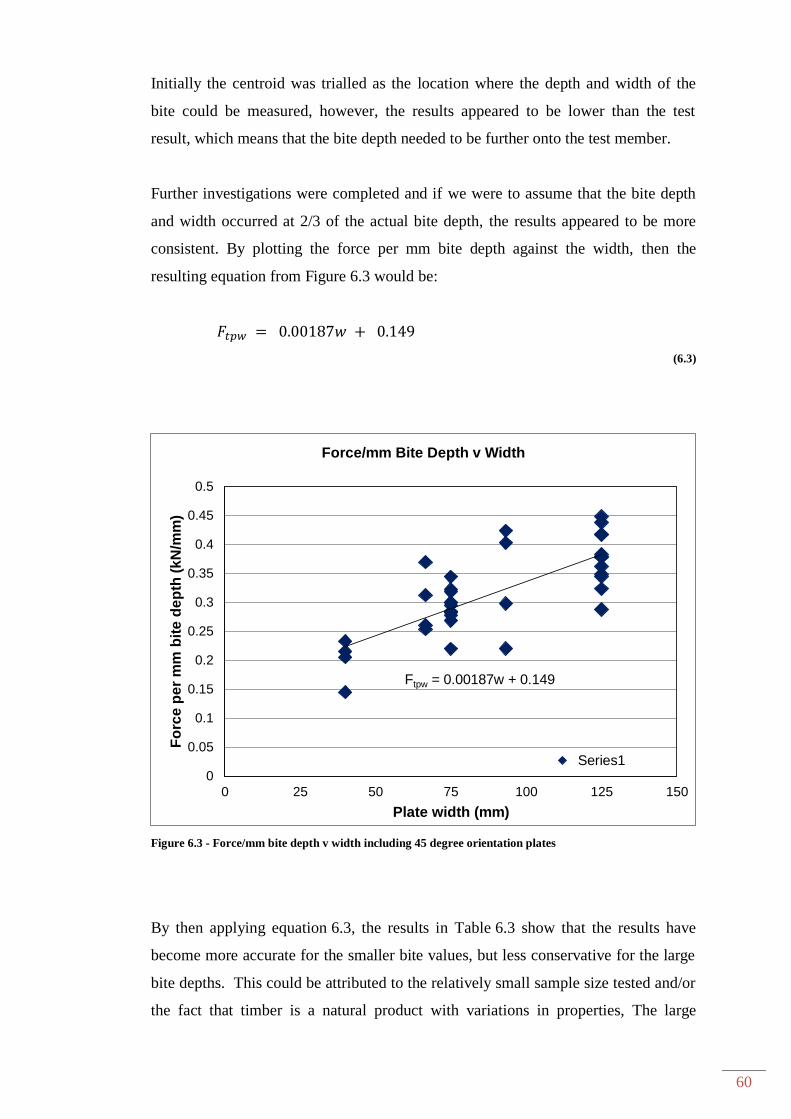
60
Initially the centroid was trialled as the location where the depth and width of the
bite could be measured, however, the results appeared to be lower than the test
result, which means that the bite depth needed to be further onto the test member.
Further investigations were completed and if we were to assume that the bite depth
and width occurred at 2/3 of the actual bite depth, the results appeared to be more
consistent. By plotting the force per mm bite depth against the width, then the
resulting equation from Figure 6.3 would be:
(6.3)
Figure 6.3 - Force/mm bite depth v width including 45 degree orientation plates
By then applying equation 6.3, the results in Table 6.3 show that the results have
become more accurate for the smaller bite values, but less conservative for the large
bite depths. This could be attributed to the relatively small sample size tested and/or
the fact that timber is a natural product with variations in properties, The large
Ftpw = 0.00187w + 0.149
0
0.05
0.1
0.15
0.2
0.25
0.3
0.35
0.4
0.45
0.5
0 25 50 75 100 125 150
Fo
rce
pe
r m
m b
ite
de
pth
(k
N/m
m)
Plate width (mm)
Force/mm Bite Depth v Width
Series1
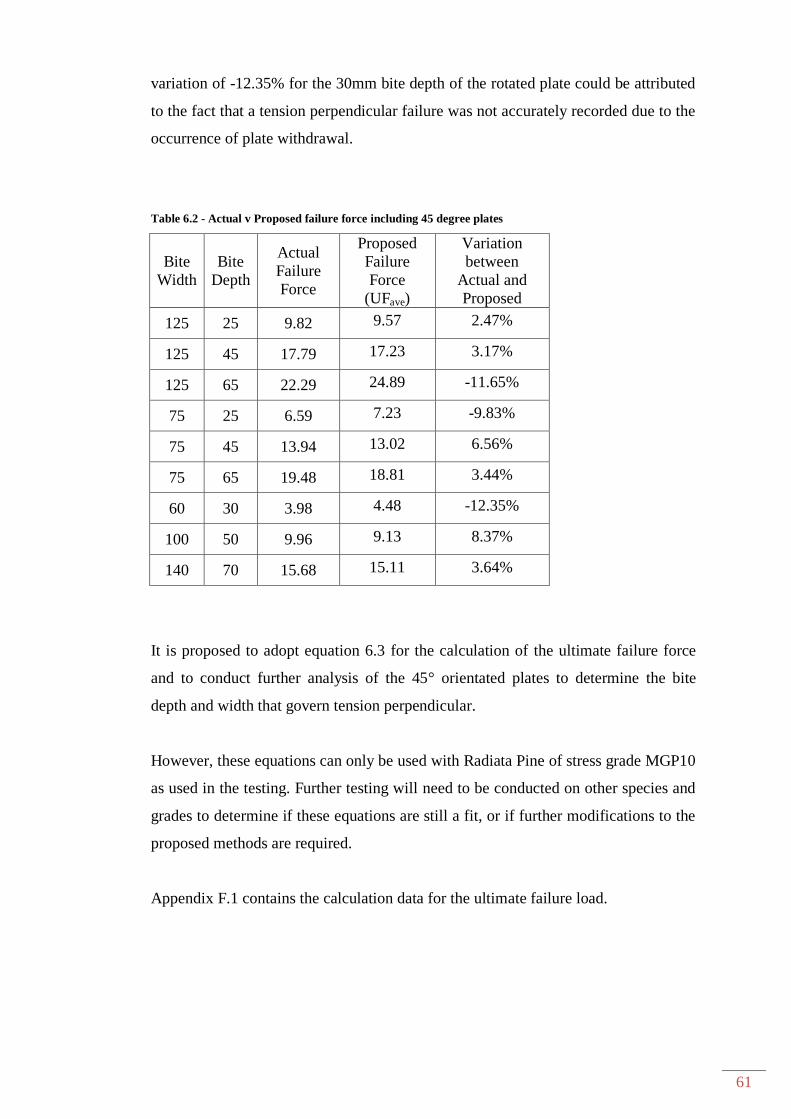
61
variation of -12.35% for the 30mm bite depth of the rotated plate could be attributed
to the fact that a tension perpendicular failure was not accurately recorded due to the
occurrence of plate withdrawal.
Table 6.2 - Actual v Proposed failure force including 45 degree plates
Bite
Width
Bite
Depth
Actual
Failure
Force
Proposed
Failure
Force
(UFave)
Variation
between
Actual and
Proposed
125 25 9.82 9.57 2.47%
125 45 17.79 17.23 3.17%
125 65 22.29 24.89 -11.65%
75 25 6.59 7.23 -9.83%
75 45 13.94 13.02 6.56%
75 65 19.48 18.81 3.44%
60 30 3.98 4.48 -12.35%
100 50 9.96 9.13 8.37%
140 70 15.68 15.11 3.64%
It is proposed to adopt equation 6.3 for the calculation of the ultimate failure force
and to conduct further analysis of the 45° orientated plates to determine the bite
depth and width that govern tension perpendicular.
However, these equations can only be used with Radiata Pine of stress grade MGP10
as used in the testing. Further testing will need to be conducted on other species and
grades to determine if these equations are still a fit, or if further modifications to the
proposed methods are required.
Appendix F.1 contains the calculation data for the ultimate failure load.

62
6.3 New method to achieve Design Failure Force
In order to calculate the design failure force, we must first find the characteristic
values for the test members. Equation 6.3, in accordance with AS1649-2001
Appendix B, is required to be reduced to account for the 5th
percentile lower
probability limit.
This value has been determined to be 0.76 (refer to Appendix F.2 for full calculation
details). To determine the characteristic ultimate force, equation 6.2 is then
multiplied by the 5th
percentile vale resulting in:
(6.4)
From the characteristic force value, other factors will need to be applied to determine
the design failure force. These include a capacity factor and the duration of load (k1)
in accordance with AS1720.1-2010. The characteristic force will be multiplied by
these values in order to produce the design capacity for each of the joints.
From AS1720.1 cl 2.3, the capacity factor is used to calculate the design capacity.
For a timber joint with mechanical fasteners, Table 2.1 is used. For a category 1
structural member, a capacity factor of 0.9 should be used.
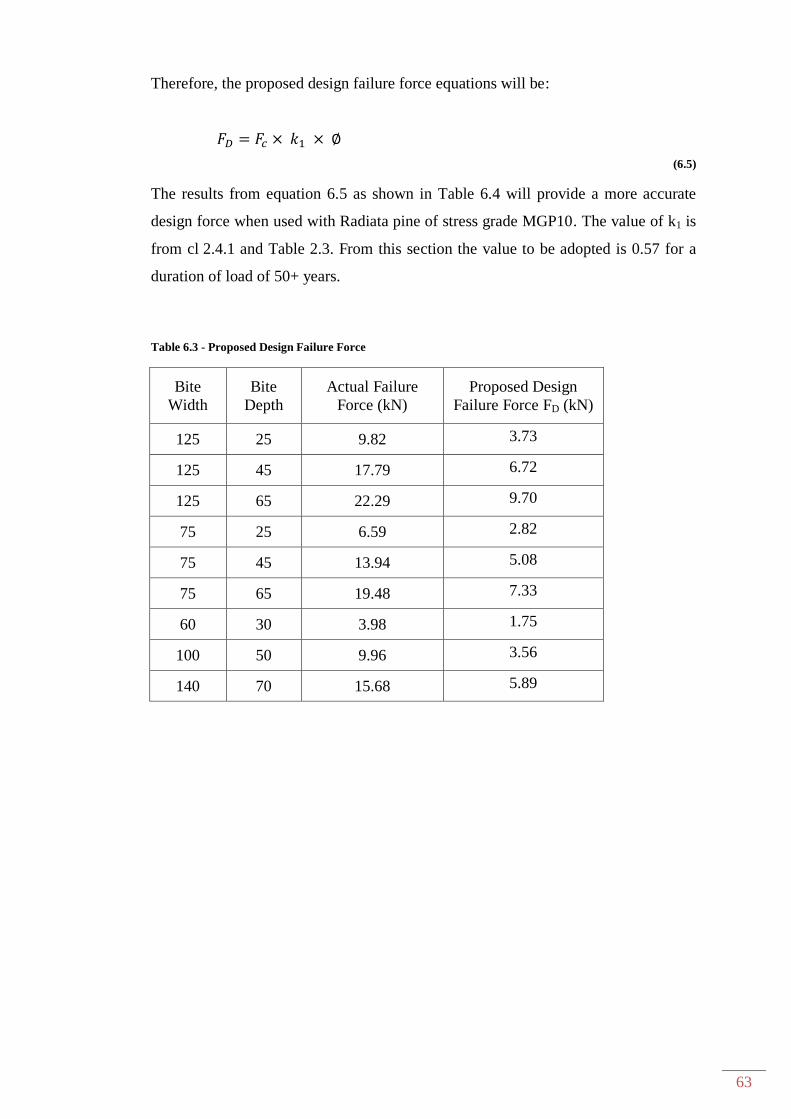
63
Therefore, the proposed design failure force equations will be:
(6.5)
The results from equation 6.5 as shown in Table 6.4 will provide a more accurate
design force when used with Radiata pine of stress grade MGP10. The value of k1 is
from cl 2.4.1 and Table 2.3. From this section the value to be adopted is 0.57 for a
duration of load of 50+ years.
Table 6.3 - Proposed Design Failure Force
Bite
Width
Bite
Depth
Actual Failure
Force (kN)
Proposed Design
Failure Force FD (kN)
125 25 9.82 3.73
125 45 17.79 6.72
125 65 22.29 9.70
75 25 6.59 2.82
75 45 13.94 5.08
75 65 19.48 7.33
60 30 3.98 1.75
100 50 9.96 3.56
140 70 15.68 5.89

64
6.4 Comparison to existing TPIC method
To check for a fit to the international standards, equations 2.1 and 2.2 set out by the
TPIC was used to compare results against the test data. The equation for both Spruce
Pine and Douglas-Fir were rearranged to find the maximum force. By rearranging
these equations to find the force, P, the results are as follows:
Table 6.4- Comparison of Spruce and Douglas-Fir to Actual
Bite Width Bite Depth Failure Force
Spruce (kN)
Failure Force
Douglas-Fir
(kN)
Actual Failure
Force (kN)
N/A 25 3.525 3.875 2.82 – 3.73
N/A 45 4.345 4.975 5.08 – 6.72
N/A 65 5.165 6.075 7.33 – 9.70
From Table H2.4 of AS1720.1-2010, the strength group of Douglas Fir from North
America is SD5, Spruce Pine is SD7 and Radiata Pine from Australia is SD6. Based
on the strength group, it could be expected that the proposed equation would provide
values in a similar range to the TPIC.
However, the TPIC method does not take into account the bite width and from the
testing, it appears that the width does have an effect on the tension perpendicular
capacities. Therefore for the Australian conditions, this method can be discounted.
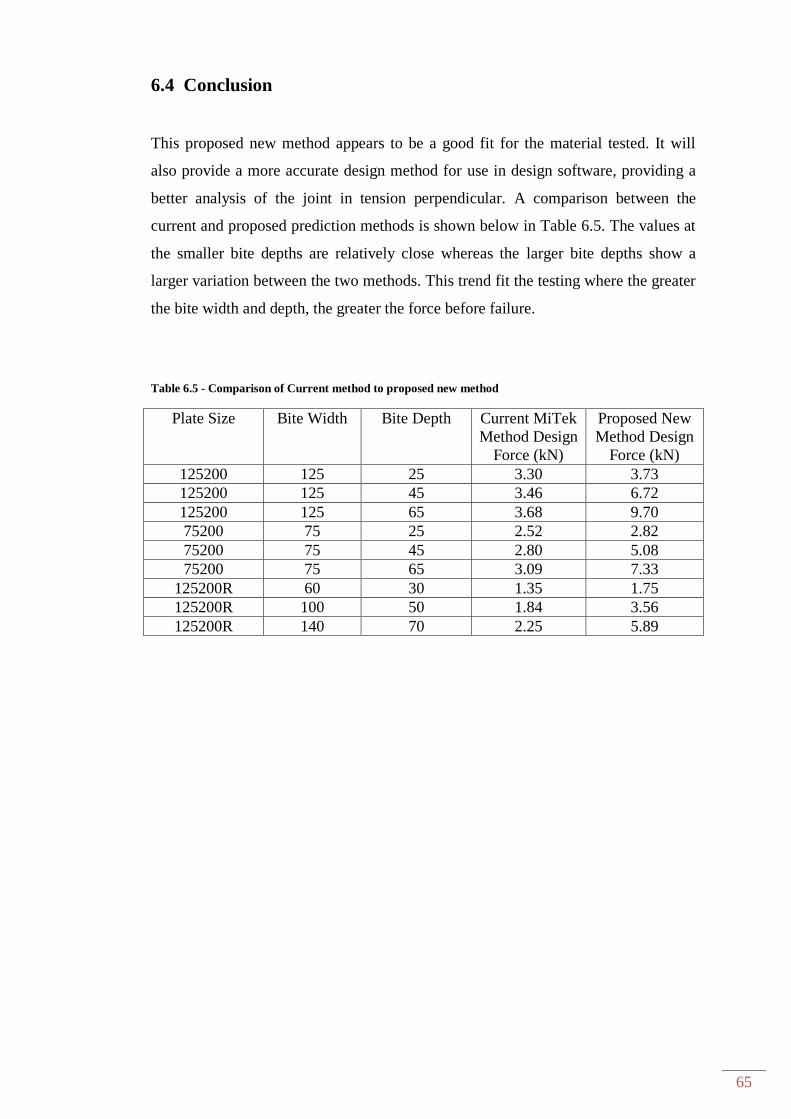
65
6.4 Conclusion
This proposed new method appears to be a good fit for the material tested. It will
also provide a more accurate design method for use in design software, providing a
better analysis of the joint in tension perpendicular. A comparison between the
current and proposed prediction methods is shown below in Table 6.5. The values at
the smaller bite depths are relatively close whereas the larger bite depths show a
larger variation between the two methods. This trend fit the testing where the greater
the bite width and depth, the greater the force before failure.
Table 6.5 - Comparison of Current method to proposed new method
Plate Size Bite Width Bite Depth Current MiTek
Method Design
Force (kN)
Proposed New
Method Design
Force (kN)
125200 125 25 3.30 3.73
125200 125 45 3.46 6.72
125200 125 65 3.68 9.70
75200 75 25 2.52 2.82
75200 75 45 2.80 5.08
75200 75 65 3.09 7.33
125200R 60 30 1.35 1.75
125200R 100 50 1.84 3.56
125200R 140 70 2.25 5.89

66
Chapter 7 Conclusion and Recommendations
7.1 Summary
A tension perpendicular to the grain failure can cause catastrophic results and has
been called the “evil of all wood connections” by the American Wood Association.
A failure of a joint in a prefabricated roof truss could have a catastrophic
consequence. Therefore it is necessary to accurately design Gang-Nail plated timber
joints to account for this.
Through a series of destructive testing and an analysis of the results, the effects of
plate width and bite depth on the strength and failure mechanisms were investigated.
It was found that the failure load increased as both the bite depth and width
increased. Failures in tension perpendicular occurred at or just below the bottom row
of teeth in the gang-nail plate and tended to follow the grain of the timber.
A new method for the calculation of the tensile force perpendicular to the grain has
been found for use with Radiata Pine of stress grade MGP10, that can accurately
predict the ultimate failure force and hence a design force equation using AS1720.1-
2010. For the ultimate failure force the equation:
( )
(7.1)
has been proposed, where w is the bite width and a tp is the bite depth.
For the design force, the above equation has been multiplied by the duration of load
factor k1 of 0.57 for 50+ years and a capacity factor for MGP graded pine of 0.9.
This results in the equation:
( )
(7.2)
This equation does provide a more accurate solution for the calculation of the
predicted tensile failure force perpendicular to the grain than the current MiTek
method, when used with Radiata Pine of stress grade MGP10 as shown in Table 7.1.

67
Table 7.1 - Comparison of Current method to proposed new method
Plate Size Bite Width Bite Depth Current MiTek
Method Design
Force (kN)
Proposed New
Method Design
Force (kN)
125200 125 25 3.30 3.73
125200 125 45 3.46 6.72
125200 125 65 3.68 9.70
75200 75 25 2.52 2.82
75200 75 45 2.80 5.08
75200 75 65 3.09 7.33
125200R 60 30 1.35 1.75
125200R 100 50 1.84 3.56
125200R 140 70 2.25 5.89
Due to the testing only being conducted using two plate widths of 75 and 125 mm, it
is possible that the results outside of this range may also change at a greater rate.
Plates are generally available from 40 mm up to 400 mm wide, so a bite width of
400 mm could produce results in a parabolic nature rather than linear as found in this
study.
This research has been conducted to observe the behaviour of a gang-nail plated
timber joint in tension perpendicular to the grain and to compare these results with
current design methods. From these results and the proposed equations for use with
MGP10 Radiata Pine, the current method is more conservative as the bite depth
increases. A range of recommendations will be discussed in Section 7.4 for this
project to proceed further and result in its inclusion in a future Australian Standard.
68
7.2 Achievement of Project Objectives
This section will detail the objectives of this research and what the outcomes of these
objectives were.
1. Conduct a literature review on references on tension perpendicular design
methods and the history of nail plated joints
Roof trusses can be dated in principal back to the Roman era with the way arch
bridges were constructed. Today’s designs are the results of the invention of nail
plates in 1955. The issue in regards to tension perpendicular is that the forces that act
through the truss members are transferred through the nail plate at the joint of two or
more members. At some of these joints a tension perpendicular to the grain force
may occur, which will act to tear the timber fibres apart causing the timber to fail.
Truss design software needs to be able to account for this when designing a joint and
locate the plate accordingly. This has been discussed further throughout Chapter 1
and 2.
2. Study Appendix A of 4063.1 for tension perpendicular test methods
All testing methods involved had to be in accordance with AS4063.1 and AS1649-
2001. Some minor interpretation of the setup for a tension perpendicular joint test
was conducted for the span of the sample, as over straps were used and these could
have had an inverse effect on the results. This has also been discussed in Chapter 2.
However the minimum quantity of tests achieved was less than the allowable of ten.
3. Conduct material testing program
All samples were manufactured using timber that was supplied by a commercial saw
mill that supplies a large quantity of timber to the roof truss industry. The timber
supplied was Radiata Pine – 140x35 MPG10 JD5. From the lengths supplied, clear
sections were selected, cut and the densities calculated. All were within the limits.
Samples were produced using two different gang nail plate widths, utilising three
bite depths and a series of 45° plate orientation. These samples were then placed into
an Avery Tension Testing machine, the cross arm moved and the ultimate failure
force and mechanism was recorded. Testing methods have been detailed in
Chapter 3.
69
4. Reference MiTek tension perpendicular design method for investigation and
analysis of test data
The test results were compared to the current MiTek calculation method and it was
found that there was sufficient variation in the results that investigations should
proceed for a new calculation method. From the data, only the smaller 25 mm bites
exhibited a smaller actual failure than predicted. The remainder of the bites were all
quite conservative when compared to the actual failures. Investigations can be found
though Chapters 4 and 5.
5. Propose a new calculation method
A new calculation method based on the plate width per mm of bite depth has been
proposed and discussed in Chapter 6. A reduction value of 0.9 was applied to the
equation from the plot to account for the variations of the test results. Results show
that this prediction equation can conservatively predict the failure load of the
strength of gang-nail plated timber joints.
6. Suggest other/further/future research area
This research has only just scratched the surface as a preliminary investigation to see
if further research is needed. From the results achieved, further testing on a range of
materials should be conducted. This will be discussed further in Chapter 7.4.
Time did not permit the investigation of the extra objectives, however, these should
be included in any further investigations.
7.3 Conclusion
The testing results when compared to the current MiTek method have proven that
this research is warranted when investigating the behaviour of gang-nail plated
timber joints in tension perpendicular to the grain. From the testing, the current
method used is generally more conservative resulting in the proposal of a
preliminary alternative design method. While this looks promising, further testing
will be required on all products used in the manufacture of timber roof trusses to
verify that similar trends do occur.

70
7.4 Recommendations
Before any results can be used commercially, and as this project is relatively new in
Australia, there is still much testing to be done to verify the results contained in the
dissertation. The testing has confirmed that further investigations are necessary to
fully propose an alternative calculation method.
Recommendations for further study:
Testing to fully comply with AS1649 with a minimum quantity of ten for
each sample setup.
Testing using the full range of timber species, grades and EWP that are
currently available for use in the timber roof truss industry. As new EWP
become available, should they also be tested or their mechanical properties
compared to those already tested.
Test a wider range of bite widths to verify if the trend remain linear or
becomes parabolic.
Test bite depths beyond the centre line of the test member and verify the
results as the bite depth approaches the timber depth
Verification of the current timber properties should be revisited and verified
that those listed in AS1720.1 do still accurately represent what is in use in the
industry. For tension perpendicular, these will be shear block tests to verify
the tension characteristic values.
Different plate orientations. In reality, a nail plate can be rotated through the
full 90° so must check for fit within all angle ranges
Effect of the force applied at an angle to the grain when the joints are not
exactly perpendicular.
71
References
Architectural Roof trusses- Overview, Wood Solutions design and build, 2011,
accessed 15 April 2012
<http://www.woodsolutions.com.au/Applications-Products/Trusses/>
Beebe, K “Wood Design for Architects, Engineering for non-engineers”, Wood
Products Council, 2012, accessed 5 May 2012
<http://www.woodworks.org/files/W-WSF-LB-2012/Beebe.pdf>
Burdzik, W M G, “Analysis of timber girder trusses for eccentric loading”, Journal
of the South African Institute of Civil Engineering, Technical Paper 571, 2004, p15-
22. <http://www.saice.org.za/downloads/journal/vol46-2-2004/vol%2046_n2_c.pdf>
Enjily V, “The performance of Timber Structures, Elements and Components”,
Denmark, Oct 2001, accessed 26 April 2012.
<http://www.km.fgg.uni-lj.si/coste24/data/CopenhagenDocuments/Enjily.pdf>
Hairstans, Dr Robert, “Timber Frame Houses: Design Principles”, Centre for Timber
Excellence - Edinburugh Napier University, United Kingdom, 19 August 2009,
accessed 5 May 2012
<http://www.ser-ltd.com/scotland/Timber/Dr_Robert_Hairstans_Seminar_Presentation.pdf>
Hansson, Eva F, “Analysis of structural failures in timber structures: Typical causes
for failure and failure modes”, Engineering Structures Vol33 Issue 11, Nov 2011
p2978-2982 accessed May 2012
<http://www.sciencedirect.com.ezproxy.usq.edu.au/science/article/pii/S0141029611
001167>
Jensen, Jorgen L and others, “Splitting of timber beams loaded perpendicular to
grain by connections – Combined effect of edge and end distance” in Construction
and Building Materials. Journal Vol 35 October 2012 p 289-293
<http://www.sciencedirect.com.ezproxy.usq.edu.au/science/article/pii/S0950061812
002085>

72
MiTek Australia, ed, Gang-Nail Truss Systems (Victoria: Mitek Australia Ltd,
2005), accessed 20 April 2012
<http://www.timberengineering.com.au/docs/GangNail%20Manual.pdf>
Mitek Australia, ed, GN Guideline 58 – Keeping up to Standard by Tim Rossitor
(Victoria: Mitek Australia Ltd, 2005), accessed 20 April 2012
<http://www.mitek.com.au/NewsMedia/GNGuidelines.aspx>
Mitek Australia, ed, GN Guideline 177 – Protocol for Structural Software by Robert
Tan (Victoria: Mitek Australia Ltd, 2012), accessed 20 April 2012
<http://www.mitek.com.au/NewsMedia/GNGuidelines.aspx>
MiTek US, ed, “Plating for Tension Perpendicular to the Grain (TPI 2007)” MiTek
20/20 v7.1.2 Release Notes (2009) , accessed 20 April 2012
<http://www.mii.com/artefact/download.asp?aid=50326>
Multinail, ed, Truss Facts Book, (Stapylton, Queensland) accessed 6 May 2012.
<http://www.multinail.com.au/deploycontrol/files/upload/tech_brochures_truss_facts
_aus.pdf>
Our Code of Ethics, Engineers Australia, 28 July 2010, accessed 1 May 2012
<http://www.engineersaustralia.org.au//sites/default/files/shado/About%20Us/Overvi
ew/Governance/CodeOfEthics2000.pdf>
Raftertales, “Types and Benefits of Roof Trusses” 17May 2008, viewed 14 April
2012. <http://www.raftertales.com/home-remodeling/roof-truss/>
Schoenmakers.JCM and Jorissen.AJM, “Failure mechanisms of dowel-type fastener
connections perpendicular to grain”, in Engineering Structures, Journal Vol 33 Issue
11, Nov 2011, pg3054-3063, accessed 28 April 2012
<http://www.sciencedirect.com.ezproxy.usq.edu.au/science/article/pii/S0141029611
002185>

73
Soltis.L and Ritter.M, Mechanical Connections in Wood Structures, ASCE Manual
and Reports on Engineering Practice No. 84, American Society of Civil Engineers –
Fasteners of the Committee on Wood Task Force, (New York: American Society of
Civil Engineers, 1996), accessed 10 May 2012.
<http://www.woodcenter.org/docs/solti97c.pdf>
Standards Australia 2002, Structural Design Actions – General Principles,
AS1170.0: 2002, Standards Australia, Sydney, accessed 06 Mar 2012,
<http://www.saiglobal.com/online/autologin.asp>
Standards Australia 2002, Structural Design Actions – Permanent, imposed and
other actions, AS1170.1: 2002, Standards Australia, Sydney, accessed 06 Mar 2012,
<http://www.saiglobal.com/online/autologin.asp>
Standards Australia 2001, Timber – Method of test for mechanical fasteners and
connectors – Basic working loads and characteristic strengths, AS1649-2001,
Standards Australia, Sydney, accessed 06 Mar 2012,
<http://www.saiglobal.com/online/autologin.asp>
Standards Australia 2010, Residential timber-framed construction, AS1684-2010,
Standards Australia, Sydney, accessed 06 Mar 2012,
<http://www.saiglobal.com/online/autologin.asp>
Standards Australia 2010, Timber Structures Part 1: Design Methods, AS1720.1-
2010, Standards Australia, Sydney, accessed 06 Mar 2012,
http://www.saiglobal.com/online/autologin.asp
Standards Australia 2010, Characterization of structural timber Part 1: Test
Methods, AS4063.1-2010, Standards Australia, Sydney, accessed 06 Mar 2012,
<http://www.saiglobal.com/online/autologin.asp>
Standards Australia 2010, Characterization of structural timber Part 2:
Determination of characteristic values, AS4063.2-2010, Standards Australia,
Sydney, accessed 06 Mar 2012,
<http://www.saiglobal.com/online/autologin.asp>
74
The Wood Connection Session, American Wood Council and others, 2001, accessed
1 May 2012
<http://web.dcp.ufl.edu/kuenstle/Connections.pdf>
Todd, D.M & Turnbull, J.E, “The effect of nailing patterns on tensile strength of
plywood gussets”, in Canadian Agricultural Engineering Journal, Vol 12. No 1, May
1970, accessed 6 June 2012.
<http://bioeng.ca/docs/journal/12/12_1_42_ocr.pdf>

75
Appendix A – Project Specification
University of Southern Queensland
FACULTY OF ENGINEERING AND SURVEYING
ENG4111/4112 Research Project
PROJECT SPECIFICATION
FOR: Craig KLINGE
TOPIC: BEHAVIOUR OF GANG-NAIL PLATED TIMBER
JOINTS IN TENSION PERPENDICULAR TO THE GRAIN
SUPERVISORS: Dr. Allan Manalo
Robert Tan, Technical Services Manager, MiTek
Australia
SPONSORSHIP: MiTek Australia Ltd
ENROLMENT: ENG4111 – S1 2012 EXT
ENG4112 – S2 2012 EXT
PROJECT AIM: To examine the behaviour of Gang-Nail plated timber
joints in tension perpendicular to the grain and to
correlate with the prediction equation using the MiTek
method (which is based on clause 3.4.2 in AS1720.1)
PROGRAMME: Issue A, 19 March 2012
Conduct a literature search for:
a. references on tension perpendicular design methods; seeking timber
design text books and overseas timber/truss design standards
b. History of nail plated joints and joint restraint
2. Study Appendix A in AS4063.1 for tension perpendicular test method, and
§3.4.2 in AS1720.1 for tension perpendicular calculation method and current
characteristic values
3. Conduct material testing programme:
i. Calculate sample material densities. Use only relatively clear
MGP Radiata Pine test samples within the band of densities
defined by JD5
ii. Obtain connector plate test data to establish correlation/accuracy
of MiTek design method. The connector plate tests would
comprise
i. A series of 90° plate orientation of various width and depth
of bite into chord – 2 x plate width and 3 x bite grip lengths
ii. A series of 45° plates orientation of various depth of bite
into chord (the base width will automatically be double the
depth)
76
4. Reference MiTek tension perpendicular design method for investigation and
analyse the data for fit with the current MiTek method
5. Propose a more accurate calculation method
6. Suggest other/further/future areas of research
As time permits
1. Conduct shear block tests to verify characteristic values
2. Batten screw tests (a range of penetration) to establish correlation/accuracy of
existing AS1720.1 design method
3. Test other timber species/densities/grades and engineered wood products
(LVL)
AGREED ………………………. (Student) ……………………(Supervisor)
……./........./........ ……../……./……..
(Agreed by Student and Supervisor on 20 April 2012)
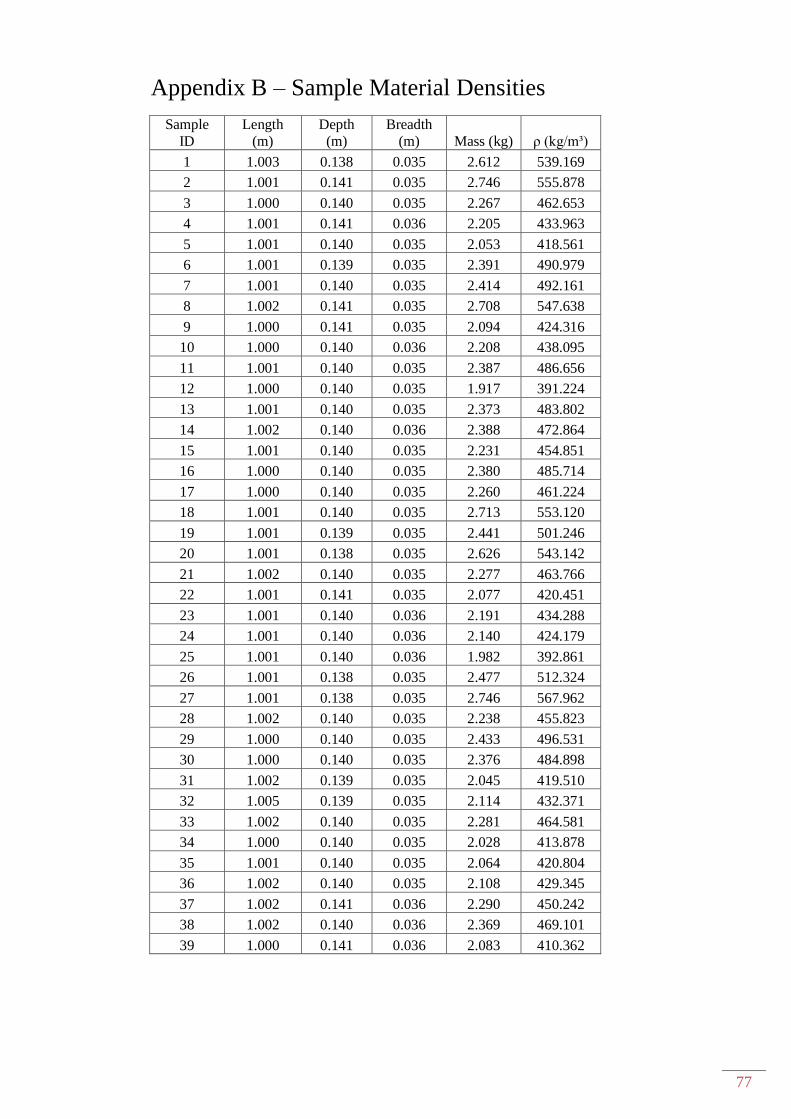
77
Appendix B – Sample Material Densities
Sample
ID Length
(m) Depth
(m) Breadth
(m) Mass (kg) ρ (kg/m³)
1 1.003 0.138 0.035 2.612 539.169
2 1.001 0.141 0.035 2.746 555.878
3 1.000 0.140 0.035 2.267 462.653
4 1.001 0.141 0.036 2.205 433.963
5 1.001 0.140 0.035 2.053 418.561
6 1.001 0.139 0.035 2.391 490.979
7 1.001 0.140 0.035 2.414 492.161
8 1.002 0.141 0.035 2.708 547.638
9 1.000 0.141 0.035 2.094 424.316
10 1.000 0.140 0.036 2.208 438.095
11 1.001 0.140 0.035 2.387 486.656
12 1.000 0.140 0.035 1.917 391.224
13 1.001 0.140 0.035 2.373 483.802
14 1.002 0.140 0.036 2.388 472.864
15 1.001 0.140 0.035 2.231 454.851
16 1.000 0.140 0.035 2.380 485.714
17 1.000 0.140 0.035 2.260 461.224
18 1.001 0.140 0.035 2.713 553.120
19 1.001 0.139 0.035 2.441 501.246
20 1.001 0.138 0.035 2.626 543.142
21 1.002 0.140 0.035 2.277 463.766
22 1.001 0.141 0.035 2.077 420.451
23 1.001 0.140 0.036 2.191 434.288
24 1.001 0.140 0.036 2.140 424.179
25 1.001 0.140 0.036 1.982 392.861
26 1.001 0.138 0.035 2.477 512.324
27 1.001 0.138 0.035 2.746 567.962
28 1.002 0.140 0.035 2.238 455.823
29 1.000 0.140 0.035 2.433 496.531
30 1.000 0.140 0.035 2.376 484.898
31 1.002 0.139 0.035 2.045 419.510
32 1.005 0.139 0.035 2.114 432.371
33 1.002 0.140 0.035 2.281 464.581
34 1.000 0.140 0.035 2.028 413.878
35 1.001 0.140 0.035 2.064 420.804
36 1.002 0.140 0.035 2.108 429.345
37 1.002 0.141 0.036 2.290 450.242
38 1.002 0.140 0.036 2.369 469.101
39 1.000 0.141 0.036 2.083 410.362
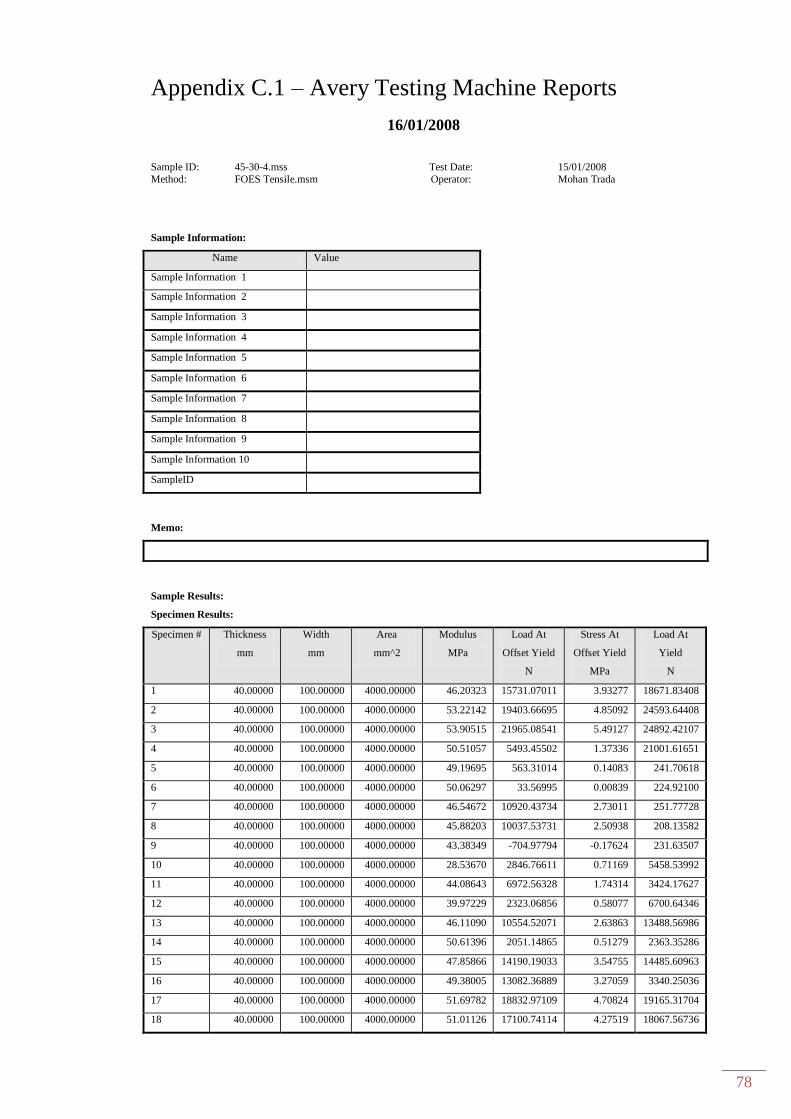
78
Appendix C.1 – Avery Testing Machine Reports
16/01/2008
Sample ID: 45-30-4.mss Test Date: 15/01/2008
Method: FOES Tensile.msm Operator: Mohan Trada
Sample Information:
Name Value
Sample Information 1
Sample Information 2
Sample Information 3
Sample Information 4
Sample Information 5
Sample Information 6
Sample Information 7
Sample Information 8
Sample Information 9
Sample Information 10
SampleID
Memo:
Sample Results:
Specimen Results:
Specimen # Thickness
mm
Width
mm
Area
mm^2
Modulus
MPa
Load At
Offset Yield
N
Stress At
Offset Yield
MPa
Load At
Yield
N
1 40.00000 100.00000 4000.00000 46.20323 15731.07011 3.93277 18671.83408
2 40.00000 100.00000 4000.00000 53.22142 19403.66695 4.85092 24593.64408
3 40.00000 100.00000 4000.00000 53.90515 21965.08541 5.49127 24892.42107
4 40.00000 100.00000 4000.00000 50.51057 5493.45502 1.37336 21001.61651
5 40.00000 100.00000 4000.00000 49.19695 563.31014 0.14083 241.70618
6 40.00000 100.00000 4000.00000 50.06297 33.56995 0.00839 224.92100
7 40.00000 100.00000 4000.00000 46.54672 10920.43734 2.73011 251.77728
8 40.00000 100.00000 4000.00000 45.88203 10037.53731 2.50938 208.13582
9 40.00000 100.00000 4000.00000 43.38349 -704.97794 -0.17624 231.63507
10 40.00000 100.00000 4000.00000 28.53670 2846.76611 0.71169 5458.53992
11 40.00000 100.00000 4000.00000 44.08643 6972.56328 1.74314 3424.17627
12 40.00000 100.00000 4000.00000 39.97229 2323.06856 0.58077 6700.64346
13 40.00000 100.00000 4000.00000 46.11090 10554.52071 2.63863 13488.56986
14 40.00000 100.00000 4000.00000 50.61396 2051.14865 0.51279 2363.35286
15 40.00000 100.00000 4000.00000 47.85866 14190.19033 3.54755 14485.60963
16 40.00000 100.00000 4000.00000 49.38005 13082.36889 3.27059 3340.25036
17 40.00000 100.00000 4000.00000 51.69782 18832.97109 4.70824 19165.31704
18 40.00000 100.00000 4000.00000 51.01126 17100.74114 4.27519 18067.56736
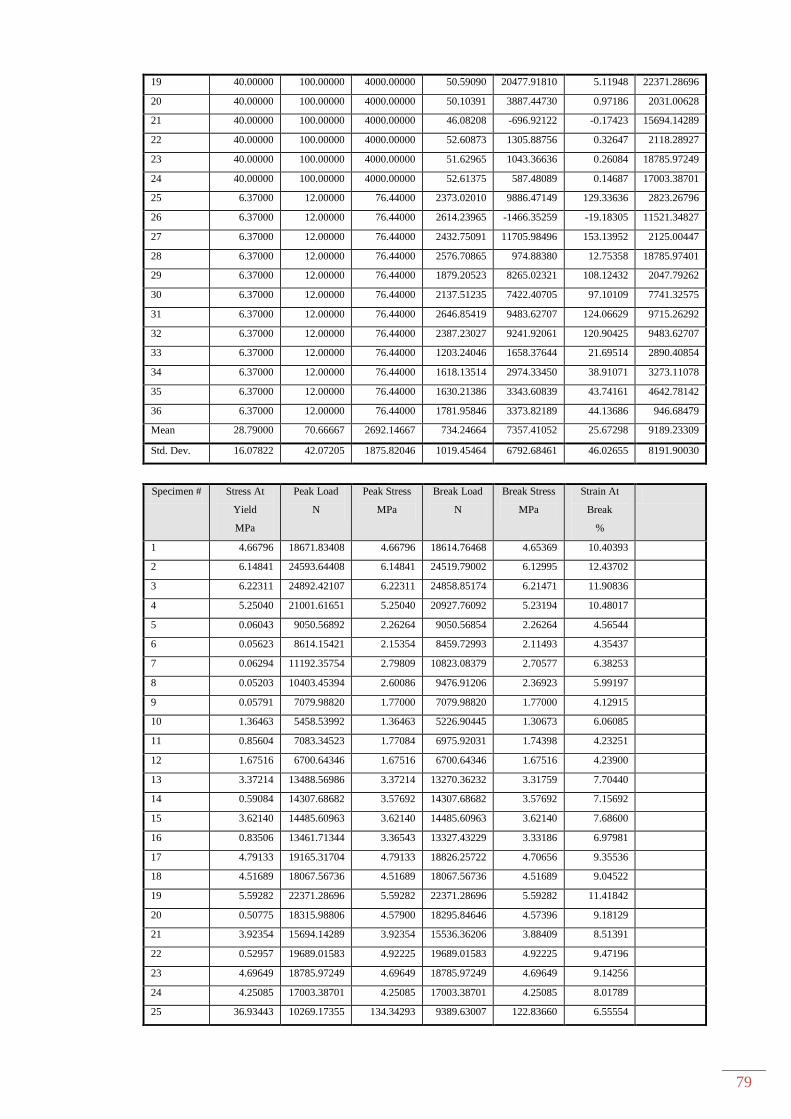
79
19 40.00000 100.00000 4000.00000 50.59090 20477.91810 5.11948 22371.28696
20 40.00000 100.00000 4000.00000 50.10391 3887.44730 0.97186 2031.00628
21 40.00000 100.00000 4000.00000 46.08208 -696.92122 -0.17423 15694.14289
22 40.00000 100.00000 4000.00000 52.60873 1305.88756 0.32647 2118.28927
23 40.00000 100.00000 4000.00000 51.62965 1043.36636 0.26084 18785.97249
24 40.00000 100.00000 4000.00000 52.61375 587.48089 0.14687 17003.38701
25 6.37000 12.00000 76.44000 2373.02010 9886.47149 129.33636 2823.26796
26 6.37000 12.00000 76.44000 2614.23965 -1466.35259 -19.18305 11521.34827
27 6.37000 12.00000 76.44000 2432.75091 11705.98496 153.13952 2125.00447
28 6.37000 12.00000 76.44000 2576.70865 974.88380 12.75358 18785.97401
29 6.37000 12.00000 76.44000 1879.20523 8265.02321 108.12432 2047.79262
30 6.37000 12.00000 76.44000 2137.51235 7422.40705 97.10109 7741.32575
31 6.37000 12.00000 76.44000 2646.85419 9483.62707 124.06629 9715.26292
32 6.37000 12.00000 76.44000 2387.23027 9241.92061 120.90425 9483.62707
33 6.37000 12.00000 76.44000 1203.24046 1658.37644 21.69514 2890.40854
34 6.37000 12.00000 76.44000 1618.13514 2974.33450 38.91071 3273.11078
35 6.37000 12.00000 76.44000 1630.21386 3343.60839 43.74161 4642.78142
36 6.37000 12.00000 76.44000 1781.95846 3373.82189 44.13686 946.68479
Mean 28.79000 70.66667 2692.14667 734.24664 7357.41052 25.67298 9189.23309
Std. Dev. 16.07822 42.07205 1875.82046 1019.45464 6792.68461 46.02655 8191.90030
Specimen # Stress At
Yield
MPa
Peak Load
N
Peak Stress
MPa
Break Load
N
Break Stress
MPa
Strain At
Break
%
1 4.66796 18671.83408 4.66796 18614.76468 4.65369 10.40393
2 6.14841 24593.64408 6.14841 24519.79002 6.12995 12.43702
3 6.22311 24892.42107 6.22311 24858.85174 6.21471 11.90836
4 5.25040 21001.61651 5.25040 20927.76092 5.23194 10.48017
5 0.06043 9050.56892 2.26264 9050.56854 2.26264 4.56544
6 0.05623 8614.15421 2.15354 8459.72993 2.11493 4.35437
7 0.06294 11192.35754 2.79809 10823.08379 2.70577 6.38253
8 0.05203 10403.45394 2.60086 9476.91206 2.36923 5.99197
9 0.05791 7079.98820 1.77000 7079.98820 1.77000 4.12915
10 1.36463 5458.53992 1.36463 5226.90445 1.30673 6.06085
11 0.85604 7083.34523 1.77084 6975.92031 1.74398 4.23251
12 1.67516 6700.64346 1.67516 6700.64346 1.67516 4.23900
13 3.37214 13488.56986 3.37214 13270.36232 3.31759 7.70440
14 0.59084 14307.68682 3.57692 14307.68682 3.57692 7.15692
15 3.62140 14485.60963 3.62140 14485.60963 3.62140 7.68600
16 0.83506 13461.71344 3.36543 13327.43229 3.33186 6.97981
17 4.79133 19165.31704 4.79133 18826.25722 4.70656 9.35536
18 4.51689 18067.56736 4.51689 18067.56736 4.51689 9.04522
19 5.59282 22371.28696 5.59282 22371.28696 5.59282 11.41842
20 0.50775 18315.98806 4.57900 18295.84646 4.57396 9.18129
21 3.92354 15694.14289 3.92354 15536.36206 3.88409 8.51391
22 0.52957 19689.01583 4.92225 19689.01583 4.92225 9.47196
23 4.69649 18785.97249 4.69649 18785.97249 4.69649 9.14256
24 4.25085 17003.38701 4.25085 17003.38701 4.25085 8.01789
25 36.93443 10269.17355 134.34293 9389.63007 122.83660 6.55554

80
26 150.72407 19756.15641 258.45312 19739.37174 258.23354 10.04721
27 27.79964 13982.05530 182.91543 13982.05530 182.91543 7.54855
28 245.76104 18785.97401 245.76104 18695.33452 244.57528 9.52103
29 26.78954 8677.93823 113.52614 8513.44392 111.37420 6.06331
30 101.27323 8442.94621 110.45194 7670.82767 100.35096 5.22383
31 127.09658 12303.53705 160.95679 12303.53705 160.95679 6.14725
32 124.06629 10410.16914 136.18746 9920.04178 129.77553 6.55571
33 37.81278 2890.40854 37.81278 1581.16460 20.68504 5.28726
34 42.81935 4105.65585 53.71083 4001.58748 52.34939 4.43140
35 60.73759 4656.20954 60.91326 4568.92679 59.77141 5.01258
36 12.38468 4293.64947 56.17019 3917.66157 51.25146 4.02798
Mean 29.38620 13282.01938 45.58602 13082.36908 44.00684 7.36891
Std. Dev. 54.53142 6157.89972 72.70267 6297.00633 71.77395 2.41202
Calculation Inputs:
Name Value Units
Break Marker Drop 10.0 %
Break Marker Elongation 0.00100 mm
Chord Modulus Elongation Point 1 0.25400 mm
Chord Modulus Elongation Point 2 12.70000 mm
Chord Modulus Strain Point 1 0.02000 mm/mm
Chord Modulus Strain Point 2 0.05000 mm/mm
Nominal Gage Length 100.00000 mm
Secant Modulus Elongation Point 1 0.25400 mm
Secant Modulus Strain Point 1 0.05000 mm/mm
Secant Modulus Strain Point 2 0.05000 mm/mm
Slack Pre-Load 0.22500 lbf
Slope Segment Length 50.000 %
Strain Point 01 0.05000 mm/mm
Strain Point 02 0.05000 mm/mm
Strain Point 03 0.05000 mm/mm
Strain Point 04 0.05000 mm/mm
Strain Point 05 0.05000 mm/mm
Strain Point 06 0.05000 mm/mm
Strain Point 07 0.05000 mm/mm
Strain Point 08 0.05000 mm/mm
Yield Angle 0.00000 rad
Yield Offset 0.00200 mm/mm
Yield Segment Length 2.0 %
Test Inputs:
Name Value Units
Break Sensitivity 95 %
Break Threshold 200.00000 kN
Data Acq. Rate 10.0 Hz
Extension Endpoint 0.50000 mm
Gage Adjustment Pre-Load 0.44500 N
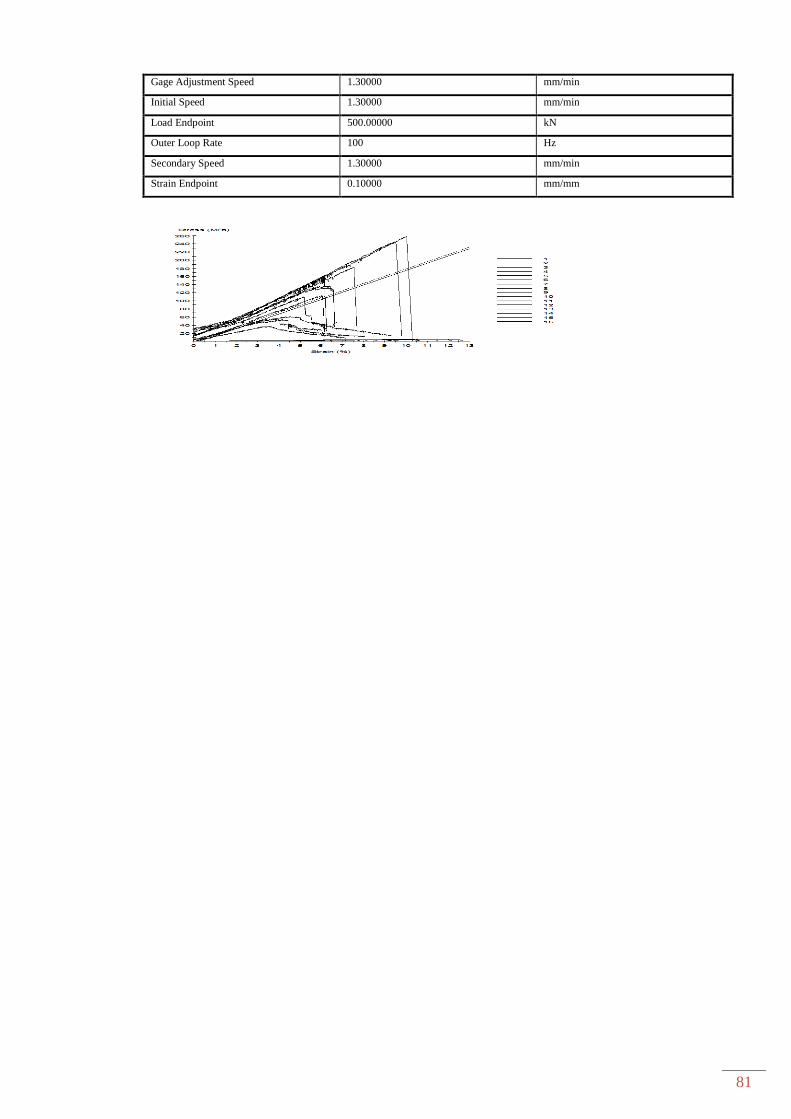
81
Gage Adjustment Speed 1.30000 mm/min
Initial Speed 1.30000 mm/min
Load Endpoint 500.00000 kN
Outer Loop Rate 100 Hz
Secondary Speed 1.30000 mm/min
Strain Endpoint 0.10000 mm/mm

82
Appendix C.2 – Sample individual test output
"Test Method","FOES Tensile.msm"
"Sample I. D.","125-25-1.mss"
"Specimen Number","5"
"Time (s)","Extension (mm)","Strain (%)","Load (kN)","Stress
(MPa)"
0.60000,-2.14256,-2.14256,0.06043,0.01511
1.00000,-2.12656,-2.12656,0.11750,0.02937
1.40000,-2.11856,-2.11856,0.24171,0.06043
1.80000,-2.11056,-2.11056,0.20478,0.05119
2.20000,-2.09856,-2.09856,0.07721,0.01930
2.60000,-2.09056,-2.09056,0.06378,0.01595
3.00000,-2.08256,-2.08256,0.13428,0.03357
3.40000,-2.07456,-2.07456,0.23164,0.05791
3.80000,-2.06256,-2.06256,0.17792,0.04448
4.20000,-2.05456,-2.05456,0.12085,0.03021
4.60000,-2.04656,-2.04656,0.10407,0.02602
5.00000,-2.03856,-2.03856,0.13428,0.03357
5.40000,-2.03056,-2.03056,0.21485,0.05371
5.80000,-2.02256,-2.02256,0.23835,0.05959
6.20000,-2.01056,-2.01056,0.10742,0.02686
6.60000,-2.00256,-2.00256,0.03357,0.00839
7.00000,-1.99456,-1.99456,0.10071,0.02518
7.40000,-1.98256,-1.98256,0.19806,0.04952
7.80000,-1.97456,-1.97456,0.23499,0.05875
8.20000,-1.97056,-1.97056,0.16449,0.04112
8.60000,-1.95856,-1.95856,0.09064,0.02266
9.00000,-1.95056,-1.95056,0.06714,0.01679
9.40000,-1.94256,-1.94256,0.19471,0.04868
9.80000,-1.93456,-1.93456,0.23835,0.05959
10.20000,-1.92256,-1.92256,0.14100,0.03525
10.60000,-1.91856,-1.91856,0.05036,0.01259
11.00000,-1.90256,-1.90256,0.06714,0.01679
11.40000,-1.90256,-1.90256,0.15442,0.03861
11.80000,-1.89056,-1.89056,0.23835,0.05959
12.20000,-1.87856,-1.87856,0.15442,0.03861
12.60000,-1.87456,-1.87456,0.06043,0.01511
13.00000,-1.86256,-1.86256,0.03357,0.00839
13.40000,-1.85056,-1.85056,0.15442,0.03861
13.80000,-1.85056,-1.85056,0.24842,0.06211
14.20000,-1.83856,-1.83856,0.19135,0.04784
14.60000,-1.83056,-1.83056,0.07385,0.01846
15.00000,-1.82256,-1.82256,0.05036,0.01259
15.40000,-1.81056,-1.81056,0.13092,0.03273
15.80000,-1.80256,-1.80256,0.21485,0.05371
16.20000,-1.79456,-1.79456,0.20478,0.05119
16.60000,-1.78656,-1.78656,0.10407,0.02602
17.00000,-1.77856,-1.77856,0.06714,0.01679
17.40000,-1.77056,-1.77056,0.11078,0.02770
17.80000,-1.75856,-1.75856,0.18799,0.04700
18.20000,-1.75056,-1.75056,0.21485,0.05371
18.60000,-1.73456,-1.73456,0.17457,0.04364
19.00000,-1.73456,-1.73456,0.03357,0.00839
19.40000,-1.72256,-1.72256,0.08728,0.02182
19.80000,-1.71456,-1.71456,0.15442,0.03861
20.20000,-1.70656,-1.70656,0.20478,0.05119
20.60000,-1.70256,-1.70256,0.15442,0.03861
83
21.00000,-1.69056,-1.69056,0.10071,0.02518
21.40000,-1.68256,-1.68256,0.05371,0.01343
21.80000,-1.67456,-1.67456,0.17792,0.04448
22.20000,-1.66656,-1.66656,0.23164,0.05791
22.60000,-1.65856,-1.65856,0.21485,0.05371
23.00000,-1.64656,-1.64656,0.06714,0.01679
23.40000,-1.63856,-1.63856,0.05707,0.01427
23.80000,-1.63056,-1.63056,0.12757,0.03189
24.20000,-1.62256,-1.62256,0.22156,0.05539
24.60000,-1.61056,-1.61056,0.20814,0.05203
25.00000,-1.59856,-1.59856,0.11750,0.02937
25.40000,-1.59856,-1.59856,0.05036,0.01259
25.80000,-1.58656,-1.58656,0.11078,0.02770
26.20000,-1.57856,-1.57856,0.19471,0.04868
26.60000,-1.56656,-1.56656,0.20142,0.05036
27.00000,-1.55856,-1.55856,0.15107,0.03777
27.40000,-1.55456,-1.55456,0.05036,0.01259
27.80000,-1.54256,-1.54256,0.09064,0.02266
28.20000,-1.53456,-1.53456,0.14771,0.03693
28.60000,-1.52656,-1.52656,0.20478,0.05119
29.00000,-1.51456,-1.51456,0.16785,0.04196
29.40000,-1.50656,-1.50656,0.06378,0.01595
29.80000,-1.49856,-1.49856,0.02014,0.00504
30.20000,-1.49056,-1.49056,0.15107,0.03777
30.60000,-1.47856,-1.47856,0.23499,0.05875
31.00000,-1.47456,-1.47456,0.16785,0.04196
31.40000,-1.46656,-1.46656,0.06043,0.01511
31.80000,-1.45856,-1.45856,0.06378,0.01595
32.20000,-1.44656,-1.44656,0.18128,0.04532
32.60000,-1.43456,-1.43456,0.20142,0.05036
33.00000,-1.43456,-1.43456,0.11750,0.02937
33.40000,-1.42256,-1.42256,0.05707,0.01427
33.80000,-1.41456,-1.41456,0.13764,0.03441
34.20000,-1.40256,-1.40256,0.22828,0.05707
34.60000,-1.39456,-1.39456,0.23835,0.05959
35.00000,-1.38656,-1.38656,0.15107,0.03777
35.40000,-1.37856,-1.37856,0.08057,0.02014
35.80000,-1.37056,-1.37056,0.19806,0.04952
36.20000,-1.36256,-1.36256,0.30213,0.07553
36.60000,-1.35456,-1.35456,0.24842,0.06211
37.00000,-1.33856,-1.33856,0.11750,0.02937
37.40000,-1.33456,-1.33456,0.14771,0.03693
37.80000,-1.32256,-1.32256,0.28870,0.07218
38.20000,-1.31856,-1.31856,0.30549,0.07637
38.60000,-1.31056,-1.31056,0.20478,0.05119
39.00000,-1.29856,-1.29856,0.16785,0.04196
39.40000,-1.29056,-1.29056,0.23835,0.05959
39.80000,-1.28256,-1.28256,0.35920,0.08980
40.20000,-1.27456,-1.27456,0.30549,0.07637
40.60000,-1.26656,-1.26656,0.22156,0.05539
41.00000,-1.25856,-1.25856,0.18464,0.04616
41.40000,-1.24656,-1.24656,0.28535,0.07134
41.80000,-1.23856,-1.23856,0.34242,0.08560
42.20000,-1.23456,-1.23456,0.26185,0.06546
42.60000,-1.22256,-1.22256,0.17457,0.04364
43.00000,-1.21456,-1.21456,0.21821,0.05455
43.40000,-1.20656,-1.20656,0.33235,0.08309
43.80000,-1.19456,-1.19456,0.37934,0.09484
44.20000,-1.18656,-1.18656,0.22492,0.05623
44.60000,-1.17856,-1.17856,0.18128,0.04532
45.00000,-1.17056,-1.17056,0.21821,0.05455
84
45.40000,-1.16256,-1.16256,0.32563,0.08141
45.80000,-1.15056,-1.15056,0.30885,0.07721
46.20000,-1.14656,-1.14656,0.24506,0.06127
46.60000,-1.13456,-1.13456,0.18464,0.04616
47.00000,-1.12656,-1.12656,0.23499,0.05875
47.40000,-1.11856,-1.11856,0.33570,0.08393
47.80000,-1.11056,-1.11056,0.37263,0.09316
48.20000,-1.09856,-1.09856,0.30549,0.07637
48.60000,-1.09456,-1.09456,0.24171,0.06043
49.00000,-1.08256,-1.08256,0.25178,0.06294
49.40000,-1.07456,-1.07456,0.33235,0.08309
49.80000,-1.06656,-1.06656,0.38270,0.09568
50.20000,-1.05856,-1.05856,0.37934,0.09484
50.60000,-1.05056,-1.05056,0.28870,0.07218
51.00000,-1.03856,-1.03856,0.23499,0.05875
51.40000,-1.03456,-1.03456,0.32899,0.08225
51.80000,-1.02256,-1.02256,0.41627,0.10407
52.20000,-1.01456,-1.01456,0.44313,0.11078
52.60000,-1.00656,-1.00656,0.35585,0.08896
53.00000,-0.99856,-0.99856,0.31892,0.07973
53.40000,-0.98256,-0.98256,0.30549,0.07637
53.80000,-0.98256,-0.98256,0.41627,0.10407
54.20000,-0.96656,-0.96656,0.46998,0.11750
54.60000,-0.96256,-0.96256,0.40284,0.10071
55.00000,-0.95456,-0.95456,0.35249,0.08812
55.40000,-0.94656,-0.94656,0.35920,0.08980
55.80000,-0.93856,-0.93856,0.43977,0.10994
56.20000,-0.92656,-0.92656,0.51698,0.12925
56.60000,-0.91456,-0.91456,0.48341,0.12085
57.00000,-0.91056,-0.91056,0.35249,0.08812
57.40000,-0.90256,-0.90256,0.36927,0.09232
57.80000,-0.89456,-0.89456,0.41627,0.10407
58.20000,-0.88656,-0.88656,0.52370,0.13092
58.60000,-0.87456,-0.87456,0.56398,0.14100
59.00000,-0.86656,-0.86656,0.45320,0.11330
59.40000,-0.85856,-0.85856,0.39613,0.09903
59.80000,-0.85056,-0.85056,0.43306,0.10826
60.20000,-0.84256,-0.84256,0.46663,0.11666
60.60000,-0.83056,-0.83056,0.58412,0.14603
61.00000,-0.82256,-0.82256,0.53713,0.13428
61.40000,-0.81456,-0.81456,0.44313,0.11078
61.80000,-0.81056,-0.81056,0.44313,0.11078
62.20000,-0.79856,-0.79856,0.50691,0.12673
62.60000,-0.79056,-0.79056,0.57070,0.14267
63.00000,-0.78256,-0.78256,0.58748,0.14687
63.40000,-0.77056,-0.77056,0.53713,0.13428
63.80000,-0.76256,-0.76256,0.48677,0.12169
64.20000,-0.75456,-0.75456,0.52370,0.13092
64.60000,-0.74256,-0.74256,0.59755,0.14939
65.00000,-0.73856,-0.73856,0.68819,0.17205
65.40000,-0.73056,-0.73056,0.62441,0.15610
65.80000,-0.72256,-0.72256,0.55055,0.13764
66.20000,-0.71056,-0.71056,0.55727,0.13932
66.60000,-0.69856,-0.69856,0.61769,0.15442
67.00000,-0.69456,-0.69456,0.75533,0.18883
67.40000,-0.68656,-0.68656,0.70833,0.17708
67.80000,-0.67856,-0.67856,0.63784,0.15946
68.20000,-0.66656,-0.66656,0.58748,0.14687
68.60000,-0.66256,-0.66256,0.66805,0.16701
69.00000,-0.65056,-0.65056,0.75533,0.18883
69.40000,-0.64256,-0.64256,0.79897,0.19974
85
69.80000,-0.63456,-0.63456,0.73183,0.18296
70.20000,-0.62656,-0.62656,0.68148,0.17037
70.60000,-0.61456,-0.61456,0.68148,0.17037
71.00000,-0.61056,-0.61056,0.80569,0.20142
71.40000,-0.59856,-0.59856,0.87283,0.21821
71.80000,-0.59056,-0.59056,0.84262,0.21065
72.20000,-0.58256,-0.58256,0.76876,0.19219
72.60000,-0.57056,-0.57056,0.73855,0.18464
73.00000,-0.56656,-0.56656,0.78890,0.19723
73.40000,-0.55456,-0.55456,0.88626,0.22156
73.80000,-0.54656,-0.54656,0.91311,0.22828
74.20000,-0.53856,-0.53856,0.86276,0.21569
74.60000,-0.53056,-0.53056,0.83926,0.20981
75.00000,-0.51856,-0.51856,0.83926,0.20981
75.40000,-0.51056,-0.51056,0.92654,0.23164
75.80000,-0.50256,-0.50256,1.01382,0.25346
76.20000,-0.49456,-0.49456,0.96347,0.24087
76.60000,-0.48256,-0.48256,0.92654,0.23164
77.00000,-0.47856,-0.47856,0.85604,0.21401
77.40000,-0.46656,-0.46656,0.94668,0.23667
77.80000,-0.46256,-0.46256,1.00375,0.25094
78.20000,-0.45056,-0.45056,1.06754,0.26688
78.60000,-0.44256,-0.44256,1.01047,0.25262
79.00000,-0.43456,-0.43456,0.92318,0.23080
79.40000,-0.42256,-0.42256,0.99704,0.24926
79.80000,-0.41456,-0.41456,1.03397,0.25849
80.20000,-0.40656,-0.40656,1.05747,0.26437
80.60000,-0.39856,-0.39856,1.06754,0.26688
81.00000,-0.38656,-0.38656,1.02390,0.25597
81.40000,-0.38256,-0.38256,0.99033,0.24758
81.80000,-0.37456,-0.37456,1.04739,0.26185
82.20000,-0.36656,-0.36656,1.10111,0.27528
82.60000,-0.35456,-0.35456,1.18168,0.29542
83.00000,-0.34656,-0.34656,1.10782,0.27696
83.40000,-0.33856,-0.33856,1.03732,0.25933
83.80000,-0.33056,-0.33056,1.08432,0.27108
84.20000,-0.31856,-0.31856,1.07089,0.26772
84.60000,-0.31456,-0.31456,1.21860,0.30465
85.00000,-0.30256,-0.30256,1.15818,0.28954
85.40000,-0.29456,-0.29456,1.11789,0.27947
85.80000,-0.28656,-0.28656,1.10782,0.27696
86.20000,-0.27856,-0.27856,1.12796,0.28199
86.60000,-0.27056,-0.27056,1.20518,0.30129
87.00000,-0.25856,-0.25856,1.24210,0.31053
87.40000,-0.25056,-0.25056,1.20182,0.30045
87.80000,-0.24256,-0.24256,1.17832,0.29458
88.20000,-0.23456,-0.23456,1.13132,0.28283
88.60000,-0.22656,-0.22656,1.21860,0.30465
89.00000,-0.21456,-0.21456,1.25889,0.31472
89.40000,-0.21056,-0.21056,1.32939,0.33235
89.80000,-0.20256,-0.20256,1.25553,0.31388
90.20000,-0.19056,-0.19056,1.20518,0.30129
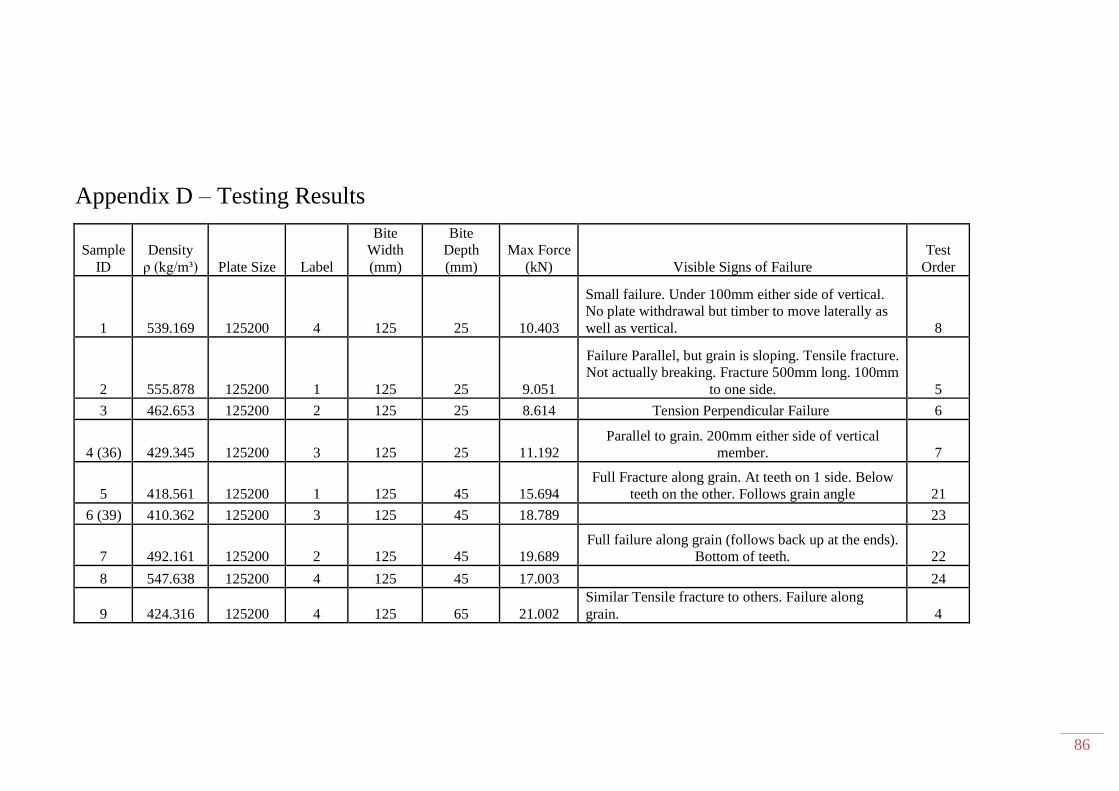
86
Appendix D – Testing Results
Sample
ID Density
ρ (kg/m³) Plate Size Label
Bite
Width
(mm)
Bite
Depth
(mm) Max Force
(kN) Visible Signs of Failure Test
Order
1 539.169 125200 4 125 25 10.403
Small failure. Under 100mm either side of vertical.
No plate withdrawal but timber to move laterally as
well as vertical. 8
2 555.878 125200 1 125 25 9.051
Failure Parallel, but grain is sloping. Tensile fracture.
Not actually breaking. Fracture 500mm long. 100mm
to one side. 5
3 462.653 125200 2 125 25 8.614 Tension Perpendicular Failure 6
4 (36) 429.345 125200 3 125 25 11.192 Parallel to grain. 200mm either side of vertical
member. 7
5 418.561 125200 1 125 45 15.694 Full Fracture along grain. At teeth on 1 side. Below
teeth on the other. Follows grain angle 21
6 (39) 410.362 125200 3 125 45 18.789 23
7 492.161 125200 2 125 45 19.689 Full failure along grain (follows back up at the ends).
Bottom of teeth. 22
8 547.638 125200 4 125 45 17.003 24
9 424.316 125200 4 125 65 21.002 Similar Tensile fracture to others. Failure along
grain. 4
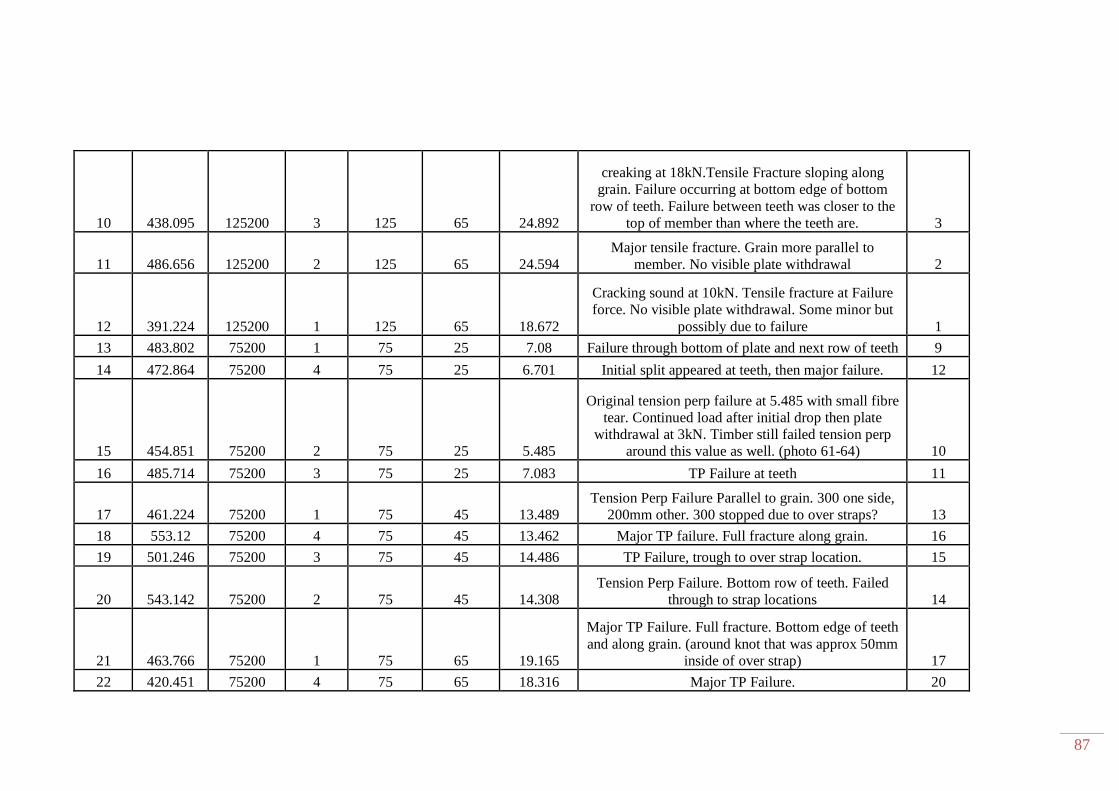
87
10 438.095 125200 3 125 65 24.892
creaking at 18kN.Tensile Fracture sloping along
grain. Failure occurring at bottom edge of bottom
row of teeth. Failure between teeth was closer to the
top of member than where the teeth are. 3
11 486.656 125200 2 125 65 24.594 Major tensile fracture. Grain more parallel to
member. No visible plate withdrawal 2
12 391.224 125200 1 125 65 18.672
Cracking sound at 10kN. Tensile fracture at Failure
force. No visible plate withdrawal. Some minor but
possibly due to failure 1
13 483.802 75200 1 75 25 7.08 Failure through bottom of plate and next row of teeth 9
14 472.864 75200 4 75 25 6.701 Initial split appeared at teeth, then major failure. 12
15 454.851 75200 2 75 25 5.485
Original tension perp failure at 5.485 with small fibre
tear. Continued load after initial drop then plate
withdrawal at 3kN. Timber still failed tension perp
around this value as well. (photo 61-64) 10
16 485.714 75200 3 75 25 7.083 TP Failure at teeth 11
17 461.224 75200 1 75 45 13.489 Tension Perp Failure Parallel to grain. 300 one side,
200mm other. 300 stopped due to over straps? 13
18 553.12 75200 4 75 45 13.462 Major TP failure. Full fracture along grain. 16
19 501.246 75200 3 75 45 14.486 TP Failure, trough to over strap location. 15
20 543.142 75200 2 75 45 14.308 Tension Perp Failure. Bottom row of teeth. Failed
through to strap locations 14
21 463.766 75200 1 75 65 19.165
Major TP Failure. Full fracture. Bottom edge of teeth
and along grain. (around knot that was approx 50mm
inside of over strap) 17
22 420.451 75200 4 75 65 18.316 Major TP Failure. 20
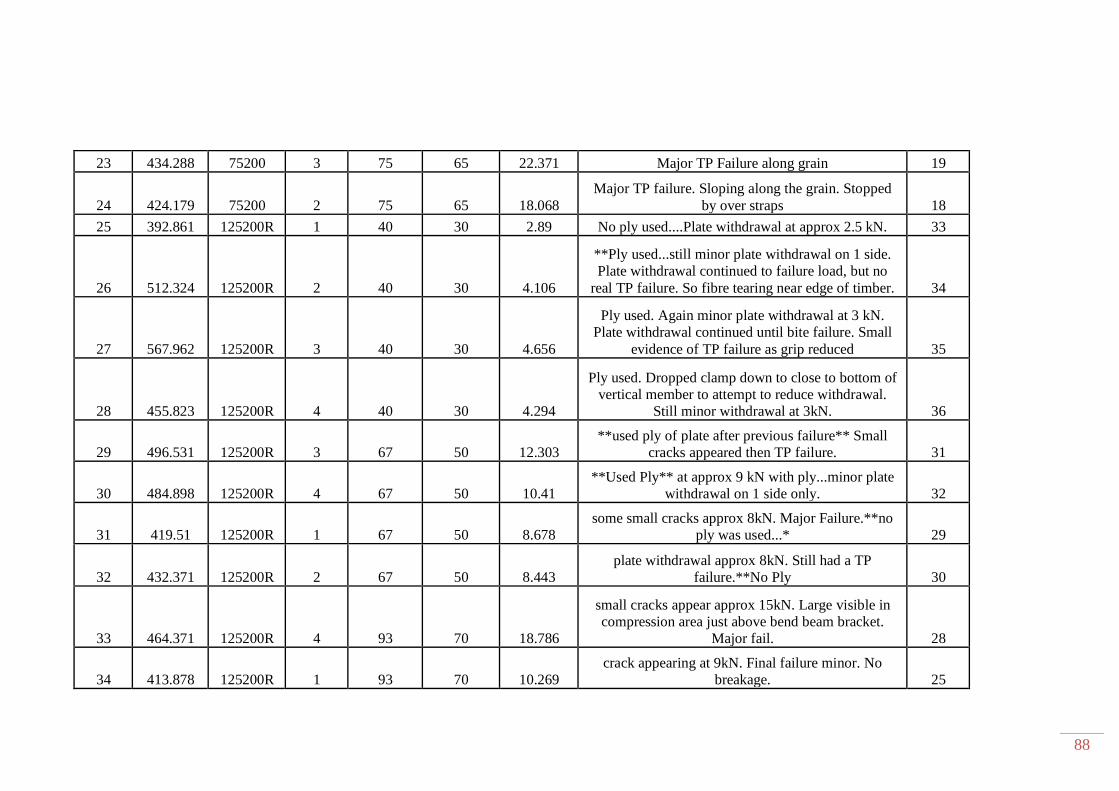
88
23 434.288 75200 3 75 65 22.371 Major TP Failure along grain 19
24 424.179 75200 2 75 65 18.068 Major TP failure. Sloping along the grain. Stopped
by over straps 18
25 392.861 125200R 1 40 30 2.89 No ply used....Plate withdrawal at approx 2.5 kN. 33
26 512.324 125200R 2 40 30 4.106
**Ply used...still minor plate withdrawal on 1 side.
Plate withdrawal continued to failure load, but no
real TP failure. So fibre tearing near edge of timber. 34
27 567.962 125200R 3 40 30 4.656
Ply used. Again minor plate withdrawal at 3 kN.
Plate withdrawal continued until bite failure. Small
evidence of TP failure as grip reduced 35
28 455.823 125200R 4 40 30 4.294
Ply used. Dropped clamp down to close to bottom of
vertical member to attempt to reduce withdrawal.
Still minor withdrawal at 3kN. 36
29 496.531 125200R 3 67 50 12.303 **used ply of plate after previous failure** Small
cracks appeared then TP failure. 31
30 484.898 125200R 4 67 50 10.41 **Used Ply** at approx 9 kN with ply...minor plate
withdrawal on 1 side only. 32
31 419.51 125200R 1 67 50 8.678 some small cracks approx 8kN. Major Failure.**no
ply was used...* 29
32 432.371 125200R 2 67 50 8.443 plate withdrawal approx 8kN. Still had a TP
failure.**No Ply 30
33 464.371 125200R 4 93 70 18.786
small cracks appear approx 15kN. Large visible in
compression area just above bend beam bracket.
Major fail. 28
34 413.878 125200R 1 93 70 10.269 crack appearing at 9kN. Final failure minor. No
breakage. 25
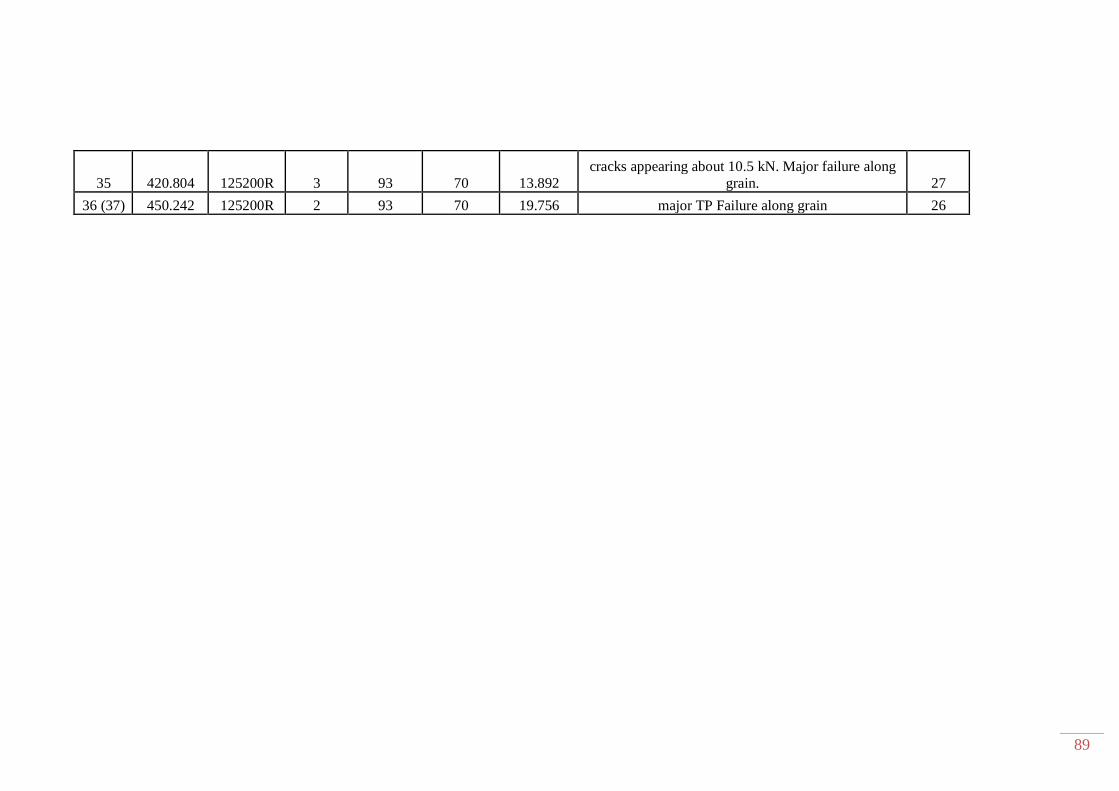
89
35 420.804 125200R 3 93 70 13.892 cracks appearing about 10.5 kN. Major failure along
grain. 27
36 (37) 450.242 125200R 2 93 70 19.756 major TP Failure along grain 26

90
Appendix E – Analysis Data
Sample
ID Plate Size Label Density
ρ (kg/m³)
Bite
Width
(mm)
Bite
Depth
(mm) Bite Area No of
teeth Max Force
(kN) Average
Force
Standard
Deviation
of Force
Normalised
force (Bite
depth per
mm width)
Normalised
force
(Width per
mm bite
depth)
1 125200 4 539.169 125 25 6250 80 10.403 0.083224 0.41612
2 125200 1 555.878 125 25 6250 80 9.051 0.072408 0.36204
3 125200 2 462.653 125 25 6250 80 8.614 0.068912 0.34456
4 (36) 125200 3 429.345 125 25 6250 80 11.192 9.815 1.193 0.089536 0.44768
5 125200 1 418.561 125 45 11250 140 15.694 0.125552 0.34875556
6 (39) 125200 3 410.362 125 45 11250 140 18.789 0.150312 0.41753333
7 125200 2 492.161 125 45 11250 140 19.689 0.157512 0.43753333
8 125200 4 547.638 125 45 11250 140 17.003 17.79375 1.790 0.136024 0.37784444
9 125200 4 424.316 125 65 16250 200 21.002 0.168016 0.32310769
10 125200 3 438.095 125 65 16250 200 24.892 0.199136 0.38295385

91
11 125200 2 486.656 125 65 16250 200 24.594 0.196752 0.37836923
12 125200 1 391.224 125 65 16250 200 18.672 22.29 2.990 0.149376 0.28726154
13 75200 1 483.802 75 25 3750 48 7.08 0.0944 0.2832
14 75200 4 472.864 75 25 3750 48 6.701 0.08934667 0.26804
15 75200 2 454.851 75 25 3750 48 5.485 0.07313333 0.2194
16 75200 3 485.714 75 25 3750 48 7.083 6.58725 0.756 0.09444 0.28332
17 75200 1 461.224 75 45 6750 84 13.489 0.17985333 0.29975556
18 75200 4 553.12 75 45 6750 84 13.462 0.17949333 0.29915556
19 75200 3 501.246 75 45 6750 84 14.486 0.19314667 0.32191111
20 75200 2 543.142 75 45 6750 84 14.308 13.93625 0.537 0.19077333 0.31795556
21 75200 1 463.766 75 65 9750 108 19.165 0.25553333 0.29484615
22 75200 4 420.451 75 65 9750 108 18.316 0.24421333 0.28178462
23 75200 3 434.288 75 65 9750 108 22.371 0.29828 0.34416923
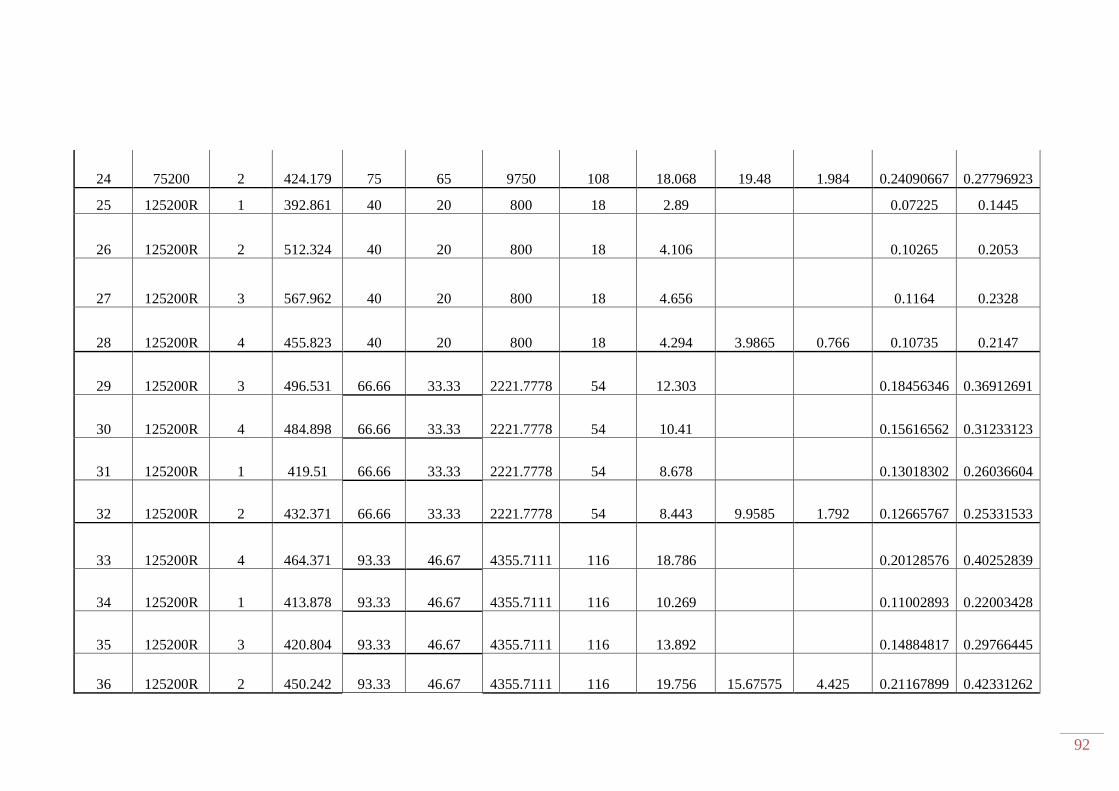
92
24 75200 2 424.179 75 65 9750 108 18.068 19.48 1.984 0.24090667 0.27796923
25 125200R 1 392.861 40 20 800 18 2.89 0.07225 0.1445
26 125200R 2 512.324 40 20 800 18 4.106 0.10265 0.2053
27 125200R 3 567.962 40 20 800 18 4.656 0.1164 0.2328
28 125200R 4 455.823 40 20 800 18 4.294 3.9865 0.766 0.10735 0.2147
29 125200R 3 496.531 66.66 33.33 2221.7778 54 12.303 0.18456346 0.36912691
30 125200R 4 484.898 66.66 33.33 2221.7778 54 10.41 0.15616562 0.31233123
31 125200R 1 419.51 66.66 33.33 2221.7778 54 8.678 0.13018302 0.26036604
32 125200R 2 432.371 66.66 33.33 2221.7778 54 8.443 9.9585 1.792 0.12665767 0.25331533
33 125200R 4 464.371 93.33 46.67 4355.7111 116 18.786 0.20128576 0.40252839
34 125200R 1 413.878 93.33 46.67 4355.7111 116 10.269 0.11002893 0.22003428
35 125200R 3 420.804 93.33 46.67 4355.7111 116 13.892 0.14884817 0.29766445
36 125200R 2 450.242 93.33 46.67 4355.7111 116 19.756 15.67575 4.425 0.21167899 0.42331262
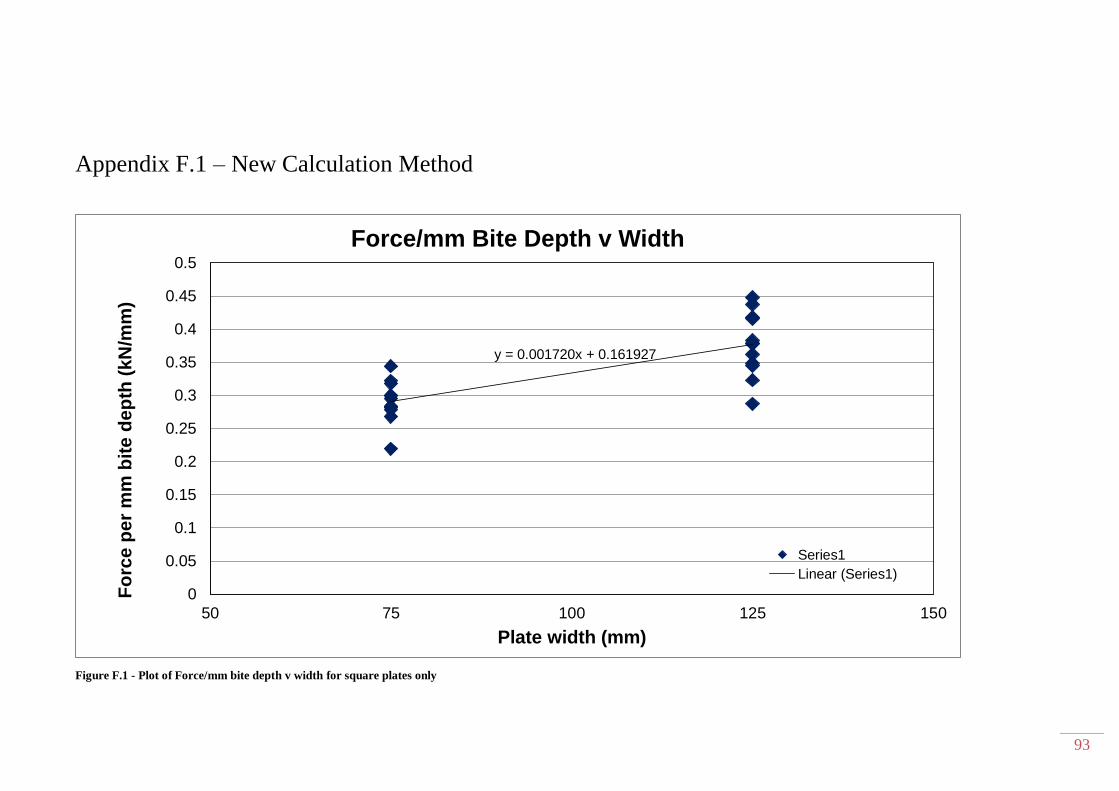
93
Appendix F.1 – New Calculation Method
Figure F.1 - Plot of Force/mm bite depth v width for square plates only
y = 0.001720x + 0.161927
0
0.05
0.1
0.15
0.2
0.25
0.3
0.35
0.4
0.45
0.5
50 75 100 125 150
Fo
rce p
er
mm
bit
e d
ep
th (
kN
/mm
)
Plate width (mm)
Force/mm Bite Depth v Width
Series1
Linear (Series1)
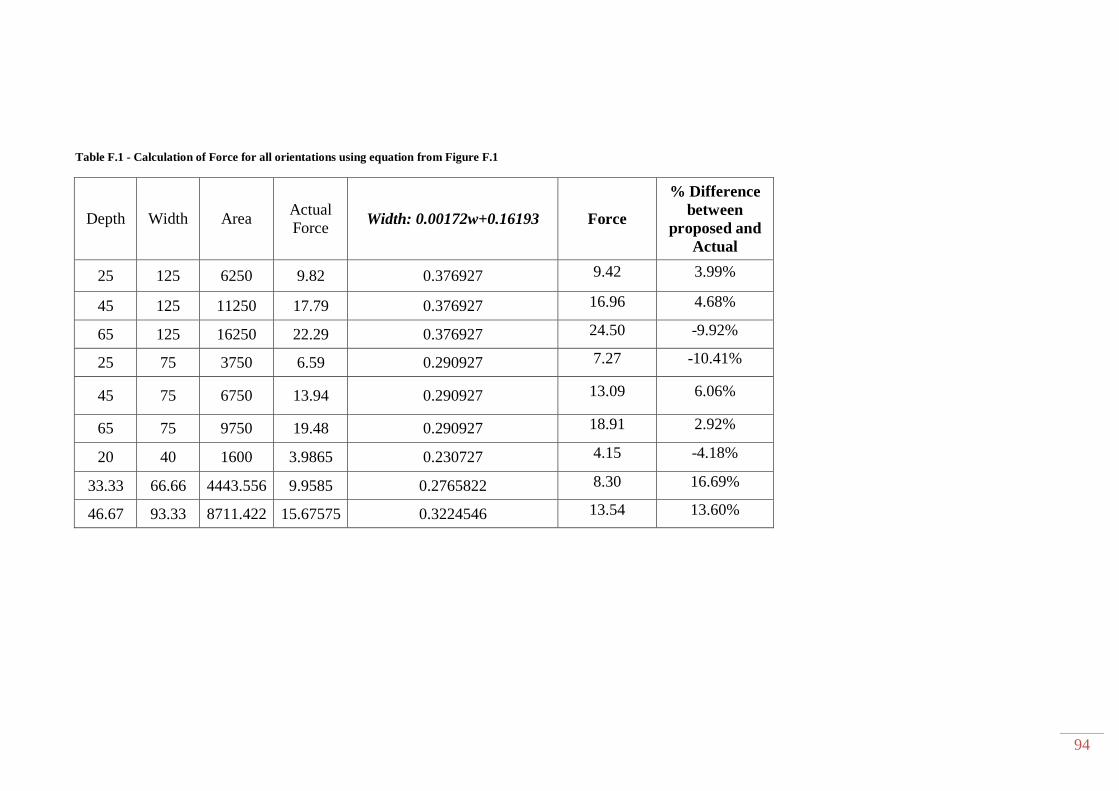
94
Table F.1 - Calculation of Force for all orientations using equation from Figure F.1
Depth Width Area Actual
Force Width: 0.00172w+0.16193 Force
% Difference
between
proposed and
Actual
25 125 6250 9.82 0.376927 9.42 3.99%
45 125 11250 17.79 0.376927 16.96 4.68%
65 125 16250 22.29 0.376927 24.50 -9.92%
25 75 3750 6.59 0.290927 7.27 -10.41%
45 75 6750 13.94 0.290927 13.09 6.06%
65 75 9750 19.48 0.290927 18.91 2.92%
20 40 1600 3.9865 0.230727 4.15 -4.18%
33.33 66.66 4443.556 9.9585 0.2765822 8.30 16.69%
46.67 93.33 8711.422 15.67575 0.3224546 13.54 13.60%
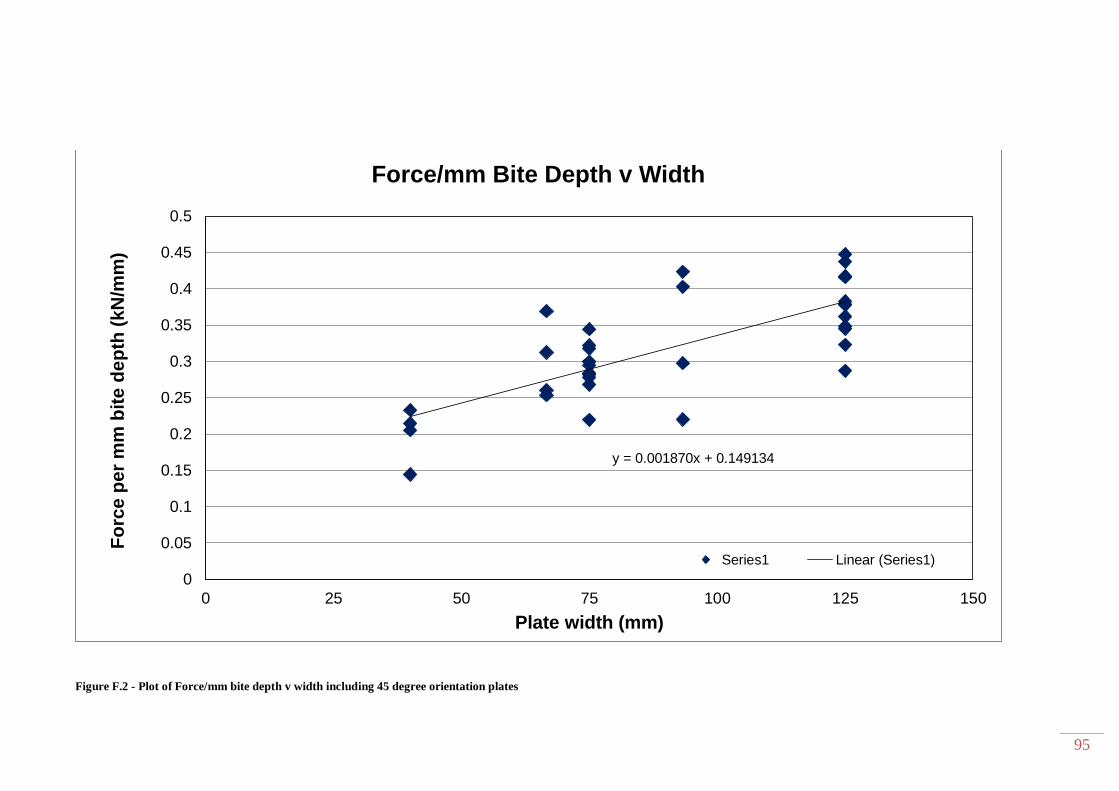
95
Figure F.2 - Plot of Force/mm bite depth v width including 45 degree orientation plates
y = 0.001870x + 0.149134
0
0.05
0.1
0.15
0.2
0.25
0.3
0.35
0.4
0.45
0.5
0 25 50 75 100 125 150
Fo
rce p
er
mm
bit
e d
ep
th (
kN
/mm
)
Plate width (mm)
Force/mm Bite Depth v Width
Series1 Linear (Series1)
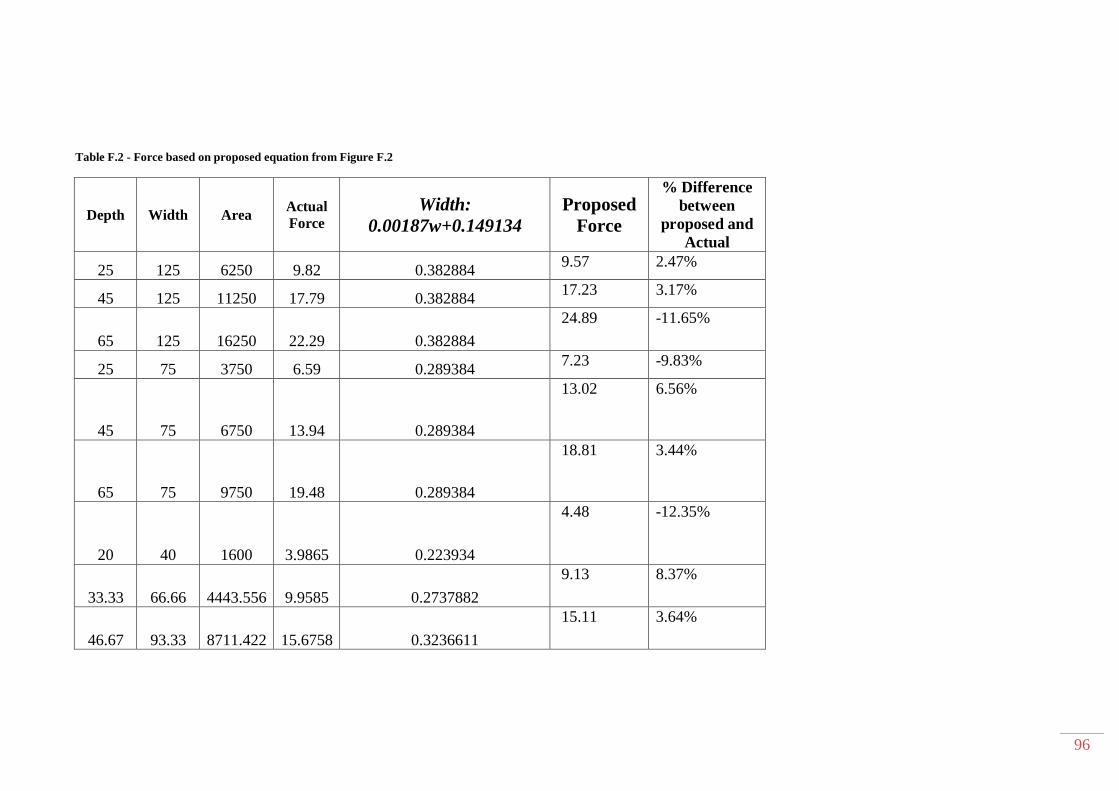
96
Table F.2 - Force based on proposed equation from Figure F.2
Depth Width Area Actual
Force Width:
0.00187w+0.149134
Proposed
Force
% Difference
between
proposed and
Actual
25 125 6250 9.82 0.382884 9.57 2.47%
45 125 11250 17.79 0.382884 17.23 3.17%
65 125 16250 22.29 0.382884
24.89 -11.65%
25 75 3750 6.59 0.289384 7.23 -9.83%
45 75 6750 13.94 0.289384
13.02 6.56%
65 75 9750 19.48 0.289384
18.81 3.44%
20 40 1600 3.9865 0.223934
4.48 -12.35%
33.33 66.66 4443.556 9.9585 0.2737882
9.13 8.37%
46.67 93.33 8711.422 15.6758 0.3236611
15.11 3.64%
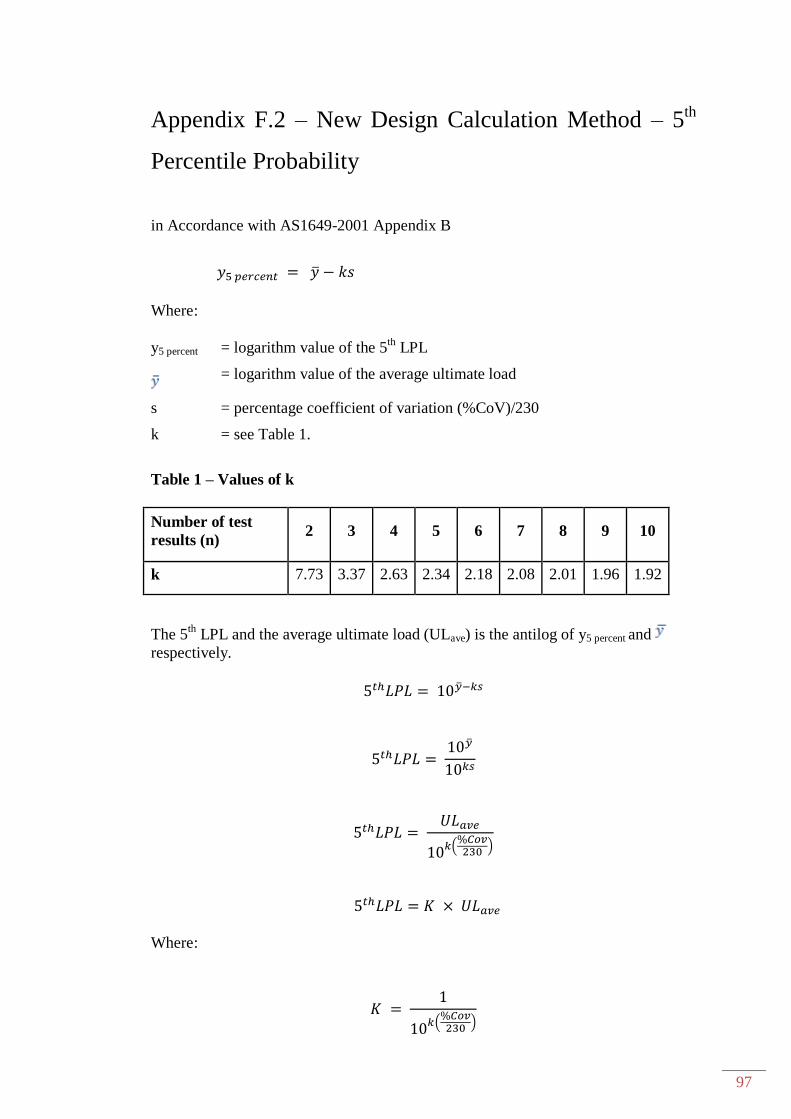
97
Appendix F.2 – New Design Calculation Method – 5th
Percentile Probability
in Accordance with AS1649-2001 Appendix B
Where:
y5 percent = logarithm value of the 5th
LPL
= logarithm value of the average ultimate load
s = percentage coefficient of variation (%CoV)/230
k = see Table 1.
Table 1 – Values of k
Number of test
results (n) 2 3 4 5 6 7 8 9 10
k 7.73 3.37 2.63 2.34 2.18 2.08 2.01 1.96 1.92
The 5th
LPL and the average ultimate load (ULave) is the antilog of y5 percent and
respectively.
(
)
Where:
(
)

98
Therefore:
n = 9
k = 1.96
Bite
Width
Bite Depth Average Actual
Ultimate Failure
Load (kN)
Standard
Deviation
%Cov
125 25 9.815 1.193 12
125 45 17.794 1.790 10
125 65 22.290 2.990 13
75 25 6.587 0.756 11
75 45 13.936 0.537 4
75 65 19.480 1.984 10
60 30 3.987 0.766 19
100 50 9.956 1.792 18
140 70 15.676 4.425 28
Average %Cov = 14
K = 0.76
So take
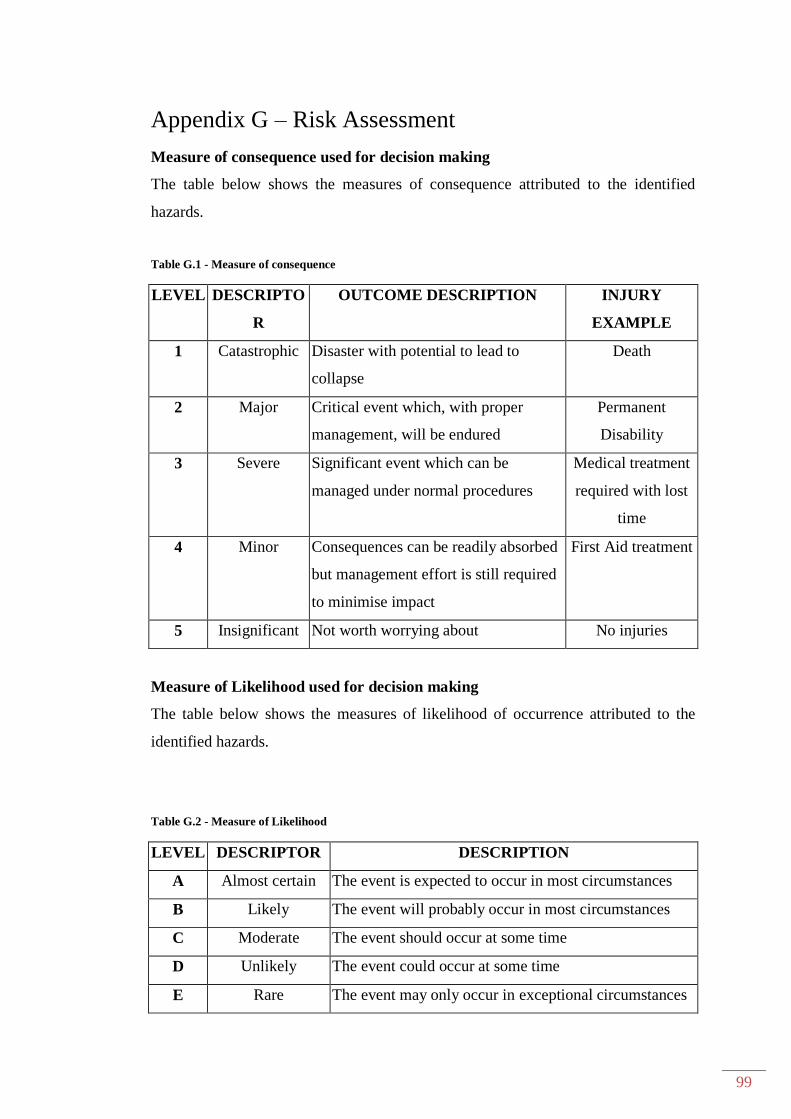
99
Appendix G – Risk Assessment
Measure of consequence used for decision making
The table below shows the measures of consequence attributed to the identified
hazards.
Table G.1 - Measure of consequence
LEVEL DESCRIPTO
R
OUTCOME DESCRIPTION INJURY
EXAMPLE
1 Catastrophic Disaster with potential to lead to
collapse
Death
2 Major Critical event which, with proper
management, will be endured
Permanent
Disability
3 Severe Significant event which can be
managed under normal procedures
Medical treatment
required with lost
time
4 Minor Consequences can be readily absorbed
but management effort is still required
to minimise impact
First Aid treatment
5 Insignificant Not worth worrying about No injuries
Measure of Likelihood used for decision making
The table below shows the measures of likelihood of occurrence attributed to the
identified hazards.
Table G.2 - Measure of Likelihood
LEVEL DESCRIPTOR DESCRIPTION
A Almost certain The event is expected to occur in most circumstances
B Likely The event will probably occur in most circumstances
C Moderate The event should occur at some time
D Unlikely The event could occur at some time
E Rare The event may only occur in exceptional circumstances
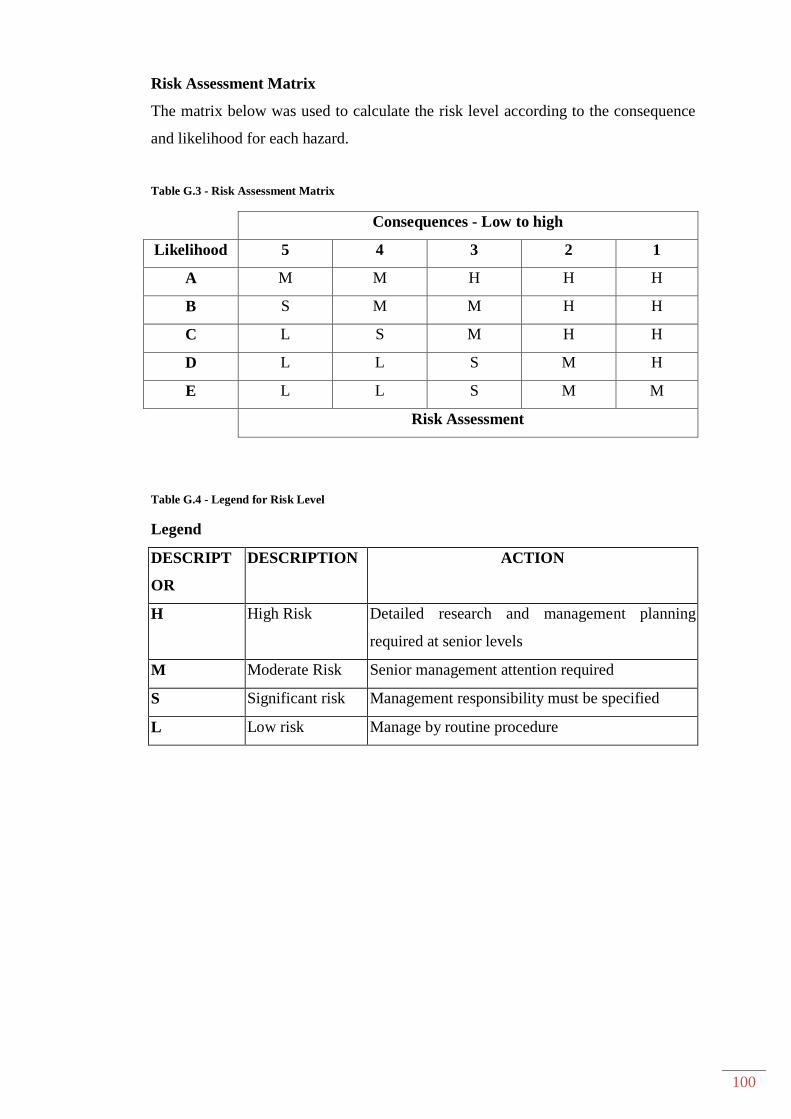
100
Risk Assessment Matrix
The matrix below was used to calculate the risk level according to the consequence
and likelihood for each hazard.
Table G.3 - Risk Assessment Matrix
Consequences - Low to high
Likelihood 5 4 3 2 1
A M M H H H
B S M M H H
C L S M H H
D L L S M H
E L L S M M
Risk Assessment
Table G.4 - Legend for Risk Level
Legend
DESCRIPT
OR
DESCRIPTION ACTION
H High Risk Detailed research and management planning
required at senior levels
M Moderate Risk Senior management attention required
S Significant risk Management responsibility must be specified
L Low risk Manage by routine procedure

101
Radiata Pine (T2 Treated)
ITEM HAZARD CONSEQNCE LIKELI
-
HOOD
RISK
LEVEL
EXISTING PROTECTION &/OR REQUIRED ACTION
1 Back Injury caused by the weight of
pre-cut samples
5 B M MANAGEMENT: Ordered material in lengths up to 2.4m so
single person can handle
2 Fingers/feet – Crush injury while
handling
5 D L MANAGEMENT: Ordered material in lengths up to 2.4m so
single person can handle
3 T2 Treatment 4 D L MANAGEMENT: Use appropriate PPE as described in the
Material Safety Data Sheet (MSDS)
Gang-Nail Plates
ITEM HAZARD CONSEQNCE LIKELI
-
HOOD
RISK
LEVEL
EXISTING PROTECTION &/OR REQUIRED ACTION
1 Cuts from plates while handling
plates
4 B M MANAGEMENT: A safety data sheet is available for nail plates,
wear appropriate PPE (gloves) and ensure that appropriate
treatment available for cuts etc.

102
Drop Saw
ITEM HAZARD CONSEQNCE LIKELI
-
HOOD
RISK
LEVEL
EXISTING PROTECTION &/OR REQUIRED ACTION
1 Risk of cutting 5 D L MANAGEMENT: Ensure required guards are in place and
working prior to connection to power
2 Dust during timber cutting – Eye and
breathing risk
4 A M MANAGEMENT: Wear appropriate PPE as described in MSDS
3 Noise – Ears 4 A M MANAGEMENT: Use appropriate PPE
Drill Press
ITEM HAZARD CONSEQNCE LIKELI-
HOOD
RISK
LEVEL
EXISTING PROTECTION &/OR REQUIRED ACTION
1 Risk of cutting 5 D L MANAGEMENT: Ensure required guards are in place and
working prior to connection to power
2 Drill bit gripping in material, causing
material to spin
5 D L MANAGEMENT: Ensure that material is gripped in suitable
vice and/or is positioned so that if drill bit grips, material cannot
spin.
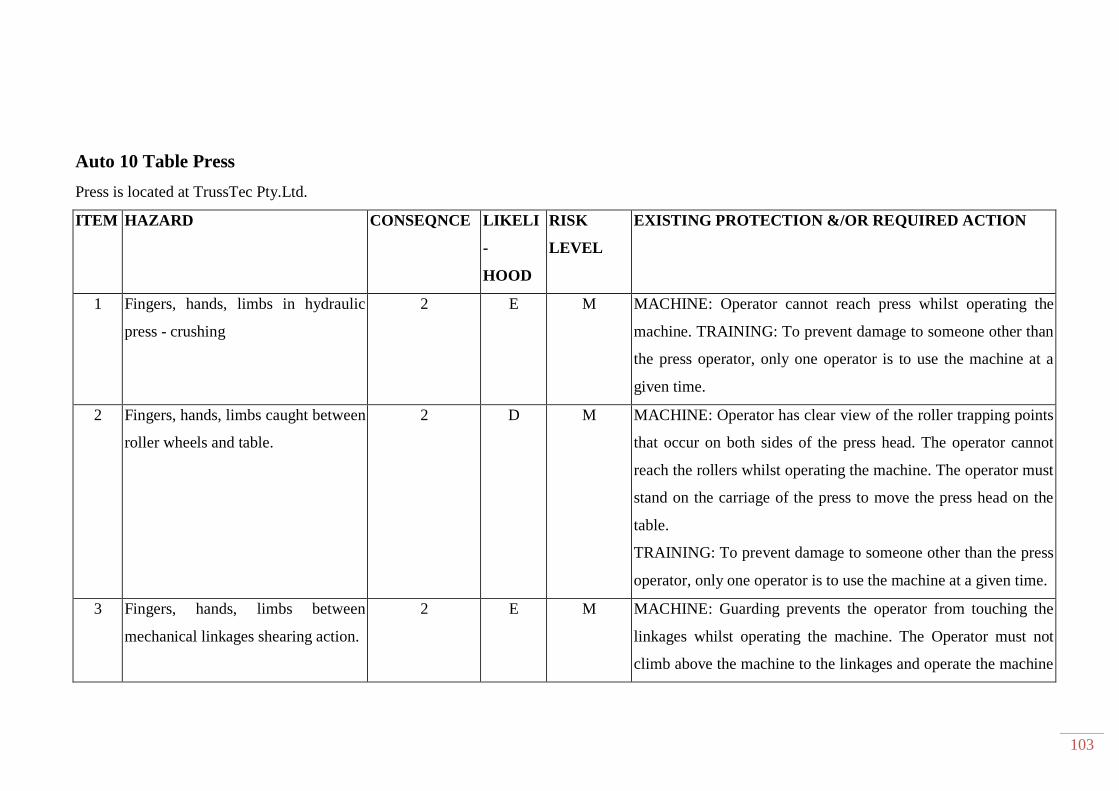
103
Auto 10 Table Press
Press is located at TrussTec Pty.Ltd.
ITEM HAZARD CONSEQNCE LIKELI
-
HOOD
RISK
LEVEL
EXISTING PROTECTION &/OR REQUIRED ACTION
1 Fingers, hands, limbs in hydraulic
press - crushing
2 E M MACHINE: Operator cannot reach press whilst operating the
machine. TRAINING: To prevent damage to someone other than
the press operator, only one operator is to use the machine at a
given time.
2 Fingers, hands, limbs caught between
roller wheels and table.
2
D
M
MACHINE: Operator has clear view of the roller trapping points
that occur on both sides of the press head. The operator cannot
reach the rollers whilst operating the machine. The operator must
stand on the carriage of the press to move the press head on the
table.
TRAINING: To prevent damage to someone other than the press
operator, only one operator is to use the machine at a given time.
3 Fingers, hands, limbs between
mechanical linkages shearing action.
2 E
M MACHINE: Guarding prevents the operator from touching the
linkages whilst operating the machine. The Operator must not
climb above the machine to the linkages and operate the machine
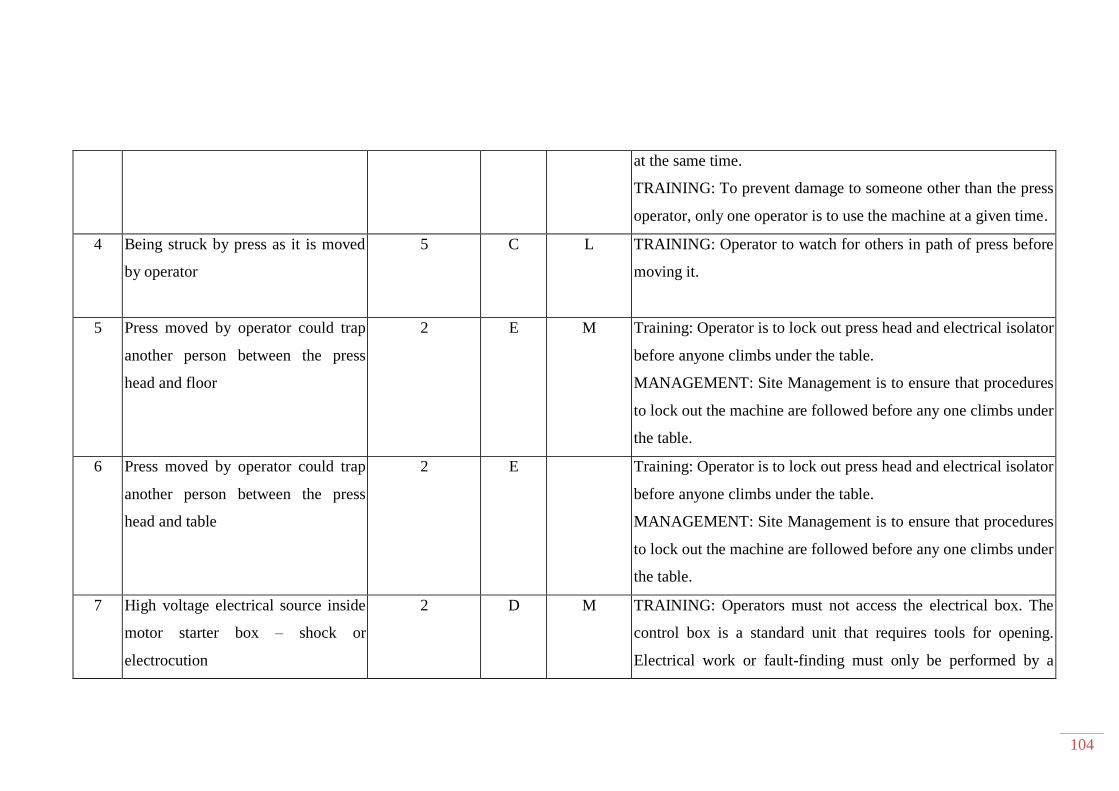
104
at the same time.
TRAINING: To prevent damage to someone other than the press
operator, only one operator is to use the machine at a given time.
4 Being struck by press as it is moved
by operator
5 C L TRAINING: Operator to watch for others in path of press before
moving it.
5 Press moved by operator could trap
another person between the press
head and floor
2 E M Training: Operator is to lock out press head and electrical isolator
before anyone climbs under the table.
MANAGEMENT: Site Management is to ensure that procedures
to lock out the machine are followed before any one climbs under
the table.
6 Press moved by operator could trap
another person between the press
head and table
2 E Training: Operator is to lock out press head and electrical isolator
before anyone climbs under the table.
MANAGEMENT: Site Management is to ensure that procedures
to lock out the machine are followed before any one climbs under
the table.
7 High voltage electrical source inside
motor starter box – shock or
electrocution
2 D M TRAINING: Operators must not access the electrical box. The
control box is a standard unit that requires tools for opening.
Electrical work or fault-finding must only be performed by a

105
qualified electrician.
Operators never to reach under table unless press is locked out.
Operator is to lock out press head and electrical isolator before
anyone reaches or climbs under the table or removes the end
covers.
8 High voltage electrical source on
busbars underneath table – shock or
electrocution
2 D M Training: Operator is to lock out press head and electrical isolator
before anyone reaches or climbs under the table or removes the
end covers.
MANAGEMENT: Site Management is to ensure that procedures
to lock out the machine are followed before any one climbs under
the table or the end covers are removed.
9 High pressure hydraulic fluid - leaks
or burst hoses - skin penetration,
damage to eyes, striking by hoses.
2 D M TRAINING: Operators must report leaks immediately. Hydraulic
leaks should be address immediately by a qualified person.
Fittings and hoses must only be tightened or replaced with the
hydraulic pump electrically isolated. Suitable eye-wear must be
worn whilst testing the hydraulic system after maintenance work.
10 Site specific issues of housekeeping
and workstation layout - potential for
slip/trip/fall due to nail plates or
2 C H TRAINING: Operators are encouraged to keep a tidy
workstation. MANAGEMENT: Site management responsible for
providing adequate waste bins and systems for good

106
timber on floor, or inappropriate or
contaminated floor surface.
housekeeping.
11 Site specific issues of lighting and
operator fatigue.
3 C M MANAGEMENT: Site management is responsible for providing
adequate lighting at the operator's workstation.
12 Site specific issues of hot or cold
operator causing discomfort or
fatigue
3 C M MANAGEMENT: Site management is responsible for providing
appropriate climate control at the operator's workstation.
13 Sawdust not generated by machine,
but common to machine locations
and can cause respiratory conditions.
3 A H MANAGEMENT: Site management responsible for workstation
air quality.
14 The Auto 8 & 10 does not generate
noise levels requiring hearing
protection, but excess noise created
by saws is common to the machine
environment and usually requires
hearing protection
3 B M MANAGEMENT: Site management responsible for providing
hearing protection where appropriate.
The dB reading during normal operation is
(MiTek Australia Auto 10 Operators Manual)
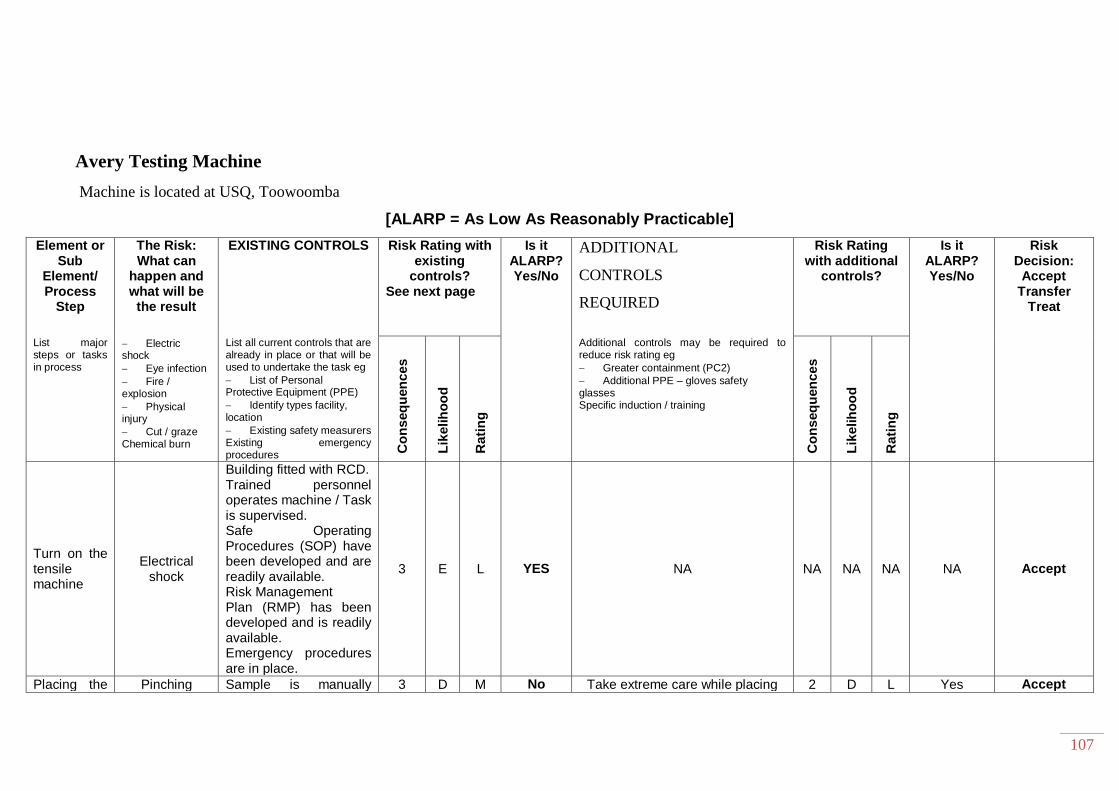
107
Avery Testing Machine
Machine is located at USQ, Toowoomba
[ALARP = As Low As Reasonably Practicable]
Element or Sub
Element/ Process
Step
The Risk: What can
happen and what will be
the result
EXISTING CONTROLS Risk Rating with existing
controls? See next page
Is it ALARP? Yes/No
ADDITIONAL
CONTROLS
REQUIRED
Risk Rating with additional
controls?
Is it ALARP? Yes/No
Risk Decision:
Accept Transfer
Treat
List major steps or tasks in process
Electric shock
Eye infection
Fire / explosion
Physical injury
Cut / graze Chemical burn
List all current controls that are already in place or that will be used to undertake the task eg
List of Personal Protective Equipment (PPE)
Identify types facility, location
Existing safety measurers Existing emergency procedures C
on
seq
uen
ce
s
Lik
elih
oo
d
Rati
ng
Additional controls may be required to reduce risk rating eg
Greater containment (PC2)
Additional PPE – gloves safety glasses Specific induction / training
Co
ns
eq
uen
ce
s
Lik
elih
oo
d
Rati
ng
Turn on the tensile machine
Electrical shock
Building fitted with RCD. Trained personnel operates machine / Task is supervised. Safe Operating Procedures (SOP) have been developed and are readily available. Risk Management Plan (RMP) has been developed and is readily available. Emergency procedures are in place.
3 E L YES NA NA NA NA NA Accept
Placing the Pinching Sample is manually 3 D M No Take extreme care while placing 2 D L Yes Accept

108
sample on the machine
Cutting Hitting
Crushing
placed into position by trained personnel/ Task is supervised. Clamps are manually operated by the trained personnel. The trained personnel will operate machine. Safe Work Procedures (SWP) have been developed and is readily available. Safe Operating Procedures (SOP) have been developed and are readily available. Risk Management Plan (RMP) has been developed and is readily available. Emergency procedures are in place.
samples. Keep body as much as practical outside of the machine incase of power failure causing
cross arm to drop
Wear appropriate PPE (Glasses, Gloves, Safety Boots)
Perform the tensile testing
Breaking the sample
Debris could fly from the
fracture
Wearing eye protection during the tensile testing process or should be far from machine by about 1m distance. Safe Work Procedures (SWP) have been developed and is readily available. Safe Operating
2 E L YES NA NA NA NA NA Accept
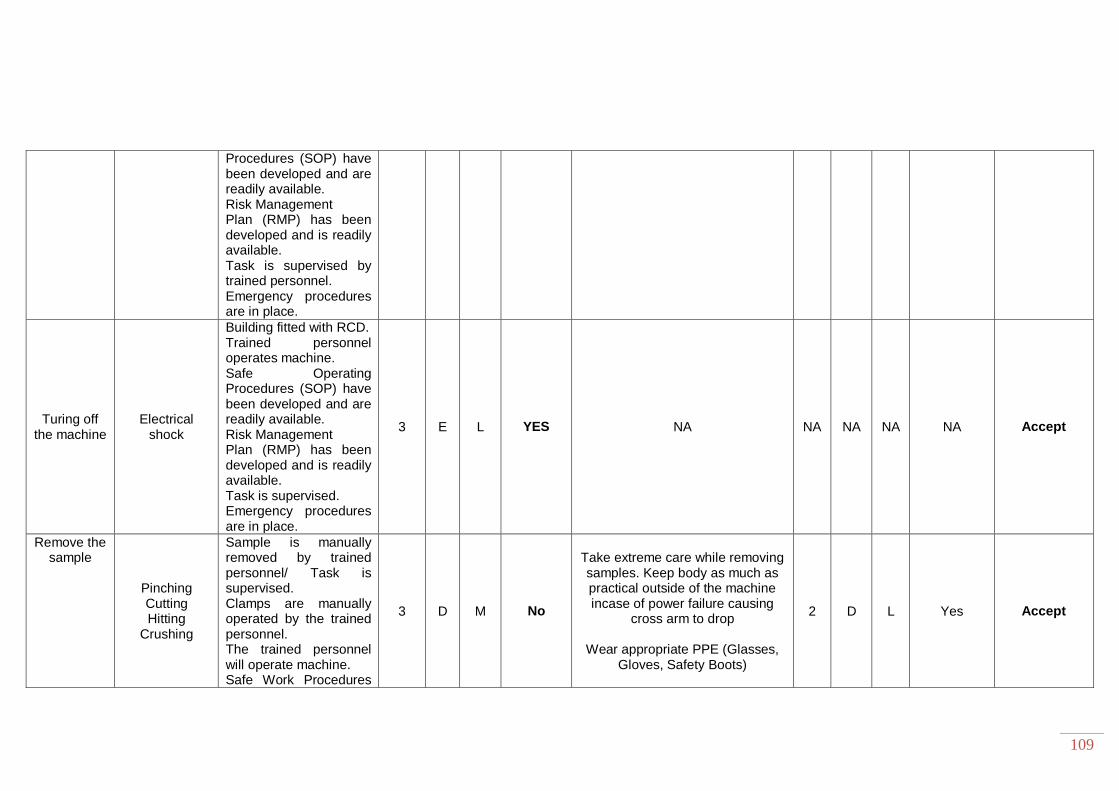
109
Procedures (SOP) have been developed and are readily available. Risk Management Plan (RMP) has been developed and is readily available. Task is supervised by trained personnel. Emergency procedures are in place.
Turing off the machine
Electrical shock
Building fitted with RCD. Trained personnel operates machine. Safe Operating Procedures (SOP) have been developed and are readily available. Risk Management Plan (RMP) has been developed and is readily available. Task is supervised. Emergency procedures are in place.
3 E L YES NA NA NA NA NA Accept
Remove the sample
Pinching Cutting Hitting
Crushing
Sample is manually removed by trained personnel/ Task is supervised. Clamps are manually operated by the trained personnel. The trained personnel will operate machine. Safe Work Procedures
3 D M No
Take extreme care while removing samples. Keep body as much as practical outside of the machine incase of power failure causing
cross arm to drop
Wear appropriate PPE (Glasses, Gloves, Safety Boots)
2 D L Yes Accept
110
(SWP) have been developed and is readily available. Safe Operating Procedures (SOP) have been developed and are readily available. Risk Management Plan (RMP) has been developed and is readily available. Emergency procedures are in place.