behaviors of treated hypertensive patients and patient demographic characteristics
TRANSCRIPT

Journal of Community Health, Vol. 13, No. l, Spring 1988
B E H A V I O R S OF T R E A T E D H Y P E R T E N S I V E P A T I E N T S A N D P A T I E N T D E M O G R A P H I C
C H A R A C T E R I S T I C S
Jeanne M. Tschann, Ph.D., T. Elaine Adamson, M.P.H., Thomas J. Coates, Ph.D., and David S. Gullion, M.D.
ABSTRACT: The relationships between self-reported hypertension- related patient behaviors and patient demographic characteristics were examined in a sample of 2,044 patients being treated for hyper- tension in 111 pr imary care medical practices. The patient behaviors of sodium intake, weight, alcohol, exercise, relaxation and adherence to medication regimen could be predicted to some extent by patient demographic characteristics. Whether patients recalled receiving advice from their physicians about these behaviors could also be pre- dicted by patient demographic characteristics. Patients demograph- ically similar to physicians, i.e., male, younger, more educated and White, repor ted receiving more advice from their physicians. Patients with behavioral problems who received relatively less advice from their physicians included: less educated younger patients whose sodium intake was relatively high; younger and less educated over- weight women; overweight Black patients; and older women who exercised less than average.
I N T R O D U C T I O N
This paper examines whether the hypertension-related behav- iors of treated hypertensive patients and the counseling patterns of physicians can be predicted by patient demographic characteristics. Ideally, hypertension treatment makes use of both drug and behavior therapies. Accumulating evidence from controlled trials suggests that behavioral therapies are effective in lowering blood pressure. ~ Among the most efficacious therapies are reduction of dietary sodium, ~,~,~
Jeanne M. Tschann, Ph.D. is an Assistant Research Psychologist, University of California, San Francisco, Department of Medicine, San Francisco, California. T. Elaine Adamson, M.P.H. is Specialist, University of California, San Francisco, Deparunent of Medicine, San Francisco, Caliior- ma. Thomas J. Coates, Ph.D. is Associate Professor in Residence, University of California, San Francisco, Division of General Internal Medicine, San Francisco, California. David S. Gullion, M.D. is Associate Clinical Professor, University of California, San Francisco, Department of Medicine, San Francisco, California.
Supported by the National Heart, Lung and Blood Institute Grant R I8 HL31305. Address requests for reprints to: Jeanne M. Tschann, Ph.D., University of Calitornia,
Department of Medicine, AC-18, San Francisco, CA 94143.
© 1988 Human Sciences Press 19
20 JOURNAL OF COMMUNITY HEALTH
weight r educ t ion , 4'5 aerobic exercise, 6 m o d e r a t e use o f alcohol, 7 and use o f re laxa t ion t echn iques? ' ' Behaviora l t r e a t m e n t o f h y p e r t e n s i o n has been r e c o m m e n d e d par t icular ly for pa t ients with mi ld hype r t en - sion, a n d as an ad junc t to d r u g t h e r a p y for pat ients with m o r e severe hype r t ens ion . ~° In add i t ion , h y p e r t e n s i o n may be con t ro l l ed w h e n med ica t i on is c o m b i n e d with behaviora l therapies .
T h e research ques t ion is f r a m e d to ident i fy g r o u p s o f hype r t en - sive pa t ien ts who are m o r e or less likely to pract ice hea l th fu l behaviors , to receive counse l i ng f r o m physicians, or to want m o r e i n f o r m a t i o n f r o m thei r physicians. Physicians r e p o r t f rus t ra t ion with the i r ability to p r o m o t e behav io r changes a m o n g thei r pa t ients? ~ Moreover , t he re is some ev idence ind ica t ing that , at least in the case o f smoking , physicians are mos t likely to counse l the i r sickest pat ients , a l t h o u g h it is the rela- tively hea l th ie r pa t ients who are mos t likely to c h a n g e as a resul t o f phys ic ian counse l ing . ~ E x a m i n a t i o n o f the pa t t e rns o f advice given by physicians may sugges t ways in which physicians cou ld be m o r e effect ive in mot iva t ing pa t ien ts for lifestyle c h a n g e for h y p e r t e n s i o n control .
M E T H O D S
The research reported here was part of a randomized controlled trial of the effectiveness of a physician education program in hypertension. Physi- cians were taught both medication and behavioral approaches to hypertension therapy. Baseline measures included medical record abstraction and self- administered surveys of hypertensive patients in the care of 111 primary care physicians in private practice.
P r o c e d u r e
Primary care physicians from seven counties in the San Francisco Bay Area were invited to participate in the study. Invitations to participate were sent to all primary care physicians listed in the San Francisco yellow pages and to all primary care staff members of selected hospitals in the other counties. Nephrologists and cardiologists were not recruited because it was expected that they were already providing excellent care to hypertensives. Each physician received an informational letter accompanied by a postcard to obtain more information. Those who returned the postcard received a more detailed letter and a study enrollment form. Those who did not return the enrollment form were contacted by telephone and invited to participate. Altogether, 9.41% (n = 111) of the physicians originally contacted agreed to take part in the study.

Jeanne M. Tschann et al. 21
When a physician had agreed to participate in the study, the office staff obtained a list of 30 recently seen hypertensive patients. For the purposes of the study, hypertensives were defined as patients who had the diagnosis of hypertension and also had a diastolic blood pressure reading of < 90 mm Hg at some time in the past while in that physician's care. Additional eligibility crite- ria were that patients had been in the physician's care for at least four months, were 80 years old or younger, had no terminal illness, and could read and write English or Spanish. The office staff were asked to make a list of such patients by reviewing computer lists or insurance forms that were coded for a diagnosis of hypertension and selecting patients consecutively to avoid bias. Medical records of these patients were reviewed by the researchers, who ab- stracted the records of the 2,583 patients who actually met all eligibility criteria. Information obtained from the medical record included medications pre- scribed, blood pressure level, and weight.
To obtain information about patient behaviors, self-administered surveys were sent to the patients, accompanied by a cover letter from the physi- cian's office. The initial response rate was 69%. About one month later, surveys were re-sent to nonrespondents; this step raised the response rate to 79%, or 2,044 patients.
Physician Sample
The 111 physicians who participated in the study had a mean of 46 years of age; 5% were female, and 13% were other than white. Most were internists (50%) or family physicians (44%); the remainder were general practitioners.
A random sample of 10% (n = 107) of the nonparticipating physicians was drawn to assess possible differences between participating and nonpartici- pating physicians. Nonparticipants did not differ from participating physicians in age (M nonparticipants = 43.92 years old) or gender (nonparticipants = 4% female). Although a similar proportion of nonparticipants were internists (59%), nonparticipants were less likely to be family practitioners (22%) and more likely to be general practitioners (19%) than participating physicians, X 2 (2) = 15.13, p < .001.
Patient Sample
The demographic characteristics of the 2,044 patients who responded to the survey are shown in Table 1. Respondents were compared to nonre- spondents (n = 539) on gender, age, and whether their diastolic blood pressure (DBP) was controlled. Controlled DBP was defined as <90 mmHg for pa- tients under 65 years of age, and < 95 mmHG for patients 65 or older. Respon- dents and nonrespondents did not differ according to gender (re- spondents = 56% female; nonrespondents = 54% female). Respondents were

22 JOURNAL OF COMMUNITY HEALTH
older (M = 60.81) than nonresponden t s (M = 57.11) t (796) = - 5.95, p < .001. Respondents ' DBP was more likely to be in control (70%) than mmre- spondents ' DBP 58%, X ~ (1) = 27.56, p < .001.
Description o f Variables
All variables were obtained f rom the patient survey, with the exception o f weight, which was obtained f rom medical records. Physician records were cons idered to be a more accurate source o f weight than the patient survey would have been.
T h e demograph ic variables were patient sex, age, years o f education, ethnicity (Caucasian, Black and other) and living situation (living alone or with others).
Behavioral variables consisted o f repor ted sodium intake, relative weight, alcohol consumption, amoun t of exercise, relaxation practices, and adhe rence to medicat ion regimen. Most behavioral variables were composites o f several items f rom the pat ient survey. As of ten as possible, measures devel- oped by o the r researchers were used. Sodium intake was comprised o f two variables. T h e first, used by Dahl, j:' was a 5-point i tem measur ing f requency o f salt used at the table (1 = never, to 5 = all the time). T h e second was a sodium score der ived f rom the n u m b e r o f times a patient ate 27 d i f ferent high-sodium foods in the previous week; the measure was developed by a National Insti tute o f Heal th panel but never published. These two moderate ly corre la ted (r = .23) sodium variables were s tandardized and summed to create sodium intake. Sodium intake was then t rans formed so that values could range f rom 0 to 100, with a mean of 50.
Quetelet 's Body Mass Index [BMI = weight (kg)/height (m) 2] was used as an indicator o f relative weight. A value grea ter than 24.5 for men or 23.5 for women indicated that they were overweight; a value o f 27 or more tor men, or 26 or more for women indicated obesity. ~
Alcohol consumpt ion was measured by total n u m b e r of drinks o f any type consumed on a typical day in the past week. This was a s tandard method o f measur ing quanti ty o f alcohol use. T M All types o f drinks (bottles or cans of" beer, glasses o f wine, ounces o f hard liquor and ounces o f a f t e rd inner drinks) were weighted equally. Patients who repor ted having four or more drinks per day were classified as heavy drinkers.
T h e exercise measure was based on the interview and scoring proce- du r e used by the Stanford Hear t Disease Prevent ion Program. T h e score was the total o f 18 types o f exercise a patient may have engaged in dur ing the previous week. Each type o f exercise was weighted according to its aerobic value (1 = not at all aerobic, 3 = potentially aerobic) and multiplied by the n u m b e r o f minutes per week the patient r epor t ed engaging in that exercise. Patients were classified as engaging in potentially aerobic exercise if they

Jeanne M. Tschann et al. 23
reported doing exercise with an aerobic weighting of 3 (e.g., jogging, swimming laps).
Survey questions about relaxation techniques included yoga, medita- tion and deep muscle relaxation. A simple method of scoring responses was used, as these questions had not been included in other surveys. Patients prac- ticing any of these techniques at least once in the previous week received a score of 1; those practicing no relaxation technique received a score of 0.
Adherence to medication regimen was measured by means of a 4-item scale developed by Green? 7 Adherence scores could range from 0 (not at all adherent) to 100 (completely adherent).
Patient perception variables were advice received and desire for more information. Advice received was based on patient recall of whether the physi- cian had given advice in seven areas: taking hypertension medication, side effects from medication, and the five behavioral areas of sodium intake, weight reduction (if applicable), alcohol consumption (if applicable), relaxation practices, and exercise. Advice scores were the number of topics on which advice was received as a percentage of the total topics on which advice could have been given. Scores could range from 0 to 100%. Desire for more infl)r- mation was based on patients' reports of whether or not they wanted to receive more information about the same seven topics. Again, scores could range t¥om 0% to 100%.
Statistical Analyses
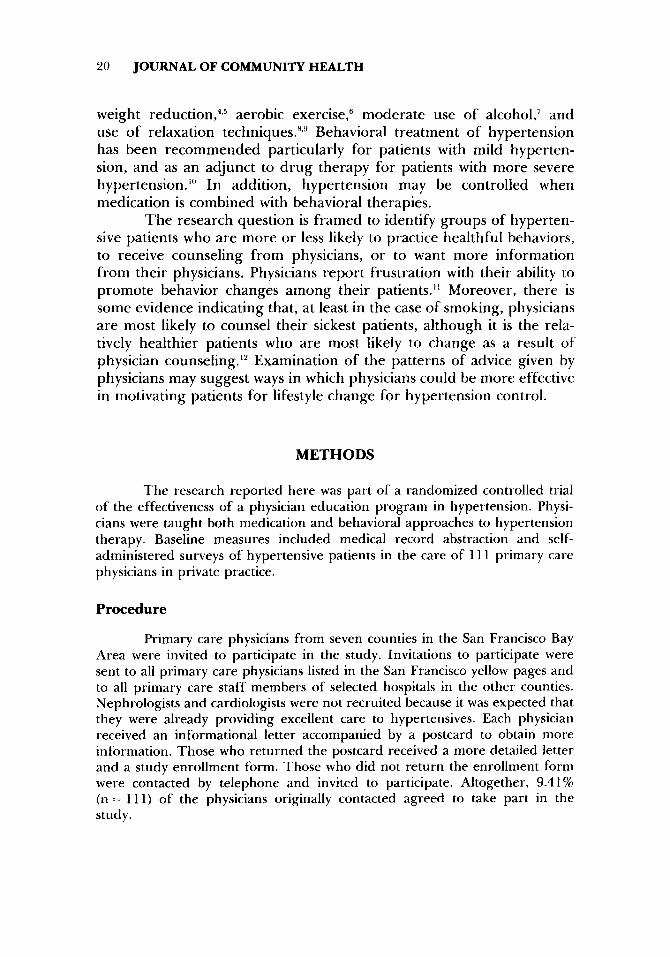
A series of hierarchical multiple regressions was computed to explore the relationship of patient demographics to behaviors and patient perceptions. The demographic variables were entered on the first step, and the interac- tion terms were entered on the second step. In each regression, one of the behavioral or patient perception variables was the dependent variable. A Bonferroni family confidence coefficient was utilized; because a total of eight multiple regression analyses were computed, only probability levels <.00625 were considered to be significant.
R E S U L T S
Descript ive statistics o f pat ients on all variables used in the analy- ses are p r e s e n t e d in Tab le 1. T w e n t y pe rcen t o f pat ients used salt at least some o f the time. A total o f 69% of pat ients were overweight . Twenty - f ive pe rcen t o f pat ients had fou r or m o r e dr inks per day. Th i r ty - seven pe rcen t o f pat ients were engag ing in aerobic exercise, and 26% used re laxat ion techniques . Al together , 63% of the pat ients

24 JOURNAL OF COMMUNITY HEALTH
T A B L E 1
Descriptive Statistics For All Variables
Mean SD %
Demographic Characteristics Sex: female 56 Age 60.81 11.74 Years of education 12.42 3.25 Ethnicity: Caucasian 71
Black 15 Other 12
Living situation: alone 26
Hypertension-Related Behaviors Salt at table scale (1-5) 1.75 1.02
Use salt some of the time 13 Use salt most or all of the time 7
Sodium intake score (0-100) 50.00 10.00 Weight measure (Body Mass Index) 27.99 5.65
Percent overweight 69 Number of drinks per day 2.99 5.87
Four or more drinks per day 25 Exercise score (0-4000)
Doing aerobic exercise 37 Relaxation practice: yes 26 Medication adherence score (0-100) 85.61 22.98
Completely compliant 63
Patient Perception Variables Advice given score (0-100) 40.00 32.40 Desire for more information score (0-100) 35.70 30.70
412.85 627.80
repor ted that they were completely adheren t to their hypertension medication regimen. Patients also repor ted receiving advice on a mean of 40% of the topics which were applicable to them; because the number of applicable topics ranged from five to seven, this meant that patients received advice on a mean of two to three topics. Patients wanted more information regarding a mean of 36% of topics, or an average of two topics.
The results of the multiple regression analyses with each of the
~ f
C~.~
m ~
° ~
t l I ~ 1
I I 1 I I
I I
I I I I
I I I I I I
I I I
I l l I I
V

26 JOURNAL OF COMMUNITY HEALTH
behavioral and patient perception variables are shown in Table 2. Table 3 summarizes the results.
Sodium Intake
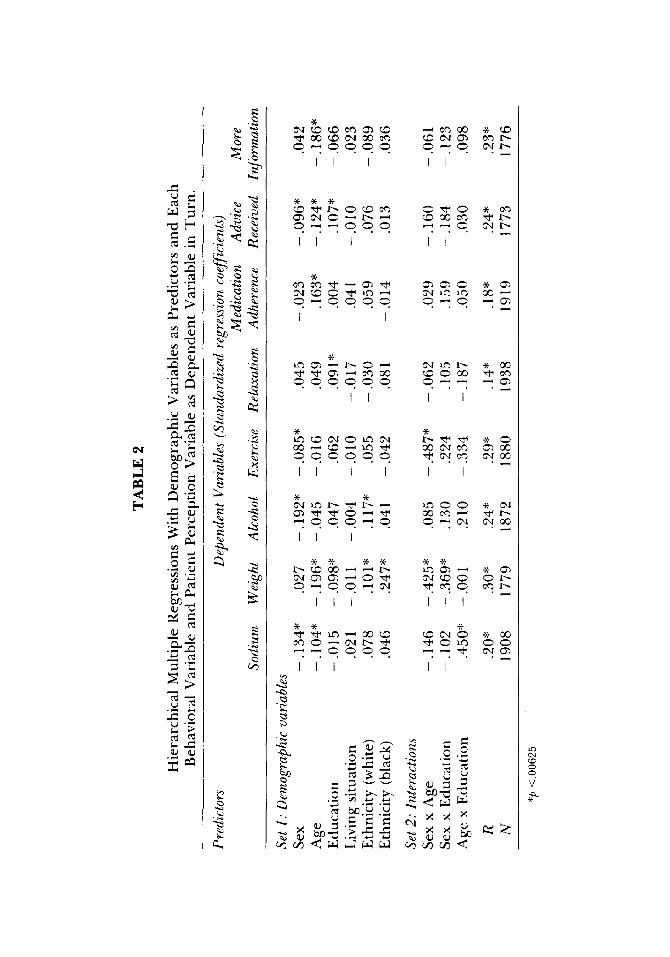
As indicated in Table 2, male patients used more sodium than female patients; younger patients used more sodium than older patients. A significant interaction between age and education was found. (See Figure 1.) Older, less educated patients used the least sodium and younger, less educated patients used the most sodium. More educated people of all ages fell between the two extremes.
Weight
Younger patients were more overweight than older patients; less educated people were more overweight than more educated patients. Ethnicity was also related to weight, with Blacks being the most over- weight (M = 30.88), Whites being less overweight (M = 27.60), and other ethnic groups being least overweight (M = 26.73). Two interactions were significant: for sex and age, and for sex and education (See Figure 1). The sex and age interaction revealed that young female patients were most overweight, young male patients were the second most overweight, and older patients, whether male or female, were the least overweight. The sex and education interaction showed that males tended to weigh the same regardless of education, while females were more overweight than others if they were less educated, and about the same amount overweight as men if more educated.
Alcohol
Male patients consumed more alcohol than female patients, more educated patients d rank more than less educated patients, and white patients d rank more (M = 3.38) than other ethnic groups (M Blacks = 1.87, M others = 1.56). No interactions were significant.
Exercise
Male patients exercised more than female patients. One interac- tion was significant, that between sex and age. (See Figure 1.) Younger male and female patients exercised about the same amount , while older males exercised somewhat more and older females exercised markedly less than the younger patients.

Jeanne M. Tschann et al. 27
TABLE 3
Summary of Significant Results for Multiple Regressions With Behavioral Variables as Dependent Variables
Sodium Weight Variable More Less More Less
Sex M e n > W o m e n
A g e Y o u n g e r > O l d e r
E d u c a t i o n ns
E t h n i c i t y ns
Sex x A g e ns
Sex x E d u c a t i o n ns
A g e x E d u c a t i o n Y o u n g e r less e d u c a t e d
O l d e r less e d u c a t e d
n s
Y o u n g e r > O l d e r
Less e d u c a t e d > M o r e e d u c a t e d
Black > W h i t e s > O t h e r s
Y o u n g e r w o m e n > O l d e r p a t i e n t s
Less e d u c a t e d w o m e n > O t h e r p a t i e n t s
n s
Alcohol Exercise More Less More l,ess
Sex Mel t > W o m e n Men > W o m e n
A g e ns us
E d u c a t i o n ns us
E t h n i c i t y W h i t e s > Blacks a n d o t h e r s ns
Sex x A g e ns O t h e r s > O l d e r w o m e n
Sex x E d u c a t i o n ns us
A g e x E d u c a t i o n ns ns
Relnxation Medication Adherence More Less More Less
S e x n s u s
A g e ns O l d e r > Y o t m g e r E d u c a t i o n M o r e e d u c a t e d > Less e d u c a t e d ns
E t h n i c i t y ns ns
Sex x A g e ns ns
Sex x E d u c a t i o n ns ns
A g e x E d u c a t i o n ns ns
Advice Received Desire ]br More Information More Less More Desire Less Desire
Sex M e n > W o m e n ns
A g e Y o u n g e r > O l d e r Y o u n g e r > O l d e r E d u c a t i o n M o r e e d u c a t e d > Less e d u c a t e d ns
E thn i c i t y us ns
Sex x A g e ns ns
Sex x E d u c a t i o n ns ns
A g e x E d u c a t i o n ns its

28 J O U R N A L O F C O M M U N I T Y H E A L T H
53
5 2
LU
I - - 5 1 _z :E
4 9
• OVER SO Y I ~ OLD - - - - - - \
\ UNDER 6 0 YRS O L D
\ \
~e
I I I < 1 2 12 > 1 2
YEARS OF EDUCATION
30
2 9
27
2 6
W O M E N - - - - - - e%, ~ . l i E N - -
i I 60 OR UNDER OVER 60
AGE
30
2 9
27
2 6
w O M E N - - - - - -
I d E N - - e \ \
\ \
\ \
~ e
600
5 O O
4oo ,,x, 3oo
I I I <12 12 >12
YEARS OF EDUCATION
200
FIGURE 1
W O M E N - - - - - -
M ~
t i 60 OR UNDER OVER 60
AGE
Interactions between demographic variables for patient behaviors. The figures present approximations o f the interactions obtained through multiple regression. For illustration in the figure, the variable age was split into two groups (60 or under; over 60), and education was split into three groups (less than 12 years; 12 years; more than 12 years). Unadjusted means were used.
Relaxation
More educated people were more likely than less educated people to use relaxation techniques. No interactions were significant.
Medication Adherence
Older patients were more adherent to their medication regimen than younger patients. No interactions were significant.

Jeanne M. Tschann et al. 29
Patient Perceptions
Male patients received more advice than female patients, younger people received more advice than older people, and more educated people received more advice than less educated people. No significant interaction effects for advice received were obtained.
When desire for more information was used as the dependent variable, the results indicated that younger people, who reported receiv- ing more advice, wanted more information than older people. No significant interactions were found.
Although ethnic group differences for advice received and desire for more information did not reach significance at the p < .00625 level, trends were found for both patient perception variables. Whites received more advice (M = 41.6) than other ethnic groups (M Blacks = 34.5; M others=31.1) , p< .03 . Similarly, Blacks and other ethnic groups had a greater desire for more information (M Blacks = 45.8; M others = 40.8) than Whites (M = 33.1), p < .009.
DISCUSSION
The research results reported here provide a view of hyper- tension-related behaviors in an applied context, namely, that of patients being treated by physicians in private practice. The findings indicate that hypertension-related patient behaviors can be predicted to some degree from patient demographic characteristics. In addition, examina- tion of the results suggests that some inconsistencies exist between patient behaviors and the amount of counseling patients receive from their physicians.
Before the findings are discussed in detail, it should be noted that several considerations limit drawing generalizations from them. First, the variables examined here, patient behaviors and advice re- ceived from physicians, were based on patient recall. More salient infor- mation tends to be recalled with greater accuracy than less salient infor- mation. Consequently, patient behaviors, which were based on recall of patients' own actions dur ing the previous week, were probably reported relatively accurately. Inasmuch as patient recall of information received dur ing visits to the physician is only about 50%, t~ the reported levels of advice received were probably lower than actual advice levels. However, patient recall is not related to such factors as age and intellectual ability, so that inaccuracies in patient recall cannot explain the findings of" this

30 JOURNAL OF COMMUNITY HEALTH
research, that certain demographic groups recalled receiving less advice than other groups. '8
A second consideration is that both the physician sample and, to a lesser extent, the patient sample consisted of volunteers. In the physi- cian sample, family practitioners were overrepresented and general practitioners were underrepresented. Because general practitioners have received less formal training than other primary care physicians, the physician sample might include a greater proportion of "good" physicians than the general population of physicians. Similarly, the patients responding to the survey were more likely than nonre- spondents to have diastolic blood pressure in control, and to be older than nonrespondents. Age was positively related to medication adher- ence in this study. Therefore, the patient sample might be more compli- ant than patients in general. Consequently, the percentage of patients reporting positive behaviors and physician counseling may be higher in this group than in the population of hypertensive patients being treated in private practice. However, a biased sample such as this would not be expected to increase the significance of study findings. Rather, such a sample tends to produce a narrower range of responses than an unbiased sample would, thus reducing relationships among variables and making statistical significance more difficult to achieve.
The greater difficulty in obtaining significant results is related to a third limitation of the study. The multiple correlation coefficients obtained for the eight multiple regression equations ranged from .14 to .30 (Table 2). While statistically significant, the demographic variables accounted for only 2% to 9% of the variance in these equations. Thus, demographic variables were somewhat weak predictors of hypertension- related patient behaviors, at least in this sample.
These limitations suggest that the findings reported here may not be generalizable beyond the study sample. Nevertheless, informa- tion about the behaviors of identifiable patient groups may provide clues to physicians about possible patterns in their own practices and increase their awareness of groups which may need more counseling.
The inconsistencies among what kinds of counseling patients need, want and receive can be seen most clearly by focusing on each demographic group in turn. For example, older people are imple- menting more behavioral changes than younger people [br sodium, weight, and medication adherence. The exception to the age trend is that older women exercise less than other groups. Interestingly, younger patients do report receiving more advice than older patients

Jeanne M. Tschann et al. 31
from their physicians about behavioral modifications, but also have a greater desire for more information than older patients.
Men and women seem to have different areas of weakness in regard to hypertension-related behaviors. Men consume more sodium and alcohol, while older women tend to exercise less than other groups, and younger and less educated women tend to be more overweight than other groups. Nevertheless, men report receiving more advice from their physicians than do women.
More educated patients are somewhat more likely than less educated patients to be implementing positive hypertension-related behaviors. More educated patients of all ages use less sodium than less educated younger patients; more educated patients of either sex are less likely to be overweight than less educated women; and more educated patients use relaxation techniques more often than less educated pa- tients. At the same time, more educated patients report receiving more advice from their physicians than less educated patients do.
White patients tend to drink more alcohol than other ethnic groups, but Blacks tend to be more overweight than other ethnic groups. Trends suggest that non-Whites receive less advice and want more information than Whites do.
The comparisons between behaviors and advice received for each demographic group suggest that regardless of actual patient be- haviors, physicians may be doing more counseling with patients more like themselves: male, younger, better educated, and white. Although some groups of more counseled patients do have specific counseling needs (such as Whites and males regarding drinking), several patient groups can be identified who have behavioral problems and are receiv- ing less counseling than other groups. These relatively neglected and more needy patients include less educated patients (younger, less edu- cated patients regarding sodium; less educated women regarding weight; and less educated patients regarding relaxation), Blacks (regarding weight), and women (younger and less educated women regarding exercise).
There are real barriers to communication between physicians and patients who are demographically different from their physicians. For example, Waitzkin'" has found that although less educated patients want as much information from physicians as more educated patients, they ask fewer questions. As a result, physicians provide less informa- tion and mistakenly believe that they are meeting the counseling needs of these patients. Similar barriers to satisfactory communication may

32 JOURNAL OF COMMUNITY HEALTH
exist between physicians and patients from other demographically different groups. The findings reported here suggest where physicians may best direct their counseling efforts to meet the needs of patient groups which have behavioral problems but receive less attention than other groups.
REFERENCES
1. Curb, JD. Long-term surveillance for adverse effects of anti-hyptertensive drugs. JAMA 253: 3263-3268, 1985.
2. Kaplan, NM. Non-drug treatment of hypertension: Ann oflnternal Med 102:359-373, 1985. 3. MacGregor, GA, Best, F, Cam, J, et al. Double-blind randomized crossover trial of moderate
sodium restriction in essential hypertension. Lancet 1:351-355, 1982. 4. Langford, HG, Blaufox, MD, Oberman, A, et al. Dietary therapy slows the return of hyper-
tension after stopping prolonged medication. JAMA 253:657-664, 1985. 5. Reisin, E, Abel, R, Modan, M, et al. Effect of weight loss without salt restriction on the reduc-
tion of blood pressure in overweight hypertension patients. N EngJ Med 298:1-6, 1978. 6. Roman, O, Camuzzi, AL, Villalon, E, Klenner, C. Physical training program in arterial hyper-
tension: a long-term prospective follow-up. Cardiology 67:230-243, 1981. 7. Klatsky, AL. The relationship of alcohol and the cardiovascular system. Ann Rev Nutr 2:51-71,
1982. 8. Patel, C, Marmot, MG, Terry, DJ. Controlled trial of biofeedback-aided behavioral methods
in reducing mild hypertension. Br MedJ 282: 2005-2008, 1981. 9. Engel, BT, Glasgow, MS, Garader, KR. Behavioral treatment of high blood pressure: lII.
Follow-up results and treatment recommendations. Psychosom Med 45:23, 1983. 10. The Joint National Committee on Detection, Evaluation, and Treatment on detection, evalua-
tion, and treatment of high blood pressure. Arch Intern Med 144:1045, 1984. 11. Andrews, G, MacMahon, SW, Austin, A, Byrne, DG. Hypertension: comparison of drug and
non-drug treatments. Br MedJ [Clin Res] 284:1523-1526, 1982. 12. Li, VC, Coates, TJ, Spielberg, L, Ewart, CK, Dorfman, S, Huster, WJ. Smoking cessation with
young women in public family planning clinics: The impact of physician messages and waiting room media. Preventive Medicine 13:4489, 1984.
13. Dahl, LK, Love, RA. Evidence for relationships between sodium (chloride) intake and human essential hypertension. Arch Intern Med 94: 525-531, 1954.
14. Jeffery, RW, Folsom, AR, Luepker, RV, et al. Prevalence of overweight and weight loss behavior in a metropolitan adult population: The Minnesota Heart Survey experience. Am J Public Health 74:349-352, 1984.
15. Room, R. The measurement and distribution of drinking patterns and problems in general populations. World Health Organization meeting of investigators on criteria for identifying and classi- fying disabilities related to alcohol consumption. Agenda item 3.3, Geneva, pp. 61-81, 1977.
16. Room, R. Measuring alcohol consumption in the United States: Methods and Rationales. Alcohol Epidemiology Section Meeting, Thirty-first International Institute on Prevention and Treatment of Alcohol Problems, Rome, 1985.
17. Green, LW, Levine, DM, Wolle, J, Deeds, S. Development of randomized patient education experiments with urban poor hypertensives. Patient Counseling and Health Ed 106-111, 1979.
18. Ley, P. Memory for medical information. BrJ Soc Clin Psychol 18:245-255, 1979. 19. Waitzkin, H. Doctor-patient communication: Clinical implications of social scientific research.
JAMA 252:2441-2446, 1984.