behavioral finance: fifa world cup expectations and stock
TRANSCRIPT
Behavioral Finance: FIFA World Cup Expectations and Stock Market
Success
By
Jeff Janousek
Abstract
Behavioral finance, defined as the combination of behavioral and cognitive psychology theory
with economics and finance to explain financial decisions, has grown in popularity over the last
several years. Behavioral finance has also expanded into sports as researchers seek to find and
explain anomalies that exist in the stock market. Existing research about sports is mixed, but
prior studies have found that FIFA World Cup soccer matches have a statistically significant
correlation with stock prices. This study further examines underlying factors that could influence
this correlation. Specifically, it introduces an expectations framework and differentiates game
outcomes based on whether the team exceeds, meets, or fails to meet expectations. Using
regression analysis, the study finds some evidence for this relationship and that failing to meet
expectations is correlated with a stock market decline during the World Cup.
Key Words: Behavioral Finance, Stock Market, World Cup, Sports, Expectations, Soccer
Submitted under the faculty supervision of Professor Budd, in partial fulfillment of the
requirements for the Bachelor of Science in Business, summa cum laude, Carlson School of
Management, University of Minnesota, Spring 2015.
1
1. Introduction
According to Facebook, 88 million global users made a record 280 million interactions (posts,
likes, and comments) during the 2014 FIFA World Cup Final, easily beating the record of 245
million interactions set by the 2013 Super Bowl. Beyond Facebook, many people argue that
soccer is the most popular sport in the world. In fact, 70% of males and 62% of females in
England said that the 2006 FIFA World Cup impacted their working lives (Kenny & Bradley
2006). With all of this excitement around the world, behavioral economists hypothesize that
outcomes of soccer matches (wins/losses) could impact a variety of economic phenomenon,
including financial markets.
Behavioral finance is sometimes defined as the study of psychological factors on the
economic decisions of individuals corresponding financial decisions. As behavioral economics
has expanded, some research indicates that sporting events can impact the stock market. This
thesis attempts to further explore the cause of this phenomenon by exploring the relationship
between FIFA World Cup (“World Cup”) expectations and stock market returns. Failure to meet
pay raise expectations has been shown to have a larger, longer lasting impact on an employee’s
happiness level than exceeding expectations (Mitra, Sachaubroeck, Shaw, & Duffy 2008). For
this reason, outcomes combined with expectations could be better linked to stock market changes
than just outcomes. By examining the World Cup and stock market returns, with relation to
expectations, one can examine the relationship between the World Cup and stock market.
An important aspect of this thesis is accurately capturing a country’s expectations about
its national soccer team. To do this, the thesis will use betting odds because they capture the
qualitative aspect of a country better than FIFA rankings. Betting odds also capture the idea that
gamblers and oddsmakers are not always rational. While national team rankings could be used as
2
a proxy for expectations, they do not capture the sentiment of the country and are often criticized
for over - or under-ranking certain teams due to the calculations made. For example, the
Brazilian national team, despite being considered one of the favorites in the tournament, was
ranked only 6th
in the world when the tournament started. The FIFA/Coca-Cola World Rankings
are also said to weight certain tournaments too heavily when the points are calculated. The ESPN
Soccer Power Index (SPI) is another ranking system often cited by soccer fans, but faces similar
problems. For these reasons, I assert that betting odds are a better proxy for expectations than
world rankings.
This thesis builds off of previous literature by integrating expectations in that some game
results may have been expected, while others might be unexpected. It is possible that unexpected
results and expected results elicit different responses from fans and investors, leading to different
stock market impacts. Previous literature has ignored this effect and examined results without
respect to expectations. This thesis empirically examines the effect of expected and unexpected
results on stock markets.
Multivariate regression models are used to examine the impact of unexpected wins,
expected wins, unexpected losses, and expected losses on the stock market. These models allow
the examination of these different results and their relationship with stock markets around the
world. This research on expectations is unique to this study and is the primary contribution to
literature.
Investors, behavioral economists, and general soccer fans could all be interested in this
topic. This research could help investors increase returns, while helping behavioral economists
examine the importance of expectations and potentially providing additional evidence against the

3
efficient market hypothesis. The next section will discuss previous literature, while additional
sections include the methodology, results, discussion, and conclusion.
2. Literature Review
Prior research shows that losses in the World Cup have lowered the stock market in a statistically
significant manner while wins increase the stock market. Little research has been done to explain
the underlying cause behind these findings. This paper further analyzes the reasons for the stock
market changes.
This section of the paper summarizes literature relevant to this thesis and gives a brief
background on the topic. First, I will look at the past research that has examined athletics as a
possible indicator of stock market changes. Then, I will narrow that idea to soccer and the FIFA
World Cup. Finally, I will discuss previous literature about the role of expectations in life.
2.1 Athletic Events as a Mover of the Stock Market
The Efficient Market Hypothesis states that people behave rationally and make rational
decisions. For the stock market, this means that stocks always incorporate new information and
that it is impossible for stocks to be overvalued or undervalued. Investors can only obtain higher
returns than the market by purchasing riskier assets. Over the past few decades, however,
research has shown that certain events and feelings appear to have an impact on financial
decisions at the micro and macro level. This has led to the expansion of behavioral economics,
which is a branch of economics that uses psychological ideas to understand consumers,
borrowers, and investors, as well as explain their effects on market prices, returns, and other
economic phenomenon.
A subset of this literature has looked specifically at the response of markets to sporting
events. A study by Edmans, García, and Norli (2007) investigated the effect of investor
4
sentiment on asset prices as it relates to sporting events. Among the sports studied, international
soccer matches had a strong correlation with asset prices decreasing after a loss. The researchers
captured the effect of a new variable that they called the “mood variable.” This research was
done across 39 countries and included next-day results after wins, losses, and ties. Expectations
were discussed because losses impacted the stock market much more than wins, but were not a
variable in the analysis. In this situation, expectations refer to the outcome anticipated by the
fans and investors of the sporting event. A result that surprises investors may impact investment
decisions, leading to purchasing or selling stocks and fluctuating stock prices.
At a more national level, Ashton, Gerrard, and Hudson (2003) examined the relationship
between England’s national soccer team matches and the FTSE 100, a share index of the 100
largest companies, by market capitalization, listed on the London Stock Exchange. These
matches included “friendly” matches when the team was not participating in a tournament,
“qualifying” matches when the team was attempting to qualify for a tournament, and “finals”
matches when the team was participating in a tournament. The researchers found that the “finals”
matches have a stronger correlation with stock market fluctuations than either “friendly” or
“qualifying” matches. This suggests that not all wins and losses are created equal. A loss in an
important match appears to have a larger psychological effect on investors than a relatively
unimportant match. The main limitation to this study was that only a single country was
examined. England, a country with a strong interest in soccer, was discussed with games from
1984 – 2002 included in the analysis.
Kaplanski and Levy (2010) expanded the scope of Ashton, Gerrard, and Hudson’s (2003)
study by looking at FIFA World Cup matches from 1950 – 2010. Similar to past researchers,
Kaplanski & Levy found that losses lowered the stock market at a greater magnitude than wins

5
increased the stock market. The researchers focused on the United States S&P500 index to
capture the effect that the World Cup may have on stocks. This captured losses for multiple
countries because of the high amount of foreign invested capital in the United States. The effect
of 32 countries and 64 matches appears to be statistically significant and large. This allows
investors to exploit predictable irrationality. The two missing pieces of this study were the lack
of research done into the underlying cause of the stock market changes and the limited scope. By
looking only at the United States, the researchers may have missed stronger relationships in other
countries due to differences in interest in soccer, amount of foreign investment, etc. as well as
the scale of the effect on a global basis.
2.2 Expectation Theory and the Stock Market
As a possible underlying reason behind the stock market dropping, it is important to
examine expectation theory. Mitra et al. (2008) researched the effect of failing to meet, meeting,
and exceeding pay raise expectations on an employee’s happiness. This research was restricted to
a university hospital, but may be representative of a person’s general psychology. The
researchers found that failing to meet expectations had an effect larger in magnitude than either
meeting expectations or exceeding expectations on worker happiness. The change in turnover
intentions was larger in magnitude for failing to meet expectations than meeting or exceeding
expectations. The researchers also discovered that higher expectations correlated with a larger
increase in turnover intentions. These findings are important in the context of this paper because
it may help explain why losses impact the stock market more than wins or draws.
Another important factor to take into account is the idea that people are generally overly
optimistic. Scheier, Carver, and Bridges (1994) found that people are generally over optimistic
and that it is a pervasive human trait. While they note that not everyone is generally optimistic,
6
optimism remains prevalent in a significant percentage of people. Armor and Taylor (2002)
found that people are more likely to maintain optimism despite evidence to the contrary. This is
important as it relates to this thesis because teams that are not favored to win still may have fans
that expect them to win the match. Thus, losing the match is more likely to fail to meet
expectations, while winning a game is more likely to only meet expectations. Fans are not likely
to adjust expectations because of biases towards their team and tendency to ignore evidence
against the bias.
This research explicitly examines the difference between losses that fail to meet
expectations (unexpected losses) and losses that met expectations (expected losses). Using
betting odds, expectations can be accounted for while also taking into account the result of the
match. An underlying assumption to this research is that not all losses (or wins) are equal
because of the expectations of fans and investors going into the game.
2.3 Gaps to be Filled
Overall, the main limitations of these research papers are the lack of further exploration of
potential underlying causes of the stock market changes and the focus on single countries. By
exploring an “expectations” variable, this paper further explores the relationship that previous
literature has established between wins/losses and the stock market. While simply failing to meet
expectations could cause some people to sell shares of stock, investors could believe that
economic factors may be negatively impacted due to the match result. For example, investors
could believe that people will spend less at retail stores, fewer tourists will visit the country, etc.
because the team didn’t do as well as expected. Failing to meet expectations could lead to a
selloff in the stock market, while exceeding expectations may lead investors to purchasing
additional stocks. In my thesis, expectations refer to a fanbase’s presumption regarding the

7
soccer match. The fans can expect to win, tie, or lose and the team’s performance relative to the
expectation determines whether the team fails to meet, meets, or exceeds expectations. For
example, a team that loses a game that it is expected to tie has failed to meet expectations.
Furthermore, the limited number of countries examined in current literature also represents a
limitation because it is possible that not all countries would react the same way. This paper
replaces wins and losses with unexpected wins, expected wins, unexpected losses, and expected
losses in an effort to further hone in on factors that may impact investor sentiment.
3. Methodology
This section examines my hypotheses, variables, data, and methods of analysis.
3.1 Hypotheses
Previous literature has correlated national soccer team losses in the FIFA World Cup with
a stock market loss. For example, Edmans, García, and Norli (2007) found that losses in
elimination games are associated with a next-day abnormal stock return of -49 basis points. This
new study predicts that these losses are not the sole cause of the stock market drop, but that
investors and fans were influenced by their expectations going into the match. In other words, a
surprise win or loss will have a larger affect than an expected win or loss. A win or loss is
“expected” based on the sentiment of oddsmakers, based on betting odds. If the actual result
matched the most likely result, then the team met expectations. Further, Ashton, Gerrard, and
Hudson (2003) found that the mean return after a drawn match was negative. On the other side of
the spectrum, literature has shown a weak correlation between wins and stock market gains that
were not always statistically significant. Edmans, et al. (2007) found that World Cup elimination
game victories only saw only a 9 basis point gain and it was not statistically significant.
8
Literature on the role of expectations on one’s happiness has shown that failing to meet
expectations has a larger, longer lasting impact on happiness than exceeding expectations. Mitra,
et al. (2008) examined the impact on pay raises and the propensity to meet expectations on
employee happiness and found that failure to meet employee expectations had a larger impact on
employee morale and led to increased turnover relative to exceeding expectations. This research
predicts that we will see a similar effect in the stock market due to failure to meet expectations.
All of these things lead to three predictions. First, the correlation between stock market
performance and failure to meet expectations will be stronger than the stock market
performance’s correlation with losses. Second, the study predicts that there will be a larger and
statistically significant stock market gain if a national team exceeds expectations with a surprise
win. Third, the stock market losses from failure to meet expectations (surprise losses) will be
larger than the stock market gains from ability to exceed expectations (surprise wins). These
ideas have led me to three hypotheses:
Hypothesis 1: A surprise loss will lead to a larger stock market decline than an expected
loss.
Hypothesis 2: A surprise win will lead to a larger stock market increase than an expected
win
Hypothesis 3: The absolute value of the stock market decline after a surprise loss will be
larger than the absolute value of the stock market increase after a surprise win.
Previous research has found that losses have a larger impact than wins on the stock
market. Even when separating surprise results from expected results, this thesis predicts that a
similar effect will occur. Thus, the effect of an expected loss will be larger than the effect of an
expected win.
Hypothesis 4: The absolute value of the stock market decline after an expected loss will
be larger than the absolute value of the stock market increase after an expected
win.
9
3.2 Measures/Variables and Data
To analyze the hypotheses, four measures were examined. My first measure was stock
index data from 27 of the 32 countries that participated in the 2014 World Cup. The percent
change in stock market index from close the day before the game to close the next trading day is
the dependent variable. Examining each country’s stock market allows for this study to capture
the stock price effect of the market that is likely to respond most strongly to the result of the
game. Using the change also establishes what the stock price “should” be and helps me evaluate
any possible abnormal returns. Two possible issues with this variable are that not all stock
markets are as liquid as the NYSE and that not all games are done on a trading day, which is
further discussed in the methodology section. Positive and negative feelings resulting from the
World Cup matches will likely dissipate over time, which could impact the resulting stock
market effect. Stock market information for each of these countries is available on Global
Financial Data (https://www-globalfinancialdata-
com.ezp1.lib.umn.edu/gfdplatform/Welcome.aspx)
Second, betting odds were used as a proxy for expectations. This explicit incorporation of
expectations drives the main point of my hypotheses and is my contribution to existing literature.
Unfortunately, betting odds from each individual country were difficult to obtain, so the author
used odds from the United Kingdom for all games. If these betting odds represent the United
Kingdom’s views of the games and not the home country, this analysis could prove to be
inaccurate due to the inability to properly capture expectations1. Betting odds were found on a
United Kingdom betting website, bet365.com, which aggregates many websites. The specific
odds selected were the mode of 24 individual odds sites. See Tables 1 and 2 for examples of
1 One could check by comparing betting odds in the United Kingdom to odds in other countries to determine if
material differences exist between countries.
10
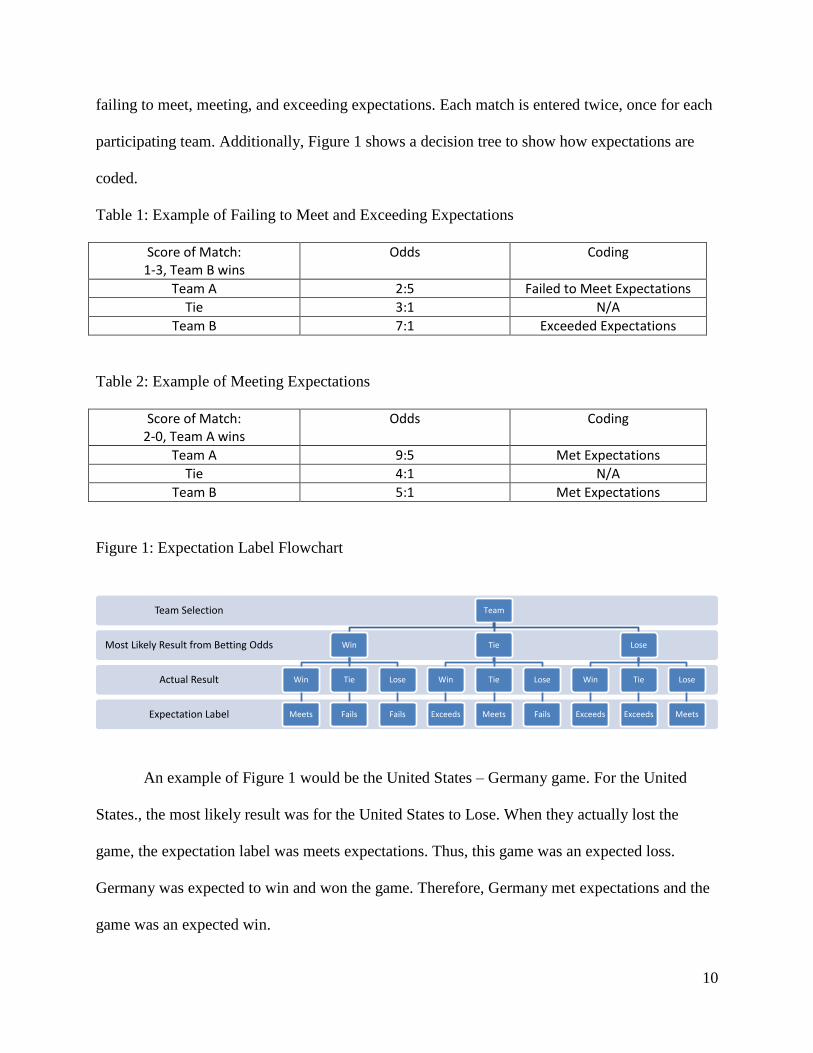
failing to meet, meeting, and exceeding expectations. Each match is entered twice, once for each
participating team. Additionally, Figure 1 shows a decision tree to show how expectations are
coded.
Table 1: Example of Failing to Meet and Exceeding Expectations
Score of Match: 1-3, Team B wins
Odds Coding
Team A 2:5 Failed to Meet Expectations
Tie 3:1 N/A
Team B 7:1 Exceeded Expectations
Table 2: Example of Meeting Expectations
Score of Match: 2-0, Team A wins
Odds Coding
Team A 9:5 Met Expectations
Tie 4:1 N/A
Team B 5:1 Met Expectations
Figure 1: Expectation Label Flowchart
An example of Figure 1 would be the United States – Germany game. For the United
States., the most likely result was for the United States to Lose. When they actually lost the
game, the expectation label was meets expectations. Thus, this game was an expected loss.
Germany was expected to win and won the game. Therefore, Germany met expectations and the
game was an expected win.
Expectation Label
Actual Result
Most Likely Result from Betting Odds
Team Selection Team
Win
Win
Meets
Tie
Fails
Lose
Fails
Tie
Win
Exceeds
Tie
Meets
Lose
Fails
Lose
Win
Exceeds
Tie
Exceeds
Lose
Meets

11
Third, the scores of the games themselves were used to help determine the goal
differential and match results. This information was gathered via the Fédération Internationale de
Football Association (FIFA) website.
3.3 Analysis
To evaluate my hypotheses, the primary tool used was multivariate regression. The
independent variables of surprise win, expected win, surprise loss, and expected loss are created
by combining betting odds and the scores of matches. Control variables used include goal
differential, the number of days between the end of the match and next trading day, and each
team’s soccer federation. The dependent variable is the change in stock index price. The
regression model used to evaluate my hypotheses is as follows:
∆𝑆𝑡𝑜𝑐𝑘 𝑀𝑎𝑟𝑘𝑒𝑡 = 𝛽0 + 𝛽1(𝑆𝑢𝑟𝑝𝑟𝑖𝑠𝑒 𝑊𝑖𝑛) + 𝛽2(𝐸𝑥𝑝𝑒𝑐𝑡𝑒𝑑 𝑊𝑖𝑛) + 𝛽3(𝑆𝑢𝑟𝑝𝑟𝑖𝑠𝑒 𝐿𝑜𝑠𝑠) +
𝛽4(𝐸𝑥𝑝𝑒𝑐𝑡𝑒𝑑 𝐿𝑜𝑠𝑠) + 𝛽5(𝑐𝑜𝑛𝑡𝑟𝑜𝑙 𝑣𝑎𝑟𝑖𝑎𝑏𝑙𝑒𝑠) + 𝜀
3.4 Appropriateness of Methodology
The use of secondary data from reliable sources is appropriate to analyze the four
hypotheses. The best available measures were selected to proxy for the variables required. With
that being said, there are some limitations and assumptions that should be discussed.
First, there are a number of outside factors that could influence a country’s stock market
on a given day. With a relatively small sample size, it is possible that a global event impacting
multiple stock markets had an impact on the stock returns during the FIFA World Cup. If this is
true, then that would impact the accuracy of the results. If further studies are done, then
increasing the sample size over a longer duration of time would help limit this risk.
Second, an underlying assumption being made is that there are enough investors with an
interest in the World Cup that their investment decisions could influence the stock market.

12
Countries with investors with a higher interest in soccer may see a bigger stock market impact
than countries with investors that don’t have an interest in soccer. While a reliable proxy for
interest for several countries was unavailable, a long-term study with reliable data about TV
ratings, or other data, may be able to overcome this limitation.
Third, as mentioned earlier, not all countries have a stock market and others may not be
sufficiently liquid to capture this type of reaction. The countries without a stock market limits the
sample size, while insufficiently liquid stock markets could fail to capture an effect captured by
markets that are more liquid.
Fourth, ties with any expectations are included in the intercept, as opposed to individual
variables, for two reasons. First, ties are unlikely to invoke a strong enough response from
investors to influence the stock market. Second, there was not sufficient data to split ties into
positive surprise ties (expecting to lose, but tying), negative surprise ties (expecting to win, but
tying), and expected to ties.
4. Results
This section of the paper describes the data and presents the results of the regression analysis.
4.1 Breakdown of Data
Due to some countries not having stock markets, data was used from 27 countries. A sample size
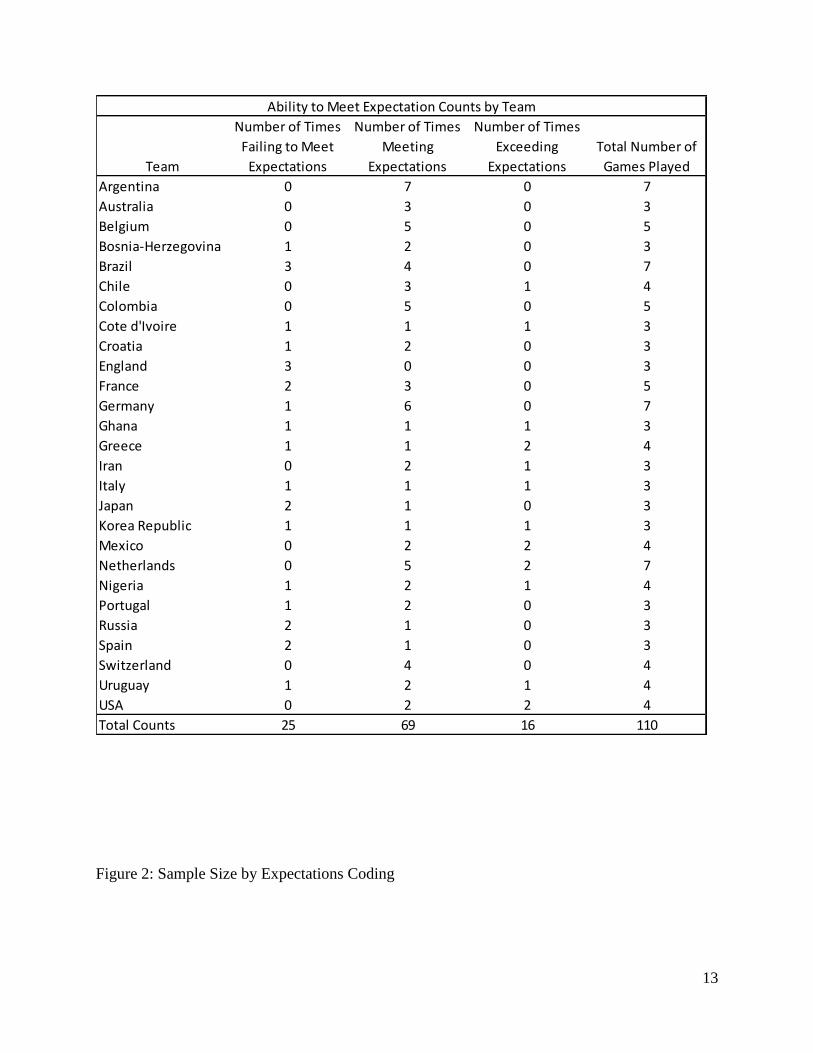
of 110 was collected from these 27 countries, as shown in Table 3 below. Table 3 also shows the
number of times each team failed to meet, met, and exceeded expectations throughout the World
Cup. Of the 110 data points, teams failed to meet expectations 25 times, met expectations 69
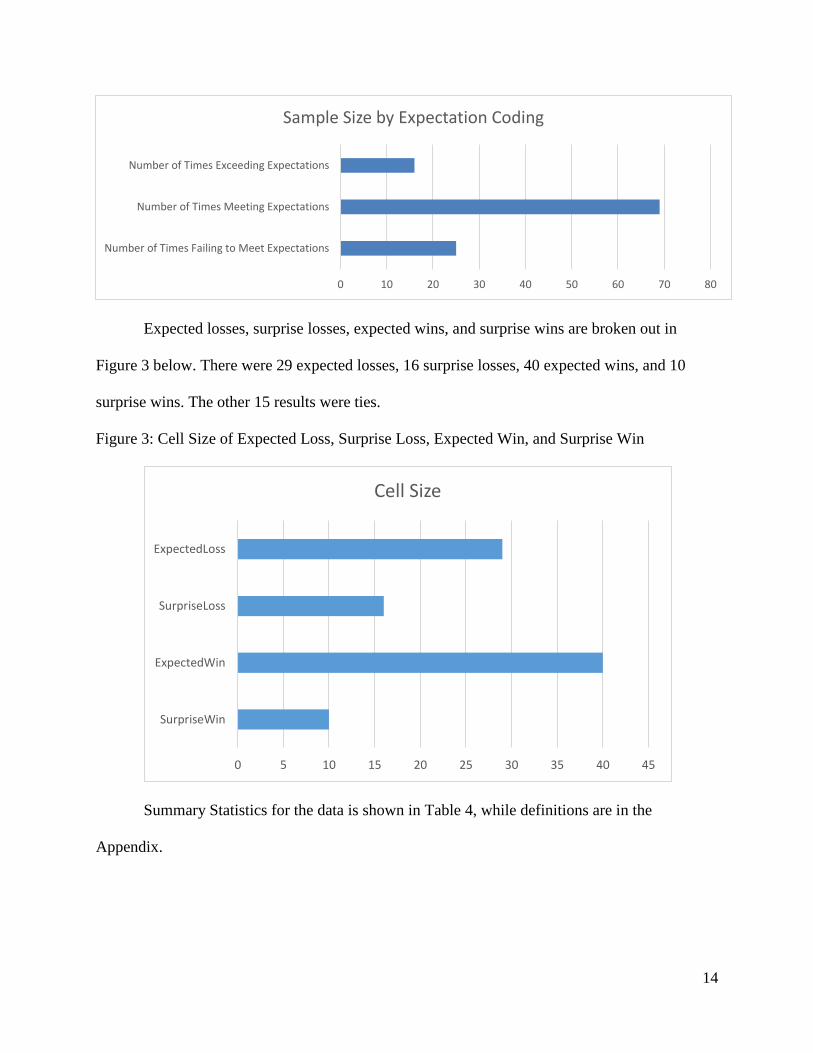
times, and exceeded expectations 16 times. This is shown graphically in Figure 2.
Table 3: Counts by Team Detailing Ability to Meet Expectations
13
Figure 2: Sample Size by Expectations Coding
Team
Number of Times
Failing to Meet
Expectations
Number of Times
Meeting
Expectations
Number of Times
Exceeding
Expectations
Total Number of
Games Played
Argentina 0 7 0 7
Australia 0 3 0 3
Belgium 0 5 0 5
Bosnia-Herzegovina 1 2 0 3
Brazil 3 4 0 7
Chile 0 3 1 4
Colombia 0 5 0 5
Cote d'Ivoire 1 1 1 3
Croatia 1 2 0 3
England 3 0 0 3
France 2 3 0 5
Germany 1 6 0 7
Ghana 1 1 1 3
Greece 1 1 2 4
Iran 0 2 1 3
Italy 1 1 1 3
Japan 2 1 0 3
Korea Republic 1 1 1 3
Mexico 0 2 2 4
Netherlands 0 5 2 7
Nigeria 1 2 1 4
Portugal 1 2 0 3
Russia 2 1 0 3
Spain 2 1 0 3
Switzerland 0 4 0 4
Uruguay 1 2 1 4
USA 0 2 2 4
Total Counts 25 69 16 110
Ability to Meet Expectation Counts by Team
14
Expected losses, surprise losses, expected wins, and surprise wins are broken out in
Figure 3 below. There were 29 expected losses, 16 surprise losses, 40 expected wins, and 10
surprise wins. The other 15 results were ties.
Figure 3: Cell Size of Expected Loss, Surprise Loss, Expected Win, and Surprise Win
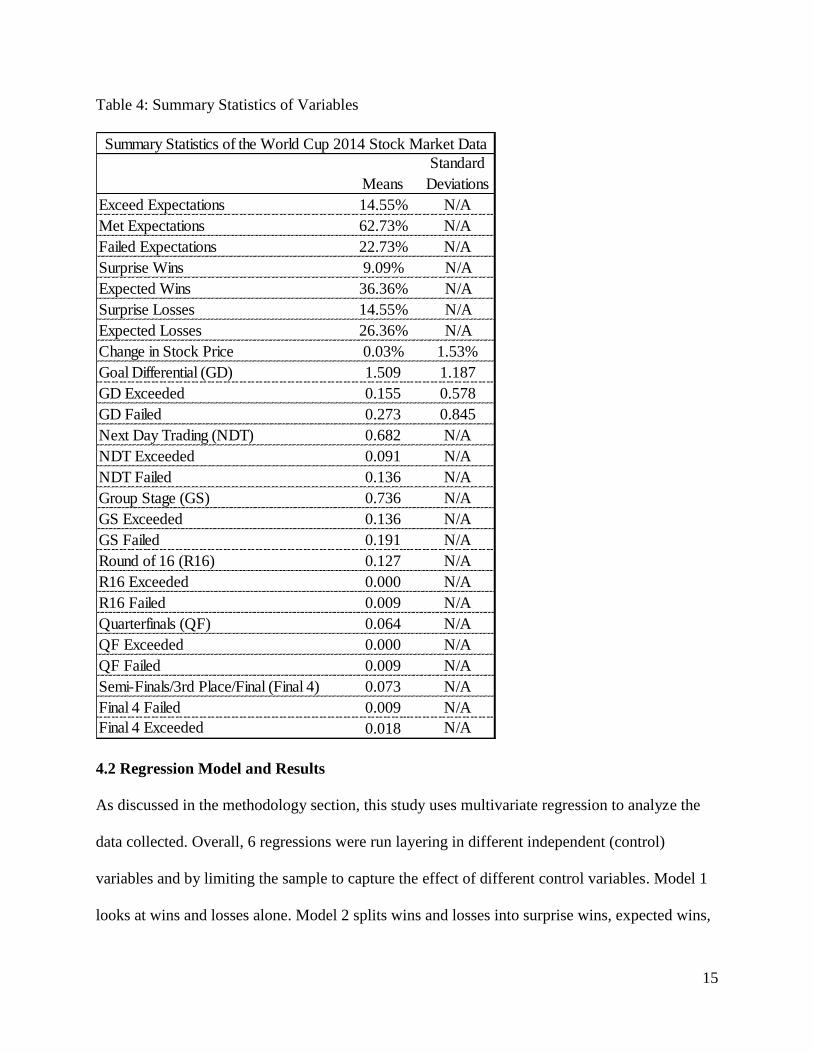
Summary Statistics for the data is shown in Table 4, while definitions are in the
Appendix.
0 10 20 30 40 50 60 70 80
Number of Times Failing to Meet Expectations
Number of Times Meeting Expectations
Number of Times Exceeding Expectations
Sample Size by Expectation Coding
0 5 10 15 20 25 30 35 40 45
SurpriseWin
ExpectedWin
SurpriseLoss
ExpectedLoss
Cell Size
15
Table 4: Summary Statistics of Variables
4.2 Regression Model and Results
As discussed in the methodology section, this study uses multivariate regression to analyze the
data collected. Overall, 6 regressions were run layering in different independent (control)
variables and by limiting the sample to capture the effect of different control variables. Model 1
looks at wins and losses alone. Model 2 splits wins and losses into surprise wins, expected wins,
Means
Standard
Deviations
Exceed Expectations 14.55% N/A
Met Expectations 62.73% N/A
Failed Expectations 22.73% N/A
Surprise Wins 9.09% N/A
Expected Wins 36.36% N/A
Surprise Losses 14.55% N/A
Expected Losses 26.36% N/A
Change in Stock Price 0.03% 1.53%
Goal Differential (GD) 1.509 1.187
GD Exceeded 0.155 0.578
GD Failed 0.273 0.845
Next Day Trading (NDT) 0.682 N/A
NDT Exceeded 0.091 N/A
NDT Failed 0.136 N/A
Group Stage (GS) 0.736 N/A
GS Exceeded 0.136 N/A
GS Failed 0.191 N/A
Round of 16 (R16) 0.127 N/A
R16 Exceeded 0.000 N/A
R16 Failed 0.009 N/A
Quarterfinals (QF) 0.064 N/A
QF Exceeded 0.000 N/A
QF Failed 0.009 N/A
Semi-Finals/3rd Place/Final (Final 4) 0.073 N/A
Final 4 Failed 0.009 N/A
Final 4 Exceeded 0.018 N/A
Summary Statistics of the World Cup 2014 Stock Market Data

16
surprise losses, and expected losses. Model 3 layers in control variables for same/next day
trading, group stage matches, goal differential, and the region of the team. Model 4 is the same
as Model 3, but the sample is limited to events where the market closed the same day of the
game or the next day. This is done to attempt to capture the effect of market timing with respect
to the end of the match. In this model, the sample is restricted to same-day and next-day trading.
Model 5 is similar to Model 3; however, the model includes controls for group stage matches.
This is done to capture the effect of the importance of a game. Since group stage matches have
lower-stakes than elimination matches, one would expect the effect of surprise wins, expected
wins, surprise losses, and expected losses to be lower in this model. Again, Model 6 has the same
variables as Model 3, but the sample is restricted to when the goal difference is greater than 1.
One would expect that restricting the sample to a higher goal would lead to a larger effect when
examining surprise wins, expected wins, surprise losses, and expected losses. These models’
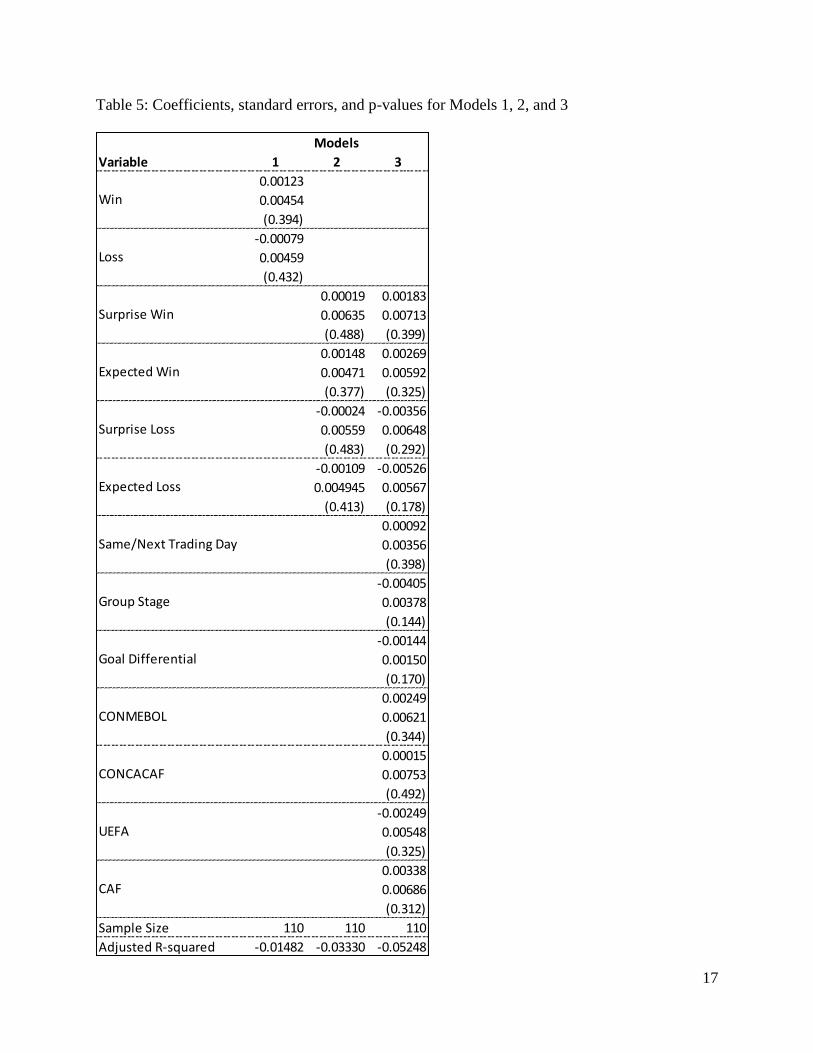
results are as follows in Tables 5-8. Note that the top number listed for each variable is the
coefficient, the middle number is the standard error, and the bottom number is the p-value. Also,
CONMEBOL (South America), CONCACAF (North America, Central America, and the
Caribbean), UEFA (Europe), and CAF (Africa) are the federation names of the different regions
within FIFA.
17
Table 5: Coefficients, standard errors, and p-values for Models 1, 2, and 3
Variable 1 2 3
0.00123
0.00454
(0.394)
-0.00079
0.00459
(0.432)
0.00019 0.00183
0.00635 0.00713
(0.488) (0.399)
0.00148 0.00269
0.00471 0.00592
(0.377) (0.325)
-0.00024 -0.00356
0.00559 0.00648
(0.483) (0.292)
-0.00109 -0.00526
0.004945 0.00567
(0.413) (0.178)
0.00092
0.00356
(0.398)
-0.00405
0.00378
(0.144)
-0.00144
0.00150
(0.170)
0.00249
0.00621
(0.344)
0.00015
0.00753
(0.492)
-0.00249
0.00548
(0.325)
0.00338
0.00686
(0.312)
Sample Size 110 110 110
Adjusted R-squared -0.01482 -0.03330 -0.05248
Surprise Loss
Models
Win
Loss
Surprise Win
Expected Win
CONMEBOL
CONCACAF
UEFA
CAF
Expected Loss
Same/Next Trading Day
Group Stage
Goal Differential
18
Table 6: Coefficients, standard errors, and p-values for Model 4 – Trading Day Subsample
Variable
-0.00234 -0.00010
0.00784 0.00865
(0.383) (0.495)
-0.00053 -0.00002
0.00497 0.00645
(0.458) (0.498)
0.00324 -0.00038
0.00698 0.00778
(0.322) (0.481)
-0.00002 -0.00537
0.00526 0.00632
(0.498) (0.200)
-0.00971**
0.00461
(0.021)
-0.00158
0.00196
(0.212)
-0.00074
0.00718
(0.459)
-0.00069
0.00768
(0.464)
-0.00143
0.00610
(0.408)
-0.00012
0.00767
(0.494)
Sample Size 75 75
Adjusted R-square -0.04978 -0.06793
CONCACAF
UEFA
CAF
Group Stage
Goal Differential
CONMEBOL
Surprise Loss
Expected Loss
4 Possibilities
Trading Day
Subsample
Surprise Win
Expected Win
19
Table 7: Coefficients, standard errors, and p-values for Model 5 – Group Stage Subsample
Variable
-0.00062 -0.00140
0.00700 0.00831
(0.465) (0.433)
-0.00082 0.00085
0.00538 0.00757
(0.440) (0.456)
-0.00232 -0.00505
0.00643 0.00777
(0.360) (0.259)
-0.00067 -0.00265
0.00573 0.00734
(0.454) (0.359)
-0.00391
0.00464
(0.201)
-0.00092
0.00223
(0.346)
0.00231
0.00769
(0.382)
0.00192
0.00919
(0.417)
-0.00074
0.00619
(0.452)
0.00421
0.00779
(0.295)
Sample Size 81 81
Adjusted R-square -0.05073 -0.12604
CONMEBOL
CONCACAF
UEFA
CAF
4 Possibilities
Group Stage
Subsample
Surprise Win
Expected Win
Surprise Loss
Expected Loss
Same/Next Trading Day
Goal Differential

20
Table 8: Coefficients, standard errors, and p-values for Model 6 – Goal Difference Subsample
Variable
0.00197 0.00277
0.00752 0.00946
(0.397) (0.385)
-0.00539 -0.00415
0.00474 0.00759
(0.129) (0.293)
-0.00024 -0.00129
0.00480 0.00618
(0.480) (0.418)
-0.00109 -0.00314
0.00425 0.00549
(0.399) (0.284)
0.00135
0.00369
(0.358)
-0.00525
0.00424
(0.110)
-0.00032
0.00175
(0.427)
-0.00217
0.00608
(0.361)
-0.00055
0.00731
(0.470)
-0.00096
0.00495
(0.423)
0.00168
0.00643
(0.397)
Sample Size 81 81
Adjusted R-square -0.03330 -0.10031
CONMEBOL
CONCACAF
UEFA
CAF
Goal Differential
Subsample
Surprise Win
Expected Win
Surprise Loss
Expected Loss
4 Possibilities
Same/Next Trading Day
Group Stage
Goal Differential

21
Overall, there is limited support for the four hypotheses. Due to limited sample size and
relatively high standard errors, only magnitude is compared.
Hypothesis 1 states that a surprise loss will have a larger negative impact on the stock
market than an expected loss. Looking at the coefficients, only Model 5 in Table 7, the group
stage subsample, shows this to be true. In this model, the difference is .00240 and the effect of
surprise loss is approximately 90% larger than the effect of expected loss. In Models 2, 3, 4, and
6, the coefficient of expected loss is greater than the coefficient of surprise loss. In these models,
the difference in effect ranges from .00085 to .00186.
Hypothesis 2 states that a surprise win will have a larger positive impact on the stock
market than an expected win. This is only true when looking at the coefficients of Model 6 in
Table 8, the goal differential subsample. In Model 4 (Table 6), both surprise win and expected
win are negative, while Model 5 (Table 7) shows surprise win with a negative coefficient and
expected win with a positive coefficient. The difference in Model 6 is .00659, approximately
two-thirds of a percent.
Hypothesis 3 states that the coefficient of surprise loss will be more negative than the
coefficient of surprise win is positive. Examining the coefficients, this hypothesis is accurate in
Models 2, 3, 4, and 5, which are all located in Tables 5, 6, and 7. In these models, the difference
ranges from .00005 to .00364 with an average of .00143. In Model 6, found in Table 8, the
coefficient of surprise win is more positive than the coefficient of surprise loss is negative by
.00148.
Hypothesis 4 states that an expected loss will have a larger impact on stock market prices
than an expected win. The coefficients in Models 3, 4, and 5, found in Tables 5, 6, and 7, support
this hypothesis, while Model 2, located in Table 5, does not. Model 2 has a difference of .0004,

22
while the difference in Models 3, 4, and 5 ranges from .00181 to .00534.
5. Discussion
This study addresses the gap left by previous literature about the role of fans’ expectations, rather
than wins and losses, and a stock market change. Running multiple regression models and
finding some evidence in a few of the models leaves the mixed support; however, there are
several points that can be expanded. First, it is possible that there were issues with the models
due to outliers within the data set. With a sample size of 110, a significant outlier may have
impacted the data. The overall implications can be split into three categories: the role of
expectations, the impact of timing, and the effect of goal differential.
5.1 Potential Issues due to Outliers
When examining the data, one thing that stood out was Argentina’s stock market. The
Argentinean stock market had the three largest positive stock price changes as well as the largest
negative stock price change. The largest positive change of Argentina’s stock market was five
times larger than the largest non-Argentina change. The largest negative change of Argentina’s
stock market was over six times larger than the next largest negative change. This volatility has
many causes, but one cause unique to Argentina in June 2014 was the speculation about the
Supreme Court’s ruling regarding Argentina’s sovereign debt. Due to the potential data issues,
one could argue that Argentina should be removed from the analysis. By removing Argentina
from the analysis, the study may be more representative of an average stock market. The results
without Argentina are shown below in Tables 9, 10, and 11.

23
Table 9: Coefficients, standard errors, and p-values for Models 1, 2, and 3 – No Argentina
Variable 1 2 3
-0.00004
0.00214
(0.492)
-0.00085
0.00214
(0.346)
0.00019 0.00120
0.00295 0.00315
(0.475) (0.352)
-0.00011 0.00010
0.00224 0.00267
(0.480) (0.485)
-0.00024 -0.00005
0.00260 0.00287
(0.463) (0.494)
-0.001200097 -0.00250
0.002312654 0.00253
(0.302) (0.163)
0.00412**
0.00165
(0.007)
-0.00291*
0.00177
(0.052)
-0.00032
0.00067
(0.319)
0.00327
0.00283
(0.125)
-0.00036
0.00333
(0.457)
-0.00171
0.00243
(0.241)
0.00323
0.00302
(0.144)
Sample Size 103 103 103
Adjusted R-squared -0.01665 -0.03537 0.05135
Surprise Loss
Models - No Argentina
Win
Loss
Surprise Win
Expected Win
Expected Loss
Same/Next Trading Day
Group Stage
Goal Differential
CONMEBOL
UEFA
CAF
CONCACAF

24
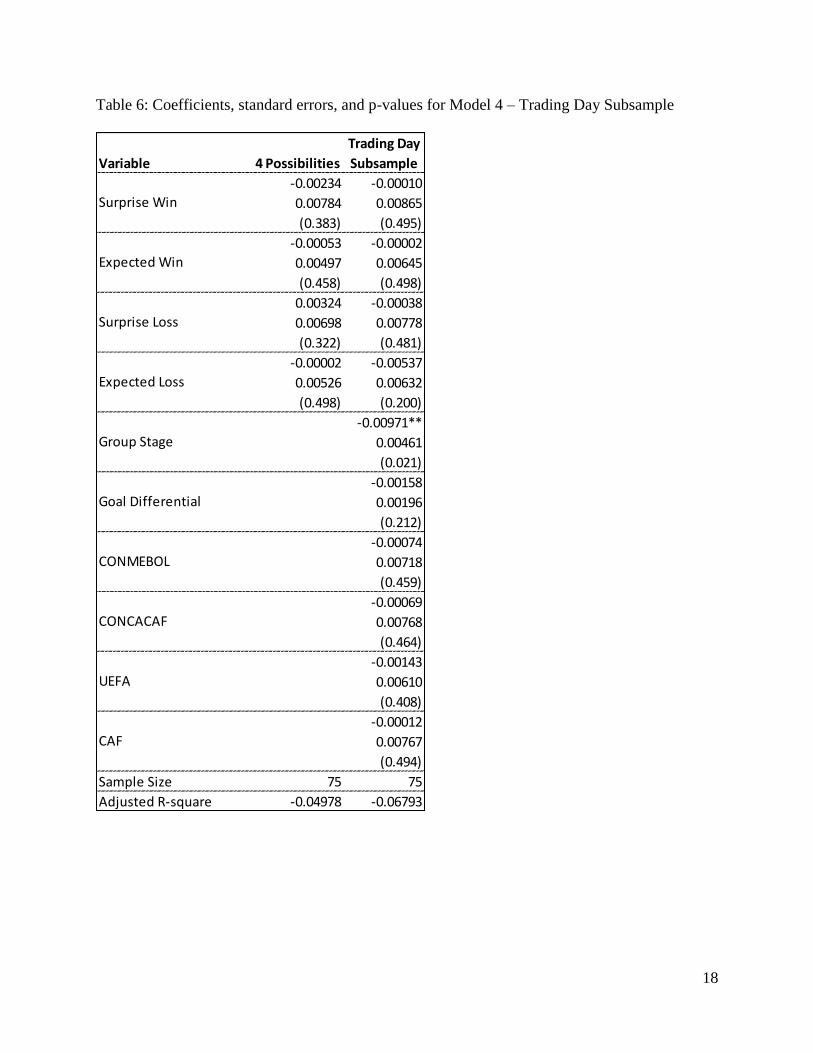
Table 10: Coefficients, standard errors, and p-values for Model 4 – No Argentina
Variable 4 Possibilities Trading Day Subsample
-0.00234 -0.00379
0.00340 0.00383
(0.247) (0.163)
0.00039 -0.00042
0.00221 0.00292
(0.430) (0.442)
0.00324 0.00319
0.00303 0.00345
(0.144) (0.179)
-0.00012 -0.00102
0.00230 0.00285
(0.479) (0.361)
-0.00336
0.00227
(0.072)
-0.00008
0.00089
(0.463)
0.00354
0.00343
(0.153)
0.00103
0.00339
(0.381)
-0.00057
0.00271
(0.417)
-0.00023
0.00338
(0.473)
Sample Size 70 70
Adjusted R-squared -0.01665 -0.05211
CONCACAF
UEFA
CAF
Trading Day Subsample - No Argentina
Group Stage
Goal Differential
CONMEBOL
Surprise Win
Expected Win
Surprise Loss
Expected Loss

25
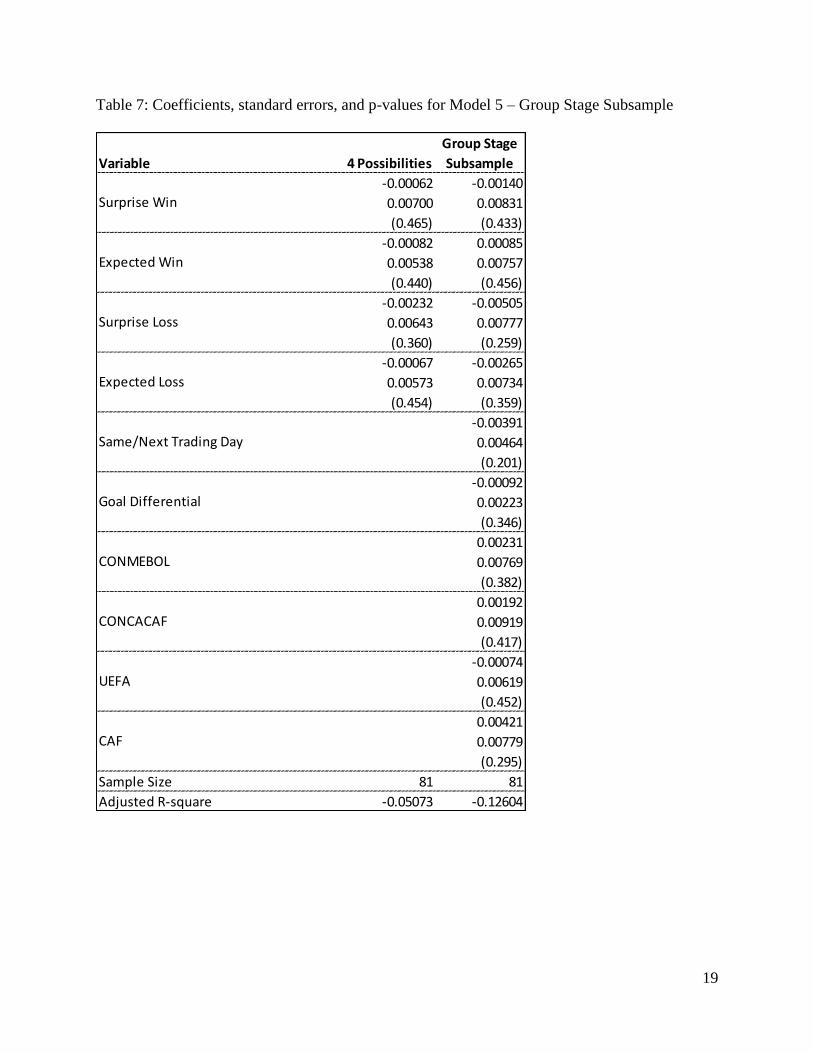
Table 11: Coefficients, standard errors, and p-values for Model 5 – No Argentina
Variable 4 Possibilities Group Stage Subsample
-0.00062 -0.00189
0.00277 0.00313
(0.412) (0.274)
-0.00069 -0.00230
0.00218 0.00291
(0.376) (0.216)
-0.00232 -0.00018
0.00255 0.00294
(0.183) (0.476)
-0.00067 0.00089
0.00227 0.00278
(0.385) (0.375)
0.00274*
0.00180
(0.066)
0.00078
0.00085
(0.181)
0.00311
0.00296
(0.149)
0.00011
0.00346
(0.487)
-0.00058
0.00233
(0.402)
0.00378
0.00293
(0.101)
Sample Size 78 78
Adjusted R-squared -0.04219 -0.00333
Group Stage Subsample - No Argentina
CAF
Surprise Win
Expected Win
Surprise Loss
Expected Loss
Same/Next Trading Day
Goal Differential
CONMEBOL
CONCACAF
UEFA
26
Using these new results as evidence for the hypotheses, support is still mixed.
Hypothesis 1 predicts that surprise losses will have a larger impact on the stock market
than expected losses. The coefficients support this hypothesis only in Model 4 in Table 10, while
Models 2 and 3 in Table 9 do not support this hypothesis. The difference in Model 4 is .00421.
Models 2 and 3 have differences of .00096 and .00245, respectively.
Hypothesis 2 proposes that surprise wins will have a larger impact on the stock market
than expected wins. This is now supported in Models 2, 3, and 5, which are located in Tables 9
and 11; however Model 4 in Table 10 does not support the hypothesis. With the removal of
Argentina, this hypothesis gained additional support.
Hypothesis 3 proposes that the negative impact of surprise losses will be larger than the
positive impact of surprise wins. Without Argentina, this is supported in Models 2 and 5 in
Tables 9 and 11, but not in Models 3 or 4, which are located in Tables 9 and 10. The results
without Argentina appear less supportive than the results with Argentina.
Hypothesis 4 proposes that the negative impact of expected losses will be larger than the
positive impact from expected wins. Once Argentina’s data points are removed, this hypothesis
is supported in Models 2, 3, and 4 in Tables 9 and 10.
Overall, the removal of Argentina improved support of hypothesis 2, while hypothesis 3
had less support, with relation to the coefficients. Hypotheses 1 and 4 did not see a substantial
difference in the two data sets.
5.2 Role of Expectations
While each of the hypotheses had mixed results, looking at the coefficients paints an interesting
picture. Surprise wins and losses, in some models, had a larger impact than expected wins and
27
losses. With a larger sample size across multiple World Cups, or expanding to other international
soccer games, it is possible that the results will be more supported.
5.3 Impact of Timing
One interesting thing caught by the models was the effect that time had on the results. One of the
control variables used was same/next trading day. This captures the effect that the weekend may
have on investors. If the stock market was open after the game ended or the next day, then this
dummy variable was a 1. A “cooling down” period existed for games that were played on
Fridays or Saturdays. The one or two days before market open may have given investors the
chance to reevaluate the game and would stop them from making any quick decisions as they
relate to investments. In the models without Argentina, Models 3 and 5 in Tables 9 and 11 show
a statistically significant impact at the 1% and 10% levels, respectively. This furthers the idea
that the psychology of matches impact investors and that a “cooling down” period exists. Given
that most previous literature were scoped with a next-trading-day scope, it may be interesting to
incorporate this finding.
5.4 Importance of Stage in World Cup
Another control variable incorporated into the study was whether the soccer match took place in
the group stage or elimination stage. Without Argentina, Models 2 and 3 in Table 9 show that
group stage games were associated with a slightly negative impact on the stock market at the
10% level. This is in line with previous literature and provides support for the idea that games
with higher on-field stakes may have higher stock market stakes as well.
6. Conclusion
The results of this study builds on previous literature due to the lack of expectations-based
research as it relates to the World Cup and stock market. The examination of data collected

28
throughout the World Cup through the use of regression models is appropriate and allowed
insight into the effect of multiple variables. The impact that days between the soccer match and
trading day was not initially hypothesized, but could lead to further studies. The “expectations
variable” also found some support across the 6 regression models, but further studies would be
required to show increased significance. The relationship between wins/losses and failing to
meet/exceeding expectations is close, but this study is a step in determining the extent to which
World Cup expectations plays a role in stock market changes.
Due to the nature of the study, there are several limitations that can be discussed. The
different proxy that have been chosen, the specific time period, and control variables used all
present different limitations. The implications discussed could have been made inappropriately if
any of these limitations are found to be significant.
First, the different proxy chosen were selected could have been limited due to the
available information and constraints on the researcher. While the stock market information
should be accurate, the other variables can all be misrepresentations of the variable they are
approximating. Betting odds from the United Kingdom may not accurately represent
expectations around the world. This may lead to miscoded expectation variables. Goal
differential also may not accurately depict the extent of a result. For example, a team could have
significantly outplayed the opponent, but only won by one goal.
Second, all of the games took place from June 2014 to July 2014 with multiple games
played on single days, especially in the group stage. Any macroeconomic factors that could
influence multiple stock markets around the world, or in a region, could have an effect on the
conclusions of this study. For example, the European Union and other countries may have been
impacted by news about the Greek debt, the conflict in Ukraine, and other events around the
29
world. By looking at the percentage change from trading day to previous trading day, these
events were not captured in the regression model. Other models could show different results,
which would impact the implications of the study.
Third, control variables had a significant effect on the regression models in this study.
Including additional control variables, such as interest in soccer and different economic factors,
also could have influenced the significance and coefficient of the expectation variables being
tested. The amount of foreign investment in a stock market also could have impacted the
significance and coefficient of the different variables. If people invest in a stock market that isn’t
in the country of their favorite national soccer team, then they may not change trading patterns as
a result of the soccer games. With different p-values and coefficients, results and implications of
this study could be different.
Finally, one limitation that had a role across the study is the relatively small sample size.
While it is likely that betting odds more accurately capture expectations, using FIFA rankings, or
another ranking system, would allow a substantial increase in sample size. Another way to
increase the sample size is using “friendly” and “qualifying” matches, as well as other
tournaments. As sample size increases, it is possible that the statistical significance could
improve.
Despite these limitations, this study represents a good step in examining an expectations
variable as it relates to the World Cup and stock market. It examines a gap in current literature
due to the lack of research around the impact of World Cup fan expectations and stock market
impact. The link between results of games (wins/losses/ties) has been examined and evidence
exists that these results influence the stock market, but expectations could be an additional
underlying factor.
30
This study explores the role that a team’s ability to fail to meet, meet, or exceed fans’
expectations play a role in stock market fluctuations during the World Cup. There is some
evidence that expectations do influence the stock market, but further research should be done.
Significant results exist when removing outliers and when examining the effect of timing and
match stage. Despite various limitations, these results contribute to existing literature and further
our understanding of the FIFA World Cup and its stock market impact.

31
Appendix
Variable Definitions
Variable Definitions
Exceed Expectations 1 if team exceeded expectations
Met Expectations 0 if team met expectations
Failed Expectations 1 if team failed to meet expectations
Change in Stock Price Change in stock index price
Goal Differential (GD) Average difference in number of goals
GD Exceeded Average difference in number of goals in games where the team exceeded expectations
GD Failed Average difference in number of goals in games where the team failed to meet expectations
Next Day Trading (NDT) 1 if days between date of game and market close date is 0 or 1
NDT Exceeded 1 if days between date of game and market close date is 0 or 1 AND team exceeded expectations
NDT Failed 1 if days between date of game and market close date is 0 or 1 AND team failed to meet expectations
Group Stage (GS) 1 if game was played during the group stage
GS Exceed 1 if game was played during the group stage AND team exceeded expectations
GS Failed 1 if game was played during the group stage AND team failed to meet expectations
Round of 16 (R16) 1 if game was played during the Round of 16
R16 Exceeded 1 if game was played during the Round of 16 AND team exceeded expectations
R16 Failed 1 if game was played during the Round of 16 AND team failed to meet expectations
Quarterfinals (QF) 1 if game was played during the Quarterfinals
QF Exceeded 1 if game was played during the Quarterfinals AND team exceeded expectations
QF Failed 1 if game was played during the Quarterfinals AND team failed to meet expectations
Semi-Finals/3rd Place/Final (Final 4) 1 if game was played during Semi-Finals, 3rd place game, or Finals
Final 4 Failed 1 if game was played during Semi-Finals, 3rd place game, or Finals AND team failed to meet expectations
Final 4 Exceeded 1 if game was played during Semi-Finals, 3rd place game, or Finals AND team exceeded expectations
32
References
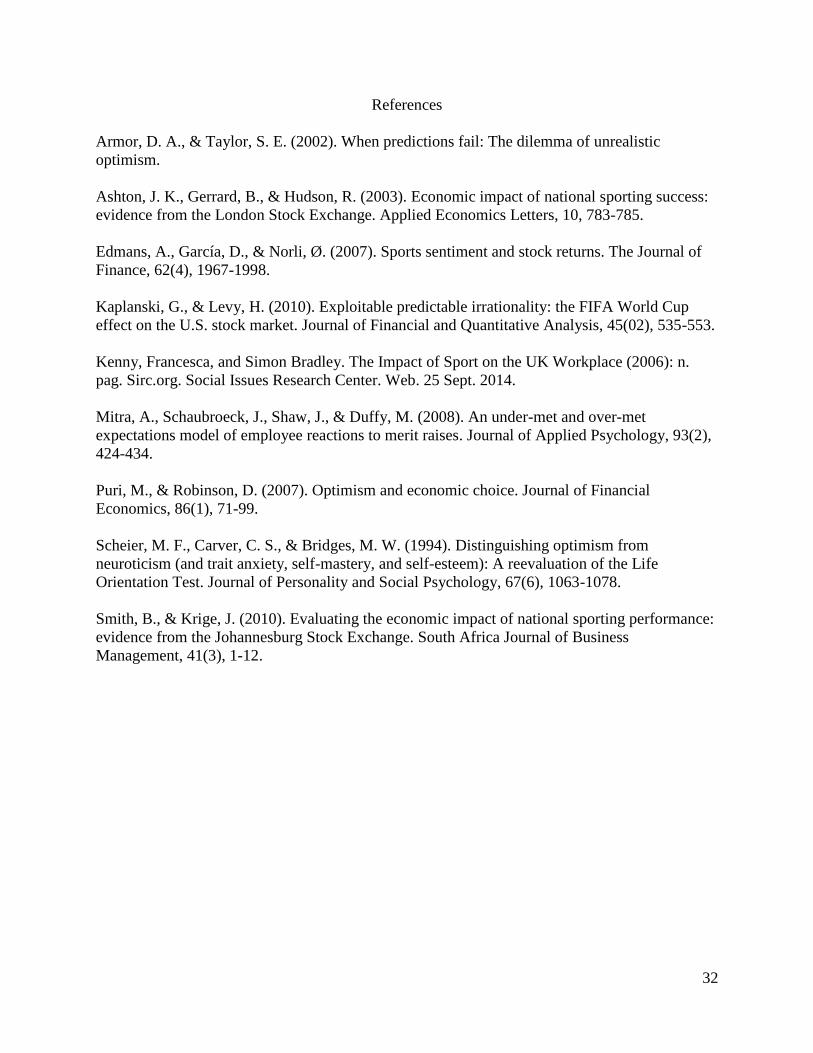
Armor, D. A., & Taylor, S. E. (2002). When predictions fail: The dilemma of unrealistic
optimism.
Ashton, J. K., Gerrard, B., & Hudson, R. (2003). Economic impact of national sporting success:
evidence from the London Stock Exchange. Applied Economics Letters, 10, 783-785.
Edmans, A., García, D., & Norli, Ø. (2007). Sports sentiment and stock returns. The Journal of
Finance, 62(4), 1967-1998.
Kaplanski, G., & Levy, H. (2010). Exploitable predictable irrationality: the FIFA World Cup
effect on the U.S. stock market. Journal of Financial and Quantitative Analysis, 45(02), 535-553.
Kenny, Francesca, and Simon Bradley. The Impact of Sport on the UK Workplace (2006): n.
pag. Sirc.org. Social Issues Research Center. Web. 25 Sept. 2014.
Mitra, A., Schaubroeck, J., Shaw, J., & Duffy, M. (2008). An under-met and over-met
expectations model of employee reactions to merit raises. Journal of Applied Psychology, 93(2),
424-434.
Puri, M., & Robinson, D. (2007). Optimism and economic choice. Journal of Financial
Economics, 86(1), 71-99.
Scheier, M. F., Carver, C. S., & Bridges, M. W. (1994). Distinguishing optimism from
neuroticism (and trait anxiety, self-mastery, and self-esteem): A reevaluation of the Life
Orientation Test. Journal of Personality and Social Psychology, 67(6), 1063-1078.
Smith, B., & Krige, J. (2010). Evaluating the economic impact of national sporting performance:
evidence from the Johannesburg Stock Exchange. South Africa Journal of Business
Management, 41(3), 1-12.