behavioral contrast
TRANSCRIPT

BEHA VIORAL CONTRAST
GEORGE S. REYNOLDS'
HARVARD UNIVERSITY
A pigeon's rate of key pecking during the presentation of one stimulus may be alteredby changing only the schedule of reinforcement associated with a different stimulus(Reynolds, 1960). A change in behavior during the presentation of one stimulus, broughtabout by changing the schedule associated with a different stimulus, is called an inter-action. The change in behavior is called a contrast when the change in the rate of respond-ing during the presentation of one stimulus is in a direction away from the rate of re-sponding generated during the presentation of the other stimulus. For example, the scheduleof reinforcement associated with a red key is held constant while appropriate operations in-crease or decrease the rate of responding during the presentation of a green key. If the rateof responding with a red key decreases when the rate with a green key increases (or increaseswhen the other decreases), the change in rate during the presentation of red is called acontrast.
Contrast typically occurs during the formation of a discrimination between two stimuli.Responding is reinforced first in the presence of each of two exteroceptive stimuli and sub-sequently in the presence of only one (SD). As the rate of responding during the presentationof the other stimulus (S-) decreases, the rate of responding during SD increases over therate maintained when responding was reinforced in the presence of each stimulus. Smithand Hoy (1954) and Herrick, Myers, and Korotkin (1959) have reported examples of con-trast in an operant discrimination. Verplanck (1942) and Solomon (1943) have reported asimilar effect in running speed and jump-stand latency. In Hanson's (1959) generalizationgradients, the ""post-discrimination shift" in the wavelength controlling the maximum rateof responding is accompanied by an increase in the rate of responding during SD.The discrimination need not be formed between an SD and an S-. Contrast seems to occur
even when the extinction schedule is replaced by a schedule which merely programs fewerreinforcements than the schedule in force during SD. Findley (1958) showed that the rate ofresponding on a VI 6-minute schedule of reinforcement in one component of a multipleschedule increased when the schedule in the other component was a VI with a mean intervalgreater than 6 minutes (cf., also Schuster, 1960). Similarly, when Herrnstein and Morse (1957)superimposed a stimulus correlated with "response-independent" reinforcement upon aDRL base line, the rate of responding in the presence of the superimposed stimulus greatlyexceeded the rate normally maintained by "response-independent" reinforcement alone.The development of performance on a fixed-interval schedule of reinforcement is a
process similar to contrast. Early in the development, a constant rate of responding typicallyprevails throughout the interval. As the rate of responding in the early part of the interval,where responding is never reinforced, decreases below this constant level, the rate of re-sponding in the last of the interval, where responding is always reinforced, increases abovethe constant level (cf., Ferster & Skinner, 1957, p. 136). The increase in rate in the last ofthe interval is in a direction away from the decrease in the early part of the interval.
Pavlov (1927) has reported a contrast in salivary conditioning. He called the effect'I wish to thank Dr. R. J. Herrnstein for criticism of the research and of the manuscript. The present data com-
prise Experiment I in a dissertation submitted to the Department of Psychology, Harvard University, in partialfulfillment of the requirements for the degree of Doctor of Philosophy.
57
GEORGE S. REYNOLDS
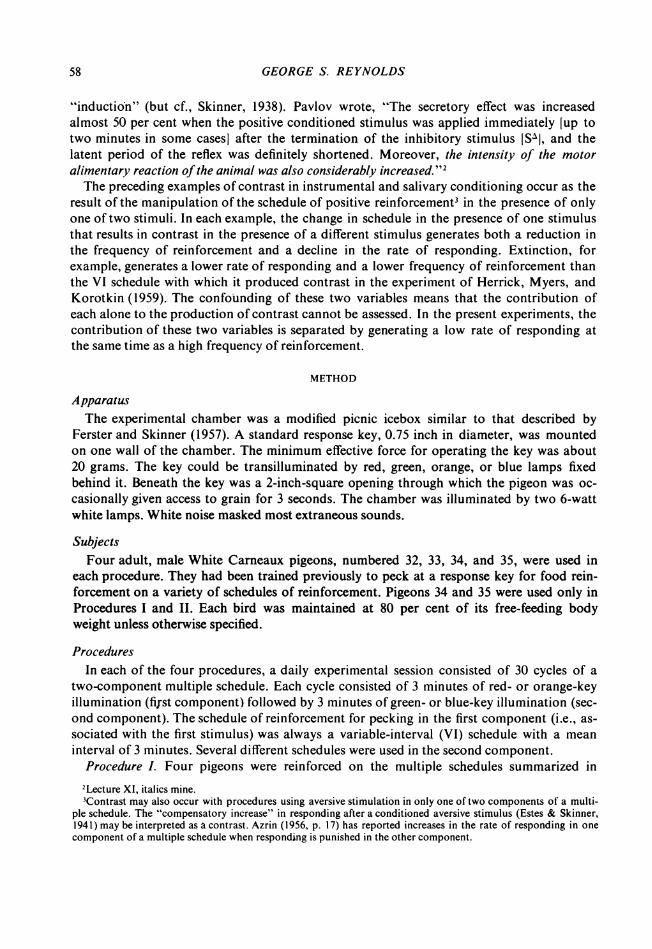
"induction" (but cf., Skinner, 1938). Pavlov wrote, "The secretory effect was increasedalmost 50 per cent when the positive conditioned stimulus was applied immediately [up totwo minutes in some cases] after the termination of the inhibitory stimulus [S5J, and thelatent period of the reflex was definitely shortened. Moreover, the intensity of the motoralimentary reaction ofthe animal was also considerably increased."2The preceding examples of contrast in instrumental and salivary conditioning occur as the
result of the manipulation of the schedule of positive reinforcement3 in the presence of onlyone of two stimuli. In each example, the change in schedule in the presence of one stimulusthat results in contrast in the presence of a different stimulus generates both a reduction inthe frequency of reinforcement and a decline in the rate of responding. Extinction, forexample, generates a lower rate of responding and a lower frequency of reinforcement thanthe VI schedule with which it produced contrast in the experiment of Herrick, Myers, andKorotkin (1959). The confounding of these two variables means that the contribution ofeach alone to the production of contrast cannot be assessed. In the present experiments, thecontribution of these two variables is separated by generating a low rate of responding atthe same time as a high frequency of reinforcement.
METHOD
ApparatusThe experimental chamber was a modified picnic icebox similar to that described by
Ferster and Skinner (1957). A standard response key, 0.75 inch in diameter, was mountedon one wall of the chamber. The minimum effective force for operating the key was about20 grams. The key could be transilluminated by red, green, orange, or blue lamps fixedbehind it. Beneath the key was a 2-inch-square opening through which the pigeon was oc-casionally given access to grain for 3 seconds. The chamber was illuminated by two 6-wattwhite lamps. White noise masked most extraneous sounds.
SubjectsFour adult, male White Carneaux pigeons, numbered 32, 33, 34, and 35, were used in
each procedure. They had been trained previously to peck at a response key for food rein-forcement on a variety of schedules of reinforcement. Pigeons 34 and 35 were used only inProcedures I and II. Each bird was maintained at 80 per cent of its free-feeding bodyweight unless otherwise specified.
ProceduresIn each of the four procedures, a daily experimental session consisted of 30 cycles of a
two-component multiple schedule. Each cycle consisted of 3 minutes of red- or orange-keyillumination (first component) followed by 3 minutes of green- or blue-key illumination (sec-ond component). The schedule of reinforcement for pecking in the first component (i.e., as-sociated with the first stimulus) was always a variable-interval (VI) schedule with a meaninterval of 3 minutes. Several different schedules were used in the second component.
Procedure I. Four pigeons were reinforced on the multiple schedules summarized in
2Lecture XI, italics mine.3Contrast may also occur with procedures using aversive stimulation in only one of two components of a multi-
ple schedule. The "compensatory increase" in responding after a conditioned aversive stimulus (Estes & Skinner,1941) may be interpreted as a contrast. Azrin (1956, p. 17) has reported increases in the rate of responding in onecomponent of a multiple schedule when responding is punished in the other component.
58

BEHA VIORAL CONTRAST
Table 1. During the time out (second component of Phase 2), there was no illuminationbehind the key or in the chamber and no reinforcements were delivered, although operationsof the key were recorded.
Procedure II. A schedule of "reinforcement for not responding" was the second com-
ponent in one phase of Procedure II. In this schedule, the food magazine operates when-ever the pigeon has not pecked the key for a specified time t. The time without responses
is measured from the start of the stimulus with which the schedule is correlated or from thelast response in the presence of that stimulus. Each response begins a new interval of notresponding. The interval is terminated by presenting a reinforcer after t seconds of no re-
sponding. Such a schedule involves differential reinforcement of behavior other than keypecking. It may be called DRO t, where t is the interval of no responding necessary forreinforcement. In these experiments, the value of t was between 50 and 75 seconds. Sinceeach component is 180 seconds long, the first integer less than 180/t gives the maximumpossible number of reinforcements-per exposure to the schedule.
Pigeons 34, 35, 32, and 33 were reinforced on the multiple schedules summarized inTable 2. The two groups of birds differ in the order in which the schedules were pro-
grammed. In Phase 4 for Group II, Pigeon 33 had DRO 75 seconds (instead of DRO50 seconds) only for Session 4; Pigeon 32 had DRO 75 seconds for Sessions 4-7.
Procedure III. This is a combination of Procedures I and 1I. After reinforcement on a
multiple schedule in which both components were VI, the second component was changedto a combination of time out and DRO. There was no illumination behind the keys or inthe chamber, and a reinforcer was presented every t seconds, provided that no response
occurred.The sequence of multiple schedules is summarized in Table 3. Pigeon 32 was not used in
the second session in Phase 3 because it weighed'20 grams more than usual at the beginningof the session.
Table 1
Procedure I
Phase Multiple Schedule Pigeon Number of Sessions
1 VI VI 34 435 332 633 4
2 VI TO* 34 535 532 633 6
3a VI VI 32 1033 8
3b VI EXT 34 635 6
*TO: time out
59

GEORGE S. REYNOLDS
Table 2
Procedure II
Phase Multiple Schedule Pigeon Number of Sessions
Group I:I VI VI 34 4
35 52 VIDRO50sec 34 10
35 113 VI VI 34 5
35 64 VI EXT 34 8
35 115 VI VI 34 5
35 5
Group II:1 VI VI 32 6
33 62 VI EXT 32 6
33 63 VI VI 32 5
33 54 VIDROSOsec 32 7
33 9Sa VI EXT 33 7Sb VI VI 32 7
33 5
An additional procedure controlled for the effects of increasing the frequency of rein-forcement by changing the second component from VI 3 minutes to DRO. After the lastsession of Procedure lII, the usual body weight of each bird was increased by increasing itsdaily ration of grain. Pigeon 32 increased from 422 to 452 grams; Pigeon 33, from 404 to420 grams. On the next day, the procedure was the same as that of Procedure II, except thatno reinforcements were delivered during the time out in the second component.
RESULTS
Behavioral contrast is an increase in the rate of responding in one component of a multi-ple schedule when certain changes occur in the other component. In this experiment, thefirst component is always VI and the schedule in the second component varies. The questionis simply this: What variations in the second component increase the rate of responding inthe first component, and what variations leave it constant?The results show that both time out and extinction produce increases in responding in an
alternated, VI component. Reinforcement for not responding in addition to either time out
60

BEHA VIORAL CONTRAST
or extinction, however, does not produce an increase. Moreover, the effect of reinforcementfor not responding is not due to changes in the organism's body weight.The data are shown in Fig. 1-6. Figures 5 and 6 contain selected cumulative records of
responding as a function of time. Figures 1 and 3 show, for each bird, the number of re-sponses per session in the VI component of the multiple schedule. The different curves ineach graph arise from procedures in which the sequence of schedules in the other com-ponent was different. These sequences of schedules are given as the labels of the curves.
For example, a pigeon is exposed to the sequence of multiple schedules VI VI, VI EXT.Responding in the first component is plotted, where the schedule is VI in both multipleschedules. The curve is labeled VI-to-EXT since that is the sequence of schedules in thesecond component. If extinction in one component produces contrast in the other, the curveof responding for the VI component will rise.
I. Performance was stabilized on the multiple schedule VI VI. Subsequently, the secondcomponent was changed to a time out during which there was no chamber or key illumina-tion, and no reinforcements were delivered. The first component was maintained as VI.The responding in the component maintained as VI is shown as the VI-to-TO curve in
Fig. 1 for Birds 34, 35, 32, and 33 in Parts A, B, C, and D, respectively. Session 0 representsthe last session on the schedule, mult VI VI. During the subsequent sessions, the schedulewas mult VI TO. If the change of schedule in the second component had no effect uponresponding in the VI component, the VI-to-TO curve would be a straight, horizontal line.For each of the birds, however, the number of responses in the first component increases inthe first session after the change from VI to time out in the second component. For allbirds except 35 (Part B), the number of responses per session under mult VI TO remainshigher than under mult VI VI. The number of responses generated by a VI schedule of rein-forcement in one component of a multiple schedule increases when the schedule in the othercomponent is changed from VI to time out.
For two birds, 34 and 35, the second component was changed from time out to extinction.This change consisted only of illuminating the chamber and key during the second com-ponent. Responding after this change is shown as the TO-to-EXT curve in Parts A and B ofFig. 1. For Pigeon 34 (Part A), the number of responses per session is relatively constant atthe level to which it had increased on the previous multiple schedule, VI TO. The curve forPigeon 35 (Part B) shows an initial increase in responding (Session 1, TO-to-EXT curve) and
Table 3
Procedure III
Phase Multiple Schedule Pigeon Number of Sessions
1, VI VI 32 1033 8
2 VI (TO + DRO75 sec) 32 233 2
3 VI (TO + DRO55sec) 32 233 3
61

GEORGE S. REYNOLDS
s| A BVI-to-FT A B(1)6
en 4 6
Z TO-to-EXT3 T-to-EXT5
0X VI-to-TO
z
I I, . * . I
0 1 2 3 4 5 6 0 l 2 3 4 5 6w
0 8 8-0.(I)w
0: 7 -to-TO~~~~~~ V-t-T
5 ~~~~~~~~~~5-TO-to-vI
4 4II I I I I I a I
DAYS (SESSIONS)
Figure 1. The total number of responses per session in the first component of a two-component multiple sched-ule. The schedule of reinforcement in the first component is always VI. The label of each curve gives the sequenceof schedules in the second component of the multiple schedule. Each part of the figure shows reponding for a dif-ferent pigeon.
then a steady performance at a level greater than that originally maintained by the sched-ule mult VI VI.
For Pigeons 32 and 33, the second component was changed from time out to VI. Thischange consisted of not only illuminating the chamber and key but also reinstating theVI 3-minute reinforcement schedule. Responding after this change is shown as the TO-to-VIcurves in Parts C and D. For each bird, the number of responses per session decreases toapproximately the level originally maintained by mult VI VI.The responding from the component that was changed from VI to TO has not been
shown, because the number of responses in time out never exceeded 20 per session.Average curves for each procedure are shown in Fig. 2. Before averaging, each curve for
each bird was normalized by dividing the number of responses in each session by the num-ber of responses in Session 0. The normalized curves, all of which begin at 1.0, wereaveraged across birds.The abrupt, nearly complete absence of responding in the first session under time out
produces an increase in the rate of responding in the component that is maintained onVI (VI-to-TO curve, Fig. 2). When time out is changed to extinction, there is little changein responding (TO-to-EXT); but when time out is changed to VI in the second component,the rate of responding in the other, VI component, declines (TO-to-VI curve).
62

BEHA VIORAL CONTRAST
Con
z0ILU0W 1.5 _
Li VI -to-TO
w M-lo-EXTI-
tl: \ gTO-to-VI>
.5I I I I
0 5 loDAYS (SESSIONS)
Figure 2. Average normalized curves for each sequence of schedules in Procedure 1. Before averaging, eachcurve for each bird (Fig. 1) was normalized by dividing the number of responses in each session by the number ofresponses in Session 0. Each point in the VI-to-TO curve is the arithmetic mean of four observations. Each pointin the other two curves is the arithmetic mean of two observations.
11. The first component of the multiple schedule, VI VI, was maintained as VI, while theother component was changed from VI to reinforcement for not responding (DRO 50 sec-onds), back to VI, then to extinction, and again to VI for Birds 34 and 35. The reversesequence of schedules was used for Birds 32 and 33.The number of responses per session in the component that was maintained as VI is
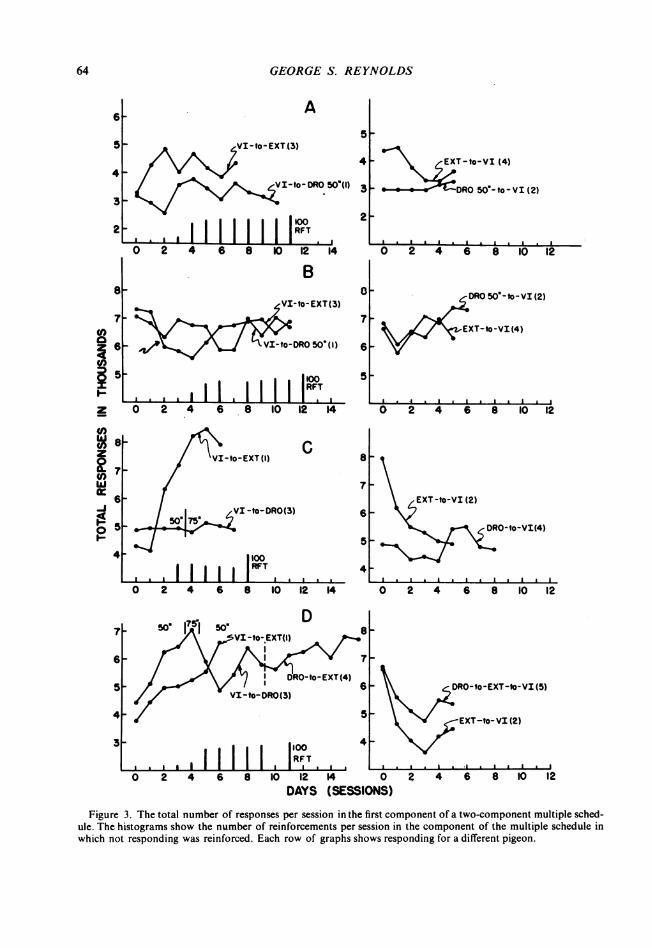
shown in Fig. 3 Parts A, B, C, and D for Pigeons 34, 35, 32, and 33, respectively. The labelof each curve is the sequence of schedules in the second component of the multiple sched-ule. The first schedule in the label refers to Session 0; the second, to the subsequent ses-sions. The first column of graphs shows curves for procedures in which the schedule in thesecond component was changed from VI to extinction (VI-to-EXT curve) or to DRO 50 sec-onds (VI-to:DRO curve). The histogram at the bottom of each graph in the first columnshows the number of reinforcements per session in the DRO component. The secondcolumn of graphs shows curves from sessions in which the schedule in the second com-ponent was changed from extinction (EXT-to-VI curve) or DRO (DRO-to-VI curve) to VI.The number after each label refers to the chronological order in which the curve wasobtained.
Generally, the number of responses per session in the VI component increases when theother component is changed from VI to extinction and does not increase when the othercomponent is changed from VI to reinforcment for not responding for 50 seconds (DRO50 seconds). The VI-to-EXT curves rise and remain higher than those at Session 0. Theover-all rise in the VI-to-DRO curves is not so great. Inversely, responding in the VI com-ponent decreases when the schedule in the other component is changed from extinction to
63
GEORGE S. REYNOLDS
A5
50"(1) 3
2
0 2 4 6 8 10
EXT -to-VI (4)
DRO 50" 0to-VI (2)
T hli2 . . a6 . I . I . 6i
12 14 0 2 4 6 8 10 12
B6
7
6
VI-to- EXT(3)
10 E VI-to DRO 50-(1)
ll | | | RFTI a 4 6 a 11 1 140 2 4 6 8 10 12 14
5
8
7
6
5
4
D
50.171 i0/_/ | DRo~~~~-to-EXT(4)6/E/ ~~VI-to-DRO(3/ ~~~~~~~~~5
I . I I II II|0 2 4 6 8 10 12 14
<DRO 500 -to-VI (2)
EXT-to-VI (4)
O 2 4 6 8 10 12
EXT -to-VI (2)
DRO-to-Vt(4)
2 4 6 8 10 12
DRO-to-EXT-to-VI (5)
EXT-to-VI (2)
, 4I .6- . 1a 4 6 8 10 12DAYS (SESSIONS)
Figure 3. The total number of responses per session in the first component of a two-component multiple sched-ule. The histograms show the number of reinforcements per session in the component of the multiple schedule inwhich not responding was reinforced. Each row of graphs shows responding for a different pigeon.
6
5
4
3
2
8
70
(0
z
w
-J
I-
4
7
6
5
4
31
64
4F
w
*0
i . a I -1 RFT

BEHA VIORAL CONTRAST
VI and increases slightly when the change is from DRO to VI. The EXT-to-VI curves (sec-ond column) generally decrease, and the DRO-to-VI curves slightly increase.
Pigeons 34 and 32 (Parts A and C) show these general results clearly, especially 32, Part C.Pigeon 35 (Part B), however, fails to show an increase in responding in the first com-ponent when VI is changed to extinction in the second component (VI-to-EXT curve). InSession 2 of that procedure (arrow), in which a large drop in the number of responses occursin the VI component, two successive exposures to VI contained no reinforcement. The rateof responding in the next two VI periods was nearly zero, and the rate was lower thanusual throughout the remainder of the session. In Session 5, an increase in the number ofresponses per session begins, but its final level in Sessions 8-11 is not greater than thelevel maintained in the VI-to-DRO curve. This pigeon was exposed to the VI-to-EXT pro-cedure after the VI-to-DRO procedure. The order may have biased the result. Despite thelack of net increase in the VI-to-EXT curve, the EXT-to-VI curve suggests a slight decreasein responding. The DRO-to-VI curve, on the other hand, shows an increase.The VI-to-DRO curve for Pigeon 33 (Part D) illustrates the differential effects of extinc-
tion and DRO. This curve increases during the first four sessions in which the frequency ofreinforcement on the DRO procedure is nearly as low as during extinction (histogram).When the frequency of reinforcement in the DRO component increases in Sessions 5 and 6,the number of responses in the VI component decreases. The final point on the VI-to-DROcurve shows a number of responses greater than the number at Session 0. Nevertheless,the number of responses in the first component increased when the DRO reinforcementswere discontinued (Sessions 10-16).The second column of Part D shows the number of responses in the first, VI, component
when the schedule in the other component is changed to VI from extinction (EXT-to-VIcurve), or from extinction after DRO (DRO-to-EXT-to-VI curve). Both curves decrease,but the EXT-to-VI curve decreases more. The number of responses in the last session onthe DRO-to-EXT-to-VI curve (Session 5, column 2) is nearly equal to the number of re-sponses in the last session on the VI-to-DRO curve (Session 9, column 1).The data have been summarized in Fig. 4 by averaging the individual performances on
each procedure. Before averaging, each curve was normalized by dividing the number ofresponses in each session by the number of responses in Session 0. Since each curve beginsat 1.0, the differences in the performance on VI under different procedures in the othercomponent can be readily seen. The VI-to-EXT curve increases and the EXT-to-VI curvedecreases, while the DRO-to-VI and VI-to-DRO curves change relatively little.
Selected cumulative records of responding during the change from mult VI VI to multVI DRO are shown in Fig. 5 for Birds 34, 35, and 33, respectively. Each group of recordshas been labeled with the number of the bird whose performance it illustrates. For example,the three records (A, B, and C) labeled 34 show the performance of Pigeon 34. The recordsfor the two components of the multiple schedule have been distinguished by displacing andholding the recording pen downward throughout the second component. In the records, thecurve of responding for the second component is continuous with, but I millimeter lowerthan, the curve of responding for the first component. In the records of Pigeons 34 and 35,the recording pen was reset to the base line after each cycle of two components.The occurrence of reinforcements is indicated by short vertical lines, as at a in the
group of records for Pigeon 34.The first group of records from Pigeon 34 shows the responding during the last hour of
the last session on the multiple schedule VI VI (Record A) and the responding at the end of
65
GEORGE S. REYNOLDS
CO)wCoZ 1.50 VI -to-EXTa.Cow
> DRO-to-VI
3.0 v VI- to- DRO
gx \EXT -to-VIw
4 .5
0 S 10
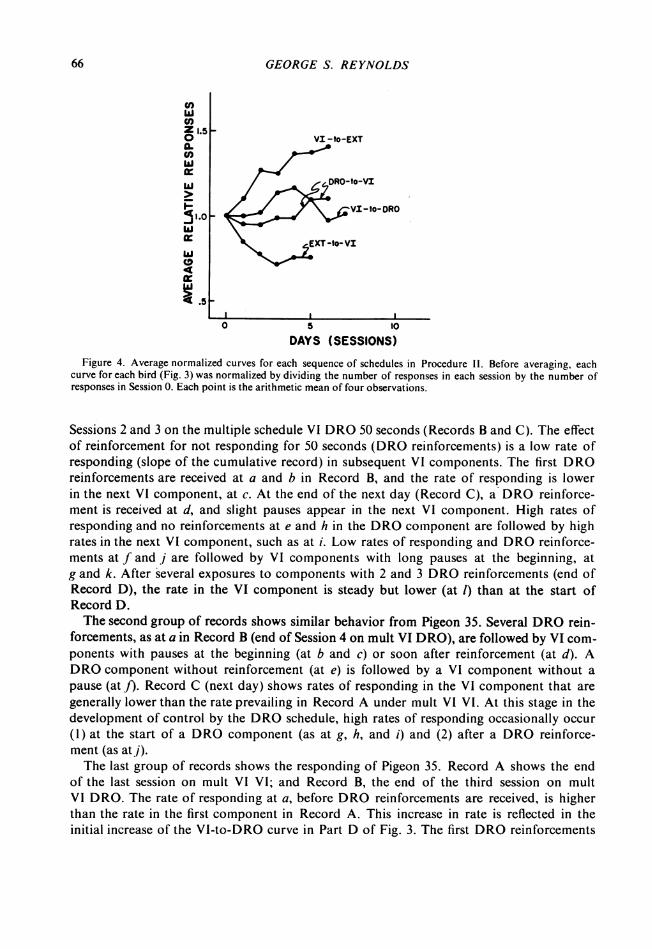
DAYS (SESSIONS)Figure 4. Average normalized curves for each sequence of schedules in Procedure 11. Before averaging, each
curve for each bird (Fig. 3) was normalized by dividing the number of responses in each session by the number ofresponses in Session 0. Each point is the arithmetic mean of four observations.
Sessions 2 and 3 on the multiple schedule VI DRO 50 seconds (Records B and C). The effectof reinforcement for not responding for 50 seconds (DRO reinforcements) is a low rate ofresponding (slope of the cumulative record) in subsequent VI components. The first DROreinforcements are received at a and b in Record B, and the rate of responding is lowerin the next VI component, at c. At the end of the next day (Record C), a DRO reinforce-ment is received at d, and slight pauses appear in the next VI component. High rates ofresponding and no reinforcements at e and h in the DRO component are followed by highrates in the next VI component, such as at i. Low rates of responding and DRO reinforce-ments at f and j are followed by VI components with long pauses at the beginning, atg and k. After several exposures to components with 2 and 3 DRO reinforcements (end ofRecord D), the rate in the VI component is steady but lower (at 1) than at the start ofRecord D.The second group of records shows similar behavior from Pigeon 35. Several DRO rein-
forcements, as at a in Record B (end of Session 4 on mult VI DRO), are followed by VI com-ponents with pauses at the beginning (at b and c) or soon after reinforcement (at d). ADRO component without reinforcement (at e) is followed by a VI component without apause (at J). Record C (next day) shows rates of responding in the VI component that aregenerally lower than the rate prevailing in Record A under mult VI VI. At this stage in thedevelopment of control by the DRO schedule, high rates of responding occasionally occur(1) at the start of a DRO component (as at g, h, and i) and (2) after a DRO reinforce-ment (as at j).The last group of records shows the responding of Pigeon 35. Record A shows the end
of the last session on mult VI VI; and Record B, the end of the third session on multVI DRO. The rate of responding at a, before DRO reinforcements are received, is higherthan the rate in the first component in Record A. This increase in rate is reflected in theinitial increase of the VI-to-DRO curve in Part D of Fig. 3. The first DRO reinforcements
66

BEHA VIORA L CONTRAST
are received at b, c, and d, and three occur in one DRO period at e. The rate is lowerin the next VI component at f and in subsequent VI components in Record B. Record Cshows the first hour of the fifth session. DRO reinforcements are frequent, and the VI per-formance shows pauses (as at h), rates equal to those at a (as at i), and rates lower than
34
35
S,<
B /n rI1J1~~~~~~~~~~~~~~~~~f~~~~~ 0 ~ ~ 1 I INUE133 C 1Da
AB
SEC
/ ~~~~~~~~~~~~~~~10MINUTES
Figure 5. Cumulative records of the responding of three pigeons on a sequence of multiple schedules includingreinforcement for not responding. The recording pen was displaced downward throughout the second component.The curve of responding for the second component is continuous with, but 1 millimeter below, the curve of re-sponding for the first component. Reinforcements are indicated by short vertical lines on the records.
67

GEORGE S. REYNOLDS
those at a (as at g). By the end of that session (Record D), the rate of responding in theVI component is lower than at a and slightly higher, on the average, than in Record A(under mult VI VI). Occasionally, very high rates of responding occur just after reinforce-ment in the VI component, as atj.The rate of responding in a component whose schedule is maintained as VI reinforcement
increases when the schedule in the other component is changed from VI to extinction. Theincrease does not occur if reinforcement for not responding (DRO) is received in the extinc-tion component. The initial effect of DRO reinforcement is pausing in the VI component.After several hours, the pauses become less frequent and shorter. These results show thatcontrast may be reduced by programming reinforcement for not responding during extinc-tion.
III. Pigeons 32 and 33 were reinforced on a series of multiple schedules in which the firstcomponent was maintained as VI reinforcement while the second component was changedto time out, back to VI, to time out plus reinforcement for not responding, and backto VI.The initial change from VI to time out in the second component resulted in an increase
in the number of responses per session in the component maintained as VI (cf., Fig. 1).When reinforcement for not responding (DRO) was programmed in addition to time out, apermanent increase in responding in the VI component did not occur.
After five sessions of time out plus DRO alternating with VI, both birds were fed anamount of grain sufficient to increase their weights: by 30 grams for Pigeon 32; by 16 gramsfor Pigeon 33. The next session consisted of the multiple schedule, VI TO; the DRO pro-cedure was omitted.The cumulative records from the first cycles of each session are shown in Fig. 6. Each part
shows the responding under the multiple schedule, VI (TO + DRO) in Record A; andunder VI TO in Record B. Part I is Bird 32; Part II, Bird 33. The recorder pen is dis-placed down throughout the second component.
B I A ( gBL..Z2~~L] A B
10 MINUTES .A /
Ij /f o II
d
Figure 6. Cumulative records of responding for two pigeons. Each pigeon weighed more during Record B thanduring Record A. No reinforcements for not responding were received during Record B.
d
68
BEHA VIORA L CONTRAST
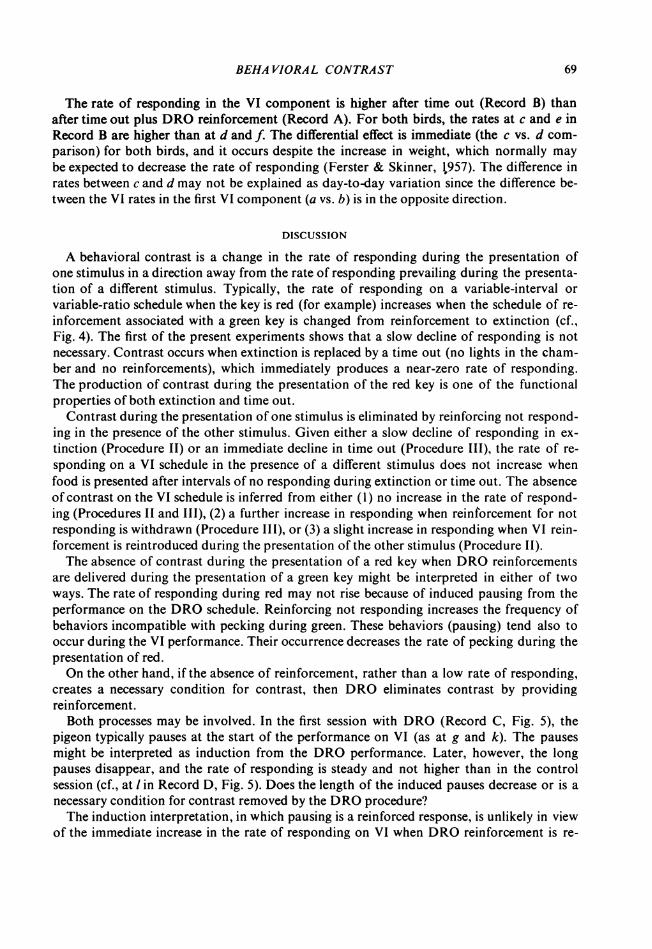
The rate of responding in the VI component is higher after time out (Record B) thanafter time out plus DRO reinforcement (Record A). For both birds, the rates at c and e inRecord B are higher than at d and f The differential effect is immediate (the c vs. d com-parison) for both birds, and it occurs despite the increase in weight, which normally maybe expected to decrease the rate of responding (Ferster & Skinner, t957). The difference inrates between c and d may not be explained as day-to-day variation since the difference be-tween the VI rates in the first VI component (a vs. b) is in the opposite direction.
DISCUSSION
A behavioral contrast is a change in the rate of responding during the presentation ofone stimulus in a direction away from the rate of responding prevailing during the presenta-tion of a different stimulus. Typically, the rate of responding on a variable-interval orvariable-ratio schedule when the key is red (for example) increases when the schedule of re-inforcement associated with a green key is changed from reinforcement to extinction (cf.,Fig. 4). The first of the present experiments shows that a slow decline of responding is notnecessary. Contrast occurs when extinction is replaced by a time out (no lights in the cham-ber and no reinforcements), which immediately produces a near-zero rate of responding.The production of contrast during the presentation of the red key is one of the functionalproperties of both extinction and time out.
Contrast during the presentation of one stimulus is eliminated by reinforcing not respond-ing in the presence of the other stimulus. Given either a slow decline of responding in ex-tinction (Procedure II) or an immediate decline in time out (Procedure III), the rate of re-sponding on a VI schedule in the presence of a different stimulus does not increase whenfood is presented after intervals of no responding during extinction or time out. The absenceof contrast on the VI schedule is inferred from either (1) no increase in the rate of respond-ing (Procedures II and III), (2) a further increase in responding when reinforcement for notresponding is withdrawn (Procedure III), or (3) a slight increase in responding when VI rein-forcement is reintroduced during the presentation of the other stimulus (Procedure II).The absence of contrast during the presentation of a red key when DRO reinforcements
are delivered during the presentation of a green key might be interpreted in either of twoways. The rate of responding during red may not rise because of induced pausing from theperformance on the DRO schedule. Reinforcing not responding increases the frequency ofbehaviors incompatible with pecking during green. These behaviors (pausing) tend also tooccur during the VI performance. Their occurrence decreases the rate of pecking during thepresentation of red.On the other hand, if the absence of reinforcement, rather than a low rate of responding,
creates a necessary condition for contrast, then DRO eliminates contrast by providingreinforcement.
Both processes may be involved. In the first session with DRO (Record C, Fig. 5), thepigeon typically pauses at the start of the performance on VI (as at g and k). The pausesmight be interpreted as induction from the DRO performance. Later, however, the longpauses disappear, and the rate of responding is steady and not higher than in the controlsession (cf., at t in Record D, Fig. 5). Does the length of the induced pauses decrease or is anecessary condition for contrast removed by the DRO procedure?The induction interpretation, in which pausing is a reinforced response, is unlikely in view
of the immediate increase in the rate of responding on VI when DRO reinforcement is re-
69

GEORGE S. REYNOLDS
moved from the alternated schedule (end of Procedure III, Experiment I). Figure 6 showsthat the increase occurs in the very next presentation of the stimulus correlated with theVI schedule. If induced pausing were lowering the rate on the VI schedule, more than one3-minute exposure to time out without DRO would certainly be needed to extinguish thepausing tendencies. The immediacy of the contrast effect seems to preclude an interpretationin terms of variables than work gradually.
Contrast appears rather to depend upon a relation among the schedules of reinforcementcurrently controlling an organism's behavior. The results of the present experiments and ofthose summarized in the introduction suggest the following relativistic specification of theconditions for contrast. The frequency,of reinforcement in the presence of a given stimulus,relative to the frequency during all of the stimuli that successively control an organism'sbehavior, in part determines the rate of responding that the given stimulus controls. Achange in the relative frequency of reinforcement associated with one of several successivestimuli changes the rate of responding during that stimulus; an increase in relative frequencyproduces an increase in the rate of responding. For example, suppose that responding isreinforced on a VI 3-minute schedule during the presentation of both red and green keysand then reinforced on VI 3 minutes only during the presentation of red. The relativefrequency of reinforcement associated with red increases. Before the change in schedule,0.5 of the total reinforcers per session occurred when the key was red. After the change, thesame absolute number of reinforcers occurs in red; but since none occurs in green, the rela-tive frequency in red increases to 1.0. The increase in relative frequency of reinforcementfrom 0.5 to 1.0 results in contrast, an increase in the rate of responding.The relative frequency of reinforcement during red does not increase when DRO rein-
forcements are delivered during green. The histograms in Fig. 3 show that more thaQ30 reinforcers (the average frequency in a session on VI 3 minutes) occur per session withthe DRO schedule. Since the frequency of reinforcement associated with red is maintainedat a constant value, the relative frequency during red declines when the frequency in greenincreases. The rate of responding during red does not increase (VI-to-DRO curve, Fig. 4).
SUMMARY
A pigeon's rate of key pecking during the presentation of one stimulus was modified bychanging only the schedule of reinforcement associated with a different stimulus. Typically,the rate of responding increases in the component of a multiple schedule whose schedule ismaintained as reinforcement when the schedule in the other component is changed from re-inforcement to extinction. The present experiments show that, in addition, a time out (nolights in the experimental chamber and no reinforcements), which immediately produces anear-zero rate of responding, also results in an increase in the rate of responding in theother component. Both extinction and time out produce a lower rate of responding andfewer reinforcements than does a VI schedule. In order to separate the effects of not re-sponding from the effects of no reinforcement, food was presented when no responses oc-curred for 50 seconds during extinction or time out. Reinforcement for not responding, con-current with extinction or time out in one component, produced very low rates of respond-ing but maintained a high frequency of food presentations. Under these conditions, theincrease in the rate of responding on the VI schedule in the other component (behavioralcontrast) was eliminated.
70

BEHA VIORAL CONTRAST
REFERENCES
Azrin, N. H. Some effects of two intermittent schedules of immediate and non-immediate punishment. J. gen.Psychol., 1956, 42, 3-21.
Estes, W. K., and Skinner, B. F. Some quantitative properties of anxiety. J. exp. Psychol., 1941, 39, 466-483.Ferster, C. B., and Skinner, B. F. Schedules of reinforcement. New York: Appleton-Century-Crofts, 1957.Findley, J. D. Preference and switching under concurrent scheduling. J. exp. anal. Behav., 1958, 1, 123-145.Hanson, H. Effects of discrimination training on stimulus generalization. J. exp. Psychol., 1959, 58, 321-335.Herrick, R. M., Myers, J. L., and Korotkin, A. L. Changes in SI and SA rates during the development of an oper-
ant discrimination. J. comp. physiol. Psychol., 1959, 52, 359-364.Herrnstein, R. J., and Morse, W. H. Some effects of response-independent positive reinforcement on maintained
operant behavior. J. comp. physiol. Psychol., 1957, 50, 461-467.Pavlov, I. P. Conditioned reflexes. Trans. G. V. Anrep. Oxford, 1927.Reynolds, G. S. An analysis of interactions in a multiple schedule. Unpublished doctoral dissertation, Harvard
Univer., 1960.Schuster, C. Response latencies as a measure of the interaction of components in a multiple fixed-ratio schedule.
J. exp. anal. Behav., 1959, 2, 259. (Abstract).Skinner, B. F. The behavior oforganisms. New York: Appleton Century Co., 1938.Smith, M. H., and Hoy, W. J. Rate of response during operant discrimination. J. exp. Psychol., 1954, 48, 259-
264.Solomon, R. L. Latency of response as a measure of learning in a "single-door" discrimination. Amer. J. Psychol.,
1943, 56, 422-432.Verplanck, W. S. The development of a discrimination in a simple locomotor habit. J. exp. Psychol., 1942, 31,
441-464.
Received August 4, 1960.
71