behavior of bolts in tee·connections subject to prying action...
TRANSCRIPT

-#353 CIVIL ENGINEERING STUDIES STRUCTURAL RESEARCH SERIES NO. 353
Copy 3
BEHAVIOR OF BOLTS IN TEE·CONNECTIONS SUBJECT TO
PRYING ACTION
by
R. S. NAIR,
P. C. BIRKEMOE
and
W. H. MUNSE
DEPARTMENT OF CIVIL ENGINEERING
UNIVERSITY OF ILLINOIS
URBANA, ILLINOIS
SEPTEMBER, 1969

BEHAVIOR OF BOLTS IN TEE-CONNECTIONS
SUBJECT TO PRYING ACTION
by
R. S. Nair,
P. C. Birkemoe
and
IN. H. Munse
Department of Civil Engineering
University of Illinois
Ur~ana, Illinois
September 1969

iii
ACKNOWLEDGMENT
This study was part of an investigation on riveted and bolted
structural joints conducted at the University of Illinois in cooperation
with the Research Council on Riveted and Bolted Structural Joints of the
Engineering Foundation under the general direction of W. H. Munse, Professor
of Civil Engineering, and the direct supervision of P. C. Birkemoe, Assistant
Professor of Civil Engineering.
The report presented herein was prepared as a doctoral thesis
by R. S. Nair, Research Assistant in Civil Engineering. Professor W. H.
Munse served as Mr. Nair's adviser in the preparation of this thesis.
Professors E. Chesson, Jr., and K. Wakiyama (formerly associated
with the University of Illinois) participated in the planning of the initial
phases of the experimental program.

TABLE OF CONTENTS
CHAPTER
1. INTRODUCTION
1.1 Objectives and Scope of Study
2. PRYING ACTION IN BOLTED TEE-CONNECTIONS .
2.1 Development of Prying Forces ... 2.2 Effect of Prying Action on Bolt Behavior.
3. PREVIOUS INVESTIGATIONS AND EXISTING PRYING
4.
5.
6.
7.
8.
APPENDIX
A.
B.
ACTION FORMULAE .
3.1 Experimental Investigations .... 3.2 Analytical Studies and Methods of Computing
Prying For ce . .
EXPERIMENTAL STUDY
4.1 4.2 4.3 4.4
Test Specimens . . . . . Materials and Fabrication Test Procedures Discussion of Results
ANALYTICAL STUDY
5.1 Description of the Analysis ..... 5.2 Parameters Investigated 5.3 Discussion of Results ....
FORMULATION OF SEMI-EMPIRICAL RELATIONS .
6.1 Approximate Analytical Solutions. 6.2 Formulation of Semi-Empirical Equations
DESIGN OF BOLTED TEE-CONNECTIONS
7.1 Design Procedure ...... . 7.2 Discussion of the Suggested Procedure
CONCLUSIONS
ANALYSIS OF TEE-CONNECTIONS . . • . . . . • . . . . •
SUGGESTED DESIGN SPECIFICATION FOR ASTM A325 AND A490 BOLTS SUBJECT TO APPLIED TENSION IN STRUCTURAL JOINTS
iv
Page
1
1
3
3 3
8
8
9
12
12 14 15 22
34
34 37 39
45
45 48
53
53 55
59
62
86

LIST OF REFERENCES
TABLES ..
FIGURES
v
Page
87
89
102
LIST OF FIGURES
FIGURE
1.1 TYPICAL USES OF TEE-STUBS IN STRUCTURAL CONNECTIONS
1.2 CONNECTION TYPES INVESTIGATED
2.1 DEVELOPMENT OF PRYING FORCE IN TEE-CONNECTIONS .
2.2 SINGLE-BOLT CONNECTION AND TEE-CONNECTION
2.3 FORCES IN SINGLE-BOLT CONNECTION .
2.4 FORCES IN TEE-CONNECTION . . . . .
2.5 BOLT TENSION VERSUS APPLIED LOAD FOR TEE-CONNECTION AND SINGLE-BOLT CONNECTION . . . .
3.1 MODELS USED IN PREVIOUS ANALYTICAL STUDIES .
4.1 GEOMETRY OF SINGLE-BOLT CONNECTIONS TESTED . .
4.2 GEOMETRY OF TEE-CONNECTIONS TESTED . . . .
4.3 BOLT TENSION VERSUS SHANK STRAIN FOR BOLT UNDER
4.4
DIRECT TENSION . . . . . . . . .
BOLT TENSION VERSUS SHANK STRAIN FOR BOLT UNDER TORQUED TENS I ON . . . . . . . . . . . . . . . .
4.5 LOADING SYSTEM FOR DIRECT-TENSION CALIBRATION
4.6
4.7
4.B
TESTS OF BOLTS . . . . . . . .
LOAD~NG SYSTEM FOR SINGLE-BOLT CONNECTIONS
TENSION-ELONGATION RELATIONSHIPS OF A325 BOLTS UNDER DIRECT TENSION AND TORQUED TENSION . . .
TENSION-ELONGATION RELATIONSHIPS OF A490 BOLTS UNDER DIRECT TENSION AND TORQUED TENSION. . .
4.9 ANALYTICAL PROCEDURE FOR OBTAINING TENSIONELONGATION RELATIONSHIP OF PRETENSIONED BOLT SUBJECTED TO DIRECT TENSION · · ·
4.10 TENSION-ELONGATION RELATIONSHIP OF PRETENSIONED A325 BOLT SUBJECTED TO DIRECT TENSION . . · . . . · · · .
4.11 TENSION-ELONGATION RELATIONSHIP OF PRETENSIONED A490 BOLT SUBJECTED TO DIRECT TENSION . · . . · ·
4.12 EFFECT OF THREAD LENGTH IN GRIP ON TENSION-ELONGATION RELATIONSHIP OF BOLTS UNDER DIRECT TENSION . · ·
vii
Page
102
103
104
105
106
107
lOB
109
110
III
112
113
114
115
116
117
lIB
119
120
. 121

FIGURE
4.13
4.14
4.15
4.16
4.17
BOLT TENSION VERSUS APPLIED LOAD RELATIONSHIP OF SPECIMEN S (S) 3-1 . . . . . . . . . . . . . . . .
BOLT TENSION VERSUS APPLIED LOAD RELATIONSHIP OF SPECIMEN S (T3) 3-1 . . . . . . . . . . . . . . .
BOLT TENSION VERSUS APPLIED LOAD RELATIONSHIP OF SPECIMEN S(T4)3-1 .............. .
BOLT TENSION VERSUS APPLIED LOAD RELATIONSHIPS OF TEE-CONNECTIONS WITH A325 BOLTS ... . . . .
BOLT TENSION VERSUS APPLIED LOAD RELATIONSHIPS OF TEE-CONNECTIONS WITH A490 BOLTS . . . . .
4.18 RELATIONSHIP BETWEEN PRYING RATIO AT LOW LOAD AND EDGE DISTANCE FOR TEE-CONNECTIONS TESTED . . . . .
4.19 RELATIONSHIP BETWEEN PRYING RATIO AT LOW LOAD AND GAGE FOR TEE-CONNECTIONS TESTED
4.20 RELATIONSHIP BETWEEN PRYING RATIO AT ULTIMATE AND EDGE DISTANCE FOR TEE-CONNECTIONS TESTED . . . . .
4.21 RELATIONSHIP BETWEEN PRYING RATIO AT ULTIMATE AND
4.22
4.23
4.24
5.1
5.2
5.3
GAGE FOR TEE-CONNECTIONS TESTED
RELATIONSHIP BE1~EEN STRESS RANGE p~D CYCLES TO FAILURE FOR BOLTS IN TEE-CONNECTIONS .
CHANGES IN RANGE OF BOLT STRESS DURING FATIGUE TESTS. OF TEE-CONNECTIONS . . . . . . . . . . . .
METHOD OF ESTIMATING THE LOAD WHICH WOULD CAUSE FAILURE AFTER 2,000,000 CYCLES WHEN APPLIED TO A PARTICULAR TEE-CONNECTION . . . . . . . . . . . . .
VARIABLE PARAMETERS IN ANALYSIS OF TEE-CONNECTIONS .
NOTATION OF PARAMETERS INVESTIGATED
EFFECT OF DISTANCE FROM BOLT LINE TO FACE OF WEB ON -PRYING RATIO AT ULTIMATE IN TEE-CONNECTIONS WITH A325 BOLTS . . . . . . . . . . . . . . . . . . .
5.4 EFFECT OF DISTANCE FROM BOLT LINE TO FACE OF WEB ON PRYING RATIO AT ULTIMATE IN TEE-CONNECTIONS WITH
5.5
A490 BOLTS . . . . . . . . . . . . . . . . . . .
EFFECT OF EDGE DISTANCE ON PRYING RATIO AT ULTIMATE IN TEE-CONNECTIONS WITH A325 BOLTS . . . . . . . . .
viii
Page
122
123
124
125
127
129
130
131
132
133
134
135
136
137
138
139
140
FIGURE
5.6
5.7
5.8
5.9
5.10
5.11
6.1
6.2
6.3
6.4
6.5
A.1
A.2
A.3
A.4
A.5
EFFECT OF EDGE DISTANCE ON PRYING RATIO AT ULTIMATE IN TEE-CONNECTIONS WITH A490 BOLTS . . . . . . . . .
EFFECT OF FLANGE THICKNESS ON PRYING RATIO AT ULTIMATE IN TEE-CONNECTIONS WITH A325 BOLTS . . . . . . . . . .
EFFECT OF FLANGE THICKNESS ON PRYING RATIO AT ULTIMATE IN TEE-CONNECTIONS WITH A490 BOLTS . . . . . . . . .
EFFECT OF FLANGE LENGTH AND BOLT DIAMETER ON PRYING RATIO AT ULTIMATE IN TEE-CONNECTIONS WITH A325 BOLTS
EFFECT OF FLANGE LENGTH AND BOLT DIAMETER ON PRYING RATIO AT ULTIMATE IN TEE-CONNECTIONS WITH A490 BOLTS
COMPARISON OF ULTIMATE LOAD OF TEE-CONNECTIONS WITH LOAD WHICH CAUSES A SPECIFIED INCREASE IN BOLT STRESS . . . . .
MODEL FOR COMPUTATION OF APPROXIMATE PRYING ACTION RELATIONSHIPS . . . . . . . . . . . . . . .
COMPARISON OF VALUES OF PRYING RATIO AT ULTIMATE OBTAINED FROM TESTS AND ANALYSES WITH THOSE COMPUTED USING EQUATION (6.6) ........ .
COMPARISON OF VALUES OF PRYING RATIO AT ULTIMATE OBTAINED FROM TESTS AND ANALYSES WITH THOSE COMPUTED USING EQUATION (6.7) ........ .
COMPARISON OF VALUES OF PRYING RATIO AT ULTIMATE OBTAINED FROM TESTS AND ANALYSES WITH THOSE COMPUTED USING EQUATION (6.8) ..... .
COMPARISON OF VALUES OF PRYING RATIO AT ULTIMATE OBTAINED FROM TESTS AND ANALYSES WITH THOSE COMPUTED USING EQUATION (6.9) ..... .
IDEALIZED REPRESENTATION OF TEE-CONNECTION .
STRUCTURE WITH MODIFIED BOUNDARY CONDITIONS
TEE-SECTION DIVIDED INTO FINITE ELEMENTS AND PARTITIONS
ELEMENTS USED IN THE ANALYSIS
FORCES AND DEFORMATIONS IN ORIGINAL AND MODIFIED STRUCTURES . . . . . . . . . . . . . . . . . . .
ix
Page
141
142
143
144
145
146
147
148
149
150
151
152
153
154
155
156
CHAPTER 1
INTRODUCTION
1
In bolted structural connections in which the fasteners are sub
jected to direct tensile loading, tee-stubs are frequently used to transfer
load to the bolts. Two of the most common connections of this type--a
"rigid" beam-to-column connection and a hanger connection--are illustrated
in Fig. 1.1. It has long been recognized that deformation of the connected
parts in tee-connections could result in an increase in the tensile load on
the fasteners. This phenomenon is known as prying action. Tests have shown
(1,2) that prying action could substantially reduce both the ultimate load
and the fatigue strength of bolted tee-connections. A general discussion
of the prying phenomenon and its effect on bolt behavior is presented in
Chapter 2 and previous investigations of prying action are summarized in
Chapter 3.
1.1 Objectives and Scope of Study
The objectives of this investigation were to determine the behavior
of ASTM A325 and A490 high strength bolts loaded in direct tension in
structural tee-connections and to formulate methods for the design of such
connections. The behavior under static as well as repeated loading was to
be considered.
The investigation included an experimental and an analytical study
of the factors which govern prying action in bolted tee-connections and the
effect of prying action on the behavior of the bolts in the connection.
In the experimental program, static and fatigue tests were performed
on connections made up of two identical tee-sections with their flanges
bolted together by means of four high strength bolts. Such a "symmetrical"

2
tee-connection is shown in Fig. 1.2(a). Some of the geometric parameters
of the connection were varied.
Symmetrical bolted tee-connections (Fig, 1.2(a)) and connections
made up of a single tee-section bolted to a rigid base (Fig. 1.2(b)) were
analyzed using the finite element method. The effect of geometric variables
and bolt properties on the behavior of tee-connections was studied. The
analysis yielded information on the ultimate load of connections as well
as their behavior under lower levels of loading.
Data from static tests and the results of finite element analyses
were used to formulate methods for ~predicting the behavior of tee-connections
under static loading. The results of fatigue tests were used to establish
correlations between the behavior of connections under static and repeated
loadings. Subsequently, procedures for the design of bolted structural tee
connections subjected to either static or repeated loading were developed.
Tee-connections with more than two lines of fasteners were not
studied. It has been shown (2) that in such connections the fasteners in
the two inner lines carry most of the external load applied on the connection;
the remaining fasteners are not very effective.

3
CHAPTER 2
PRYING ACTION IN BOLTED TEE-CONNECTIONS
The forces within a connection which result from the deformation
of the connected parts are known as prying forces. In bolted tee-connections,
these forces cause an increase in the tensile load on the bolts. A descrip
tion of the manner in which prying forces are developed in such connections
and a discussion of the effect of prying action on bolt behavior follow.
2.1 Development of Prying Forces
A tee-connection with very rigid flanges and one with relatively
flexible flanges are shown in Figs. 2.l(a) and 2.l(b), respectively. When
tensile load is applied to the connections, the flexible flanges bend in
such a manner that compressive prying forces are developed between their
edges (Fig. 2.l(b)). The rigid flanges, on the other hand, remain essentially
parallel to each other (Fig. 2.l(a)) and hence no prying forces are developed
between them.
In tee-connections in which the bolts are the critical elements
(i.e., where failure of the connection results from bolt fracture) the magni
tude of the prying force usually decreases as the load on the connection
approaches the ultimate load. Near ultimate, bolt yielding permits the
tee-section flanges to move farther apart, thus causing a reduction in the
prying force. This decrease in prying force will not occur, however, if a
plastic hinge is formed at the web-flange junction of the tee-sections.
2.2 Effect Bf Prying Action on Bolt Behavior
The effect of prying action on bolt behavior is illustrated by
comparing the behavior of a bolt in a connection in which there is no prying
with bolt behavior in a tee-connection subject to prying action. The con
nection without prying selected for this purpose is the concentrically
4
loaded single-bolt connection shown in Fig. 2.2(a). The tee-connection sub-
ject to prying action is shown in Fig. 2.2(b). The mechanical properties of
the bolt and the bolt pretension are the same in both connections. The
thickness of the connected parts in the single-bolt connection is the same
as the flange thickness in the tee-connection. The single-bolt connection
is loaded by means of a shear force distributed around the circumference of
the connected parts.
2.2.1 Relationship Between Bolt Tension and Applied Load
The bolt tension versus applied load relationships of the single-
bolt connection and the tee-connection are described below. These relation-
ships are then compared to show the effect of prying action.
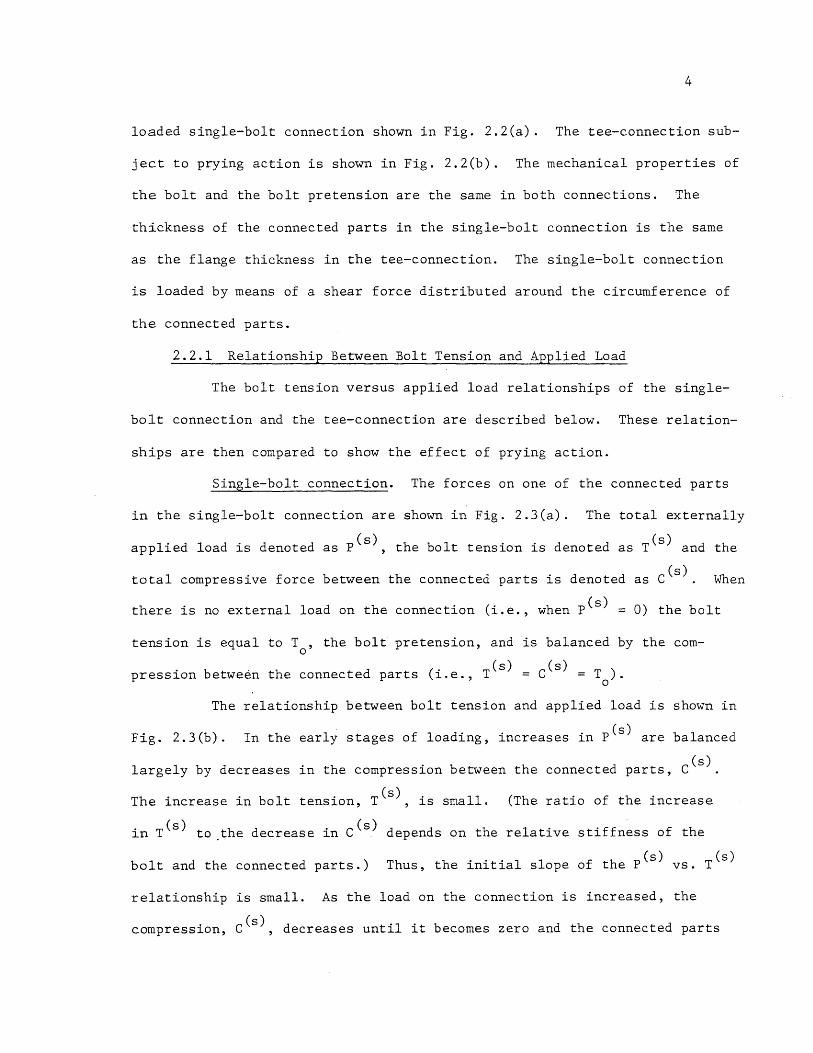
Single-bolt connection. The forces on one of the connected parts
in the single-bolt connection are shown in Fig. 2.3(a). The total externally
applied load is denoted as p(s), the bolt tension is denoted as T(s) and the
total compressive force between the connected parts is denoted as C(s). When
there is no external load on the connection (i.e., when pes) 0) the bolt
tension is equal to T , the bolt pretension, and is balanced by the como
. (s) (s) pression between the connected parts (l.e., T = C = T ).
o
The relationship between bolt tension and applied load is shown in
Fig. 2.3(b). In the early stages of loading, increases in pes) are balanced
(s) largely by decreases in the compression between the connected parts, C .
The increase in bolt tension, T(s), is small. (The ratio of the increase
in T(s) to the decrease in C(s) depends on the relative stiffness of the
bolt and the connected parts.) Thus, the initial slope of the pes) vs. T(s)
relationship is small. As the load on the connection is increased, the
compression, C(s), decreases until it becomes zero and the connected parts

5
separate. After separation of the connected parts the bolt tension, T(s),
must, for equilibrium, be equal to the applied load, p(s).
Tee-connection. The forces on one of the tee-sections in the tee-
connection are shown in Fig. 2.4(a). The externally applied load per bolt
is denoted as P, the bolt tension as T and the prying force per bolt as Q.
The local compressive force between the tee-sections around each bolt hole
is denoted as C. Figure 2.4 (b) shows the forces on a portion of the tee-
section flange surrounding a bolt. This portion of the flange is of the same
shape as each of the connected parts in the single-bolt connection described
above and the forces on it are the bolt tension, T, the local contact
pressure between the tees, C, and a shear force of magnitude (P+Q) distributed
around its boundary. Normal stresses on the boundary of the portion of the
flange are ignored and it is assumed that the prying force and the local
compressive force around the bolt holes (Q and C, respectively, in Fig.
2.4(a» are distinct from one another.
Comparison of the forces on the portion of the tee-section flange
(Fig. 2.4(b» and the forces on one of the connected parts in the single
bolt connection (Fig. 2.3(a» shows that the relationship between T and (P+Q)
in the tee-connection must be approximately the same as the relationship between
T(s) and pes) in the single~bolt connection. (The relationships will not be
identical since the shear force (P+Q) on the portion of the tee-section flange
may not be distributed in the same manner as pes) in the single-bolt connec-
tion. Further, there will be normal stresses on the boundary of the portion
of the tee flange.)
The relationship between the bolt tension in the tee-connection,
T, and the "effective load" per bolt, (P+Q) , is indicated by the broken line
in Fig. 2.4(c). This relationship is similar to the T(s) versus pes) relation-
ship of the single bolt connection (Fig. 2.3(b». The externally applied load
6
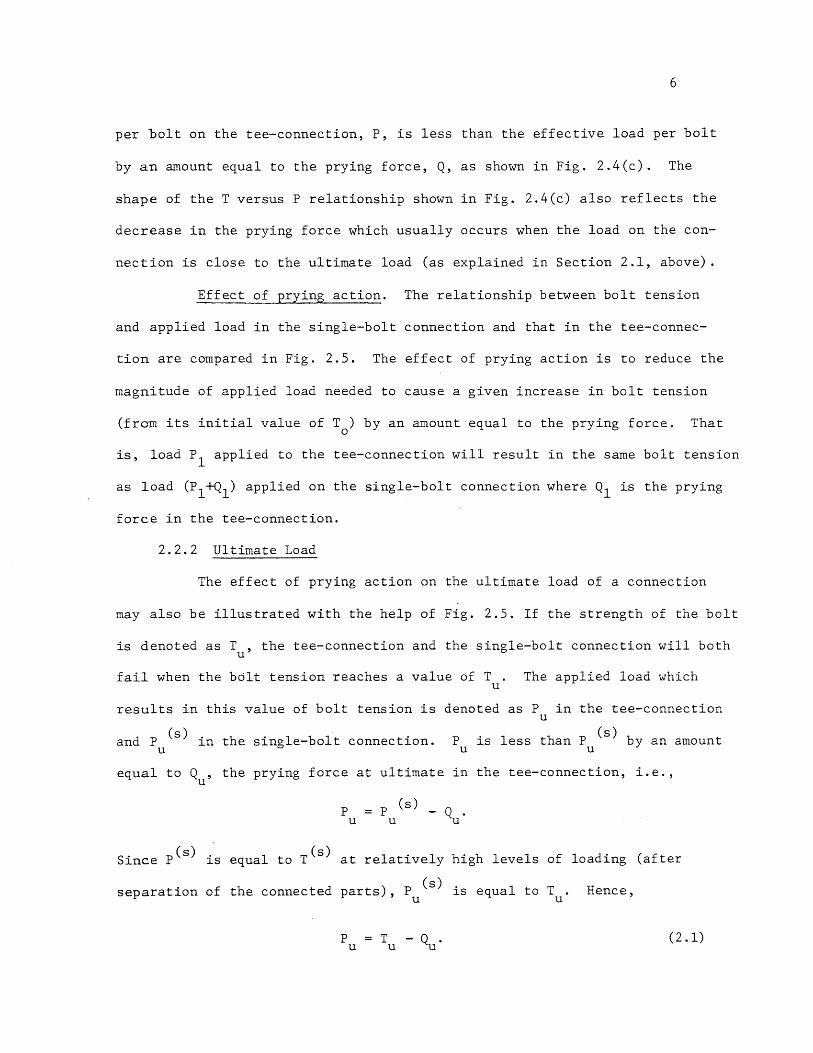
per bolt on the tee-connection, P, is less than the effective load per bolt
by an amount equal to the prying force, Q, as shown in Fig. 2.4(c). The
shape of the T versus P relationship shown in Fig. 2.4(c) also reflects the
decrease in the prying force which usually occurs when the load on the con-
nection is close to the ultimate load (as explained in Section 2.1, above).
Effect of prying action. The relationship between bolt tension
and applied load in the single-bolt connection and that in the tee-connec-
tion are compared in Fig. 2.5. The effect of prying action is to reduce the
magnitude of applied load needed to cause a given increase in bolt tension
(from its initial value of T ) by an amount equal to the prying force. That o
is, load PI applied to the tee-connection will result in the same bolt tension
as load (Pl+Ql) applied on the single-bolt connection where Ql is the prying
force in the tee-connection.
2.2.2 Ultimate Load
The effect of prying action on the ultimate load of a connection
may also be illustrated with the help of Fig. 2.5. If the strength of the bolt
is denoted as T , the tee-connection and the single-bolt connection will both u
fail when the bolt tension reaches a value of T. The applied load which u
results in this value of bolt tension is denoted as P in the tee-connection u
and P (s) in the single-bolt connection. u
(s) P is less than P by an amount
u u
equal to Qu' the prying force at ultimate in the tee-connection, i.e.,
P P (s) _ Q . u u u
Since pes) is equal to T(s) at relatively high levels of loading (after
separation of the connected parts), P (s) is equal to T. Hence, u u
P u
(2.1)

7
Equation (2.1) may, of course, be obtained directly from equili-
brium considerations since, at ultimate, the local compression around the
bolt holes, C, is zero and the only forces on each tee-section, per bolt,
are P ,T and Q • u u u
It was assumed, in the above discussion, that the bolt is the
critical element in the connection.
2.2.3 Behavior Under Fatigue Loading
If the same cyclic load is applied to the tee-connection and the
single-bolt connection, the resulting range of bolt tension will be larger
in the tee-connection. (This is evident from the discussion in Section
2.2.1, above, of the bolt tension versus applied load relationships of the
tee-connection and the single-bolt connection.) The increased range of
bolt tension will have an adverse effect on the behavior of the tee-connection
under repeated loading. Bending of the bolts in the tee-connection could
also affect its fatigue resistance.

8
CHAPTER 3
PREVIOUS INVESTIGATIONS AND EXISTING PRYING ACTION FORMULAE
3.1 Experimental Investigations
Experimental studies of the behavior of high strength bolts loaded
in direct tension in structural tee-connections include those by Leahey and
Munse (1), Munse, Petersen and Chesson (2) and Douty and McGuire (3). The
tests performed in each of these investigations and the conclusions which
were arrived at on the basis of test results are briefly described below.
In the study by Munse, Petersen and Chesson (2), static tests
were performed on symmetrical tee-connections fastened with two and four
lines of A325 bolts. The thickness of the tee-section flanges and the grip
length of the bolts were varied. Changes in the flange thickness were found
to result in a range of bolt efficiency of 30 per cent in the connections
tested, connections with thicker flanges yielding higher efficiencies. The
effect of grip length was found to be small. In connections with four lines
of bolts, most of-the applied load was carried by the bolts in the two inner
lines. In the early stages of loading, the inner bolts carried the entire
load.
Douty and McGuire (3) conducted static tests on tee-connections
assembled with two lines of A325 bolts. The parameters which were varied in
cluded the flange thickness, the edge distance (the distance from the bolt
line to the edge of the tee-section flange) and the bolt diameter. The
results of these tests were used to formulate semi-empirical equations for
the computation of the prying force (see Section 3.2, Eqs. (3.2) and(3.3)).
In the study by Leahey and Munse (1) , static and fatigue tests were
performed on A325 bolts loaded in direct tension in tee-connections made
up of tee-sections with sloping flanges. Tee-sections of the same dimensions
were used in all the tests. In some of the test specimens, beveled washers

9
were installed between the sloping surface of the tee-section flanges and
the bolt head and nut. The effect of bolt pretension on the behavior of the
connection under static and fatigue loading was studied. The use of beveled
washers and changes in bolt pretension were found to have little effect on
the ultimate load of the connection. Under repeated loading, however, con-
nections with beveled washers withstood about ten times as many applications
of load before fatigue failure of the bolts as did connections without
beveled washers subjected to the same applied load. Lowering of the bolt
pretension caused a substantial reduction in the fatigue strength of the
connections tested.
3.2 Analytical Studies and Methods of Computing Prying Force
In recent years, analytical studies of prying action in bolted
structural tee-connections have been carried out by Chang (4) and Douty and
McGuire (3). Both of these investigations resulted in the formulation of
equations for the computation of the magnitude of the prying force. The
flange of the tee-section was, in each study, treated as a beam, i.e.,
bending in a direction parallel to the web was ignored and, in the analysis
of the flange, a~l forces acting on the flange were assumed to be uniformly
distributed over its length.
Chang (4) assumed·that the prying force was distributed between
the bolt line and the edge of the flange, increasing linearly from a value
of zero at the bolt line to a maximum value at the edge of the flange (see
Fig. 3.l(a)). The flange of the tee-section was considered to be simply
supported at the bolt lines and points of inflection were assumed to be
located in the flange midway between the bolt lines and the center of
the web. The following formula was obtained through the use of statics:
Q ~P 8a
(3.1)
10
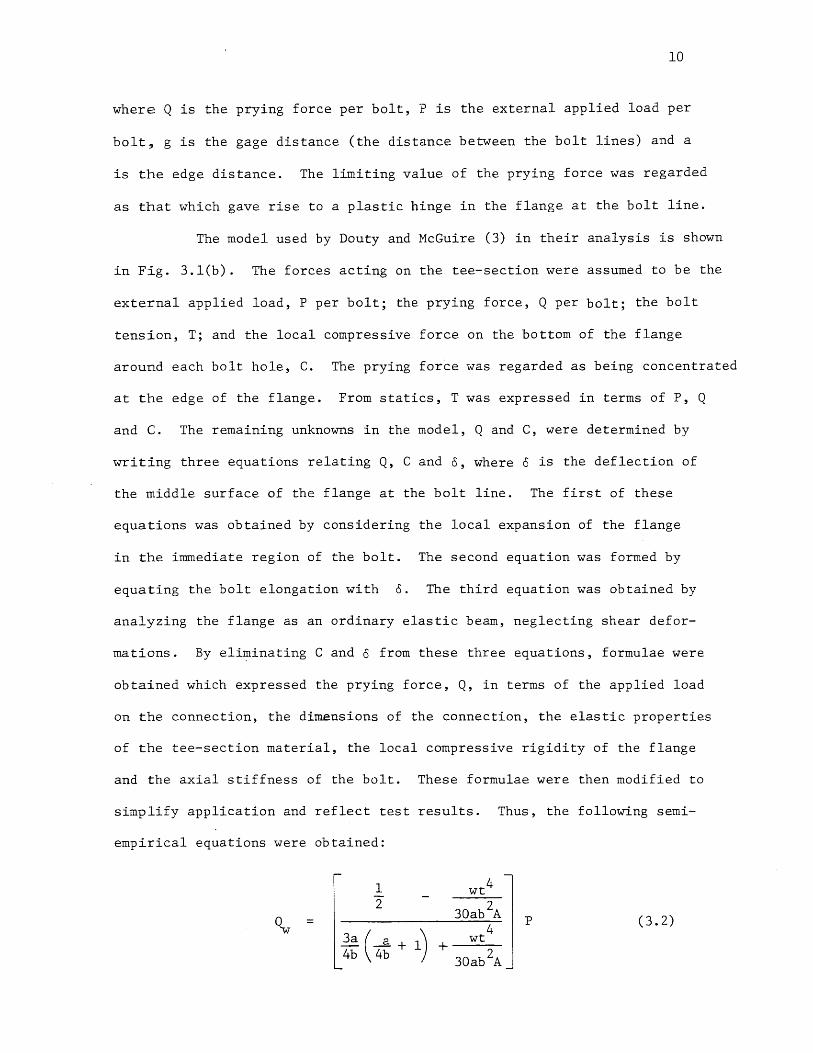
where Q is the prying force per bolt, P is the external applied load per
bolt, g is the gage distance (the distance between the bolt lines) and a
is the edge distance. The limiting value of the prying force was regarded
as that which gave rise to a plastic hinge in the flange at the bolt line.
The model used by Douty and McGuire (3) in their analysis is shown
in Fig. 3.l(b). The forces acting on the tee-section were assumed to be the
external applied load, P per bolt; the prying force, Q per bolt; the bolt
tension, T; and the local compressive force on the bottom of the flange
around each bolt hole, C. The prying force was regarded as being concentrated
at the edge of the flange. From statics, T was expressed in terms of P, Q
and C. The remaining unknowns in the model, Q and C, were determined by
writing three equations relating Q, C and 0, where 0 is the deflection of
the middle surface of the flange at the bolt line. The first of these
equations was obtained by considering the local expansion of the flange
in the immediate region of the bolt. The second equation was formed by
equating the bolt elongation with o. The third equation was obtained by
analyzing the flange as an ordinary elastic beam, neglecting shear defor-
mations. By eli~inating C and 0 from these three equations, formulae were
obtained which expressed the prying force, Q, in terms of the applied load
on the connection, the dimensions of the connection, the elastic properties
of the tee-section material, the local compressive rigidity of the flange
and the axial stiffness of the bolt. These formulae were then modified to
simplify application and reflect test results. Thus, the following semi-
empirical equations were obtained:
I wt4
2 30ab
2A
~ p (3.2)
3a ( a 1) wt4
4b 4b + + 30ab
2A
11
1 4
wt 2
30ab2A
Qu 4 P (3.3)
a( a 1) + wt
b 3b + 6ab 2A
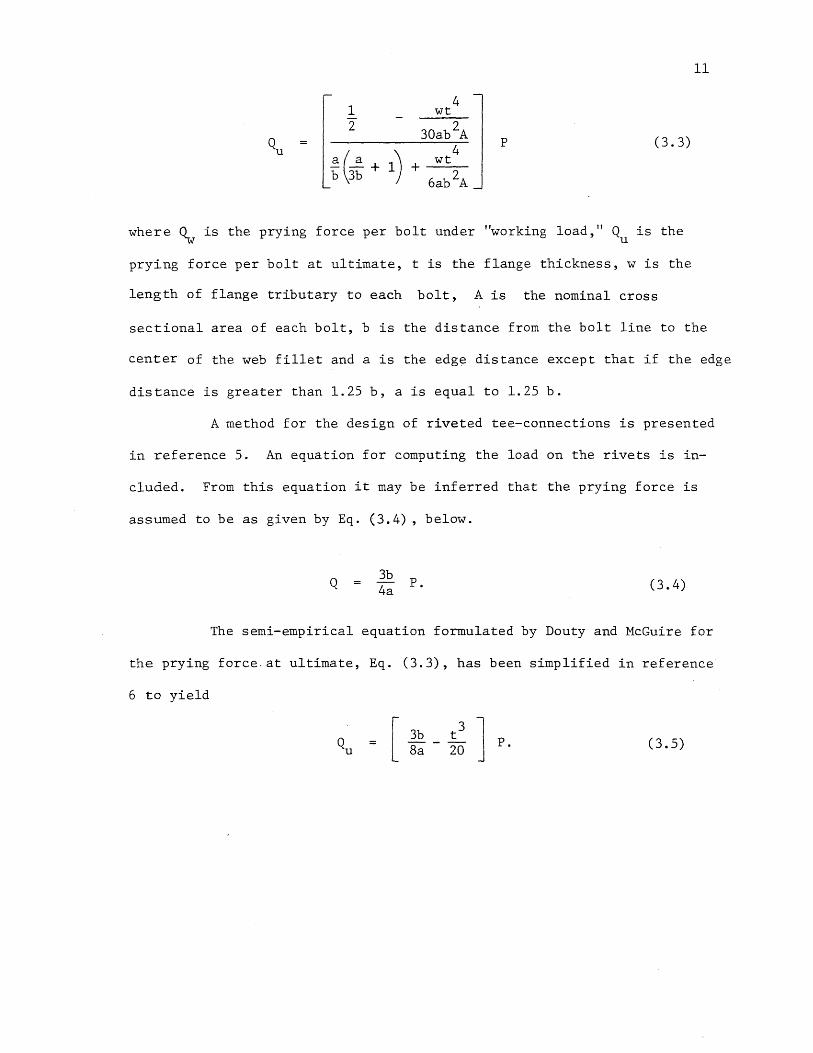
where ~ is the prying force per bolt under "working load," Qu is the
prying force per bolt at ultimate, t is the flange thickness, w is the
length of flange tributary to each bolt, A is the nominal cross
sectional area of each bolt, b is the distance from the bolt line to the
center of the web fillet and a is the edge distance except that if the edge
distance is greater than 1.25 b, a is equal to 1.25 b.
A method for the design of riveted tee-connections is presented
in reference 5. An equation for computing the load on the rivets is in-
eluded. From this equation it may be inferred that the prying force is
assumed to be as given by Eq. (3.4), below.
Q 3b 4a P. (3.4)
The semi-empirical equation formulated by Douty and McGuire for
the prying force. at ultimate, Eq. (3.3), has been simplified in reference
6 to yield
(3.5)
CHAPTER 4
EXPERIMENTAL STUDY
12
The experimental program reported herein included static and
fatigue tests of symmetrical tee-connections, each assembled with four high
strength bolts. Some of the geometric parameters of the tee-sections were
varied in order to study their effect on the behavior of the connection.
Since the prying force could not be measured directly in the
tee-connections tested, the magnitude of the prying force and the
effect of prying action on bolt behavior were determined by comparing the
behavior of bolts in tee-connections with that of similar bolts in
connections not subject to prying action. The connection without prying
selected for this purpose was a concentrically-loaded single-bolt connec
tion (see section 2.2 and Fig. 2.2(a)).
Bolt calibration tests were performed on representative samples
from each lot of bolts used in the experimental program. The mechanical
properties of bolts determined from these tests as well as from previous
calibration tests of A325 and A490 bolts were used in the analysis of
bolted tee-connections. The analysis is discussed in Chapter 5.
4.1 Test Specimens
The specimens tested included single-bolt connections and tee
connections assembled with A325 and A490 bolts. All the single-bolt
connections had the same geometry while some of the geometric parameters
of the tee-connections were varied.
The geometry of the single-bolt connections tested is shown in
Fig. 4.1. These connections consisted of three pieces of steel--two
1 1/16 inch thick cylinders with a 1 1/4 inch thick plate between them-
gripped by a bolt of 3/4 inch nominal diameter running concentrically
through them. The cylinders had an outer diameter of 2 9/16 inches and

13
were threaded on the outside so that they could be screwed into the pulling
yokes usually employed at the University of Illinois for testing bolts in
direct tension. The plate between the cylinders was 3 inches square.
The geometry of the tee-connections tested is shown in Fig. 4.2.
These connections consisted of two tee-sections with their flanges bolted
together with a 1 1/4 inch fill plate between them by means of four bolts of
3/4 inch nominal diameter. In all the tee-connections, the flange thickness
was 1 1/16 inches, the web thickness was 11/16 inch, the length of the
flange in a direction parallel to the web was 7 1/2 inches and the pitch
of the bolts in the flange was 4 1/2 inches. The edge distance (the distance
from the bolt line to the edge of the flange, measured perpendicular to the
web), a, and the gage (the distance between bolt lines, measured perpendicular
to the web), g, were varied. The various combinations of edge distance and
gage in the connections tested and the notation of the corresponding con-
nection geometries are shown in the following tabulation:
Geometry Edge Distance, Gage,
Designation a g
(inches) (inches)
TO 1 3/4 4 1/2
Tl 1 4 1/2
T2 2 1/2 4 1/2
T3 1 3/4 3
T4 1 3/4 6
The bolt holes in the tee-section flanges and the fill plate were 13/16
inch in diameter.
A listing of the specimens tested is presented in Table 4.1.
Four single-bolt connections and sixteen tee-connections were tested

14
under static loading. Fatigue tests under zero-to-tension loading were
performed on twelve tee-connections.
Table 4.1 also shows the system of specimen notation that was
adopted. In the designation of a particular test specimen, the first
letter denotes the type of test (F for fatigue tests, S or U for static
tests); the symbols in parentheses denote the connection geometry (S for
single-bolt connections, TO, Tl, T2, T3 or T4 for tee-connections); the
number following the geometry designation denotes the type of bolt used
in the connection (3 for A325 bolts, 4 for A490 bolts); and the number
after the hyphen denotes the sequential number of the test. Thus,
F(TO)3-2 denotes the specimen used in the second fatigue tests of a tee
connection with geometry TO assembled with A325 bolts.
4.2 Materials and Fabrication
4.2.1 Materials
a) The bolts. Bolts and nuts manufactured to ASTM Specifications
A325 and A490 were used in the tests of single-bolt connections and
tee-connections. All the bolts and nuts of a given type (A325 or A490)
were from the same production lot. The bolts were of 3/4 inch nominal dia
meter and 4 1/2 inch nominal length and had heavy hexagonal heads.
The A325 bolts were used with a single flat hardened washer
under the nut. The A490 bolts were installed with hardened washers under
the bolt head and the nut.
The grip length (the distance from the washer face of the bolt
head to the "face of the nut) of A325 bolts installed in single-bolt
connections and tee-connections was 3 1/2 inches while that of A490
bolts was 3 5/8 inches. Tension tests were performed on three A325 bolts
with 3 1/2 inch grip and three A490 bolts with 3 5/8 inch grip. The

15
average tensile strength under direct tension was found to be 42.0 kips
for the A325 bolts and 51.8 kips for the A490 bolts.
Hardness tests on the bolts and nuts yielded readings of 25 to
27 Rockwell C for the A325 bolts; 32 to 35 Rockwell C for the A490 bolts;
87 to 93 Rockwell B for the nuts used with the A325 bolts; and 30 to 33
Rockwell C for the nuts used with the A490 bolts.
b) The connected parts. The tee-sections in the four-bolt tee
connections were fabricated from wide flange sections of ASTM A36 structural
steel. These sections were of size 27 WF 160 and had flanges of uniform
thickness. The threaded cylinders in the single-bolt connections were
fabricated from the flanges of the wide flange beam from which the tee
sections were obtained.
The fill plate in the tee-connections and the block of steel at the
center of the single-bolt connections were fabricated from 1 1/4 inch thick
plates of A36 steel.
4.2.2 Fabrication of Test Specimens
The details of the test specimens are shown in Figs. 4.1 and 4.2.
The various connected parts in the specimens were cut from the wide flange
shapes and plates described in Section 4.2.1, above. The edges of these
parts were machined but no machining was carried out on their surfaces;
the mill scale on these surfaces remained intact. The threads on the out
side of the cylindrical pieces in the single-bolt connections were cut in a
lathe. All bolt holes in the specimens were drilled.
4.3 Test Pr~cedures
4.3.1 Instrumentation of Bolts
A system of bolt instrumentation was adopted by means of which the
elongation of bolts and the tensile force in bolts installed in connections
could be measured.

16
a) Measurements of bolt elongation. Bolt elongation was measured
with the help of a special extensometer which was developed at the University
of Illinois for use in tests of high strength structural bolts. This
extensometer measures changes in the distance between gage points drilled at
the ends of the bolt to which it is attached. Changes in the length of the
bolt cause strains in four strain gages mounted on the extensometer. These
strains are directly proportional to the magnitude of the elongation of the
bolt and may be either measured with a portable strain indicator or recorded
continuously with an automatic electronic recording device. The sensitivity
of the extensometer (hereafter referred to as the U of I extensometer) is
sufficient to measure bolt elongations as small as 0.0001 inch.
b) Measurements of bolt tension. The tensile force in bolts was
computed from measurements of the average axial strain in the shank of the
bolts. This strain was measured with the help of two resistance strain gages
mounted on diametrically opposite sides of the bolt shank. The lead wires
from the strain gages were passed through small holes drilled through the
bolt head. Metal lugs were glued to the shank alongside the gages to prevent
contact between the gages and the side of the bolt hole.
The bolt tension was assumed to be linearly related to the average
axial shank strain (the average of the strains indicated by the two gages on
the bolt shank). In order to check the validity of this assumption and the
accuracy of the method adopted for determining the bolt tension, three A325
bolts and three A490 bolts were instrumented with strain gages as described
above and loaded in direct tension in a universal testing machine. One
instrumented bolt of each type (A325 and A490) was also loaded by torquing of
the nut with the bolt installed in a steel load transducer. All these bolts
were from the same lots and had the same grip lengths as the bolts used in
the tests of single-bolt and tee-connections.
17
For bolts loaded in direct tension, the relationship between
bolt tension (as indicated on the testing machine) and average axial shank
strain (as indicated by the strain gages) was found to be linear for values
of bolt tension up to at least 95 per cent of the ultimate tensile strength.
In the bolts loaded by torquing of the nut (with bolt tension measured using
the load transducer), the relationship remained linear up to ultimate.
Typical bolt tension versus shank strain relationships of bolts loaded in
direct tension and torqued tension are shown in Figs. 4.3 and 4.4,
respectively.
The constant of proportionality between bolt tension and average
axial shank strain was found to be nearly equal for all the bolts, regard
less of bolt type or method of loading. The values of this constant ranged
from 0.0130 to 0.0132 kips per microinch per· inch. A value of 0.0131 kips
per microinch per inch was used in the determination of the tensile force in
instrumented bolts installed in connections.
4.3.2 Bolt Calibration Tests
Calibration tests were conducted on A325 and A490 bolts to determine
their tension ver~us elongation relationships under direct tension, torqued
tension, and a combination of torqued and direct tension. Bolts for these
tests were from the same lots as those used in tests of connections.
Two direct-tension tests, two torqued-tension tests and one test
under torqued tension followed by direct tension were each performed on A325
bolts with 3 1/2 inch grip (with 7/16 inch of thread in the grip} and A490
bolts with 3 5/8 inch grip (with 9/16 inch of thread in the grip). In
addition, one bolt of each type was tested in direct tension with a grip
length of 3 3/16 inch (with 1/8 inch of thread in the grip). A description
of the procedure adopted for each type of calibration test follows.

18
a) Direct tension. The bolt to be calibrated was~aded in a
120 kip universal testing machine. The load fixtures used to grip the bolt
are shown in Fig. 4.5. The axial tensile force in the bolt was obtained
directly from the load-indicating dial on the testing machine. The elongation
of the bolt was continuously monitored with the U of I extensometer until the
ultimate load of the bolt was reached; readings were recorded at intervals of
bolt tension. Loading was continued until rupture of the bolt. During this
latter stage of loading (i.e., after the ultimate load had been reached), an
approximate measure of bolt elongation was obtained from the movement of
the testing machine's pull heads.
b) Torqued tension. In the torqued-tension calibration tests
an electric load transducer was used for the measurement of bolt tension.
The load cell, a steel spacer and one or more hardened washers provided
the specified grip length for the bolt to be calibrated. With the bolt
inserted through the load cell, spacer and washers, the nut was torqued with
a manual torque-indicating wrench until fracture of the bolt. The bolt
tension (measured using the load cell) and bolt elongation (measured using
the U of I extensometer) were recorded at 30 degree increments of nut
rotation.
c) Torqued tension followed by direct tension. Bolts calibrated
under this type of loading were instrumented with strain gages on the shank
for the measurement of bolt tension. The bolt to be calibrated was inserted
through two cylinders of hardened steel, threaded on the outside~ with a
steel spacer between them. Hardened washers were added under the nut to pro
vide the specified grip length. The bolt was subjected to torqued tension
of pre-selected magnitude (32 kips for A325 bolts, 40 kips for A490 bolts)
by turning the nut. The threaded cylinders gripped by the bolt were then
screwed into the pulling yokes used in tension tests of bolts (see Fig. 4.6)
and load was applied with a 120 kip universal testing machine until failure

19
of the bolt. Bolt elongation and bolt tension were recorded at intervals
of applied load. Till separation of the connected parts (determined by
slipping a piece of foil between them) occurred, bolt tension was determined
from the shank strain. After separation, bolt tension was obtained directly
from the load-indicating dial on the testing machine since the bolt tension
and the applied load were equal. Bolt elongation was determined as in the
direct tension calibration test.
4.3.3 Tests of Single-Bolt Connections
The bolts in all the single-bolt connections tested were instru
mented for measurement of bolt tension and elongation. A325 bolts were
installed with a flat hardened washer under the nut while A490 bolts were
installed with washers under both the nut and the bolt head. Thus, the
grip length of the A325 bolts was 3 1/2 inches (with 7/16 inch of thread in
the grip) and that of the A490 bolts was 3 5/8 inches (with 9/16 inch of
thread in the grip).
The bolt in specimen S(S)3-2 was installed with a pretension of
28 kips, i.e., the nut was torqued until the bolt tension (as determined
from the shank strain) reached a value of 28 kips. The bolts in all the
other specimens were tightened by the "snug plus half turn" method. A
"snug" load of approximately 5 kips (determined from the bolt elongation)
was obtained by turning the nut with a spud wrench. The nut was then
turned through an additional 180 0 with a manual torque wrench.
A 120 kip universal testing machine was used for loading single
bolt connections. The connection to be tested was screwed into the pulling
yokes normally used with the testing machine for loading bolts in direct
tension. Figure 4.6 shows a single-bolt connection installed in these
yokes. This system of loading is such that the outer, threaded parts of the
connection (see Figs. 4.1 or 4.6) are pulled away from each other.

20
Load was applied on the connection in several cycles. In each
cycle, the load was increased to a maximum value and then decreased to zero. The
maximum load in each cycle was approximately 5 kips higher than in the preceding
one. This procedure was continued until failure of the bolt. Bolt elongation
and bolt tension were recorded at small intervals of applied load during each
cycle of loading and unloading.
4.3.4 Tests of Tee-Connections
Tee-connections were tested under fatigue loading as well as static
loading. The static tests were of two different types denoted as type U and
type S. In static tests of type U, only the ultimate load of connections was
determined while in tests of type S, the behavior of connections under lower
levels of loading was also studied. The specimens subjected to tests of type U
and Shave U and S, respectively, as the first letters in their designation
(see Table 4.1).
All the tested tee-connections were assembled in a similar manner.
The faying surfaces of the connected parts were first cleaned with acetone to
remove any oil that might have been deposited on them during fabrication. Bolts
were installed with a snug load of approximately 5 kips followed by half a turn
of the nut. A325 bolts were installed with a flat hardened washer under the
nut. A490 bolts had washers under the bolt head as well as the nut. The grip
length of A325 bolts installed in tee-connections was 3 1/2 inches (with 7/16 inch
of thread in the grip) and that of A490 bolts was 3 5/8 inches (with 9/16 inch
of thread in the grip).
The tee-connections subjected to static tests of type U were made up
of tee-sections and fill plates which had previously been used in fatigue tests.
(The tees and plates were examined following the fatigue tests; there was no
discernible permanent deformation.) All other test specimens employed only
freshly fabricated connected parts.

21
The instrumentation of connections, the method of loading followed,
and the measurements made in each of the three types of tests (fatigue tests
and two types of static tests) are described below.
a) Fatigue tests. In each of the tee-connections tested under
fatigue loading, either one or two of the four bolts in the flange of the con
nection were instrumented for measurement of bolt tension. (Where two bolts
were instrumented, they were installed in diagonally opposite locations in
the flange.) All four bolts had gage points drilled in them for the
measurement of elongation using the U of I extensometer. Dial gages with
0.0001 inch graduations were mounted at each edge of the tee-section webs
to obtain a measure of flange separation at the web.
Cyclic loading of constant amplitude was applied to each connection
in a 200 kip Illinois fatigue machine. A zero-to-tension load cycle was
used. The maximum load applied to the various specimens was as follows:
75 kips to F(TO)3-2, 86 kips to F(T2)3-l, 94 kips to F(TO)4-2, 79 kips to
F(T4)4-2, 72 kips to all other specimens with A325 bolts and 100 kips to all
other specimens with A490 bolts. The rate at which cycles of load were
applied was approximately 200 per minute (except when the fatigue machine
was stopped for the taking of measurements).
During the first cycle of loading on each connection, measurements
of bolt tension, bolt elongation and flange separation were made at intervals
of applied load of approximately 15 kips. This first cycle was applied
"statically." Thereafter, measurements were made at zero applied load and
maximum applied load in cycles at approximately logarithmic intervals, i.e.,
in the 2nd cycle, 4th cycle, 10th cycle, 25th cycle, etc.
Failure of a. connection was deflned as having occurred when com
plete fracture of one or more of the bolt in the tee-section flanges took
place. If failure had not occurred after the application of about 3,000,000
cycles of load, the test was terminated.

22
b) Static tests of type U. The specimens subjected to tests of
this type were not instrumented in any way. The connection to be tested
was installed in a 300 kip universal testing machine and tensile load was
applied until fracture of the bolts in the tee-section flanges occurred.
(In every tee-connection tested under static loading, all four bolts
appeared to fail simultaneously.) The ultimate load was recorded.
c) Static tests of type S. The instrumentation of specimens for
these tests was exactly the same as for the fatigue tests (see above) except
that in specimen S(T4)3-l all four bolts in the flange were instrumented
for measurement of bolt tension.
A 300 kip universal testing machine was used for loading the
connections. Tensile load was applied in several cycles. In each cycle,
the bad was increased to a maximum value and then decreased to zero~ The
maximum load in each cycle was approximately 20 kips higher than in the
preceding one. This procedure was continued until failure of the bolts.
The bolt tension, bolt elongation and flange separation were
recorded at small intervals of applied load during each cycle of loading
and unloading.
4.4 Discussion of Results
4.4.1 Tension-Elongation Relationship of Bolts
Idealized bolt tension versus bolt elongation relationships were
formulated for use in the analysis of tee-connections. These idealized
relationships were based on the results of bolt calibration tests.
The mean tension-elongation relationships obtained from direct
tension and torqued tension calibration tests of A325 bolts of 3/4 inch
nominal diameter with a grip length of 3 1/2 inches and 7/16 inch of thread
in the grip are shown in Fig. 4.7. Also shown in the figure are idealized
relationships for a bolt of the same type with the same diameter, grip length
and length of thread. in the grip. Similar relationships for an A490 bolt of

23
3/4 inch nominal diameter with a grip length of 3 5/8 inches and 9/16 inch of
thread in the grip are shown in Fig. 4.8.
Bolts in tee-connections are subjected to torqued tension during
the bolt-tightening (or pretensioning) process followed by direct tension
when external load is applied to the connection. A procedure was, therefore,
developed by which the tension-elongation relationship of a bolt which is
first pretensioned by torquing and then loaded in direct tension could be
analytically estimated, given the tension-elongation relationships of the
bolt under direct tension and torqued tension. This procedure is illustrated
graphically in Fig. 4.9. In Figs. 4.10 and 4.11, the experimentally deter
mined tension-elongation relationships of two pretensioned bolts loaded in
direct tension are compared with relationships obtained by applying the
analytical procedure mentioned above to the idealized direct-tension and
torqued-tension tension-elongation relationships shown in Figs. 4.7 and
4.8. The analytically obtained relationships are seen to be in close
agreement with those determined experimentally. Direct-tension tests per
formed on pretensioned bolts by Rumpf and Fisher (7) and Christopher,
Kulak and Fisher (8) yielded tension-elongation characteristics similar in
form to those shown in Figs. 4.10 and 4.11.
The idealized tension-elongation relationships shown in Figs. 4.7
and 4.8 were formulated for bolts with a particular diameter, grip length
and length of thread in the grip. Discussed below is the manner in which
these idealized relationships were changed to reflect changes in the grip
length, length of thread in the grip and diameter of bolts. It is evident
from the method used for analytically estimating the tension-elongation
relationship of pretensioned bolts loaded in direct tension (see Fig. 4.9)
that, for a given value of the pretension, the form of the resulting re
lationship is determined largely by the form of the direct-tension

24
calibration curve. Hence, emphasis was placed on accurately taking into
account the effect of the bolt variables (grip length, diameter, etc.) on
the direct-tension tension-elongation relationship.
Effect of grip length. The effect of grip length was not
studied experimentally in the investigation reported herein. However, pre
vious experimental studies (7,8,9) have shown that grip length has no appreci
able effect on the tension-elongation characteristics of high-strength bolts
beyond the "proportional limit," especially in bolts loaded in direct
tension. (The "proportional limit" is th"e point at which the relationship
first deviates from linearity.) Below the "proportional limit," the
slope of the tension-elongation relationship was found to be approximately
proportional to the reciprocal of the grip length.
In view of these experimental findings, the slope of the first
straight-line segment of the idealized tension-elongation relationship
(under both direct and torqued tension) was varied in inverse proportion
to the grip length. The remainder of the relationship was not changed except
for the horizontal translation made necessary by the changed elongation at
the end of the first segment.
Effect of thread length in grip. The tension-elongation re
lationships which were obtained from the direct-tension calibration tests of
A325 and A490 bolts with only 1/8 inch of thread in the grip are shown in
Fig. 4.12. For comparison, the relationships for bolts with greater lengths
of thread in the grip (and slightly larger grip lengths) are also shown in
the figure. The effect of a decrease in the length of thread in the grip is
seen to be fairly small--a slight increase in the ultimate load of the
bolt and a slight decrease in ductility. (The ductility of the bolts with
less thread in the grip, however, remained greater than that assumed in
the idealized relationships for the bolts with more thread in the grip.)

25
Similar results were obtained in the direct-tension calibration tests re
ported in references 7 and 9. Hence, in the formulation of idealized tension
elongation relationships for bolts under direct tension, the effect of
changes in the length of thread in the grip was ignored.
The amount of thread in the grip has been shown to substantially
influence the tension-elongation relationship of bolts under torqued tension
(7,8,9). However, since the relationship under torqued tension is of
secondary importance in the present study, the effect of thread length- on
this relationship, too, was ignored.
Effect of bolt diameter. Connections assembled with bolts of
diameters other than 3/4 inch were neither tested nor analyzed. However,
the analytical investigation included an indirect study of the effect of
bolt diameter on the behavior of tee-connections. In this study, it was
assumed that the bolt tension corresponding to a given value of bolt
elongation was directly proportional to the square of the nominal bolt
diameter and that the bolt elongation at rupture was independent of bolt
diameter. (These assumptions also imply that the ultimate load of a bolt
is proportional to the square of its diameter and that the elongation at
ultimate is independent of diameter.)
The results of direct-tension calibration tests of A325 bolts of
various diameters reported in reference 7 agree fairly well with the
assumptions described above.
4.4.2 Behavior of Tee-Connections Under Static Loading
Experimental data on the behavior of tee-connections under static
loading were obtained from static tests as well as from the first cycle of
loading in fatigue tests. The information obtained on each of the important
behavioral characteristics of statically loaded tee-connections is discussed

26
below. In this discussion, the results of tests of single-bolt connections
are used for comparison with the observed behavior of tee-connections.
a) Relationship between bolt tension and applied load. The bolt
tension versus applied load relationship obtained for specimen 5(S)3-l, a
single-bolt connection assembled with an A325 bolt, is shown in Fig. 4.13.
The behavior of this specimen was typical of that observed in tests of all
single-bolt connections. As ·is evident in the figure, external load was
applied to the connection in cycles of successively larger amplitude. The
bolt pretension was approximately 33 kips~ Each cycle of applied load caused
a drop in the clamping force. ("Clamping force," as used herein, denotes
the bolt tension when there is no external load on the connection.) The magni
tude of this drop in clamping force was larger for cycles of applied load of
larger amplitude. The relationship between bolt tension and applied load
obtained for each cycle of loading is seen to be very similar in form to
the relationship predicted in Section 2.2.1 (see Fig. 2.5).
The relationships between bolt tension and externally applied load
per bolt obtained for specimens 5(T3)3-l and 5(T4)3-l, two 'tee-connections
which behaved in markedly different ways, are shown in Figs. 4.14 and 4.15,
respectively. Both these specimens were assembled with A325 bolts. The
geometry of the two connections was different: 5(T4)3-l had a larger gage
distance (see Table 4.1 and Fig. 4.2). The bolt tension versus applied
load per bolt relationship of specimen 5(T3)3-l was very similar to that
of single-bolt connections (compare Figs. 4.14 and 4.13). This indicates
that there was little or no prying action in tee-connection 5(T3)3-l. In
connection 5(T4)3-l, however, there was a substantial amount of prying.
The bolt tension versus applied load relationship observed for this tee
connection (Fig. 4.15) was similar in form to the relationship predicted in
5ection 2.2.1 for tee-connections subject to prying action (see Fig. 2.5).

27
The bolt tension versus applied load relationships of all tee
connections which were instrumented for measurement of bolt tension are shown
in Figs. 4.16 and 4.17. Figure 4.16 shows the characteristics of connections
assembled with A325 bolts; those of connections with A490 bolts are shown
in Fig. 4.17. The relationship for each tee-connection is compared with
that of a single-bolt connection with the same type of bolt and the same
clamping force. For those tee-connections (such as 5(T3)3-l and 5(T4)3-l)
which were loaded in several cycles, only the relationship corresponding to a
single value of clamping force is shown. ·A number of the bolt tension versus
applied load relationships shown in Figs. 4.16 and 4.17 were obtained from
the first cycle of loading in fatigue tests and do not, therefore, cover
the entire range of load from zero to ultimate.
The number of bolts that were instrumented (with strain gages on
the shank) for measurement of bolt tension in each of the tee-connections for
which bolt tension versus applied load relationships were obtained is indi
cated in Figs. 4.16 and 4.17. The relationship shown for each of the tee
connections which had more than one instrumented bolt is based on the average
of measurements from all the instrumented bolts in the connection.
It was found that at relatively low levels of loading the distri
bution of load among the four bolts in some of the tee-c;Onnections tested
was non-uniform, i.e., the tension in each of the four bolts in these connections
did not increase uniformly when small external loads were applied to the
connection. At higher loads, however, this non-uniformity decre~sed until,
at loads close to the ultimate load of the connection, the tensile forces
in all the bolts approached the strength of the bolts as determined from
direct-tension calibration tests.
b) Prying force and ultimate load. The manner in which prying
forces affect the bolt tension versus applied load relationship and the
28
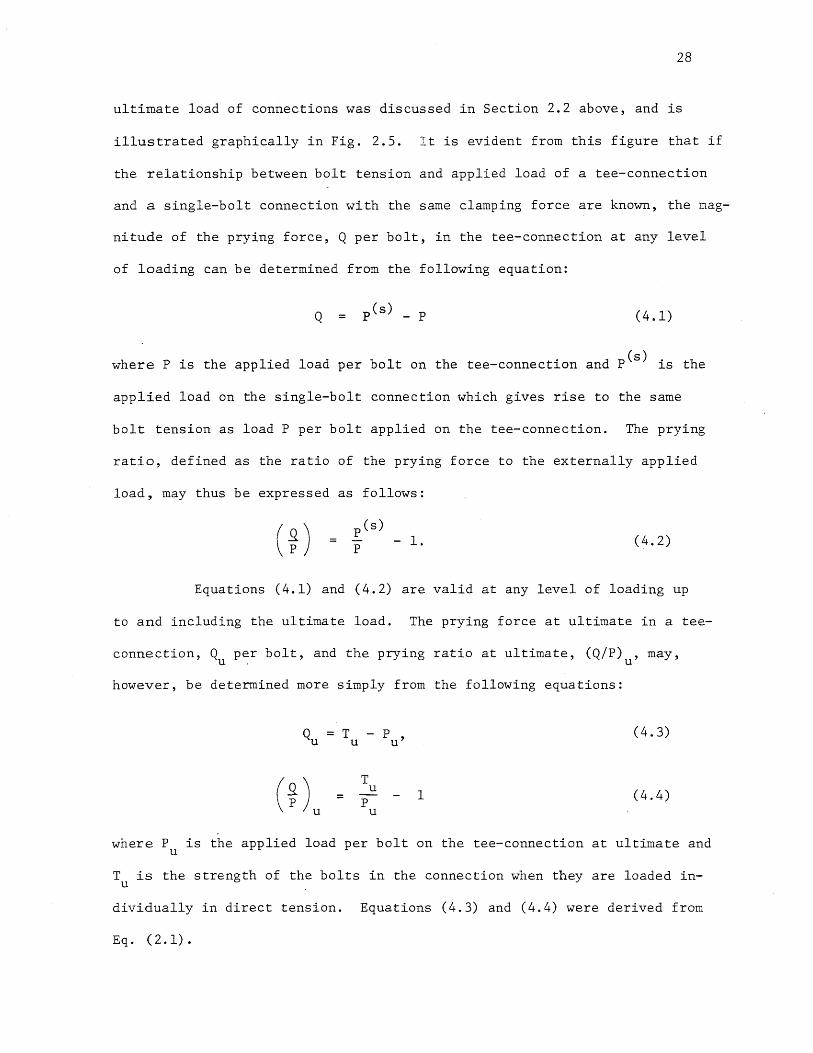
ultimate load of connections was discussed in Section 2.2 above, and is
illustrated graphically in Fig. 2.5. It is evident from this figure that if
the relationship between bolt tension and applied load of a tee-connection
and a single-bolt connection with the same clamping force are known, the mag-
nitude of the prying force, Q per bolt, in the tee-connection at any level
of loading can be determined from the following equation:
Q (4.1)
where P is the applied load per bolt on the tee-connection and pes) is the
applied load on the single-bolt connection which gives rise to the same
bolt tension as load P per bolt applied on the tee-connection. The prying
ratio, defined as the ratio of the prying force to the externally applied
load, may thus be expressed as follows:
(%) P
pes) - 1. (4.2)
Equations (4.1) and (4.2) are valid at any level of loading up
to and including the ultimate load. The prying force at ultimate in a tee-
connection, Q per bolt, and the prying ratio at ultimate, (Q/P) , may, u . u
however, be determined more simply from the following equations:
T - P u u'
T u
P u
I
(4.3)
(4.4)
where P is the applied load per bolt on the tee-connection at ultimate and u
T is the strength of the bolts in the connection when they are loaded inu
dividua1ly in direct tension. Equations (4.3) and (4.4) were derived from
Eq. (2.1).

29
The efficiency of bolts in a tee-connection, ¢, is defined thus:
p u
T u
(4.5)
The prying ratios at ultimate and the bolt efficiencies of all the
tee-connections which were tested to failure under static loading were deter-
mined using Eqs. (4.4) and ~.5). The values of T used were 42.0 kips for u
A325 bolts and 51.8 kips for A490 bolts. In addition, for each of the tee-
connections for which relationships between bolt tension and applied load
were obtained experimentally (see Figs. 4.16 and 4.17), the prying ratio
at a relatively low level of applied load, P , was determined using Eq. a
(4.2). The value of P was approximately 71 kips for connections assembled a
with A325 bolts and 95 kips for connections with A490 bolts. These loads
correspond to nominal bolt stresses, computed neglecting prying, of 40 ksi
in A325 bolts and 54 ksi in A490 bolts. These stresses are the maximum
allowable stresses specified fo~ bolts in buildings in the current specifi-
cation of the Research Council on Riveted and Bolted Structural Joints of
the Engineering Foundation (10).
The prying ratios and bolt efficiencies of tee-connections, deter-
mined as described above, as well as the ultimate loads of those tee-connections
which were loaded to failure are shown in Table 4.2. The table also shows the
edge distance and gage of each connection. All other geometric parameters
were the same in all the tee-connections tested (see Fig. 4.2).
It may be observed in Table 4.2 that there were some differences
between the prying ratios at load P determined from tests of nominally similar a
connections, i.e., connections with the same nominal geometry assembled with
bolts of the same type. These differences could have been caused by such
factors as small amounts of out-of-flatness of the contact surfaces of the

30
tee-section flanges and differences in clamping force between the various
connections. Further, some of the values of prying ratio at P shown in a
Table 4.2 were determined from bolt tension versus applied load relation-
ships which were based on measurements of the tension in only one of the four
bolts in a connection. The method used for determining the prying ratio at
low levels of loading (see Eq. (4.2) and Fig. 2.5) was such that the resulting
values of prying ratio are highly sensitive to differences in the bolt
tension versus applied load relationship of connections.
The experimentally determined ultimate loads--and the corresponding
bolt efficiencies and prying ratios at ultimate--were almost identical for
tee-connections with the same nominal geometry and the same type of bolt. No
two such connections had values of ultimate load that differed by more than
2 per cent (see Table 4.2). It is apparent,_ therefore, that the factors which
cause differences in the behavior of nominally similar tee-connections under
relatively low loads have little effect on the ultimate load of tee-connections.
The data in Table 4.2 also indicate that static tests of type S (in which load
was applied in cycles of increasing amplitude) and those of type U (in which
the load applied to connections was increased continuously) yielded essen-
tially the same values of ultimate load.
The effect of edge distance and gage on the prying ratio of tee-
connections at load P (where P is the maximum allowable load on the a a
connection, computed neglecting prying, based on the allowable working stresses
specified in reference 10) is shown graphically in Figs. 4.18 and 4.19,
respectively. The influence of the same geometric parameters on the prying
ratio of tee-connections at ultimate is shown in Figs. 4.20 and 4.21.
The prying ratio, both at P and at ultimate, was higher in cona
nections with an edge distance of 1 3/4 inches than in connections with edge
31
distances of 1 inch or 2 1/2 inches. Thus, there appear to be "optimum"
values of edge distance (for connections with bolts of a given ~ype and
given values of the other geometric parameters) at which the prying ratios
at P and at ultimate are maximum (see Figs. 4.18 and 4.20). Increases in a
the gage distance of tee-connections were found to result in higher values
of prying ratio (see Figs. 4.19 and 4.21). Among connections with the same
geometry, the prying ratio at P and at ultimate was, in general, higher a
in those assembled with A490 bolts than in those with A325 bolts (see Figs.
4.18, 4.19, 4.20 and 4.21). In connections with the same geometry and bolt
type, the prying ratio was, in general, higher at load P than at ultimate a
(compare Figs. 4.18 and 4.20 and Figs. 4.19 and 4.21).
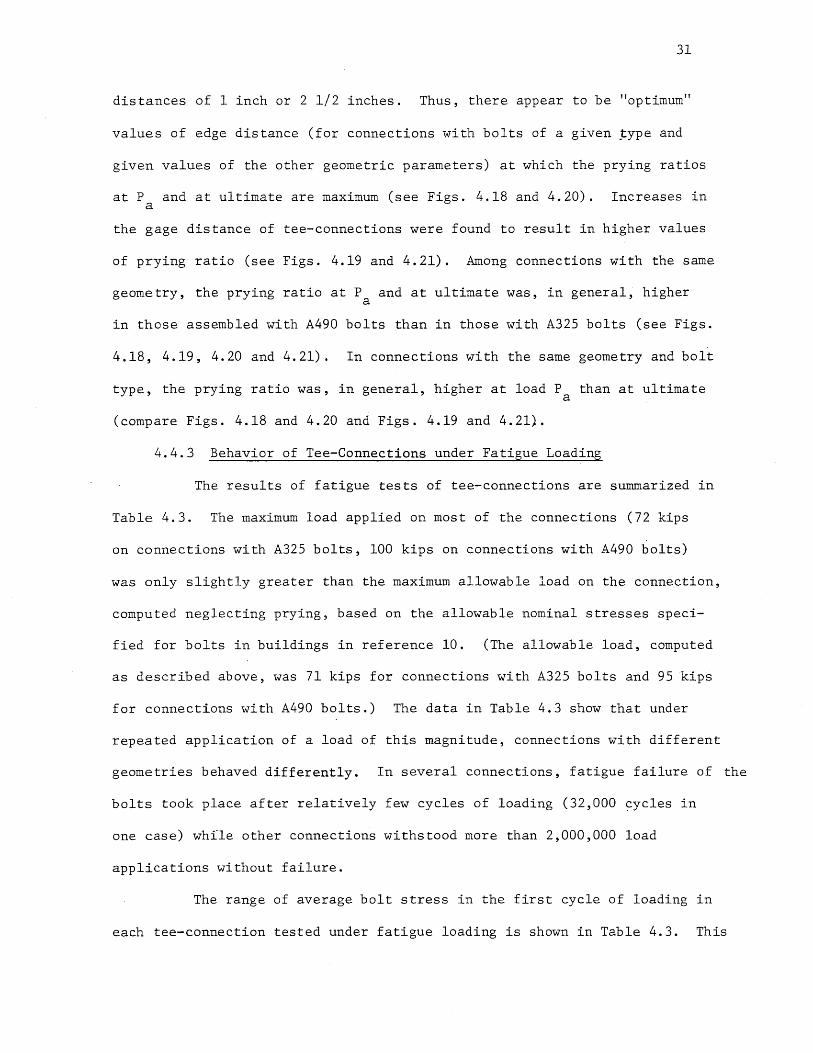
4.4.3 Behavior of Tee-Connections under Fatigue Loading
The results of fatigue tests of tee-connections are summarized in
Table 4.3. The maximum load applied on most of the connections (72 kips
on connections with A325 bolts, 100 kips on connections with A490 bolts)
was only slightly greater than the maximum allowable load on the connection,
computed neglecting prying, based on the allowable nominal stresses speci-
fied for bolts in buildings in reference 10. (The allowable load, computed
as described above, was 71 kips for connections with A325 bolts and 95 kips
for connections with A490 bolts.) The data in Table 4.3 show that under
repeated application of a load of this magnitude, connections with different
geometries behaved differently. In several connections, fatigue failure of the
bolts took place after relatively few cycles of loading (32,000 ~ycles in
one case) while other connections withstood more than 2,000,000 load
applications without failure.
The range of average bolt stress in the first cycle of loading in
each tee-connection tested under fatigue loading is shown in Table 4.3. This

32
range in bolt stress is the measured range in bolt tension divided by the
nominal cross sectional area of the bolt shank. For connections in which
the tension in two bolts was measured, the range in average bolt stress
shown in Table 4.3 is the range in average stress in the bolt with the higher
range. Figure 4.22 shows the number of cycles to failure, N, of tee-con
nections subjected to repeated loading plotted against the range in average
bolt stress measured during the first cycle of loading, R. Data from all
the fatigue tests that were performed on tee-connections are included in the
figure. For connections assembled with bolts of a given type (A325 or
A490) there appears to be a relationship between Rand N that is independent
of the geometry of the connection (see Fig. 4.22) except when R is very high
and N is correspondingly low (less than about 300,000).
The reason for the lack of a generally valid relationship between
Rand N in the low-cycle region becomes apparent upon study of the manner
in which the range in average bolt stress in tee-connections changed during
fatigue tests. (Note that R was defined as the range in average bolt stress
in the first cycle of loading.) The changes in the range of average bolt
stress observed during fatigue tests of specimens F(TO)4-1, F(T4)4-1 and
F(T4)4-2 are shown in Fig. 4.23. The behavior indicated for specimen
F(T4)4-2 is typical of that observed in tests of tee-connections in which R
was relatively low and the number of ,cycles to failure, N, was larger than
about 500,000. The range of bolt stress measured during the first cycle
of loading, R, provided an accurate indication of the stress range through
out these fatigue tests. In tests in which R was relatively high, however,
the range of bolt stress after the first few applications of load was found
to be influenced by factors other than the magni tude o'f R, notably the
geometry of the connection (compare the behavior of F(TO)4-1 and F(T4)4-1
in Fig. 4.23).

33
It was estimated, on the basis of the data shown in Fig. 4.22,
that the value of R corresponding to failure of bolts in tee-connections
after 2,000,000 cycles of loading is 4 ksi for A325 bolts and 3 ksi for A490
bolts. The magnitude of the externally applied load which would result in
this value of R in a particular tee-connection can be determined from the
bolt tension versus applied load relationship of the connection. Thus, as
shown in Fig. 4.24, if the bolt tension versus applied load relationship of
a connection is known (this relationship can, for example, be obtained from
a static test of the connection), the magnitude of the external load which
would cause failure of the connection after 2,000,000 applications can be
estimated.
Owing to the paucity of experimental data, no attempt was made to
establish a Rversus N relationship for values of N smaller than 2,000,000.
The available data indicate, however, that for each type of bolt investigated
(A325 and A490) a relationship between Rand N, independent of connection
geometry, does exist for values of N larger than about 300,000. If such
relationships were established, the procedure described above could be used
to estimate the magnitude of externally applied load on a tee-connection
which would cause fatigue failure of the bolts in the connection after any
given number of applications between about 300,000 and 2,000,000.

CHAPTER 5
ANALYTICAL STUDY
34
The analytical investigation of bolted tee-connections consisted
of numerical analyses of a large number of such connections with different
geometries and bolt properties. The method of analysis was such that infor
mation on the ultimate load of connections as well as their behavior at lower
levels of loading was obtained. The effect of geometric parameters on the
behavior of tee-connections assembled with A32S or A490 bolts was studied.
A description of the analysis, a listing of the parameters in
vestigated and a discussion of the results obtained follow.
S.l Description of the Analysis
The analysis of tee-connections was carried out with the aid of a
digital computer; a program was written for this purpose. The parameters
which may be varied in connections analyzed using this computer program, the
assumed mechanical properties of the materials in connections, the method
of solution adopted and the output from the analysis are described below.
S.l.l Variable Parameters
The parameters which may be varied in the analysis of tee
connections using the computer program include the dimensions of the connection;
the number, diameter and grip length of the bolts; the bolt type (A32S or
A490); the bolt pretension or clamping force; and the yield stress of the
steel in the tee-section when it is under a uniaxial state of stress.
Further, the connection may be symmetrical, i.e., it may consist of two
identical tee-sections with their flanges bolted together, or it may consist
of a single tee-section bolted to a perfectly rigid base. The inclusion of
a fill plate between the tees in a symmetrical connection can be taken into
account by increasing the bolt grip by an appropriate amount.

35
The variable parameters described above are designated Cl
, C2
,
C13
in Fig. 5.1. The figure also shows that the fillet between the web
and the flange of tee-sections is assumed to be triangular in cross section.
5.1.2 Assumed Properties of Materials
Stress-strain characteristics of the steel in tee-sections. The
steel in tee-sections is treated as an elastic-perfectly plastic material
with a yield stress in simple tension, 0 , equal to the specified value (0 o 0
being one of the variable parameters in the analysis); a yield plateau of
infinite length; and a value of Young's modulus, E, of 30,000 ksi in the
elastic range.
Tension-elongation relationship of bolts. The bolt tension versus
bolt elongation characteristics assumed in the analysis are the idealized
relationships that were developed in Section 4.4.1, above. The idealized
tension-elongation relationships for A325 and A490 bolts with a particular
grip length and diameter subjected to direct tension and torqued tension
are shown in Figs. 4.7 and 4.8. The manner in which these relationships
are modified to reflect changes in grip length and diameter was described
in Section 4.4.1. The tension-elongation characteristics used in the
analysis of tee-connections are those of pretensioned bolts subjected to
direct tension. The manner in which these relationships are obtained for
any specified value of pretension is shown graphically in Fig. 4.9 and was
discussed in Section 4.4.1.
5.1.3 Method of Solution and Output Obtained
The finite element method of analysis was adopted. A detailed
description of the analytical procedure is presented in Appendix A.
The connection is loaded, in the analysis, by means of increments
of displacement applied to the web of the tee-sections. The magnitude of
these increments of web displacement is such that failure of the connection

36
occurs after ten to fifteen increments. At each level of loading, i.e., at
each value of applied deformation, the following data are obtained as output
from the analysis:
1. the applied load on the tee-section web;
2. displacement of the web;
3. the tensile force in the bolts;
4. bolt elongation;
5. the magnitude and distribution of the reaction on the bottom
of the tee-section flange;
6. the deformed shape of the bottom of the flange;
7. stresses in the flange.
Failure of the connection is assumed to occur when the bolt elon
gation exceeds the value at which the bolts rupture or a mechanism is formed
by yield of the tee-section flange through its entire depth at locations
near the web and the bolt line. The ultimate load of the connection is, by
definition, the maximum value of the applied load on the tee-section web
(item 1, above).
Example of results of analysis. Selected results from the analysis
of a particular tee-connection are shown in Table 5.1. The connection was
symmetrical and had no fill plate between the two tee-sections. The important
dimensions of the connection are indicated in Table 5.1. The bolt pre
tension was 35 kips.
The analysis yielded data on the loads, reactions, stresses and
deformations-in the connection at eleven different levels of load ranging
from the unloaded condition to ultimate. The bolt tension and the magnitude
and distribution of the reaction on the bottom of the tee-section flange
corresponding to each of eight different values of the externally applied

37
load are shown in Table 5.1. The portions of the flange which were in the
plastic state at each level of loading are also indicated in the table.
The strength of each bolt in the connection, T , was 52.0 kips-u
this is the value assumed for A490 bolts of 3/4 inch diameter (see the
idealized bolt tension versus bolt elongation relationship in Fig. 4.8).
The ultimate load of the connection, P per bolt, was found to be 40.3 kips u
per bolt (see Table 5.1). The prying ratio at ultimate in the connection,
(Q/P)u' and the bolt efficiency, ¢ , were, therefore, as shown below.
(¥ ) T - P
52.0 - 40.3 u u 0.29
P 40.3 u u
P 40.3 u
0.78 T 52.0 u
The analytical results shown in Table 5.1 could also be used to determine
the bolt tension versus applied load relationship of the connection. From
this relationship, PR can be obtained, where PR
is the applied load on the
tee-connection which causes an increase in bolt stress of magnitude R. It
was found, for example, that ~ksi was 15.0 kips per bolt for the connection
for which analytical results are shown in Table 5.1.
5.2 Parameters Investigated
The influence of the following parameters on the behavior of tee-
connections assembled with A325 and A490 bolts was studied analytically:
1. edge distance, a;
2. the distance from the bolt line to the web face. This.
distance minus 1/16 inch is denoted as b;
3. flange thickness, t;
4. length of flange tributary to each bolt (the length of the flange,
measured parallel to the web, divided by the number of rows of
bolts), w;

38
5.. bolt diameter, d.
The notation of these parameters is also shown in Fig. 5.2.
Symmetrical tee-connections with twenty-six different combinations
of values of the geometric parameters a, b, t and wand tee-to-rigid-base
connections with three different geometries were analyzed. The designation
of these twenty-nine geometries and the corresponding values of a, b, t
and ware shown in Table 5.2. With a few exceptions (see Table 5.2), two
connections of each geometry--one with A325 bolts and one with A490 bolts--
were analyzed. The bolt diameter, d, was,3/4 inch and the yield stress of
the tee-section material, 0 , was 38 ksi in all connections. o
The grip length of bolts in symmetrical tee-connections was
assigned a value of 2t plus the fill plate thickness plus the thickness of
washers (one washer for A325 bolts; two for A490 bolts). In the tee-to-
rigid-base connections analyzed, the bolt grip was approximately 1.5t. The
geometry of standard wide flange sections was used in assigning a web
thickness corresponding to each flange thickness. Thus, the web thickness
in each connection was approximately two-thirds of t. The size of the web-
to-flange fillet (C5
in Fig. 5.1) was approximately 0.25 inch in all
connections.
Connections of geometry TO, Tl, T2, T3 and T4 (see Table 5.2) were
assigned properties which approximated those of the tee-connections which
were tested in the experimental program; these connections were analyzed
with values of bolt pretension of 32 kips for A325 bolts and 40 kips for A490
bolts. The bolt pretension in all the other connections analyzed was 28 kips
for A325 bolts and 35 kips for A490 bolts--these are the minimum permissible
values specified in reference 10.

39
5.3 Discussion of Results
The results of the analysis of tee-connections assembled with A325
and A490 bolts are summarized in Tables 5.3 and 5.4, respectively. For each
connection, the ultimate load, bolt efficiency, prying ratio at ultimate and
mode of failure are shown in the tables. The externally applied load on a
connection which causes an increase in bolt stress of magnitude R is denoted
as PR- Analytically determined values of P4 ksi for connections assembled
with A325 bolts and P3 ksi for connections with A490 bolts are also shown
in Tables 5.3 and 5.4; these are the values of applied load which might be
expected to cause fatigue failure of the bolts in the connections after
2,000,000 applications (see Section 4.4.3). The values of bolt efficiency,
¢ , and prying ratio at ultimate, (Q/P) , presented in Tables 5.3 and 5.4 u
were obtained from the following equations:
P u
T u
T - P u u
P u
where P is the analytically determined ultimate load of the tee-connection, u
expressed in kips per bolt, and T is the strength of each bolt in the u
connection. The value of T" selected was 42 kips for A325 bolts of 3/4 inch u
diameter and 52 kips for A490 bolts of 3/4 inch diameter.
Two of the tee-connections analyzed failed through formation of a
mechanism in the flange; the mode of failure in all the other connections was
bolt fracture. Values of prying ratio at ultimate for the connections which
failed by formation of a mechanism are not shown in the tabulated summary of
experimental results since the equation, above, relating (Q/P)u' Tu and Pu
is valid only when failure of the connection results from bolt fracture.

40
5.3.1 Comparison of Results of Analysis with Experimental Data
The tee-connections analyzed included ten connections with the
same geometry, bolt diameter and bolt type as connections which were tested
under static loading. This permits a direct comparison between the behavior
of tee-connections as determined by analysis and as determined experimentally.
Such a comparison is made in Tabl~ 5.5. The analytically determined values
of PR
(where R is equal to 4 ksi in connections with A325 bolts and 3 ksi
in connections with A490 bolts), ultimate load, bolt efficiency and prying
ratio at ultimate closely approximate the values obtained experimentally.
It was concluded, therefore, that the analysis accurately determines the
behavior of bolts in tee-connections both at ultimate and at lower levels
of loading.
5.3.2 Prying Action in Tee-Connections at Ultimate
The results of the analysis indicate that the ultimate load--and,
consequently, the prying ratio at ultimate--of a connection made up of
two identical tee-sections bolted together is not appreciably different
from that of a connection comprising one of the same tee-sections bolted
to a rigid abutm~nt (compare the ultimate loads of connections with geometry
B3 and B3R, C6 and C6R or E3 and E3R in Table 5.4).
Inclusion of a fill plate between the tee-sections in a symmetrical
tee-connection is taken into account in the analysis of the connection by
increasing the grip length of the bolts in the connection by an appropriate
amount. Changes in grip length have little effect on bolt tension and bolt
elongation at ultimate (see Section 4.4.1). Hence, the influence of a fill
plate on the analytically determined ultimate load of a tee-connection would
be negligible.
Relationships between parameters b, a, t, wand d (defined in Fig.
5.2) and analytically determined values of prying ratio at ultimate, (Q/P) , u
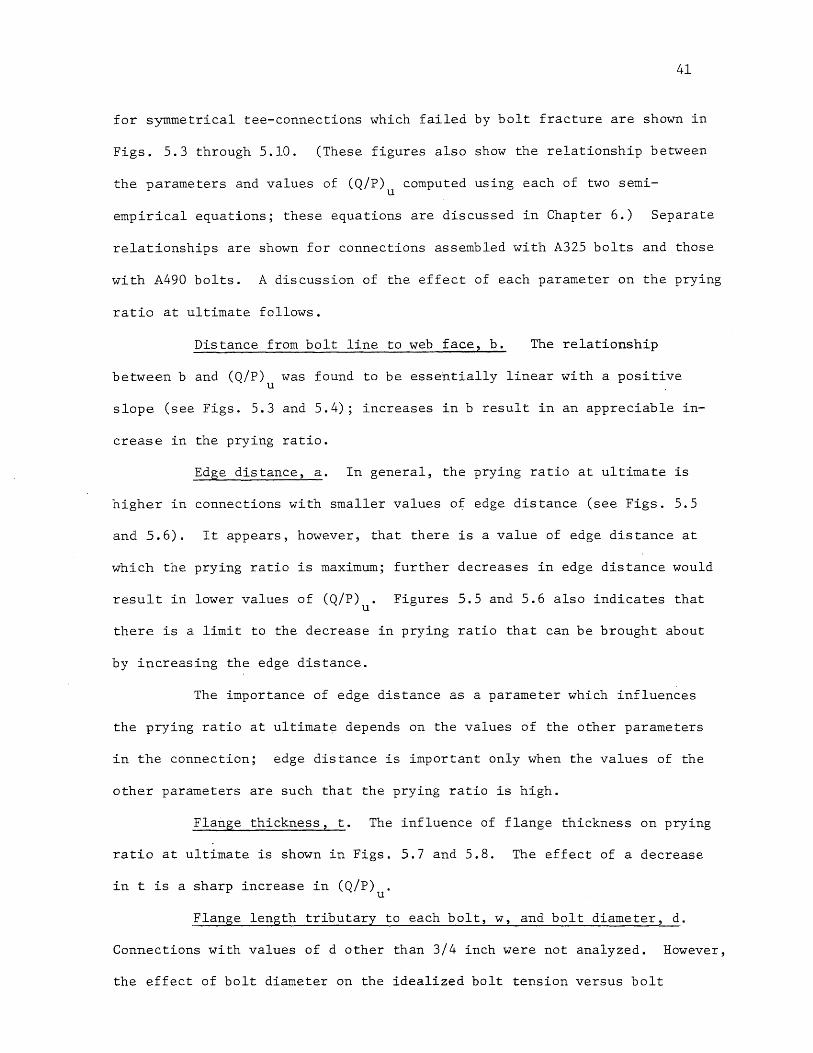
41
for symmetrical tee-connections which failed by bolt fracture are shown in
Figs. 5.3 through 5.10. (These figures also show the relationship between
the parameters and values of (Q/P) computed using each of two semiu
empirical equations; these equations are discussed in Chapter 6.) Separate
relationships are shown for connections assembled with A325 bolts and those
with A490 bolts. A discussion of the effect of each parameter on the prying
ratio at ultimate follows.
Distance from bolt line to web face, b. The relationship
between band (Q/P) was found to be essehtially linear with a positive u
slope (see Figs. 5.3 and 5.4); increases in b result in an appreciable in-
crease in the prying ratio.
Edge distance, a. In general, the prying ratio at ultimate is
higher in connections with smaller values of edge distance (see Figs. 5.5
and 5.6). It appears, however, that there is a value of edge distance at
which the prying ratio is maximum; further decreases in edge distance would
result in lower values of (Q/P) . Figures 5.5 and 5.6 also indicates that u
there is a limit to the decrease in prying ratio that can be brought about
by increasing the edge distance.
The importance of edge distance as a parameter which influences
the prying ratio at ultimat~ depends on the values of the other parameters
in the connection; edge distance is important only when the values of the
other parameters are such that the prying ratio is high.
Flange thickness, t. The influence of flange thickness on prying
ratio at ultimate is shown in Figs. 5.7 and 5.8. The effect of a decrease
in t is a sharp increase in (Q/P) . u
Flange length tributary to each bolt, w, and bolt diameter, d.
Connections with values of d other than 3/4 inch were not analyzed. However,
the effect of bolt diameter on the idealized bolt tension versus bolt

42
elongation relationships used in the analysis of tee-connections (see
Section 4.4.1) is such that changes in 1/d2
would have exactly the same
effect on analytically determined values of (Q/P)u as equal changes in w.
Hence, w/d2
may be regarded as a single parameter.
Relationships between w/d2
and (Q/P) are shown in Figs. 5.9 and u
5.10. The prying ratio is substantially higher in connections with lower
2 values of wid .
5.3.3 Behavior of Bolts in Tee-Connections at Low Loads
It was stated above that the ultimate load of a connection made
up of two identical tee-sections bolted together was not appreciably differ-
ent from that of a connection comprising one of the same tee-sections bolted
to a rigid abutment; it was further stated that inclusion of a fill plate
between the tee-sections in a symmetrical tee-connection had little effect
on the ultimate load of the connection. These differences in the con-
figuration of tee-connections do, however, influence the behavior of bolts
in connections at relatively low levels of loading as explained below.
Analysis of connections assembled with A490 bolts yielded lower
values of P3
k . for symmetrical tee-connections (without fill plates) than Sl .
for tee-to-rigid-base connections with the same tee-section dimensions
(compare the results obtained for connections with geometry B3 and B3R, C6
and C6R, and E3 and E3R in Table 5.4). The grip length of bolts in the
tee-to-rigid-base connections analyzed was approximately 1.5t where t is
the thickness of the tee-section flange; in symmetrical tee-connections
without fill plates, the bolt grip was slightly greater than 2t. Values of
PR
, where R is a small stress range, would be lower for tee-to-rigid-base
connections than for symmetrical connections with the same tee-section
dimensions only if the bolt grip in the former connection were less than
half that in the latter connection. (This follows from the effect of grip
43
length on the idealized tension-elongation relationship of bolts and the
fact that the same flange deformation causes twice as much bolt deformation
in a symmetrical tee-connection as in a tee-to-rigid-base connection.)
Since the grip length of bolts in a tee-to-rigid-base connection is unlikely
to be less than t, it may be concluded that PR
for such connections is
always higher than for symmetrical tee-connections with the same tee-section
dimensions, without fill plates.
Inclusion of a fill plate between the tee-sections in a symmetrical
tee-connection is taken into account in the analysis of the connection by
increasing the bolt grip by an appropriate amount. While this increase
in grip length has little effect on bolt tension and bolt elongation at
ultimate, it does cause a decrease in bolt stiffness at relatively low
levels of load. (Bolt stiffness is defined as the slope of the bolt tension
versus bolt elongation relationship.) Hence, the same small load applied
on a connection without a fill plate and a similar connection with a fill
plate would cause a lower range in bolt stress in the connection with a
fill plate. Conversely, it may be stated that the connection with a fill
plate would have a higher value of PR
where R is a small stress range of
specified magnitude.
The value of PR
for each connection analyzed, where R is 4 ksi
in A325 bolts and 3 ksi in A490 bolts, is plotted against the ultimate
load of the connection, P , in Fig. 5.11. For symmetrical tee-connections u
without fill plates, the ratios of PR
to Pu
lie within a fairly. narrow
range: 0.377 to 0.429 for connections with A325 bolts and 0.365 to 0.424
for connections with A490 bolts. Distinctly higher values of PR/Pu
were
obtained for symmetrical tee-connections with fill plates and connections
of a tee-section to a rigid base (see Fig. 5.11). These differences in
PR/Pu
between connections with the three different configurations studied
44
further emphasize that although the differences in configuration do not
appreciably influence Pu ' they do affect PR
; PR
is lowest for symmetrical
tee-connections without fill plates.
As noted above, the values of PR/Pu
for all the symmetrical tee-
connections without fill plates lay within a fairly narrow range (see Fig.
2 5.11); since the parameters a, b, t and wId varied widely among these
connections, it is apparent that the effect of these parameters on PR
is
roughly similar to their effect on the ultimate load of connections.

45
CHAPTER 6
FORMULATION OF SEMI-EMPIRICAL RELATIONS
The results of numerical analysis of tee-connections and data
from tests were used to formulate equations for the computation of the
prying force or prying ratio in bolted tee-connections. Approximate for
mulae relating prying force with the variable geometric parameters of tee
connections were first obtained by analyzing a simple structure which, in a
highly idealized manner, represented most of the important characteristics
of tee-connections. These approximate formulae were then modified to re
flect the results of finite element analyses and tests.
6.1 Approximate Analytical Solutions
The model analyzed was the simply supported beam of span
(2a + 2b), depth t and width w shown in Fig~ 6.1. This beam represents
the flange of a tee-section with the dimensions indicated in Fig .. 5.2. The
externally applied load on the tee-connection, P per bolt, and the bolt
tension, T, are represented by concentrated loads on the beam (see Fig.
6.1). The reaction, Q, at each support represents the prying force per
bolt in the tee-connection. Thus, it was assumed that the prying forces
were concentrated at the edges of the tee-section flange and that there
was no contact between the two flanges in the connection at any other point.
These assumptions are valid only when the load on the connection is
relatively high.
Tw~ separate solutions to the idealized structure described above
were obtained: one solution was based on the assumption that the tee-section
flange was elastic through its entire length; a second solution was obtained
by assuming that there was a plastic hinge at the web-to-flange junction.

46
a) Elastic flange. It was assumed that the elongation of the
bolt in the tee-connection, 0, was twice the deflection of the neutral axis
of the beam (Fig. 6.1) at the point of application of the load T on the
beam, i.e.,
(6.1)
The deflection of the beam at x = b was computed in terms of T and P by
elastic analysis; deflections caused by shear forces as well as those due
to moment were taken into account. Substitution of this value of Yx=b
into Eq. (6.1), together with the equation
T P + Q,
yielded the following relationship for the prying ratio:
.9-P
3ab2 _ (Ed20) wt
3
4T d 2
2 2 (E) 2 (Ed20) wt
3 2a + 6a b + 2G at +
4T d2
(6.2)
where E and G are Young's modulus and the shear modulus, respectively, of
the tee-section m.-;.terial. The square of the bolt diameter, d2 , has been intro-
duced into the numerator and denominator of certain terms in Eq. (6.2).
It was assumed that the bolt elongation at ultimate, ° , was u
constant and that the bolt tension at ultimate, T , was proportional to d2 u .
for bolts of-a given type (A325 or A490). Thus, the following relationship
was obtained from Eq. (6.2):
(%) u
3ab 2 -
3 wt a d2
(6.3)

47
where a is constant for connections with bolts of a given type and (Q/P)u
is the ratio of Q to P at ultimate. The value of a would be lower for
connections with A490 bolts than for those with A325 bolts since d2
/T is u
lower for bolts of the former type.
Equation (6.1) is valid for symmetrical tee-connections. In
connections of a single tee-section to a rigid base, 0 would be equal to
Y b (compare with Eq. (6.1». Hence, the constant a would be twice as x=
large for tee-to-rigid-base connections as for symmetrical tee-connections.
b) Flange with plastic hinge at web. The plastic hinge in the
tee-section flange was simulated by a similar hinge at the center of the
beam (see Fig. 6.1). The moment in this hinge, M , was assumed to be as o
follows:
M o
CJ o
where CJ is the yield stress of the steel in the tee-section. Statical o
relationships between P, T, Q and M yielded the following equation: o
(0 d) 2 b o wt
.9. 4T d2 (6.4) P (Ood2~ wt 2
+ a 4T ) d2
The assumption that the bolt tension at ultimate, T , was prou
portional to d2 led to the following relationship for the prying ratio at
ultimate:
2 b - S wt
(;) d 2 (6.5) 2 u
a + S wt
d 2
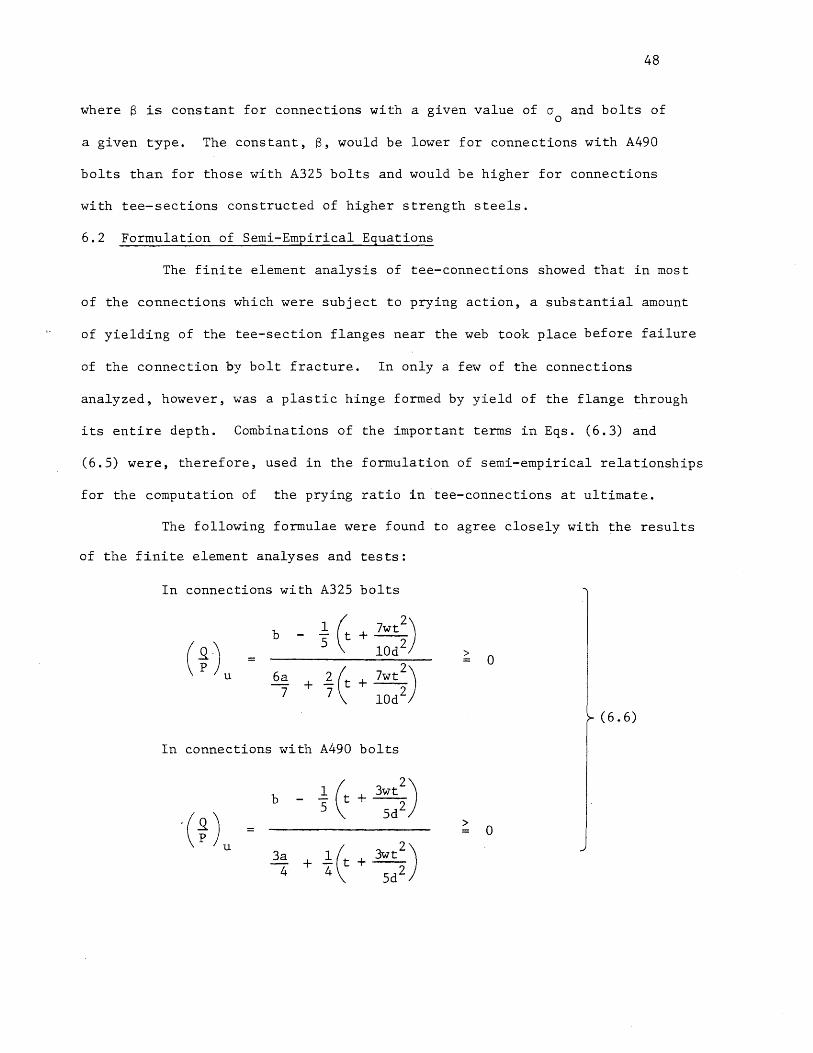
48
where S is constant for connections with a given value of 0 and bolts of o
a given type. The constant, S, would be lower for connections with A490
bolts than for those with A325 bolts and would be higher for connections
with tee-sections constructed of higher strength steels.
6.2 Formulation of Semi-Empirical Equations
The finite element analysis of tee-connections showed that in most
of the connections which were subject to prying action, a substantial amount
of yielding of the tee-section flanges near the web took place before failure
of the connection by bolt fracture. In only a few of the connections
analyzed, however, was a plastic hinge formed by yield of the flange through
its entire depth. Combinations of the important terms in Eqs. (6.3) and
(6.5) were, therefore, used in the formulation of semi-empirical relationships
for the computation of the prying ratio in ·tee-connections at ultimate.
The following formulae were found to agree closely with the results
of the finite element analyses and tests:
In connections with A325 bolts
(%) u
b
6a 7
I (t + 7wt2
) "5 \1 IOd 2
+ !:. (t + 7wt2
) 7 \ IOd 2
In connections with A490 bolts
b
3a 4"
> o
(6.6)
> o

49
The symbols a, b, t, wand d are as explained in Fig. 5.2 except that if
the edge distance is greater than 2t, a = 2t. (Q/P)u denotes the ratio, at
ultimate, of the prying force in a tee-connection to the externally applied
load on the connection. Equations (6.7), below, are considerably less complex
than Eqs. (6.6) and were found to be almost as accurate:
In connections with A325 bolts
(%) u
IOObd2 - 18wt2
70ad2 + 2lwt2
In connections with A490 bolts
100bd2
- l4wt 2
62ad 2 + 2lwt 2
> o
> o
(6.7)
2 The effect of parameters b, a, t and wid on (Q/P) as determined . u
by finite element analysis of tee-connections and as computed using
Eqs. (6.6) and (6.7) are shown in Figs. 5.3 through 5.10. Equation (6.6)
and, to a slightly lesser extent, Eq. (6.7) are seen to provide an
excellent estimate of the influence of the parameters on prying ratio at
ultimate.
In Fig. 6.2, values of (Q/p) determined by finite element u
analyses and tests of tee-connections are compared with the values computed
for the same connections using Eq. (6.6). A similar comparison of
analytically and experimentally determined prying ratios with those com-
puted using Eq. (6.7) is made in Fig. 6.3. (Experimental data .from
references 2 and 3 as well as from the present study are shown in these
Figures. Prying ratios were computed only for those connections which
failed by bolt fracture.) Figures 6.2 and 6.3 show that the agreement
between the values of (Q/p) computed using Eqs. (6.6) and (6.7) and those u

50
obtained from finite element analyses and tests is close, particularly
for those connections in which the prying ratio was relatively high. In
general, Eq (6.7) is slightly more conservative than Eq. (6.6).
In order to determine whether Eqs. (6.6) and (6.7) represented
any improvement over previously· sugges ted prying action relationships,
experimentally and analytically determined values of (Q/P) were compared u
with values computed using each of the following equations:
(%) u
where
1 2
a ( a b 3b +
3b t3
Sa 20
1)
>
4 wt
30ab 2A > 0, =
4 wt + 6ab 2A
o
(6.8)
(6.9)
Equations (6.8) and (6.9) are suggested in references 3 and 6, respectively;
the manner in which they were developed is described in Chapter 3, above.
Figures 6.4 and 6.S show that Eqs. (6.S) and (6.9) do not agree with
the results of tests and finite element analyses as closely as do Eqs. (6.6) or
(6.7).
It has been demonstrated, above, that the prying ratio at ultimate,
(Q/P)u' in a tee-connection may be accurately computed using Eq. (6.6) or

51
(6.7). The prying ratio so obtained may be used to determine the
ultimate load of the connection, P per bolt, as shown below: u
P u
T u
1 + (%), u
(6.10)
where T is the strength of each bolt in the connection. Equation (6.10) u
is, of course, valid only if the bolt is the critical element in the
connection.
The externally applied load on a tee-connection, per bolt,
which would cause fatigue failure of the bolts in the connection after
2,000,000 applications is denoted as Pf
. It was estimated in Chapter 4
that Pf
was equal to PR
, the load on the connection which caused an
increase in bolt stress of R where R is 4 ksi for A325 bolts and 3 ksi
for A490 bolts. The results of the finite element analysis of tee-
connections showed (see Fig. 5.11) that
aP u
where a is .377 for connections with A325 bolts and .365 for connections
with A490 bolts~ Thus, the load on a tee-connection which would cause
fatigue failure of the bolts in the connection after 2,000,000 applications
may be conservatively estimated as follows:
where
a P u
aT u
1 + (%) u
a = 0.375 for connections with A325 bolts;
0.365 for connections with A490 bolts.
(6.11)
For the reasons suggested in section 5.3.3, values of Pf
estimated using

52
Eq. (6.11) will be more conservative for symmetrical connections with fill
plates and tee-to-rigid-base connections than for symmetrical connections
without fill plates.
53
CHAPTER 7
DESIGN OF BOLTED TEE-CONNECTIONS
A method for the design of tee-connections assembled with A325
or A490 high strength bolts was developed. Compatibility of the design
procedure with the 1966 specification of the Research Council on Riveted
and Bolted Structural Joints (10) was maintained as far as possible. The
recommendations for design discussed in this chapter are presented in the
form of a specification in Appendix B.
The research on which the suggested design method is based was
aimed primarily at determining the behavior of the bolts in tee-connections;
the behavior of the tee-section was not studied in detail. Hence, in the
design procedure discussed below, emphasis. is placed on the proportioning
of the bolts.
7.1 Design Procedure
It is suggested that the procedure described below be used for
proportioning the bolts and tee-sections in bolted tee-connections subjected
to tensile loading.
1) Select trial geometry, tee-section dimensions and bolt size.
There should not be more than two lines of bolts in the tee
section flange. In order to minimize prying action in the
connection, the bolt lines should be located as close to the
tee-section web as possible and the flange thickness, the
edge distance, and the length of the flange should be large.
2) Compute the prying ratio. The ratio of the prying force, Q,
to the externally applied load on the connection, P, is given
by Eq. (7.1), below.

For connections with A325 bolts
.Q 100bd2
- l8wt 2
> 0 = p 70ad 2 2 + 2lwt
(7.1)
For connections with A490 bolts
.Q 100bd2
- l4wt 2
> = 0 p
62ad2 + 2lwt 2
In Eq. (7.1), t is the average thickness of the tee-section
flange, w is the length of the flange tributary to each
bolt, d is the nominal bolt diameter, b is the distance
from the bolt line to the face of the web minus 1/16 inch
and a is the edge distance (the distance from the bolt
line to the edge of the flange), except that if the edge
distance is greater than 2t, a=2t.
3) Check bolt stress. Check that
< (J a
where the allowable stress, (Ja' is as shown in the
tabulation, below,
Loading Condition
Static
Fatigue
Allowable Stress, (J , ksi a
A325 Bolts A490 Bolts
40 54
30 36
(7.2)
54

55
and
where P is the total externally applied load on the
connection, A is the total nominal bolt area and Q/p
is the prying ratio obtained in step 2.
4) Check tee-section stresses. The forces on the tee-section
are (P+Q)/2 at each bolt line, Q/2 at the edge of the flange
(except that if the edge distance is greater than 2t, force
Q/2 acts at distance 2t from the bolt line) and P on the
web. The bending and shear stresses in the flange and the
tensile stress in the web due to this system of loads
should be checked by established methods.
7.2 Discussion of the Suggested Procedure
7.2.1 Connections Subjected to Static Loading
The allowable stresses, a , suggested above for bolts in teea
connections under static loading are equal to the allowable stresses
specified in reference 10 for bolts in buildings.
The suggested design procedure will yield the following value of
the maximum allowable load, P , on a bolted tee-connection subjected to a
static loading in which the bolt is the critical element:
P a
1 +
Aa a
where (Q/P)E is the prying ratio computed using Eq. (7.1) and the other q.
symbols are as previously defined. The ultimate load of the connection,
P , is as follows: u
P u
nT u
1 + (%) (7.3)
u

56
where n is the number of bolts in the connection, T is the tensile strength u
of each bolt and (Q/P) is the prying ratio at ult·imate. Thus, the factor u
of safety of the connection, F, may be expressed as
F
or
F
P u
P a
F o
nTu [ Aa
a
1 + (%) Eg.
1 + (%) u
where F is the factor of safety of connections not subject to prying o
action designed in accordance with the requirements of reference 10. It
was demonstrated in Chapter 6 that (Q/P)E was a close approximation of' q.
(Q/P)u' Thus, the factor of safety which results from the use of the
suggested design procedure for bolted tee-connections is very nearly equal
to the factor of safety of connections not subject to prying action de-
signed in accordance with the requirements of reference 10, i.e.,
F F . o
Allowable loads and corresponding factors of safety were computed
for all the tee-connections tested and analyzed in the present investigation
as well as for the tee-connections tested in the studies reported in
references 2 and 3. The factors of safety against bolt fracture were found
to range from 2.30 to 2.75 for connections assembled with A325 bolts and
2.10 to 2.55 for connections with A490 bolts. The range in the values of F
was caused partly by differences in tensile strength between the bolts used
in the various studies.

57
7.2.2 Connections Subjected to Repeated Loading
Tes ts -and fini te element analyses indicated that the externally
applied load on a tee-connection which would cause fatigue failure of the
bolts in the connection after 2,000,000 applications, Pf , is approximately
proportional to the ultimate load of the connection, P. It was found u
that > aP
u
where a is 0.375 for connections with A325 bolts and 0.365 for connections
with A490 bolts. With the help of Eq. (7.3), the minimum value of Pf may
be expressed as
anT u
1 + (%) u
The allowable load on the connection, P , is as shown below: a
P a
Acr a
1 + (%) Eq.
The factor of safety of the connection against fatigue failure of the
bolts, Ff
, is given by the following equation:
Thus,
anT u
Acr a
:::: anT
u Acr
a (7.4)

58
The values of 0 specified in the suggested method for the design of teea
connections subjected to repeated loading are such that Eq. (7.4) yields
a value of Ff of approximately 1.2.
The maximum allowable repeated load, P , on every tee-connection a
for which experimentally or analytically determined values of Pf
were
available was computed using the suggested design procedure. The values of
Pa and Pf and the corresponding factors of safety against fatigue failure,
Ff , are shown in Tables 7.1 and 7.2. These factors of safety were found
to range from 1.18 to 1.43 for symmetrical tee-connections without fill
plates. Connections of a tee-section to a rigid b~se and connections with
fill plates had somewhat higher factors of safety (see Tables 7.1 and 7.2).

CHAPTER 8
CONCLUSIONS
59
The maj or conclusions which \Vere arrived at in this study of the
behavior of high strength bolts in tee-connections with two lines of
fasteners are as follows:
1. Prying action can cause a substantial reduction in both the
ultimate load and the fatigue strength of bolted tee-connections.
Neglect of the prying force during the proportioning of bolts
in such connections using current design specifications can
result in factors of safety against fatigue failure of the
bolts that are substantially lower than unity.
2. The factors which govern the magnitude of the prying force-
and the resulting decrease in ultimate load and fatigue
strength--in bolted tee-connections include the geometry
of the tee-sections, the size of the bolts and the bolt type
(A325 or A490).
3. A connection made up of two identical tee-sections bolted
together with no fill plate between them will have the same
ultimate load as a connection comprising one of the
tee-sections bolted to a rigid base. However, the symmetrical
tee-connection will have a lower fatigue strength than the
tee-to-rigid-base connection.
4. Inclusion of a fill plate between the tee-sections in a
symmetrical tee-connection has little effect on ultimate
load but causes an increase in fatigue strength.
5. The ratio of the prying force, Q, to the externally applied
load, P, in a bolted tee-connection at the point of failure
of the bolts can be accurately determined by means of the
equations shown below:
For connections with A325 bolts
(¥) u
= 100bd2 - l8wt 2
70ad2 + 2lwt2
For connections with A490 bolts
(%) u
100bd2 - 14wt2
62ad2 + 2lwt2
> o
> o
where d is the nominal bolt diameter, t is the thickness
of the tee-section flange, w is the length of flange tri-
butary to each bolt, b is the distance from the bolt line
to the face of the web minus 1/16 inch and a is the edge
distance (the distance from the bolt line to the edge of
the flange) except that if the edge distance is greater
than 2t, a = 2t.
6. The ultimate load, P , of a tee-connection which fails u
by bolt fracture may be determined from the equation,
nT P u'
u
1 + (¥) u
where n is the number of bolts in the connection and T u
is the tensile strength of each bolt.
7. The-fatigue strength of symmetrical tee-connections without
fill plates is approximately proportional to their ultimate
load. The externally applied load on such a connection, Pf ,
which will cause fatigue failure of the bolts in the
connection after 2,000,000 applications can be conservatively
60

estimated using the equation,
aP u
where a is 0.375 for connections assembled with A325 bolts
and 0.365 for connections with A490 bolts.
8. The procedure which was formulated for the design of bolted
tee-connections yields consistent factors of safety against
bolt failure both under static loading and fatigue loading.
61
62
APPENDIX A
ANALYSIS OF TEE-CONNECTIONS
A method was formulated for the ~nalysis of bolted tee-connections
with the help of a digital computer. The connection may be symmetrical,
i.e., it may consist of two identical tee-sections with their flanges bolted
together, or it may consist of a single tee-section bolted to a perfectly
rigid base. The dimensions of the connection, the mechanical properties of
the material of which the tee-sections are constructed and the mechanical
properties of the bolts are as described in section 5.1.
Presented below is a description of the structure analyzed (an
idealized representation of the tee-connection) and an explanation of the
analytical procedure followed.
A.I The Structure Analyzed
The force exerted by the bolt head or nut on the surface' of the
tee-section flange is idealized as being uniformly distributed over the
length of the connection in a direction parallel to the web. The load on
the web of the tee-section is also assumed to be uniform over the length
of the connection. Thus, the connection is treated as a two-dimensional
structure.
The structure analyzed is shown in Fig. A.l(a). It consists of
one half of one tee-section resting on a rigid base. Since the tee
section is symmetrical about the center line of the web--the y (vertical)
axis in Fig.-A.l(a)--the structure is restrained against horizontal dis
placement on this line. The rigid base--the x (horizontal) axis in Fig.
A.I(a)--on which the structure rests represents the line of symmetry
between two tee-sections (in symmetrical tee-connections) or the base to

63
which the tee-section is bolted (in connections of a tee to a rigid abut-
ment). The thickness of the structure in a direction perpendicular to the
x-y plane is equal to the length of the tee-connection tributary to each
bolt. The decrease in the cross-sectional area of the flange caused by
the bolt holes is taken into account by an appropriate reduction in the
thickness of the idealized structure at the appropriate location.
The material of which the tee-section is fabricated is elastic-
perfectly plastic and its yield stress in simple tension is denoted as 0 • o
The bolt in the connection is replaced, in the structure analyzed,
with a series of vertical springs of equal stiffness. One end of each
spring is attached to the upper surface of the flange of the idealized
structure while the other end is fixed. When there is no external load
on the connection the total compressive force in the set of springs is
equal to T , the specified bolt pretension. The force-deformation relationo
ship of the set of springs (Fig. A.I(b)) is based on the load-elongation
relationship of the pretensioned bolt. (The latter relationship is assumed
to consist of a series of straight lines as described in section 5.1.) If
the structure in Fig. A.l(a) represents a symmetrical tee-connection, the
same deflection of the surface of the flange which causes a spring deform-
ation equal to 0 will cause' a bolt elongation of 20. Thus, if the load-
elongation relationship of the pre tensioned bolt is represented by
the force-deformation relationship of the set of springs is
T T + f(2~ ) s 0 s
where
~b
and ~ s
tension in the bolt,
total compressive force in the set of springs,
elongation of the pretensioned bolt
average compressive deformation of the set of springs.
64
If the idealized structure represents a single tee-section bolted to a rigid
base, the T-~ relationship of the springs is exactly the same as that of
the pretensioned bolt. In either case (symmetrical connection or tee on
rigid base) the force-deformation relationship of the set of springs con-
sists of a series of straight lines. The slope of the first segment is
denoted as k l' that of the second segment as k 2' and so on. The value of s, s,
the average spring deformation, ~ , which corresponds to rupture of the s
bolt is denoted as ~ . u
The compressive forces and deformations in the individual springs
are denoted by the vectors {t } and {o }, respectively. The spring de-s s
formation scale is so defined that ~ s
o and {o } s
{a} when T = T . s 0
The load on the tee-connection is represented, in the idealized
structure, by an upward force (P in Fig. A.l(a» on the top of the web. w
This force is so distributed over the thickness of the web (i.e., in the x
direction) that all points at the top of the web undergo equal vertical
displacement (0 in Fig. A.lea». When the structure is in its initial, w
unloaded state the web force is zero. Increments of displacement are then
applied to the web until failure of the structure occurs.
Failure is defined as having occurred when 1) the average spring
deformation, ~ , reaches a value of ~ or 2) a mechanism is developed by s u
yield of the flange through its entire depth at two or more separate locations.
65
A.2 Analytical Procedure
The finite element method of stress analysis is used. The com-
plexity of the structure to be analyzed and the availability of a high-
speed digital computer were the primary factors which led to the choice of
the finite element method. Of the two basic approaches to structural
analysis--the force method and the displacement method--the displacement
method is used here since, for highly complex structures, it generally
provides a simpler mathematical formulation of the problem and a simpler
computer programming task (12, 13, 14).
The finite element analysis of a two-dimensional structure may be
performed with the assumption of a state of either plane stress or plane
strain. Since, in the problem at hand, neither assumption is completely
valid, the analytical procedure was so formulated that it could be carried
* out assuming either plane stress or plane strain. Except where stated
otherwise, the procedure is identical in either case.
The structure to be analyzed, described in section A.I, above,
and illustrated in Fig. A.l(a), constitutes a non-linear system--the spring
characteristics are non-linear (Fig. A.I(b» and the tee-section is con-
structed of elastic-perfectly plastic material. An additional source of
non-linearity is the boundary condition at the base--the bottom of the
flange is free to move upward but is restrained against downward deflection.
The non-linearity arising from the behavior of the springs and
the tee-section material is handled by following the incrementai load pro-
cedure, i.e., the structure is loaded in increments and, for each increment,
* The results of analyses discussed in Chapter 5 were obtained assuming plane stress. This assumption was found to yield values of the ultimate load of tee-connections that were about 5% lower than those obtained assuming plane strain.

66
it is analyzed assuming linear behavior of the springs and the tee-section
material. At each level of loading, the boundary conditions at the base
are determined by an iterative procedure, i.e., a process of iteration is
used to determine which portions of the bottom of the flange are restrained
and which portions are free.
Repetition of the finite element analysis of the structure during
the iterative process described above is avoided by the following procedure:
1. The boundary conditions of the structure are modified in such
a manner that the forces on the bottom of the flange can be
treated as independent variables.
2. The modified structure is analyzed using the finite element
method to obtain relationships between forces applied on
the flange and the resulting displacements, reactions,
stresses and bolt forces. These relationships are depen
dent on the stiffness of the springs and the elastic
properties of the tee-section.
3. The relationships obtained in step 2 are used to find, by
a proc~ss of iteration, the combination of forces on the
flange which satisfies the boundary conditions of the
original structure (the idealized representation of the
tee-connection shown in Fig. A.l(a)) in its initial, un
loaded state (with springs prestressed as specified) and
under increasing levels of applied web displacement. 'The
stresses, displacements, reactions and bolt forces in the
structure are computed for each loading condition, once
again with the help of the relationships from step 2. If
it is found, following an increment of web displacement,

that the stiffness of the springs or the elastic properties
of the tee-section have changed, step 2 is repeated and new
relationships between forces, displacements, stresses, etc.,
are obtained. These new relationships are used for sub
sequent increments of web displacement.
Each of the three steps in the procedure outlined above is
described in detail below.
A.2.l Modification of the Structure
67
The following modifications are made in the structure shown in
Fig. A.l(a):
1. The base is removed. Thus, the bottom of the flange is made free
to move either upward or downward.
2. The top of the web is restrained against vertical displacement.
3. The spring prestress is removed, i.e., the force in the
springs is zero in the modified structure when there is no
external load applied on it.
The modified structure is shown in Fig. A.2.
Points' at regular intervals on the bottom of the flange and the
top of the web are denoted as AI' A2,···, Ana and Bl , B2 ,···, Bnb' re
spectively, and the joints between the springs and the flange are denoted
as Dl , D2 ,···, Dnc'
The notation of forces, displacements, reactions, and stresses in
the modified structure is as shown below. Matrix notation is used to denote
arrays of quantities.
{FA}
{UA}
{FB}
upward force on points A
upward displacement of points A
upward reaction on points B
68
{FC} compressive force in the springs
{UC} compressive deformation of the springs
{ST} stresses in the portion of the flange shown
hatched in Fig. A.2
FD the sum of a set of equal downward forces applied
on all of points D. (The array of forces on
points D may thus be expressed as FD {I}.) nc
A.2.2 Finite Element Analysis of the Modified Structure
The purpose of the finite element analysis is to obtain relation-
ships between {UA}, {FA}, {FB}, etc. These relationships are defined as
follows:
{UA} [UAFA] {FA} + {UAFD}. FD
{FB} [FBFA] {FA} + {FBFD}. FD
{UC} [UCFA] {FA} + {UCFD} .FD (A. 1)
{FC} [FCFA] {FA} + {FCFD}. FD
{ST} [STFA] {FA} + {STFDL FD.
The matrices [UAFA] , {UAFD} , [FBFA], {FBFD}, etc. are obtained by applying,
in turn, a unit yalue of each component of the force vector {FA} and a
unit value of FD on the structure and determining {UA} , {FB}, {UC}, etc.
for each loading, using the· finite element method. Thus, the structure
has to be analyzed for (na + 1) different loading conditions. However, the
method of solution used is such that analysis of the structure for
successive loading conditions after the first one requires little additional
computational time.
Presented below is a description of the various steps involved in
the finite element method of analysis as applied in the present instance.

69
Division of structure into elements. The basic element shape
used is the right-angled isosceles triangle. Figure A.3 shows the tee-
section divided into elements of this type. (The broken lines in the
figure may, at this time, be ignored.) The section is first divided into
squares of equal size. There are eight such squares through the height
of the flange. Each square is divided along one of its diagonals into two
triangles. The division of the squares into triangles is carried out in
such a way that no two adjacent squares are divided along diagonals in
the same direction.
The springs (representing the bolt) are attached to consecutive
nodes at the top of the flange. Points A and B (see section A.2.l and Fig.
A.2) represent all nodes at the bottom of the flange and the top of the
web, respectively.
Formation of element stiffness and stress matrices. There are
four types of triangular elements in the structure--all the elements are
of the same size but they are oriented in four different ways with respect
to the global coordinate system defined in Fig. A.3. Stiffness and stress
matrices for each of the four types of triangular elements were formulated
* in global coordinates. The displacement functions assumed and the methods
used for formulating the matrices were those suggested by Clough (12) and
Zienkiewicz (15).
The assembly of the structure's stiffness matrix and the comput-
ation of stresses may be simplified if the structure is consider"ed to be
made up of square elements, each consisting of two triangles. There are
* The assumed displacement functions were: u u
l + u 2x + u3y
v Sl + S2x + S3Y.

70
two types of such composite square elements in the structure. They are
designated I and II in Fig. A.4. In addition to the two square elements,
a third type, a triangle, is needed to completely represent the geometry of
the structure (at the surface of the web-flange fillet). This triangular
element is designated as element type III in Fig. A.4.
Since the stiffness matrices of the basic triangular elements were
expressed in global coordinates, the stiffnesses of the composite square
elements are obtained by simple addition. The stress matrix of each square
element is so formulated as to express the average of the stresses in the
two triangles of which it is composed. (With displacement functions as
assumed, the stresses within each triangle are uniform.) The stiffness and
stress matrices of elements of type I, II and III (Fig. A.4) were computed
for the case of both plane stress and plane "Strain and are shown in Tables
A.I and A.2. The element stiffness matrix, [k]e, and stress matrix, [S]e,
are defined by the following equations:
where
{F} = [k]e {a}
{a} = [S]e {a}
{a} {a , a ,T } . X Y xy
and {F} and {8} are vectors of nodal forces and displacements, respectively,
defined as follows:
{F} {Xl' YI , X2, Y2,···, Yn }
{a} {uI ' vI' u2 ' v 2 '···, vn }
where n is the number of nodes in the element.

71
Assembly of the structure's stiffness matrix. The structure is
partitioned as indicated by the broken lines in Fig. A.3. Each partition
contains only one vertical row of nodes. The total number of partitions is
denoted as N and the partitions are numbered sequentially from the left.
The vectors of nodal forces and displacements in the ith partition are
denoted as {P.} and {o.}, respectively. 1 1
With the structure partitioned as described above, the stiffness
matrix of the system may be expressed in tri-diagonal form as shown below:
PI Kl Cl 0 0 0 0 0 °1
P2 CT
1 K2 C2
0 0 0 0 °2
P3 0 CT 2 K3 C
3 . 0 0 0 °3
o o o o
o o o o o T C~l ~
Submatrices [K.J in Eq. (A.2) represent the relationship between nodal 1
(A.2)
forces and displacements in the ith partition while submatrices [C.] relate 1
forces in the ith partition with displacements in the (i + l)th partition.
Since the element stiffriess matrices were expressed in global
coordinates, the stiffness matrix of the structure is obtained by merely
adding terms from the element stiffness matrices into appropriate locations
in the [K] and [C] ·submatrices. Elements in the plastic state are assumed
to have no stiffness and are, therefore, regarded as being nonexistent.
The boundary conditions that u = 0 on the y-axis and v = 0 at the
top of the web are imposed by removing appropriate terms from the {a} and
{p} submatrices and corresponding rows and columns from the [K] and [C]
submatrices.
72
The effect of a spring of stiffness k' connected to a node in s
the ith partition (the other end of the spring being fixed) is taken into
account by adding k' to the appropriate location on the major diagonal of s
[K. ] . l
Solution of stiffness equations. Computation of reactions and
stresses. Equation (A.2) can be solved for the displacements, 0, by a
simple recursion method as proposed by Clough, Wilson and King (16). This
method is briefly outlined below.
By introducing new symbols, K and P, defined as follows:
(Kl
] [Kl
]
(K. ] [K. ] [C T - -1 2,3, ... ,N i-I] [Ki _ l ] [Ci - l ] i
l l
(A.3)
{PI} {PI}
{po } {P. } T - -1-
2,3, ... ,N [ C i -1] [K i-I] {P i -1 } i l l
Eq. (A.2) may be written as
{o. } l
- -1 -[Ki ] ({Pi} - [Ci]{Oi+l})' i 1,2, ... ,N-l (A.4)
- -1-[KN] {p N}' (A.S)
The matrices (K.]-l and {P";} are computed sequentially using Eqs. (A.3). l l
(Inversion of the [K.J matrices is performed by Choleski decomposition-l
this method of inversion is very efficient for symmetric, positive definite
matrices (17).) Displacements {ON} are then obtained from Eq. (A.S). The
remaining displacement vectors, {o.}, are computed in reverse sequence l
using Eq. (A. 4) .
The element stiffness matrices are used to determine the reaction
on the nodes at the top of the web. The force in each of the springs is
73
obtained by multiplying the stiffness of the spring by the vertical dis-
placement of the node to which it is attached. The element stress
matrices are used to compute the stresses in the structure.
Most of the computational time required for solution of the
stiffness equations by the method described above is spent in computing the
[K.]-l matrices. Since these matrices are independent of the load vector, 1
little additional time is spent in analyzing the structure for additional
loading conditions.
The method of analysis described above fails if adjacent elements
through the entire depth of the flange are in the plastic state and, conse-
quently, have no stiffness or if the structure is unstable. (The structure
referred to here is the "modified" structure.) The procedure followed if
either of these conditions arises is described in section A.2.3.
A.2.3 Solution for Prescribed Boundary Conditions and Loadings
The original structure (the idealized representation of the tee-
connection shown in Fig. A.I(a)) is hereafter referred to as structure I
while the modified structure (described in section A.2.1 and shown in Fig.
A.2) is referred to as structure II.
The boundary conditions and the notation of forces, displacements,
reactions and stresses in structures I and II are shown in Figs. A.S(a) and
A.S(b). The notation used in structure II was described in section A.2.1.
The symbols A, Band D denote the same points in structure I that they
denote in structure II and {FA}, {UA} , {FB} and {ST} denote the same
quantities in structure I that {FA}, {UA} , {FB} and {ST} denote in structure
II except that {FA} is an array of reactions rather than applied forces.
The downward displacement of the upper ends of the springs in structure I
is represented by o • c
(This displacement is applied only during the spring
prestressing operation; the upper ends of the springs are, thereafter, kept
74
fixed.) The notation of the remaining forces and displacements in structure
I was explained in section A.I.
In order to simplify the representation of the boundary conditions
of structure I in terms of the forces and displacements on the bottom of
the flange, points A are separated into two groups denoted as A(r) and A(f).
P o A (r) 0 I 2 olnts i ,1 = , , ••• , nar, are those of points A which are in contact
o h h b hOI ACf ) 0 I 2 f h f 0 A h O h Wlt tease W.l e i ,1 = , , •.• , na , are t ose a pOlnts W lC
are not in contact with the base. The vectors of vertical displacement and
force in structure I at points A(r) are denoted as {UA(r)} and {FA(r)},
respectively, and those at points A(f)are denoted as {UA(f)} and {FA (f)},
respectively. These force and displacement vectors are related to {UA}
and {FA} by the following equations:
{UA(r)} [R]nar, {UA} nar na
na
{FA(r)} [R]nar {FA} nar , na
na (A.6)
{UA(f)} naf [F] f {UA}
na , na na
{FA (f)} naf [F]naf {FA} , na
na
where the subscripts denote the dimensions of the matrices. [R] and [F]
are matrices which define which of points A are included in A(r) and which
o A(f) ln . Since matrix ~iJ is orthogonal, its inverse is equal to its
transpose. Hence {UA} and {FA} may be expressed in terms of their com
ponents on A(r) and A(f) as follows:
[R]T{UA(r)} + [F]T{UA(f)}
[R]T{FA(r)} + [F]T{FA(f)} } CA.7)

75
Th d " 1 d f A(r) d A(f) " II d d e lSP acements an orces on an In structure are enote
as {UA(r)}, {FA(r)}, {UA(f)} and {FA (f)}. These vectors are related to
{UA} and {FA} by relationships similar to Eqs. (A.6) and (A.7).
The independent variables in structure I are considered to be
the web displacement, 0 , and the spring displacement, 0 , while in w c
structure II the independent variables are forces {FA} and FD. As shown
below, the increases in the reactions, displacements, stresses, etc. in
structure I under prescribed increments of displacements 0 and 0 may be w c
obtained from the reactions, displacements, stresses, etc. which result,
in structure II, from the application of appropriate values of forces
{FA} and FD.
(a) In the following, superscripts over the forces, displacements,
stresses, etc. in structure I denote the increases in the values of the
corresponding quantities resulting from the application of an increment
of web displacement, o(a), and spring displacement, o(a). Superscripts w c
(i-I) and (i) denote 1 d" d f 11· h· va ues prece lng an 0 oWlng t e lncrement,
respectively.
Let forces {FA} and FD be applied on structure II such that the
following conditions are satisfied:
{FA}
{FC} +
{FA} (a)
FD{l} nc
(A.8)
{t }(a). s
(A.9)
Thus, the forces on nodes A and D in structure II and the increases in
these forces in structure I are identical. Consequently,
and
{ST} (a)
{FE} (a)
{ST}
{FB} •
(A.lO)
(A.ll)

76
The deformation of the tee-section in structure II under applied forces
{FA} and FD and that in structure I under o(a) and o(a) will also be w c
identical. However, the tee in structure I undergoes an upward rigid-body
displacement of magnitude o(a) relative to the tee in structure II. w
Therefore,
{UA} (A.12)
Comparison of the movement of the upper and lower ends of the springs in
structures I and II yields
{o }(a) {UC} + (0 (a) + o(a)) {I} . s c w (A.13)
From Eqs. (A.9) and (A.13) it may be found that
FD k (o(a) + o(a)) s c w (A.14)
where k is the stiffness of the set of springs. (The spring stiffness, s
defined as the slope of the spring force versus spring deformation re-
lationship, must be equal in structures I and II.)
The boundary conditions at the base in structure I may be
expressed as follows:
{UA(r)} (i)
{O}
-(f) (i) > UA. = 0, j 1,2, ... , naf J (A. IS)
-(r) (i) > FA. = 0, j 1,2, . .. , nar J
{FA (f) } (i)
{O}
The increases in the forces and displacements on nodes A in structure I
must, therefore, be as shown below:
(a) {UA(r)}
-(f) (a) UA.
J
-(r) (a) FA.
J
(a) {FA(f)}
-(r) (i-l) = -{UA }
> -(f) (i-l) UA.
J
_( ) (i-l) > = - FA. r ,
J
j
j
-(f) (i-l) = -{FA} .
77
1,2, ... , naf
(A.16) 1,2, ... , nar
From Eqs. (A.8), (A.12) and (A.16) the following relationship are obtained:
{UA(r)} {UA(r)} (i-l)
- ,0 (a) {l} -w
(A.17a)
UA~f) > -(f) (i-l) o (a) 1,2, ... , naf = - UA. j J J w '
(A.17b)
FA~r) > _( ) (i-l) = FA r j 1,2, ... , nar
J J (A.17 c)
{FA (f) } -(f) (i-l)
- {FA } (A.17d)
Matrices [UAFA] and {UAFD}, defined by the equation
{UA} [UAFA] {FA} + {UAFD} FD, (A.18)
have been obtained as described in section A.2.2. Using the matrices [R]
and [F] defined'in Eqs. (A.6) and (A.7), the following relationship may be
obtained from Eq. (A.18):
{FA(r)}
[R]{UAFD}FD).
Equations (A.14), (A.17a), (A.17d) and (A.19) yield
{FA(r)} ([R] [UAFA] [R]T)-l (_[R]{UA}(i-l)
+ [R][UAFA] [F]T[F]{FA}(i-l)
[R]{UAFD} k (o(a) + o(a») s c w
(A.19)
CA.20a)

7B
and {FA (f)} - [F] {FA} (i-I) . (A.20b)
With assumed values of [R] and [F], {FA(r)} and {FA (f)} may be
obtained from Eqs. (A.20a) and (A.20b), respectively. If [R] and [F] were
correctly assumed, the values of {FA(r)} and {FA (f)} obtained above will
satisfy the conditions represented by Eqs. (A.17b) and (A.17c) where
and
{VA Cf)}
+
-(f) (i-I) {VA }
(i-I) {FA(r)}
{UAFD} k (oCa) + oCa) » s c w '
(i-I) [F] {UA}
(i-I) [R] {FA}
CA.2l)
If [R] and [F] are found to be incorrect, the grouping of nodes A into A(r)
and A(f) is changed as follows: those nodes at which Eq. (A.17b) is not
satisfied are included in A(r) and those nodes at which Eq. (A.17c) is
not satisfied are included in ACf ). New matrices [R] and [F] are thus
obtained and are then used in computing new values of {FA(r)} and {FA Cf )}.
This iterative process is repeated until the true values of [R], [F],
{FA Cr )} and {FA Cf )} are obtained.
{UA}, {FE}, {UC}, {FC} and {ST} may now be computed using Eqs.
CA. I) where
{FA}
and FD
[R]T{FA Cr)} + [F]T {FA Cf )}
k CoCa) + o(a». s c w
} (A. 22)
The increases in the forces, stresses, reactions, etc. in
structure I caused by an increment of web displacement, o(a), and spring w.
displacement, o~a), can then be obtained from Eqs. (A.B) through (A.13).
79
Described below is the application of the general procedure
explained above to the analysis of the structure under specific
conditions of loading.
Application of spring prestress. It is required that, at the
end of the spring prestressing operation, the following conditions be
satisfied:
and
where
and
T s
P w
T s
P w
nc
1: i=l
nb
I i=l
T a
o
t s,i
FB. l
CA.23)
CA. 24)
Prior to the prestressing of the springs all forces, displacements,
reactions, and stresses in the structure are zero. The procedure used for
obtaining the condition of the structure represented by Eqs. (A.23) and
(A.24) is outlined below.
1. Matrices [R] and [F] are assumed to be such that those of
nodes A at which {UAFD} is negative are included in A(r).
2. {FACr)}, {FA (f)}, {FA} and FD are computed using Eqs.
(A.20) and (A.22) with
and 1
and are denoted as {FA(r)} {FA Cf )} {FA}Cc) and (c)' (c)'
FDCc) , respectively.

80
3. {FA(r)}, {FA(f)}, {FA} and FD are computed with
and o
and are denoted as {FA(r)} {FA(f)} {FA}(w) and (w)' (w)'
FD(w) , respectively.
4. The ratio of web displacement to spring displacement
that would provide a total web. force of zero (with the
assumed values of [R] and [F]) is denoted as a and is
computed as follows:
nb L FB( ) .
i=l C ,l.
a nb
I FB ( ) . i=l W ,l
where
[FBFA]{FA}(c) + {FBFD} FD(c)
and {FB}(w) = [FBFA]{FA}(w) + {FBFD} FD(w).
5. The forces {FA(r)}, {FA (f)} and FD which result from
applied displacements
a
and 1
are found by multiplying the results of step 3 by a and
adding them to the results of step 2.

81
6. The assumed values of [R] and [F] are checked with the
help of Eqs. (A.17b), (A.17c) and (A.21). An iterative
procedure is adopted, if necessary, to find the true
values of [R] and [F] and the corresponding values of
{FA} and FD. Steps 2, 3, 4 and 5 are repeated for each
cycle of iteration.
7. From the values of {FA} and FD found in step 6, {FA}(a) ,
{UA}(a), {FB}(a) , {t }(a) and {ST}(a) are obtained with s
the help of Eqs. (A.I) and Eqs. (A.8) through (A.12).
These vectors are then multiplied by the scalar constant
S where
T S
0
nc (a) L t .
i=l S,1.
and the resulting vectors are denoted as {FA}(o), {UA}(o),
{FB}(o), {t }(o) and {ST}(o). The product a.S is denoted s
as 0(0). w
Matrices {FA} (0) , {UA} (0) ,{FB}(o) {t }(o) and {ST}(o) and , s
displacement 0 (0) represent the values of {FA}, {UA} , {FB}, {t }, {ST} w s
and 0 after the spring-prestressing operation. Since spring deformations, w
{o }, are expressed relative to the deformations at the end of the springs
prestressing- operation,
{O} .

82
The matrices [UAFA], [FBFA], {UAFD}, etc. used above are
those obtained by finite element analysis of structure II with all ele-
ments in the elastic state and k s k 1. s,
Application of prescribed increments of web displacement.
- (0) Following the prestressing of the springs and the computation of {FA} ,
{UA}(o), {FB}(O) , etc. the structure is loaded by means of increments of
displacement, o(a), applied to the web. The increases in the reactions, w
displacements, stresses, etc. resulting from each increment of web dis-
placement are found by direct application of the general procedure
described above (with o(a) = 0). This procedure may be summarized as c
follows:
1. [R] and [F] are assumed. (For a given increment, the trial
values first assigned to [R] and [F] are the values that
were found to be correct for the previous increment.)
(r) (f) (f) 2. {FA } and {FA } are computed using Eqs. (A.20). {UA },
(i-I) . (i-I) { UA ( f) } and {FA ( r) } ( ) are obtained from Eqs. A.2l.
3. The values of [R] and [F] are checked with the help of Eqs.
(A.17b) and A.17c). If [R] and [F] are found to be incorrect,
they are redefined and steps 2 and 3 are repeated. Thus, a
process of iteration is used to establish the true values of
[R] and [F] and the corresponding values of {FA(r)} and
{FA (f)}.
4 . {FA} and FD are ob tained from Eqs. (A. 22) and {UA}, {FB},
{UC}, {FC} and {ST} are computed using Eqs. (A.l).
5. {FA} (a), {UA} (a), {FB} (a), {ts
} (a), {os} (a) and {ST} (a) are
obtained from Eqs. (A.8) through (A.13). Thus, the changes
83
in the structure brought about: by the increment of web
displacement are found.
The results obtained for each increment are superposed.
Following each increment of web displacement, the stresses in the
tee-section and the spring force and deformation are examined as described
below to determine whether the properties of the structure have changed.
The matrix {ST} provides the values of stresses 0 , 0 and T x y xy
in elements in the more highly stressed regions of the tee-section. An
element is assumed to be in the plastic state if the stresses in it satisfy
the following equation:
where
and
(0 - 0 )2 + (0 - 0 )2 + (0 _ 0 )2 + 6T x Y Y z z x xy
a vo + va in the case of plane strain z x y
o z
o in the case of plane stress.
> 2 2a
o (A.25)
Equation (A.25) is obtained from Von Mises' yield criterion. This criterion
has been found t<? accurately represent the behavior of steels with "flat-top"
yield plateaus (18).
The specified relationship between the total spring force, T , s
and the average spring deformation, 6 , consists of a series of straight s
lines drawn between discrete points (see Fig. A.l(b». If it is found that
during the ith increment of applied displacement T and 6 had moved across s s
one of these points, the stiffness of the set of springs, k , is assumed s
to change to a value represented by the slope of a line drawn tangential to
the specified T vs. 6 relationship from a point with coordinates (6(i) s s s '

84
T(i» where 6(i) and T(i) are the spring deformation and force at the end s s s
of the ith increment.
If any element in the tee-section is found to have moved from
the elastic to the plastic state or if the spring stiffness is found to
have changed during a given increment of web displacement, the finite
element analysis of structure II is repeated to find the values of matrices
[UAFA], [FBFA], {UAFD}, etc. which correspond to the new properties of the
structure. The new values of these matrices are used in the computation of
the changes in the reactions, displacements, stresses, etc. in the structure
under subsequent increments of web displacement.
An exception to the procedure described above is made under
certain conditions as described below.
1. If the average spring deformation, 6 , is found to be equal s
to or greater than 6 , the structure is assumed to have u
failed by bolt fracture and loading is terminated.
2. If the spring stiffness, k , is negative and extensive s
yielding has occurred in the tee-section, the finite
element' analysis may indicate that structure II has become
unstable. (One or more of the [K.] matrices may be nonl
positive definite.) In this case, again, failure of the
connection by bolt fracture is assumed to have taken place.
3. If elements through the entire depth of the flange are in
the, plastic state, finite element analysis of the structure
using the procedure described in section A.2.2 will be
impossible. In this case, the additional web load the
structure can carry before failure is estimated through the
use of statics. A hinge is assumed to exist at the location
at which the flange has yielded through its depth and the
reaction on the bottom of the flange is assumed to be con
centrated at the outer edge of the tee. Failure is assumed
to occur when (a) the spring force reaches its maximum value
or (b) a mechanism is developed through yield of the flange
through its entire depth at a second location.
4. If, following an increment of web displacement, it is found
that the flange has yielded through its entire depth at two
separate locations (one near the web and the other near the
springs) the connection is assumed to have failed through
formation of a mechanism.
85

APPENDIX B
SUGGESTED DESIGN SPECIFICATION FOR ASTM A325 AND A490 BOLTS SUBJECT TO APPLIED TENSION IN STRUCTURAL JOINTS
86
Bolts subject to applied tension shall be proportioned to support
the sum of the external load and any prying force produced by deformation
of the connected parts. The prying force resulting from deformation of
tee-section flanges may be computed as follows:
Q 100bd2
- l8wt 2
> For connections with A325 bolts = 0 . . . P
70ad2 2 + 2~t
Q 100bd2 - l4wt 2
connections with A490 bolts > For = 0 . . P 62ad2 2 + 2lwt
where Q is the prying force, P is the externally applied load, d is the
nominal bolt diameter, t is the thickness of the tee-section flange, w is
the length of flange tributary to each bolt, b is the distance from the
bolt line to the face of the tee-section web minus 1/16 inch and a is the
edge distance (the distance from the bolt line to the edge of the tee-
section flange) except that if the edge distance is greater than 2t, a 2t.
The bolts shall be so proportioned that their average tensile
stress, computed' on the basis of nominal bolt area and independent of any
initial tightening force, will not exceed the appropriate stress given
in the following tabulation.
Loading Condition
Static loading Repeated loading
Allowable Stresses
ASTM A325 Bolts
40 ksi 30 ksi
ASTM A490 Bolts
54 ksi 36 ksi
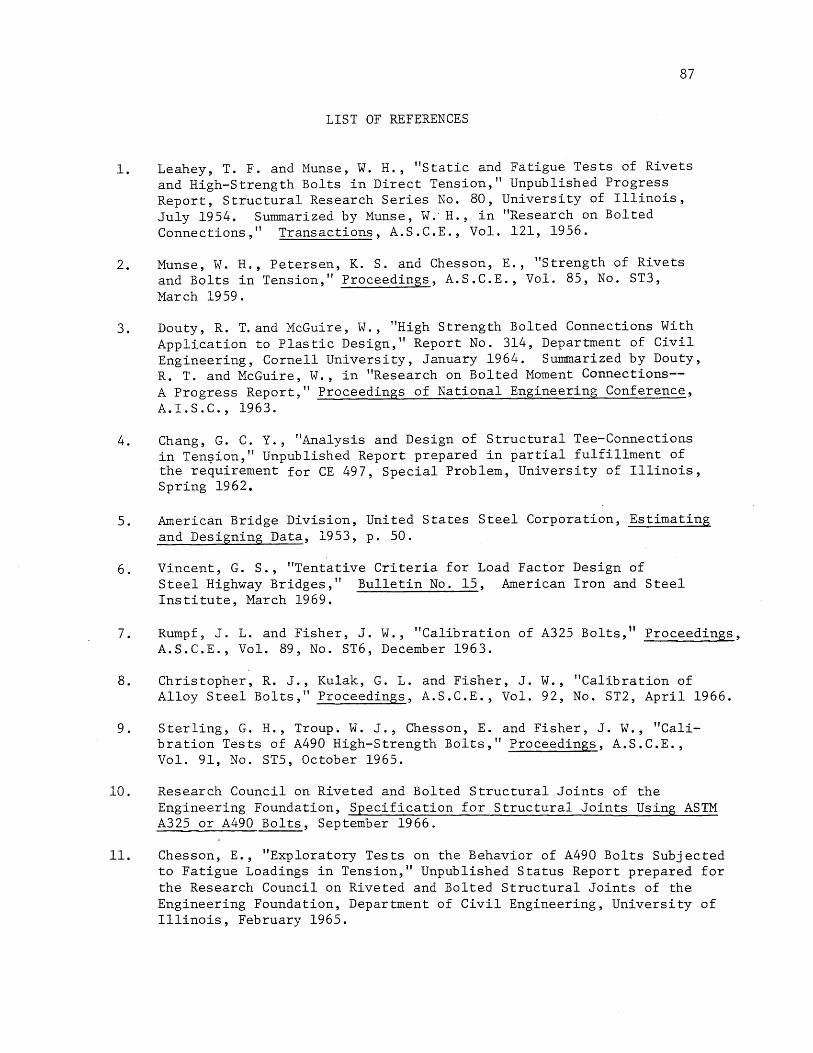
87
LIST OF REFERENCES
1. Leahey, T. F. and Munse, W. H., "Static and Fatigue Tests of Rivets and High-Strength Bolts in Direct Tension," Unpublished Progress Report, Structural Research Series No. 80, University of Illinois, July 1954. Summarized by Munse, W." H., in "Research on Bolted Connections," Transactions, A.S.C.E., Vol. 121, 1956.
2. Munse, W. H., Petersen, K. S. and Chesson, E., "Strength of Rivets and Bolts in Tension," Proceedings, A.S.C.E., Vol. 85, No. ST3, March 1959.
3. Douty, R. T. and McGuire, W., "High Strength Bolted Connections With Application to Plastic Design," Report No. 314, Department of Civil Engineering, Cornell University, January 1964. Summarized by Douty, R. T. and McGuire, W., in "Research "on Bolted Moment Connections-A Progress Report," Proceedings of National Engineering Conference, A.I.S.C., 1963.
4. Chang, G. C. Y., "Analysis and Design of Structural Tee-Connections in Ten!?ion," Unpublished Report prepared in partial fulfillment of the requirement for CE 497, Special Problem, University of Illinois, Spring 1962.
5. American Bridge Division, United States Steel Corporation, Estimating and Designing Data, 1953, p. 50.
6. Vincent, G. S., "Tentative Criteria for Load Factor Design of Steel Highway Bridges," Bulletin No. 15, American Iron and Steel Institute, March 1969.
7. Rumpf, J. L. and Fisher, J. W., "Calibration of A325 Bolts," Proceedings, A.S.C.E., Vol. 89, No. ST6, December 1963.
8. Christopher, R. J., Kulak, G. L. and Fisher, J. W., "Calibration of Alloy Steel Bolts,71 Proceedings, A.S.C.E., Vol. 92, No. ST2, April 1966.
9. Sterling, G. H., Troup. W. J., Chesson, E. and Fisher, J. W., "Calibration Tests of A490 High-Strength Bolts," Proceedings, A.S.C.E., Vol. 91, No. ST5, October 1965.
10. Research Council on Riveted and Bolted Structural Joints of the Engineering Foundation, Specification for Structural Joints Using ASTM A325 or A490 Bolts, September 1966.
11. Chesson, E., "Exploratory Tests on the Behavior of A490 Bolts Subjected to Fatigue Loadings in Tension," Unpublished Status Report prepared for the Research Council on Riveted and Bolted Structural Joints of the Engineering Foundation, Department of Civil Engineering, University of Illinois, February 1965.

88
12. Clough, R. W., "The Finite Element Method in Structural Mechanics," Stress Analysis, edited by O. C. Zienkiewicz and G. S. Holister, John Wiley, London, 1965.
13. Warren, D. S., Castle, R. A.and Gloria, R. C., "An Evaluation of the State of the Art of Thermodynamical Analysis of Structures," Wright Air Development Division Technical Report, No. 61, 1961.
14. Gallagher, R. H., "A Correlation Study of Methods of Matrix Structural Analysis ," AGARD 0 graph , Vol. 69, Macmillan, New York, 1964.
15. Zienkiewicz, O. C., The Finite Element Method in Structural and Continuum Mechanics, McGraw-Hill, London, 1967.
16. Clough, R. W., Wilson, E. L. and King, I. P., "Large Capacity Multistory Frame Analysis Programs," Proceedings, A.S.C.E., Vol. 89, No. ST4, 1963.
17. Faddeev, D. K. and Faddeeva, V. N., Computational Methods of Linear Algebra, W. H. Freeman, San Francisco, 1963.
18. Morrison, J. L. M., "The Criterion of 'Yield' of Gun Steel," War Emergency Proceedings, I. Mech. E., London, Vol. 159, No. 39, 1948.

89
TABLE 4.1
LIST OF TEST SPECIMENS
Specimen Connection Type of Type of Designation * Bolt Test Geometry
S(S)3-l S A325 Static S(S)3-2 S " II
S(S)4-l S A490 II
S(S)4-2 S " "
F(TO)3-l TO A325 Fatigue F(TO)3-2 TO " " F(Tl)3-l Tl " " F(T2)3-l T2 " " F(T4)3-l T4 " II
F(TO)4-l TO . A490 " F(TO)4-2 TO " " F(Tl)4-l Tl " II
F(T2)4-l T2 " " F(T3)4-l T3 " " F(T4)4-l T4 " " F(T4)4-2 T4 " "
U(TO)3-l TO A325 Static U(TO)3-2 TO " " U(TJ.,) 3-1 Tl " " U(T2)3-l T2 " " U(T4)3-l T4 " "
U(TO)4-l TO A490 " U(TO)4-2 TO " " U(Tl)4-l Tl " " U(T2)4-l T2 " " U(T3)4-l T3 " " U(T4)4-l T4 II " U(T4)4-2 T4 " "
S(TO)3-l TO A325 " S(T3)3-l T3 " " S(T4)3-l T4 " "
S(TO)4-l TO A490 "
* S denotes a single-bolt connection; TO, Tl, T2, T3 and T4 denote tee-connections.
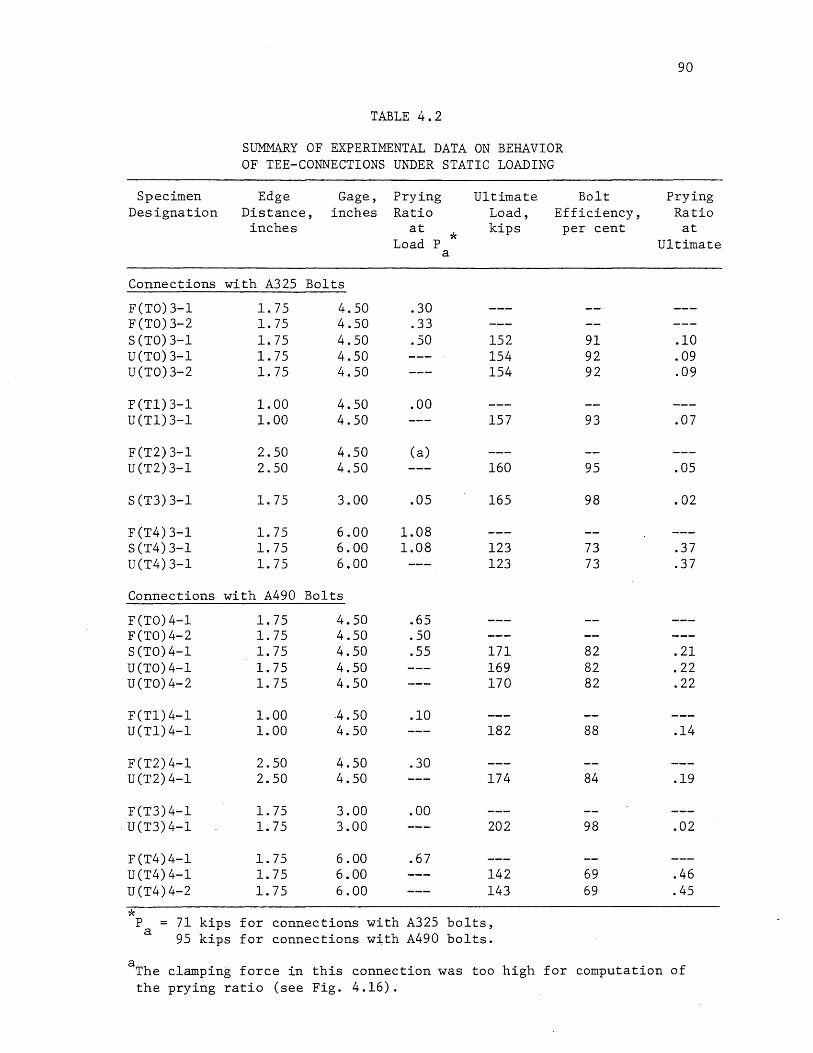
TABLE 4.2
SUMMARY OF EXPERIMENTAL DATA ON BEHAVIOR OF TEE-CONNECTIONS UNDER STATIC LOADING
Specimen Designation
Edge Distance, inches
Gage, Prying inches Ratio
at * Load P
a
Connections with A325 Bolts
F(TO)3-1 F(TO)3-2 S(TO)3-1 U(TO) 3-1 U(TO)3-2
F(T1)3-1 U(T1)3-1
F(T2)3-1 U(T2) 3-1
S(T3)3-1
F(T4)3-1 S(T4)3-1 U(T4)3-1
1.75 1.75 1.75 1.75 1.75
1.00 1.00
2.50 2.50
1.75
1.75 1.75 1.75
4.50 4.50 4.50 4.50 4.50
4.50 4.50
4.50 4.50
3.00
6.00 6.00 6.00
Connections with A490 Bolts
F(TO)4-1 F(TO)4-2 S(TO)4-1 U(TO)4-1 U(TO)4-2
F(T1)4-1 U(T1)4-1
F(T2)4-1 U(T2)4-1
F(T3)4-1 U(T3)4-1
F(T4)4-1 U(T4)4-1 U(T4)4-2
*
1.75 1.75 1.75 1.75 1.75
1.00 1.00
2.50 2.50
1.75 1.75
1.75 1.75 1.75
4.50 4.50 4.50 4.50 4.50
.4.50 4.50
4.50 4.50
3.00 3.00
6.00 6.00 6.00
.30
.33
.50
.00
(a)
.05
1.08 1.08
.65
.50
.55
.10
.30
.00
.67
Ultimate Load, kips
152 154 154
157
160
165
123 123
171 169 170
182
174
202
142 143
P a
71 kips for connections with A325 bolts, 95 kips for connections with A490 bolts.
Bolt Efficiency, per cent
91 92 92
93
95
98
73 73
82 82 82
88
84
98
69 69
90
Prying Ratio at
Ultimate
.10
.09
.09
.07
.05
.02
.37
.37
.21
.·22
.22
.14
.19
.02
.46
.45
aThe clamping force in this connection was too high for computation of the prying ratio (see Fig. 4.16).

TABLE 4.3
SUMMARY OF EXPERIMENTAL DATA ON BEHAVIOR OF TEE-CONNECTIONS UNDER FATIGUE LOADING
Specimen Maximum Range in Average Cycles Designation Applied Bolt Stress* to
Load, in First Cycle Failure, kips of Loading, ksi thousands
Connections with A325 Bolts
F(TO)3-l 72 2.0 3000a
F(TO)3-2 75 5.7 999 F(Tl)3-l 72 1.1 2300a
F (T2) 3-1 86 4.1 2700a F(T4)3-l 72 7.4 555
Connections with A490 Bolts
F(TO)4-l 100 11.7 164 F(TO)4-2 94 6.6 270 F(Tl) 4-1 100 4.2 528 F(T2)4-l 100 3.7 592 F(T3) 4-1 100 2.2 3000a F(T4)4-l 100 10.4 32 F(T4)4-2 79 3.2 3200a
* The range in average bolt stress is the measured range in bolt tension divided by the nominal area of the bolt shank.
aThe connection did not fail. The test was discontinued after the number of cycles indicated.
91

Applied Load
per Bolt, kips
0.0
11.9
18.6
22.7
28.2
TABLE 5.1
SELECTED RESULTS FROM ANALYSIS OF A TEE-CONNECTION
Bolt Tension,
kips
35.0
35.8
37.9
40.4
- 44.3
Reaction on Bottom of Flange per Bolt,
kips
35.0
23.9
19.3
17.7
16.1
Distribution of Reaction and
Regions of Yield*
3/4 in. diam . . A490 bolt
r 1. 7sZ0----l ~ I ! ~ I I
* Portions of the tee-section which had yielded are shown shaded.
92
Remarks
Number of bolts = 4; length of flange parallel to web = 11.0. (All dimensions are in inches.)

*
Applied Load
per Bolt, kips
33.2
36.3
40.3 (Ultimate)
TABLE 5.1 (Continued)
SELECTED RESULTS FROM ANALYSIS OFA TEE-CONNECTION
Bolt Tension,
kips
48.6
50.4
52.0
Reaction on Bottom of Flange per Bolt,
kips
15.4
14.1
11.7
Distribution of Reaction and
Regions of Yield*
93
Remarks
The connection became unstable; failed by bolt fracture.
Portions of the tee-section which. had yielded are shown shaded.

94
TABLE 5.2
PROPERTIES OF TEE-CONNECTIONS ANALYZED
b, Analyzed Analyzed * Desig- t, a, w, Remarks nation inches inches inches inches with with
of A325 A490 Geometry Bolts? Bolts?
Al 0.750 1.594 1.719 2.250 Yes No A2 0.750 1.594 1.719 3.750 Yes Yes A3 0.750 1.594 1.719 5.500 Yes Yes
B1 1.062 1.793 1.863 2.250 Yes No B2 1.062 1.793 1.863 5.500 Yes No B3 1.062 1.793 2.660 5.500 Yes Yes B3R 1.062 1.793 2.660 5.500- No Yes Rigid base
C1 1.500 2.531 1.531 2.250 Yes Yes C2 1.500 2.531 2.469 2.250 Yes Yes C3 1.500 1.031 3.406 2.250 Yes Yes C4 1.500 1.594 3.406 2.250 Yes Yes C5 1.500 2.531 3.406 2.250 Yes Yes C6 1.500 2.531 3.406 3.750 Yes Yes C6R 1.500 2.531 3.406 3.750 No Yes Rigid' base C7 1.500 2.531 3.406 5.500 Yes Yes C8 1.500 3.844 3.406 2.250 Yes Yes
D1 1.750 2.516 2.453 2.250 Yes Yes D2 1.750 2.406 3.437 2.250 Yes Yes
E1 2.000 . 2.875 2.562 2.250 Yes Yes E2 2.000 1.625 3.812 2.250 Yes Yes E3 2.000 2.875 3.812 2.250 Yes Yes E3R 2.000 2.875 3.812 2.250 No Yes Rigid base E4 2.000 2.875 3.812 5.500 Yes No E5 2.000 4.625 3.812 2.250 Yes Yes
TO 1.062 1.727 1.797 3.750 Yes Yes 1.25 in. fill plate T1 1.062 0.930 1.797 3.750 Yes Yes 1.25 in. fill plate T2 1.062 2.523 1.797 3.750 Yes Yes 1.25 in. fill plate T3 1.062 1.660 1.066 3.750 Yes Yes 1.25 in. fill plate T4 1.062 1.793 2.527 3.750 Yes Yes 1.25 in. fill plate
* Unless otherwise indicated, connections were symmetrical and had no fill plate between the tee-sections. The bolt diameter, d, was 3/4 inch in all connec-tions.

TABLE 5.3
SUMMARY OF RESULTS OF ANALYSIS OF TEE-CONNECTIONS ASSEMBLED WITH A325 BOLTS
95
Connection Geometry
* P4ksi' Ultimate Load, kips
per bolt
Bolt Efficiency, per cent
Prying Ratio
at Ultimate
Mode of
Failure
*
Al A2 A3
BI B2 B3
CI C2 C3 C4 C5 C6 C7 C8
DI D2
El E2 E3 E4 E5
TO Tl T2 T3 T4
kips per bolt
10.4 12.1 13.6
14.0 17.0 14.3
17.9 14.2 10.6 12.1 12.7 14.4 15.8 12.7
16.3 14.2
17.7 13.7 14.2 18.0 14.3
19.3 18.1 19.4 24.3 15.9
16.7 28.8 34.2
28.8 42.0 37.1
42.0 34.7 26.7 27.6 29.6 36.2 42.0 31.3
38.5 33.0
42.0 35.0 35.3 42.0 35.3
37.6 37.5 37.8 42.0 31.4
40 69 81
69 100
89
100 83 64 66 70 86
100 75
92 89
100 83 84
100 84
89 89 90
100 75
.46
.23
.00
.13
.00
.21
.57
.52
.42
.16
.00
.34
.09
.27
.00
.20
.19
.00
.19
.12
.12
.11
.00
.34
Flange Bolt fracture
II
Flange Bolt fracture
II
II
" II
" II
II
II·
II
'11
II
II
" " " II
" " " " "
Externally applied load on the connection which causes an increase in bolt stress of 4 ksi.
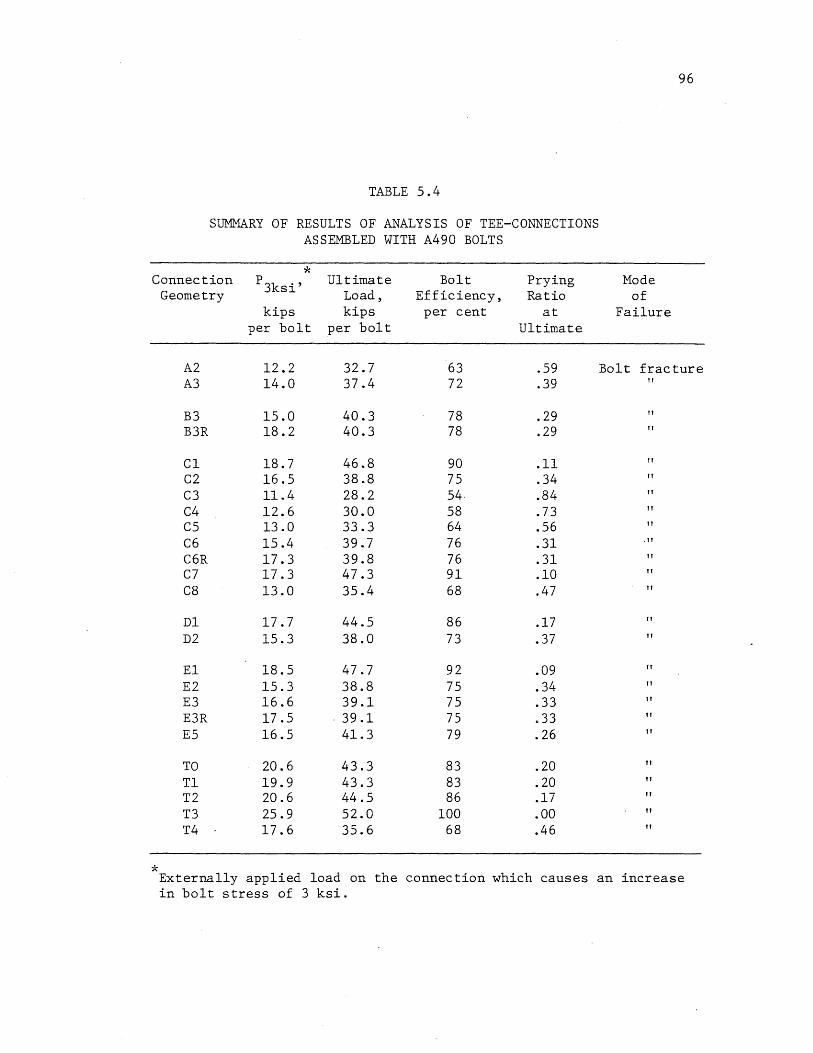
96
TABLE 5.4
SUMMARY OF RESULTS OF ANALYSIS OF TEE-CONNECTIONS ASSEMBLED WITH A490 BOLTS
* Connection P3ksi ' Ultimate Bolt Prying Mode Geometry Load, Efficiency, Ratio of
kips kips per cent at Failure per bolt per bolt Ultimate
A2 12.2 32.7 63 .59 Bolt fracture A3 14.0 37.4 72 .39 "
B3 15.0 40.3 78 .29 " B3R 18.2 40.3 78 .29 "
C1 18.7 46.8 90 .11 " C2 16.5 38.8 75 .34 " C3 11.4 28.2 54· .84 " C4 12.6 30.0 58 .73 " C5 13.0 33.3 64 .56 " C6 15.4 39.7 76 .31 ." C6R 17.3 39.8 76 .31 " C7 17.3 47.3 91 .10 " C8 13.0 35.4 68 .47 "
D1 17.7 44.5 86 .17 " D2 15.3 38.0 73 .37 "
E1 18.5 47.7 92 .09 " E2 15.3 38.8 75 .34 " E3 16.6 39.1 75 .33 " E3R 17.5 . 39.1 75 .33 " E5 16.5 41.3 79 .26 "
TO 20.6 43.3 83 .20 " T1 19.9 43.3 83 .20 " T2 20.6 44.5 86 .17 " T3 25.9 52.0 100 .00 " T4 17.6 35.6 68 .46 "
* Externally applied load on the connection which causes an increase in bolt stress of 3 ksi.

97
TABLE 5.5
CO:MPARISON OF RESULTS OF ANALYSIS OF TEE-CONNECTIONS WITH EXPERIMENTAL DATA
* Connection PR, Ultimate Load, Bolt Efficiency, Prying Ratio Geometry
kiEs Eer bolt kiEs Eer bolt Eer cent at Ultimate from from from from from from from from
Analysis Tests Analysis Tests Analysis Tests Analysis Tests
Connections with A325 Bolts
TO 19.3 18.5 37.6 38.2 89 91 .12 .10 Tl 18.1 l8.o+a 37.5 39.2 89 93 .12 .08 T2 19.4 20.8 37.8 40.0 90 94 .11 .07 T3 24.3 23.5 42.0 41.3 100 98 .00 .02 T4 15.9 15.1 31.4 30.8 75 73 .34 .36
Connections with A490 Bolts
TO 20.6 19.0 43.3 42.5 83 82 .20 .22 T1 19.9 21.0 43.3 45.5 83 87 .20 .16 T2 20.6 22.9 44.5 43.5 86 84 .17 .19 T3 25.9 25.0+ 52.0 50.8 100 98 .00 .02 T4 17.6 18.0 35.6 35.5 68 68 .46 .47
* PR
is the externally applied load on the connection which causes an increase in bolt stress of R where R = 4 ksi for A325 bolts; 3 ksi for A490 bolts.
a + after a value of PR indicates that experimental data was not available at loads higher than the one shown and that a higher load would be required to produce the specified increase in bolt stress.
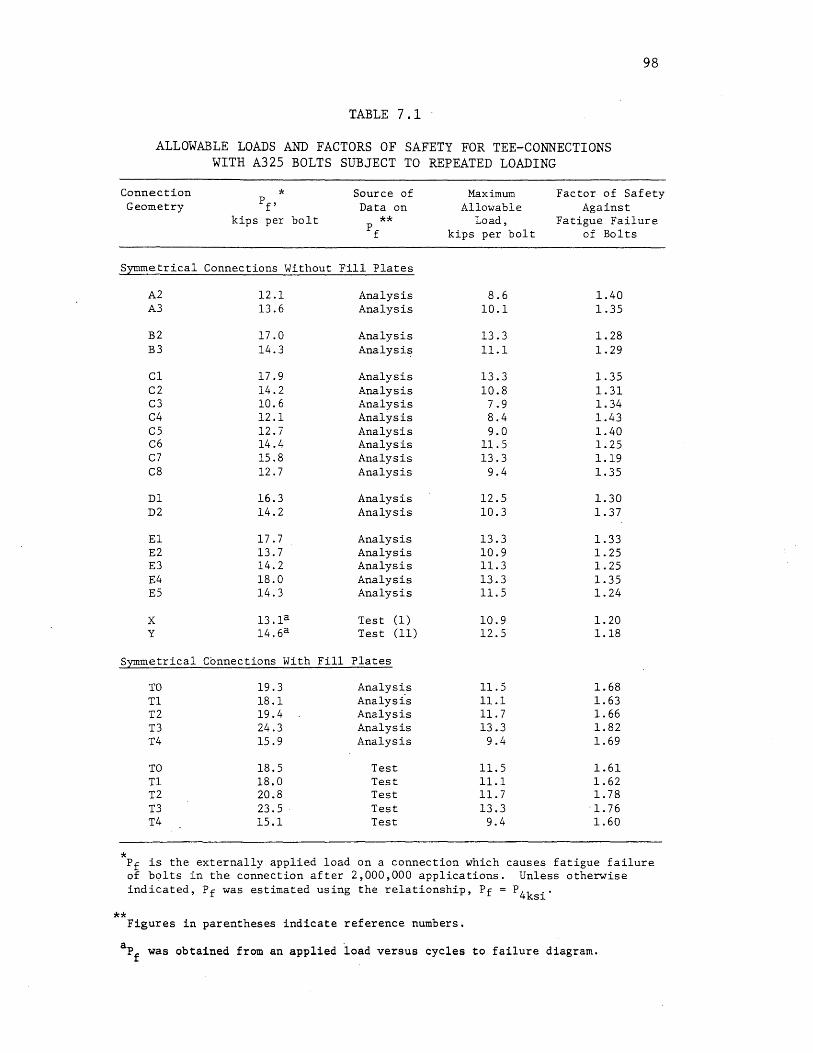
TABLE 7.1
ALLOWABLE LOADS AND FACTORS OF SAFETY FOR TEE-CONNECTIONS WITH A325 BOLTS SUBJECT TO REPEATED LOADING
98
Connection Geometry
* Pf
, Source of Data on
Maximum Allowable
Load, kips per bolt
Factor of Safety Against
Fatigue Failure of Bolts
kips per bolt ** P f
Symmetrical Connections Without Fill Plates
A2 A3
B2 B3
Cl C2 C3 C4 C5 C6 C7 C8
Dl D2
El E2 E3 E4 E5
x y
12.1 13.6
17.0 14.3
17.9 14.2 10.6 12.1 12.7 14.4 15.8 12.7
16.3 14.2
17.7 13.7 14.2 18.0 14.3
13.la 14.6a
Analysis Analysis
Analysis Analysis
Analysis Analysis Analysis Analysis Analysis Analysis Analysis Analysis
Analysis Analysis
Analysis Analysis Analysis Analysis Analysis
Test (1) Test (11)
8.6 10.1
13.3 11.1
13.3 10.8
7.9 8.4 9.0
11.5 13.3
9.4
12.5 10.3
13.3 10.9 11.3 13.3 11. 5
10.9 12.5
1.40 1.35
1.28 1.29
1.35 1.31 1.34 1.43 1.40 1.25 1.19 1.35
1.30 1.37
1.33 1.25 1.25 1.35 1.24
1.20 1.18
Symmetrical Connections With Fill Plates
*
**
TO Tl T2 T3 T4
TO Tl T2 T3 T4
19.3 18.1 19.4 24.3 15.9
18.5 18.0 20.8 23.5 15.1
Analysis Analysi-s Analysis Analysis Analysis
Test Test Test Test Test
11.5 11.1 11. 7 13.3 9.4
11.5 11.1 11.7 13.3
9.4
1.68 1.63 1. 66 1.82 1.69
1.61 1.62 1.78
-I. 76 1.60
Pf is the externally applied load on a connection which causes fatigue failure of bolts in the connection after 2,000,000 applications. Unless otherwise indicated, Pf was estimated using the relationship, Pf = P4ksi '
Figures in parentheses indicate reference numbers.
apf was obtained from an applied load versus cycles to failure diagram.

TABLE 7.2
ALLOWABLE LOADS AND FACTORS OF SAFETY FOR TEE-CONNECTIONS WITH A490 BOLTS SUBJECT TO REPEATED LOADING
99
Connection Geometry
* Pf
,
kips per bolt
Source of Data on
** Pf
Maximum Allowable
Load, kips per bolt
Factor of Safety Against
Fatigue Failure of Bolts
Symmetrical Connections Without Fill Plates
A2 A3
B3
C1 C2 C3 C4 C5 C6 C7 C8
Dl D2
E1 E2 E3 E5
z
12.2 14.0
15.0
18.7 16.5 11.4 12.6 13.0 15.4 17.3 13.0
17.7 15.3
18.5 15.3 16.6 16.5
Analysis Analysis
Analysis
Analysis Analysis Analysis Analysis Analysis Analysis Analysis Analysis
Analysis Analysis
Analysis Analysis Analysis Analysis
Test (11)
Symmetrical C0nnections With Fill Plates
TO Tl T2 T3 T4
TO Tl T2 T3 T4
20.6 19.9 20.6 25.9 17.6
19.0 21.0 22.9 25.0 18.0
Analysis Analysis Analysis Analysis Analysis
Test Test Test Test Test
Connections of Tee-Section to Rigid Base
*
B3R C6R E3R
18.2 17.3 17.5
Analysis Analysis Analysis
9.6 11. 2
12.1
14.8 11.9 8.8 9.3
10.0 12.5 14.8 10.3
13.5 11.3
15.0 11.8 12.3 12.6
16.5
12.5 12.0 12.9 15.8 10.4
12.5 12.0 12.9 15.8 10.4
12.1 12.5 12.3
1.27 1.25
1.24
1.26 1.38 1.29 1.35 1.30 1.23 1.18 1.26
1.31 1.35
1.23 1~29 1.35 1.31
1.20
1.65 1.66 1.60 1.64 1.69
1.52 1. 75 1. 78 1.59 1. 73
1.50 1.39 1.42
Pf is the externally applied load on a connection which causes fatigue
**
failure of bolts in the connection after 2,000,000 applications. Unless otherwise indicated, Pf was estimated using the relationship, Pf - P3ksi '
Figures in parentheses indicate-reference numbers.
aPf was obtained from an applied load versus cycles to failure diagram.

100
TABLE A.1
ELEMENT STIFFNESS MATRICES
Element type I: l+B 0 -B B -1 A 0 -A-B l+B A -1 B -B -A-B 0
l+B -A-B 0 0 -1 B l+B 0 0 A -B
C l+B -A-B -B A l+B B -1
symmetric l+B 0 l+B
Element type II: l+B A+B -B -A -1 -B 0 0 l+B -B -1 -A -B 0 0
l+B 0 0 A+B -1 -A C l+B A+B 0 -B -B
l+B 0 -B -B l+B -A -1
symmetric l+B A+B l+B
Element type III: l+B A+B -B -A -1 -B l+B -B -1 -A -B
B 0 0 B C 1 A 0
symmetric 1 0 B
Plane stress: A B = I-v C = ~ [1_~2 ] v,
2 ,
Plane strain: A v B 1-2v t [ E(l-v) ]
= I-v' 2(1-v) , C
2 (l+v) (1-2v)
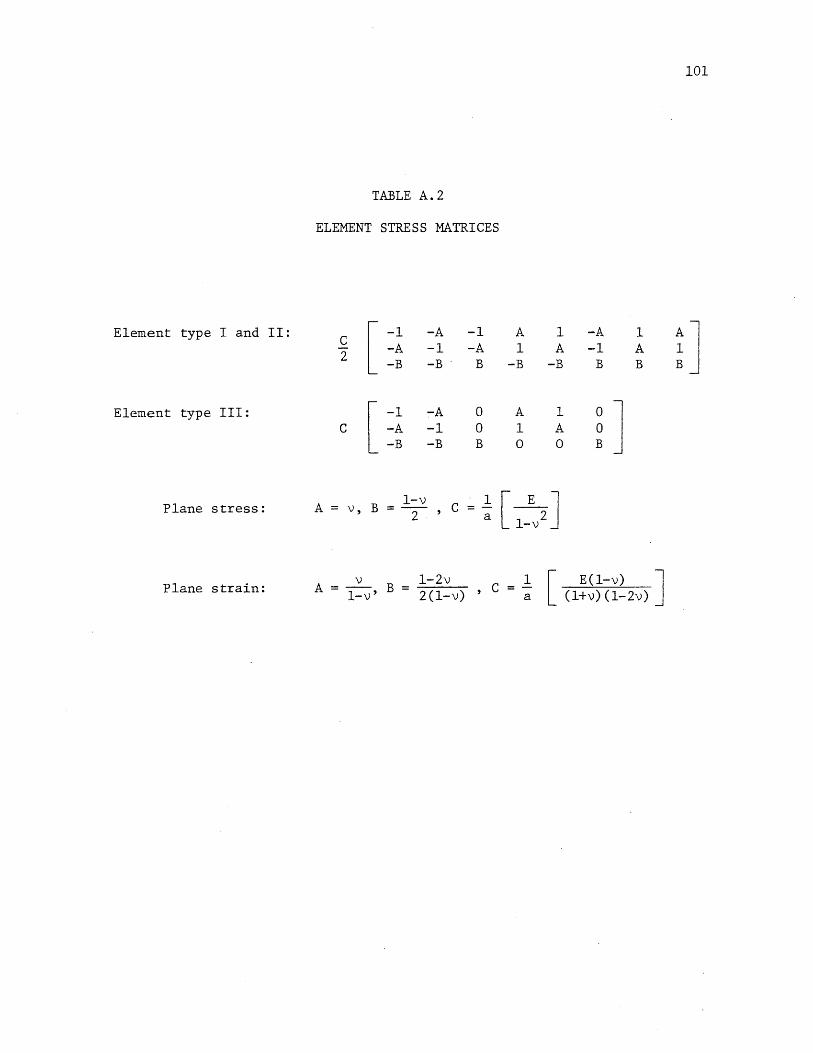
101
TABLE A.2
ELEMENT STRESS MATRICES
Element type I and II: C [ -1 -A -1 A 1 -A 1 !J 2 -A -1 -A 1 A -1 A -B -B . B -B -B B B
Element type III: [ -1 ~A 0 A 1 0 ] C -A -1 0 1 A 0 -B -B B a a B
Plane stress: A = v, B I-v , C 1 [1~v2 ] =--2 a
Plane strain: v 1-2v 1 [ E(l-v) ] A=- B = 2(1-v)
, C (l+v) (1-2v) I-v' a

~ , ~
- l+-I I --.l
Cpo - H T
4.,..
.cpo ql i i
~ I I I
~ ~
a) Beam-to-Column Connection
b) Hanger Connection
FIG. 1.1 TYPICAL USES OF TEE-STUBS IN STRUCTURAL CONNECTIONS
102
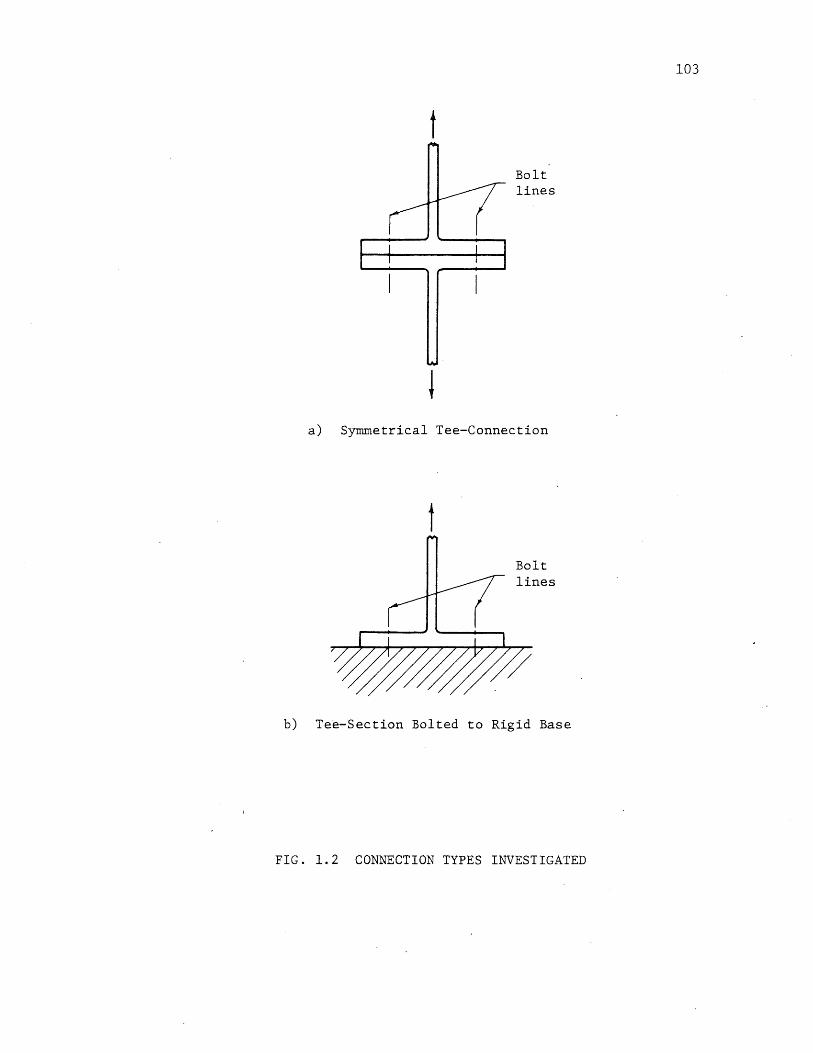
t Bolt lines
a) Symmetrical Tee-Connection
t
b) Te~-Section Bolted to Rigid Base
FIG. 1.2 CONNECTION TYPES INVESTIGATED
103

t
a) Connection with Rigid Flanges
t
b) Connection with Flexible Flanges
FIG. 2.1 DEVELOPHENT OF PRYING FORCE IN TEE-CONNECTIONS
104

1 I ...---+--+----1
1 I
a) Single-Bolt Connection
... ~
4:;=-
t
t ..
~ y
.... 'I
© / \ I ) '_ ...
~ ~ v v
b) Tee-Connection
FIG. 2.2 SINGLE-BOLT CONNECTION AND TEE-CONNECTION
105

r--. CJ)
E-<
C 0
-M CJ)
C Q)
E-<
.u ..-i 0 co
-...,..-+--+-~---,
t pes) ,
106
total applied load around circumference
t (s) C ,total compressive force
parts between connected
a) Forces on One of the Connected Parts
T 0
Separation of connected parts occurs here
Applied Load, pCs)
b) Relationship Between Bolt Tension and Applied Load
FIG. 2.3 FORCES IN SINGLE-BOLT CONNECTION
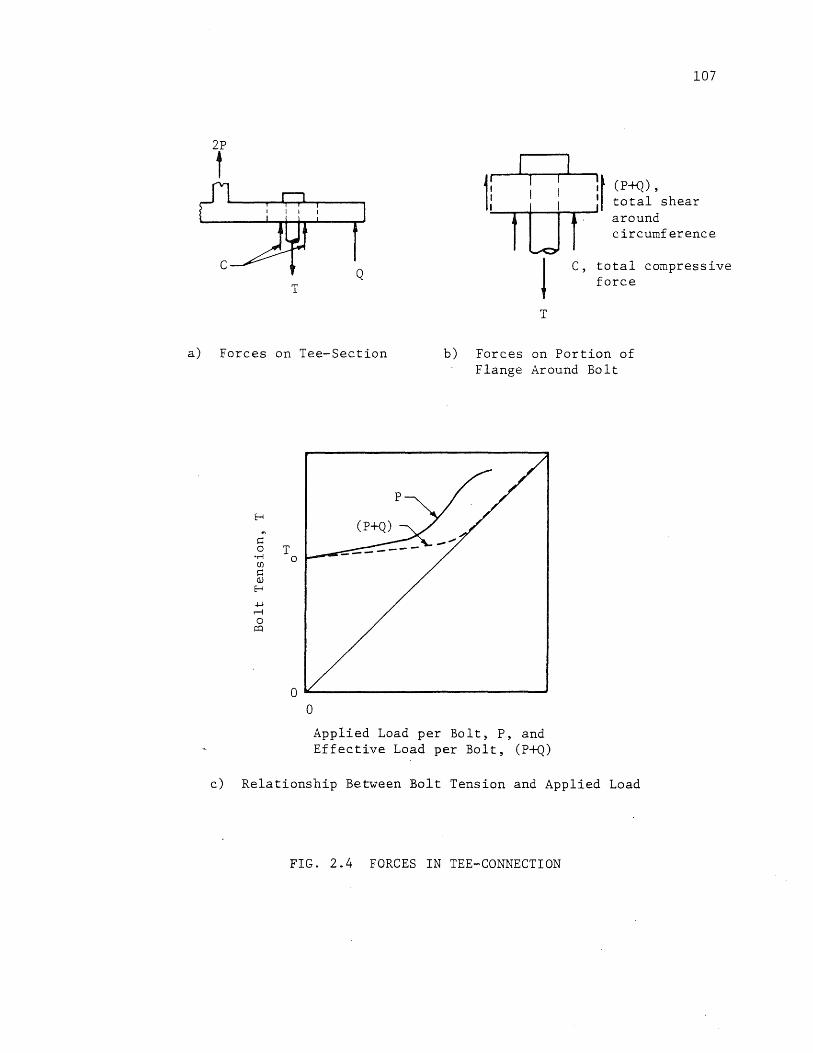
107
2P
1 ~II:: :t (P~), I H : total shear
~-f--~~--~-f--- ~~~~:!ference
T 1 C, total compressive
force
T
a) Forces on Tee-Section b) Forces on Portion of Flange Around Bolt
H .,
c 0
-r-l (J)
c Q.)
H
.w r-1 0
r:o
T 0
o ~--------------------------~ o Applied Load per Bolt, P, and Effective Load per Bolt, (P+Q)
c) Relationship Between Bolt Tension and Applied Load
FIG. 2.4 FORCES IN TEE-CONNECTION

T u ---------------I
Tee-connec t ion I I
Single-bolt I connection I
H I .. Tl I c 0
OM CI)
c (l)
H
+J M 0
P=1
I T I I
a r--- Qu ---I I I I I
I
I I I I I I
I I I
~ r---QI I I I
I I I I I I I
I I I I I I I I I
I I 0
0 PI PI (s) P P (s)
u u
Applied Load per Bolt, P and pes)
FIG. 2.5 BOLT TENSION VERSUS APPLIED LOAD FOR TEE-CONNECTION AND SINGLE-BOLT CONNECTION
108

Q
C
g
2P
assumed points of inflection
gage distance
a = edge distance
Q, resultant of prying force
a) Model Used by Chang (4)
2P
t
Q~ a+- b~ Q
b-+a~ b) Modei Used by Douty and McGuire (3)
FIG. 3.1 MODELS USED IN PREVIOUS ANALYTICAL STUDIES
109

I I I
I 1 J
I
I I I 1
£
110
13/16 in. diam. hole for bolt of 3/4 in. nominal diam.
-+ ~I~ rl
FIG. 4.1 GEOMETRY OF SINGLE-BOLT CONNECTIONS TESTED

~ 11"------1
2~1I+ 3" 3" + 2~"~ 2 21
~-+-I I I
t I
+
1 1/16 in. diam. holes for testing machine pull heads
III
+ -t--t--+ -4--+---$-
+ I ia--r g a1
I ~ l' I I
I
I 1"
72
L....
1
_%-+"_-+-1_"--+1_}--t" ~r I ~ 42 ~
I
~-+-+ I I
-4--4--4-I I I
-t--t.--+
~-----~~~-----------------------------------~+-~-----~~~ I 'I ~1-.::t"~lco
.--i C"')
13/16 in. diam. holes for bolts of 3/4 in. nominal diam.
Geometry a g Designation (inches) (inches)
TO 1 3/4 4 1/2
T1 1 4 1/2
T2 2 1/2 4 1/2
T3 1 3/4 3
T4 1 3/4 6
FIG. 4.2 GEOMETRY OF TEE-CONNECTIONS TESTED

50
40 ,......
Q)
~ ".-1 ...c
CJ cU E:1
CfJ o..bO
30 ".-1 C ~ ".-1
.w '" CI) ~ Q) o .w
".-1 CfJ ~ ~ 0 Q)
E-4'"'d Q)
+.I .:.J 20 ...-1 cU 0 CJ ~ ".-1
'"'d ~
".-1
CI)
cU '-"
10
0 0
I Ultimate load, 42.0 kips 1
?'----V
/ V
/ I
/ A325 Bolt
3/4 in. diameter
/ 3 1/2 in. grip
7/16 in. thread in grip
I
1000 2000 3000 4000
Average Axial Shank Strain, microinches per inch
(average. of strain indicated by gages mounted on opposite sides of shank)
FIG. 4.3 BOLT TENSION VERSUS SHANK STRAIN FOR BOLT UNDER DIRECT TENSION
112
......
5000
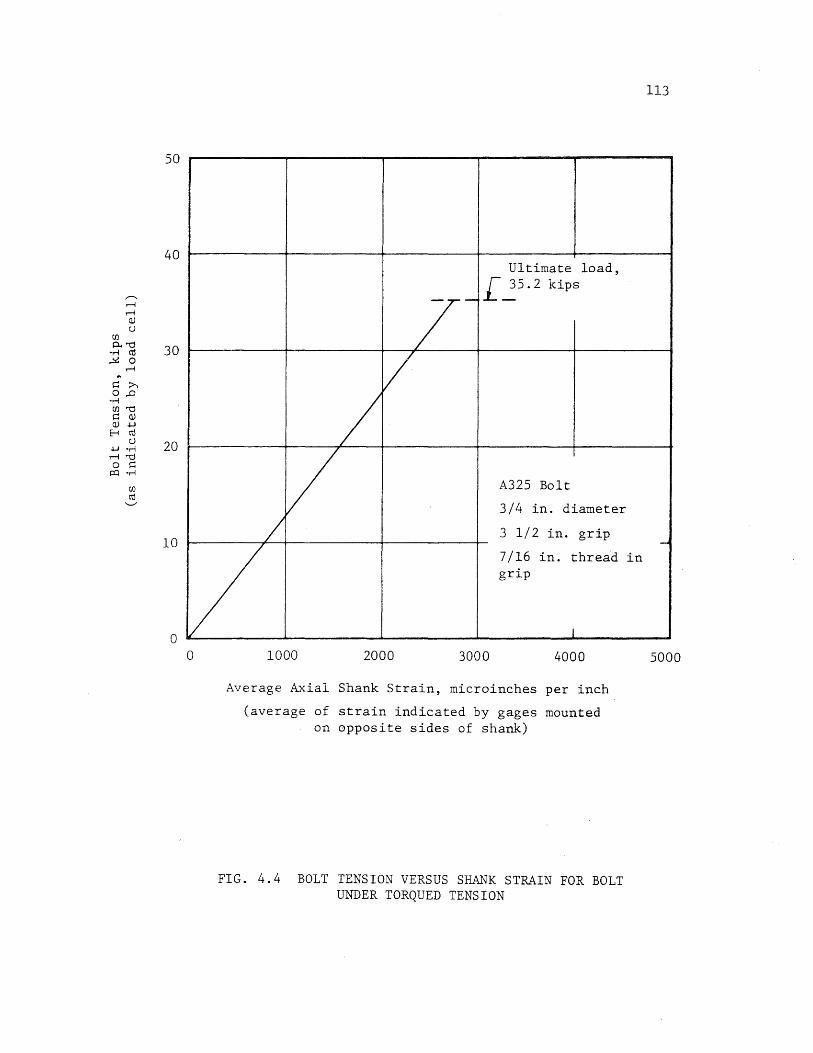
50
40
,.-.. ,..-i ,..-i
QJ cJ
Cf.l o..""d 30 -..4 m
,.!G 0 ,..-i ...
~ :>-. 0,..0
-..4 Cf.l""d ~ QJ QJ +J
H m cJ 20 +J -..4
,..-i""d 0 ~
i=O -..4
Cf.l m
'-'"
10
o o
Ultimate load,
7-[3..5.2 kips
/ /
V A325 Bolt
3/4 in. diameter
/ 3 1/2 in. grip
7/16 in. thread grip
I
1000 2000 3000 4000
Average Axial Shank Strain, microinches per inch
(average of strain indicated by gages mounted on opposite sides of shank)
FIG. 4.4 BOLT TENSION VERSUS SHANK STRAIN FOR BOLT UNDER TORQUED TENSION
113
-in
5000

f
A
r
A
Pulling yoke
Heat treated steel inserts
SECTION A-A
FIG. 4.5 LOADING SYSTEM FOR DIRECT-TENSION CALIBRATION TESTS OF BOLTS
114

115
t
A
L A
SECTION A-A
FIG. 4.6 LOADING SYSTEM FOR SINGLE-BOLT CONNECTIONS

CJ) p...
'r-! ~
t:: o
.r-! CJ)
t:: QJ
H
+J r-4 o
pC:!
60
50
40
30
20
10
o o 10
_--- _____ §Dir:t Tension -+- __ - I ~ --'"j- --,----~~
-'I ~-=r-::1'
::\
Torqued Tension
A325 Bolt idealized relationship
3/4 in. diameter --- experimentally determined relationship
3 1/2 in. grip
7/16 in. thread in grip
~
20
I
30 40
* failure at 33 kips, 120 x 10-3 in.
** failure at 35 kips, 150 x 10-3 in.
50 60 70 80 90
Elongation, inches x 10-3
FIG. 4.7 TENSION-ELONGATION RELATIONSHIPS OF A325 BOLTS UNDER DIRECT TENSION AND TORQUED TENSION
100 110
.......
....... (j"I

(/)
P. ,,-1
~
'" p o
,,-1 (/) Jj Q)
H
.lJ H o
P4
60 I Direct Tension
50 ---
40
Torqued Tension
30 ~
20
A490 Bolt
3/4 in. diameter
10 1---+-- 3 5/8 in. grip
9/16 in. thread in grip *
idealized relationship
experimentally determined relationship
failure at 47 kips, 115 x 10-3 in. --
o ~ ____ ~ ______ ~ ______ ~ ____ ~~ ____ ~ ______ ~ ______ ~ ____ ~~ ____ ~ ______ -L ____ ~
o 10 20 30 40 50 60 70 80 90
Elongation, inches x 10-3
FIG. 4.8 TENSION-ELONGATION RELATIONSHIPS OF A490 BOLTS UNDER DIRECT TENSION AND TORQUED TENSION
100 110
I-' I-' '-.I

T o
/ A' ~
/ /
/ /
/ /
/ J 0'
/ /
IE /
F'
118
Direct-tension relationship (given)
~_-----r-----"'" D
Torqued-tension relationship (given)
Curve EB'F'C is the tension-elongation relationship of a bolt with pretension To subjected to direct tension. This curve is obtained by drawing EF parallel to OA and translating OABF such that it passes through E and meets the directtension relationship.
Bolt Elongation
FIG. 4.9 ANALYTICAL PROCEDURE FOR OBTAINING TENSION-ELONGATION RELATIONSHIP OF PRETENSIONED BOLT SUBJECTED TO DIRECT TENSION
C

45
40
35
CI) 30
p.. OM ...:x!
.. 25 s:: 0
OM CI)
s:: Q.) 20
H
+-l .--i 0
o:l 15
10
5
0 0
---- --- ---- ---- --------.....
A325 Bolt 3/4 in. diameter 3 1/2 in. grip 7/16 in. thread in grip 32 kip pretension
Relationship obtained by applying the method described in Fig. 4.9 to the idealized direct-tension and torqued-tension tension-elongation relationships shown in Fig. 4.7
- - - - Experimentally determined relationship
10 20 30 40
Increase in Elongation after Tightening, inches x 10-3
FIG. 4.10 TENSION-ELONGATION RELATIONSHIP OF PRETENSIONED A325 BOLT SUBJECTED TO DIRECT TENSION
50
119
10
5
o s:: o CI)
OM p.. CI) OM S::...:x! Q.) H ...
b!l .w s:: .--i OM o s::
p:::) Q.) .w
s::...c: OM b!l
OM Q.) .w CI) C'Ij l-I Q.) Q.) l-I .w U4-< s:: C'Ij
H

CJJ P.
-.-1 ..!G
~
c: 0
-.-1 CJJ c: QJ
E--!
+J rl 0
p:j
55 __ --------__ --------~--------~~--------~--------~
40
35
30
25
20
15
10 o
---- ----~ -----A490 Bolt 3/4 in. diameter 3 5/8 ino grip 9/16 in. thread in grip 40 kip pretension
Relationship obtained by applying the method described in Fig. 4.9 to the idealized direct-tension and torquedtension tension-elongation relationships shown in Fig. 4.8.
- - - - Experimentally determined relationship
10 20 30 40
Increase in Elongation after Tightening, inches x 10-3
FIG. 4.11 TENSION-ELONGATION RELATIONSHIP OF PRETENSIONED A490 BOLT SUBJECTED TO DIRECT TENSION
50
120
15
10
5
o c: o CJJ
0.-1 P. CJJ -.-1 c:~ QJ H ..
bO +J c: ....-l 0.-1 o c: ~ QJ
~
c:.c • .-1 bO
• .-1 QJ ~ CJJ co $-I QJ QJ $-I ~ U 4-l c: co
H

(/)
0... 01"'1 ~
.. ~ 0
01"'1 (/)
~ Q)
H
+-J ..--l 0
I=Q
60
50
40
30
20
10
0 60
50
40
30
20
10
0 0 20 40
7/16 in. thread in grip, 3 1/2 in. grip
1/8 in. thread in grip, 3 3/16 in. grip
A325 Bolts 3/4 in. diameter
9/16 in. thread in grip, 3 5/8 in.
thread in grip, 3 3/16 in. grip
A490 Bolts 3/4 in. diameter
60 80 100 120 140
Elongation, inches x 10-3
160
FIG. 4.12 EFFECT OF THREAD LENGTH IN GRIP ON TENSION-ELONGATION RELATIONSHIP OF BOLTS UNDER DIRECT TENSION
121
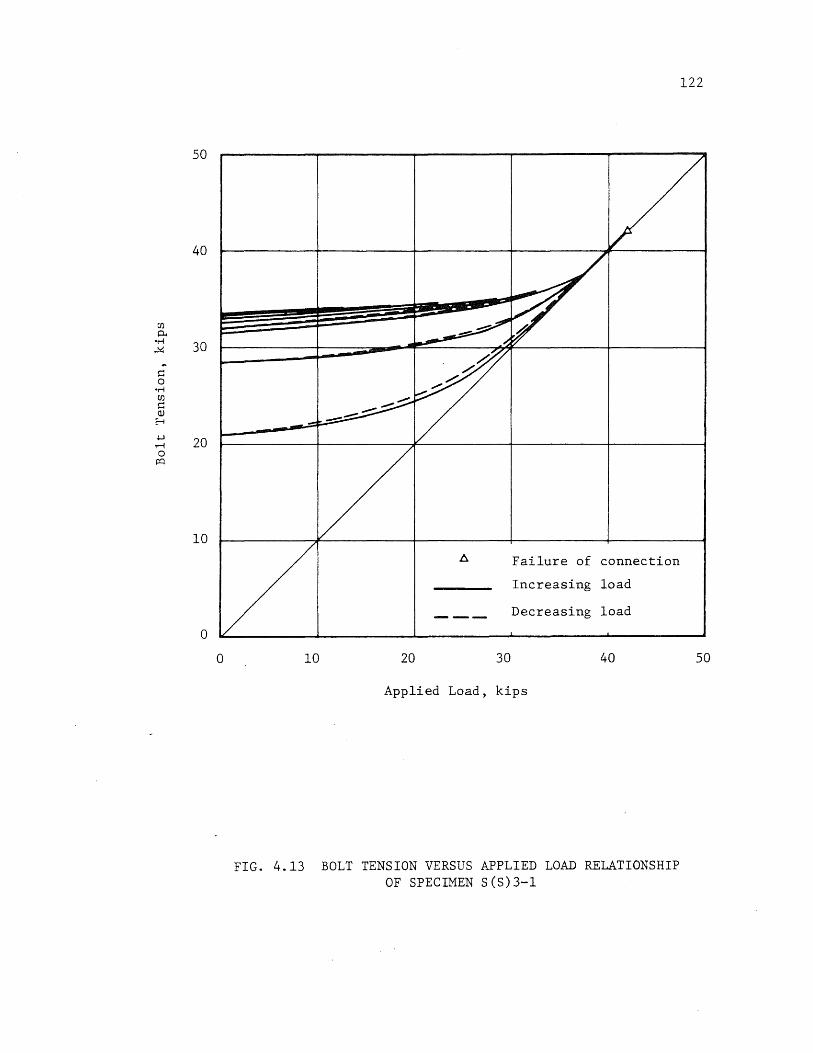
50
40
CJ)
0.--ri 30 ,.!s:!
.. s:: 0
-ri CJ)
s:: OJ
H
+J 20 M 0
i=Cl
10
0
0
Failure of connection
Increasing load
--- Decreasing load
10 20 30 40
Applied Load, kips
FIG. 4.13 BOLT TENSION VERSUS APPLIED LOAD RELATIONSHIP OF SPECIMEN S(S)3-l
122
50

CIJ ~
oM ~
-Ie
--~ 0
oM CIJ ~ Q)
H
+.J .-i 0 ~
123
50r---------~--------~~--------~--------~~--------~
40~--------_+----------+_--------_4--------~~--------~
20~--------_+--------~~--------~----------~--------__4
* Average of measurements "from two bolts
10r---------~----------~--------~--------~~--------~ Failure of connection
Increasing load
Decreasing load
O~--------~----------~----------~----------~--------~ o 10 20 30 40
Applied Load per Bolt, kips
FIG. 4.14 BOLT TENSION VERSUS APPLIED LOAD RELATIONSHIP OF SPECIMEN S(T3)3-l
50

50
40
en 0..
-r-l ~ 30
-)I:
"' 0 0
-r-l en 0 <lJ H
+J .-l 20 0
1=0
10
0 0
* Average of measurements from four bolts
Failure of connection
Increasing load
---- Decreasing load
10 20 30 40
Applied Load per Bolt, kips
FIG. 4.15 BOLT TENSION VERSUS APPLIED LOAD RELATIONSHIP OF SPECIMEN S(T4)3-l
124
50

60
50
40
30
20
Cf.l 0- 10 or-!
..!G
'" C 0 0 or-! Cf.l C Q)
H .j..J 50 ....-i 0
1=0
40
30
20
10
0
125
S(TO)3-l / F(TO)3-l / One bolt One bolt ...
V V instrumented instrumented
p
~ -_ ... V ~ r-----
V / ~
/ V L L
F(TO)3-2 FCTl)3-l V V t- Two bolts One bolt
V V instrumented instrumented
v/ -----V ~ .. ~---
V /
A Failure of connection .
/ Tee-connection
/ ---- Single-bolt connection
l I I 1 I o 10 20 30 40 50 o 10 20 30 40
Applied Load per Bolt, kips
FIG. 4.16 BOLT TENSION VERSUS APPLIED LOAD RELATIONSHIPS OF TEE-CONNECTIONS WITH A325 BOLTS
50 60

60
50
40
30
20
CJ)
P. OM 10 ,.!:::!
'" c: 0
OM 0 CJ)
c: a> H
+J 50 .-I 0
o:l
40
30
20
10
0
126
F(T2)3-l V S(T3)3-l V One bolt Two bolts r instrumented
V instrumented
V ---~ V V .....".",.
V ....--
V Relationship for
V single-bolt con-
V nection with sam'e clamping force
V not available.
V S(T4)3-l V F(T4)3-l V Four bolts One bolt
r instrumented
/ ,instrumented
/ -----
~
V ..".
V -~ ~---V ,.......--
~ -- ... ----
V /
6 Failure of connection
V Tee-connection
Single-bolt
V ----Connection
I I I I I o 10 20 30 40 50 o 10 20 30 40 50 60
Applied Load per Bolt, kips
FIG. 4.16 (cont.) BOLT TENSION VERSUS APPLIED LOAD RELATIONSHIPS OF TEE-CONNECTIONS WITH A325 BOLTS
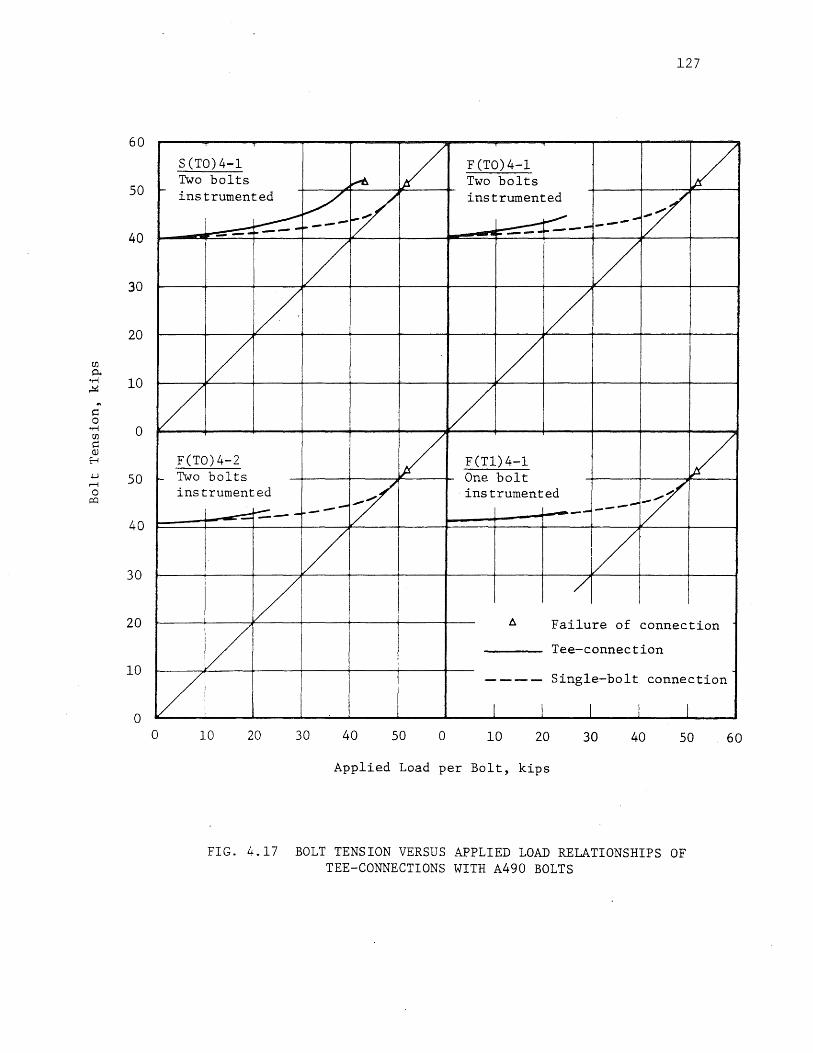
60
50
40
30
20
CJ)
0.--1""1 10 ~
... ~ 0
-1""1 0 CJ)
~ Q)
H
-+-J 50 ...-1 0
p::)
40
30
20
10
0
127
S(TO)4-l L F(TO)4-l V Two bolts ~ Two bolts !- instrumented V ~
instrumented
~ L -:~ ~ ----~--- --~~---
/ / / /
/ / V V
F(TO)4-2 V F(Tl)4-l V r- Two bolts One bolt instrumented V -instrumented -L ~~-- --- ---- -----
lL V ~
/
6- Failure of connection
V Tee-connection
Vi ---- Single-bolt connection
I 1 1 1 I o 10 20 30 40 50 o 10 20 30 40 50
Applied Load per Bolt, kips
FIG_ 4.17 BOLT TENSION VERSUS APPLIED LOAD RELATIONSHIPS OF TEE-CONNECTIONS WITH A490 BOLTS
60

60
50
40
30
20
U)
0.. .r-l 10 ~
.. ~ 0
.r-l 0 U)
~ Q)
E-t
~ 50 ,....., 0 ~
40
30
20
10
0
128
F(T2)4-l k( F(T3)4-l ~ t- One bolt One bolt instrumented ;/ instrumented / -- - p..---- ---'" ---
V V IV IV
V V V V
F(T4)4-l / F(T4)4-2 / f-Two bolts Two bolts instrumented V . instrumented V ~~--
_ ... --;'
V ----V l7 /
A Failure of connection
V Tee-connection
Single-bolt connection
V ----
I I I I I o 10 20 30 40 50 o 10 20 30 40 50
Applied Load per Bolt, kips
FIG. 4.17 (cont.) BOLT TENSION VERSUS APPLIED LOAD RELATIONSHIPS OF TEE~CONNECTIONS WITH A490 BOLTS
60

1.2
1.1
1.0
0.9
('j 0.8 -..
P-4 -...... 0' '-'"
-+: 0.7 ., ('j
p..;
+J 0.6 m 0
·ri +J m 0.5 p:::
bO C
-r1 :>,
0.4 H P-;
0.3
0.2
0.1
0.0
.....
~
~
1 2
I I I
0 Connections with A325 bolts
0 Connections with A490 bolts
* Pa is the maximum allowable load, computed neglecting prying, based on the allow-able stresses specified in reference 10
0
/ V --n-
............. to-
" ~
/ /
I
/ ~---o ~
/ ,
1// /
~/
" 1
,
/ /'
11. 2
2
...
"'-
" ,
Gage
Edge Distance, a, inches
129
\
= 4 1/2 in. -
I
3
FIG. 4.18 RELATIONSHIP BETWEEN PRYING RATIO AT LOW LOAD AND EDGE DISTANCE FOR TEE-CONNECTIONS TESTED

C1j --p.. ......... CY '-'
~ .. C1j
p..
+J C1j
0 -M +J C1j ~
co ~
01"1 ~ H p..
1.2 T T I
0 Connections with A325 bolts
1. 1-- / o Connections with A490 bolts f5
1.
O.
01- * / Pa is the maximum allowable load, computed neglecting / prying, based on the allow-
9- able stresses specified in / reference 10
O. 8 / I
O. 7 / ~-C
...-
0 ~t ]
O. 6
I 0
O. 5 /Q I /
O. / / 4
/ I
O. / 0
3 / I~
O. 2 / / , I
O. / V
1 /
Edge distance 1 3/4 = in.
b /
I I 0 O. 2 6 4 5 3
Gage, g, inches
FIG. 4.19 RELATIONSHIP BETWEEN PRYING RATIO AT LOW LOAD AND GAGE FOR TEE-CONNECTIONS TESTED
130
-
7

0.6
0.5
==' -... ~
0.4 .......... 0-~
.. Q) +J (lj
S oM +J
1'"""i 0.3 :::>
+J (lj
0 OM +J
~ bO
0.2 ~ oM >-. ~ ~
0.1
0.0
131
1 2
I I I
0 Connections with A325 bolts
o Connec t ions with A490 bolts
I
I Gage = 4 1/2 in.
."", --- §----- ---. /'
/ /[
,.... ...----~-8---
)~ t----..,,-/"
1 2
Edge Distance, a, inches
......... [ ) ...........
"- ),
21. 2
FIG. 4.20 RELATIONSHIP BETWEEN PRYING RATIO AT ULTIMATE AND EDGE DISTANCE FOR TEE-CONNECTIONS TESTED
3

132
O.6r---------~I----------~I--------~I~--------~--------~
o Connections with A325 bolts
o Connections with A490 bolts
I I O.5~-------~I-------+I--------~------~--------~
Edge distance = I 3/4 in. IV ~~ / SO. 4 t------+----+-----+-------:/;L---t-/~-___t
; / ~ ~ / ] / / ~ / / ~ O.3~--------~--------~--------~~----,+---+---------~
~ I / j / / ~ §/ / .~ O.2~--------+---------~---/~----~I~--------+---------~ ~ I
~ / / /
/ / O.l~------+-----/~~--~_r---~------~------~ e
/ / / /
O. 0 '--_ ... -..:&.-L--.....:/_=--=-=-:..a-./ ___ ~ __ --4-__ ---.d
2 3 4 5 6
Gage, g, inches
FIG. 4.21 RELATIONSHIP BETWEEN PRYING RATIO AT ULTIMATE AND GAGE FOR TEE-CONNECTIONS TESTED
7
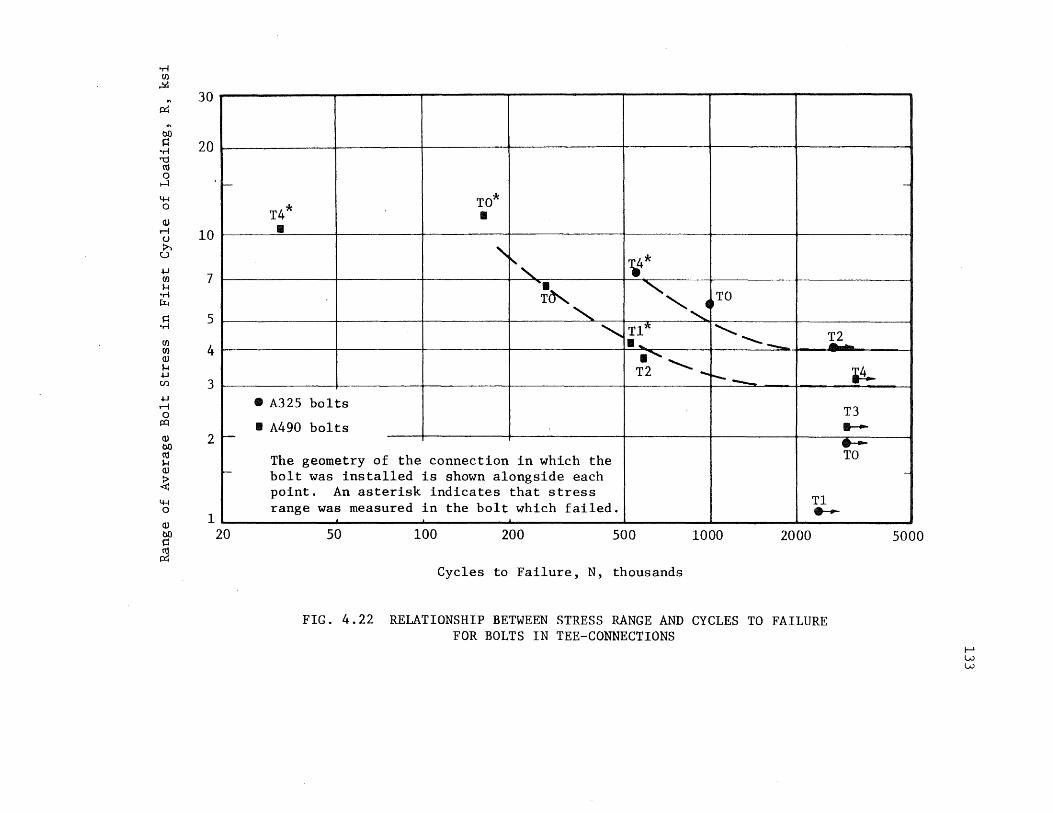
oM Ul ~
pq
bO ~ °ri '1j m o ~
4-4 o Q}
M (J
>. c..:>
.j..J
Ul H
or-\ ~
s:1 or-\
Ul Ul Q)
$..I .j..J
Cf)
.j..J
M o
pC!
30
20
r-
10
7
5
4
3
~ 2 -m H Q}
~ 4-4 o Q}
bO r:: ~
-
1 20
T4* TO*
• • , " ~* '. " T~ ,~ .TO
""-""- T1* "- ~ ..... "'---
a"" T2 .................
--- --- t-4-• A325 bolts
T3 • A490 bolts ---
The geometry of the connection in which the ~ bolt was installed is shown alongside each point. An asterisk indicates that stress
T1 range was measured in the bolt which failed. ~
50 100 200 500 1000 2000
Cycles to Failure, N, thousands
FIG. 4.22 RELATIONSHIP BETWEEN STRESS RANGE AND CYCLES TO FAILURE FOR BOLTS IN TEE-CONNECTIONS
-
-
5000
I-' W W
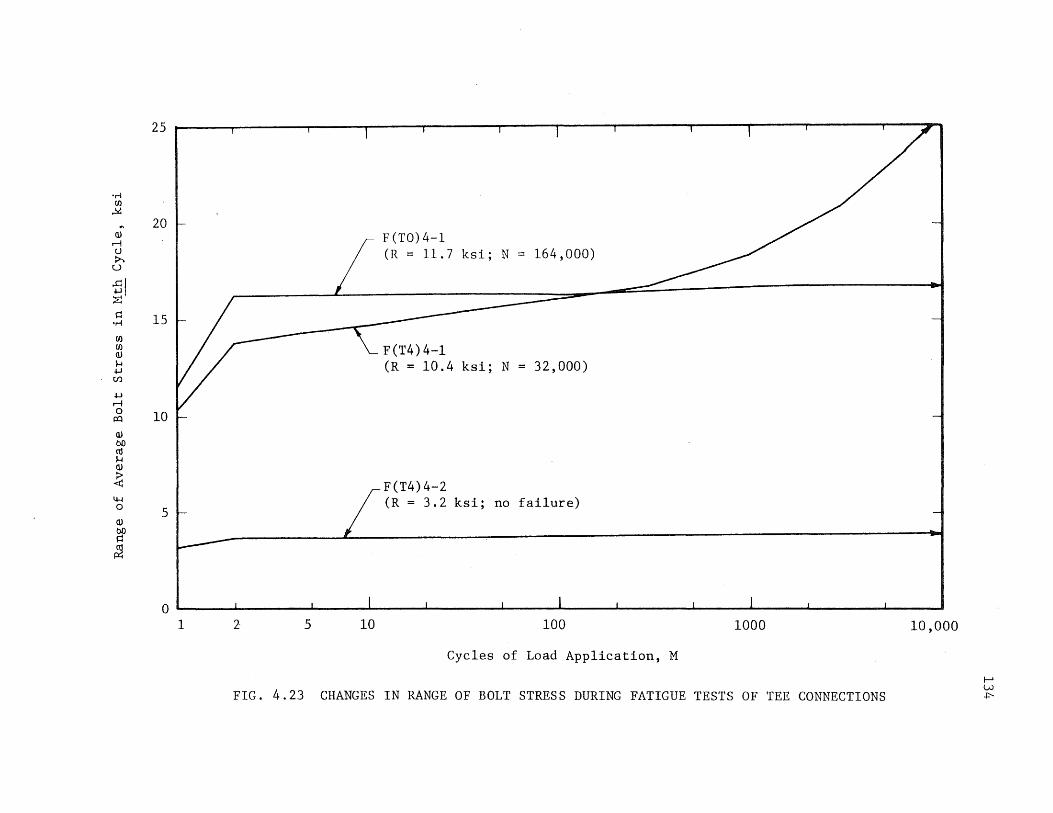
"rl (/)
~
... Q)
r-1 (j
>-u
'51 ~
Q ",.1
(/) (/) Q)
~ ~ C/)
~ r-1 0
I=Q
Q) bO m ~ Q)
~ lH 0
Q)
bO Q
~
25 • ., I
20 F(TO)4-1
~ (R = 11.7 ksi; N 164,000)
15
II / (R = 10.4 ksi; N 32,000)
10
J F(T4)4-2 ~ (R = 3.2 ksi; no failure)
o 1 2- 5 10 100 1000 10,000
Cycles of Load Application, M
FIG. 4.23 CHANGES IN RANGE OF BOLT STRESS DURING FATIGUE TESTS OF TEE CONNECTIONS I--' LV +:--
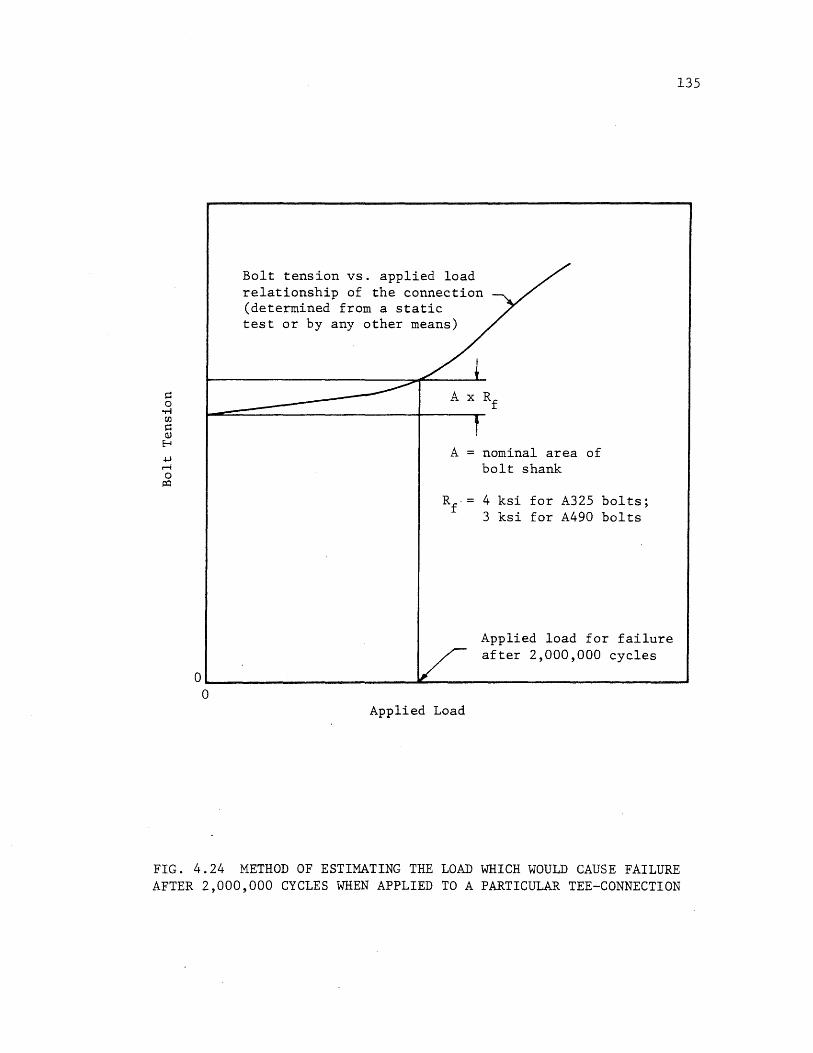
Bolt tension vs. applied load relationship of the connection (determined from a static test or by any other means)
A = nominal area of bolt shank
R· f
4 ksi for A325 bolts; 3 ksi for A490 bolts
Applied load for failure after 2,000,000 cycles
135
OL-______________________ ~ ____________________________ ~
o Applied Load
FIG. 4.24 METHOD OF ESTIMATING THE LOAD WHICH WOULD CAUSE FAILURE AFTER 2,000,000 CYCLES WHEN APPLIED TO A PARTICULAR TEE-CONNECTION
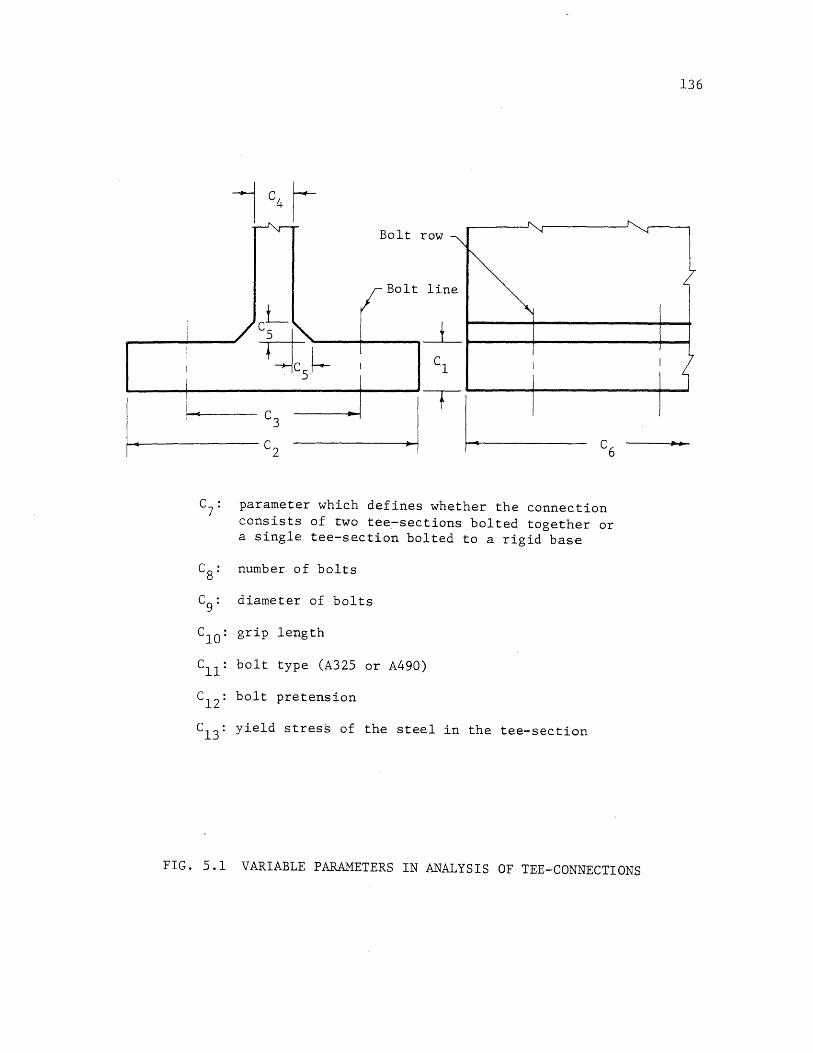
I. I~
C1O :
Cll:
C12
:
C13
:
FIG. 5.1
Bolt row
Bolt line
~ C
l
C3
.. I .ITI . C2
C6
parameter which defines whether the connection consists of two tee~sections bolted together or a single tee-section bolted to a rigid base
number of bolts
diameter of bolts
grip length
bolt type (A325 or A490)
bolt pretension
yield stress of the steel in the tee-section
VARIABLE PARAMETERS IN ANALYSIS OF TEE-CONNECTIONS
136
...
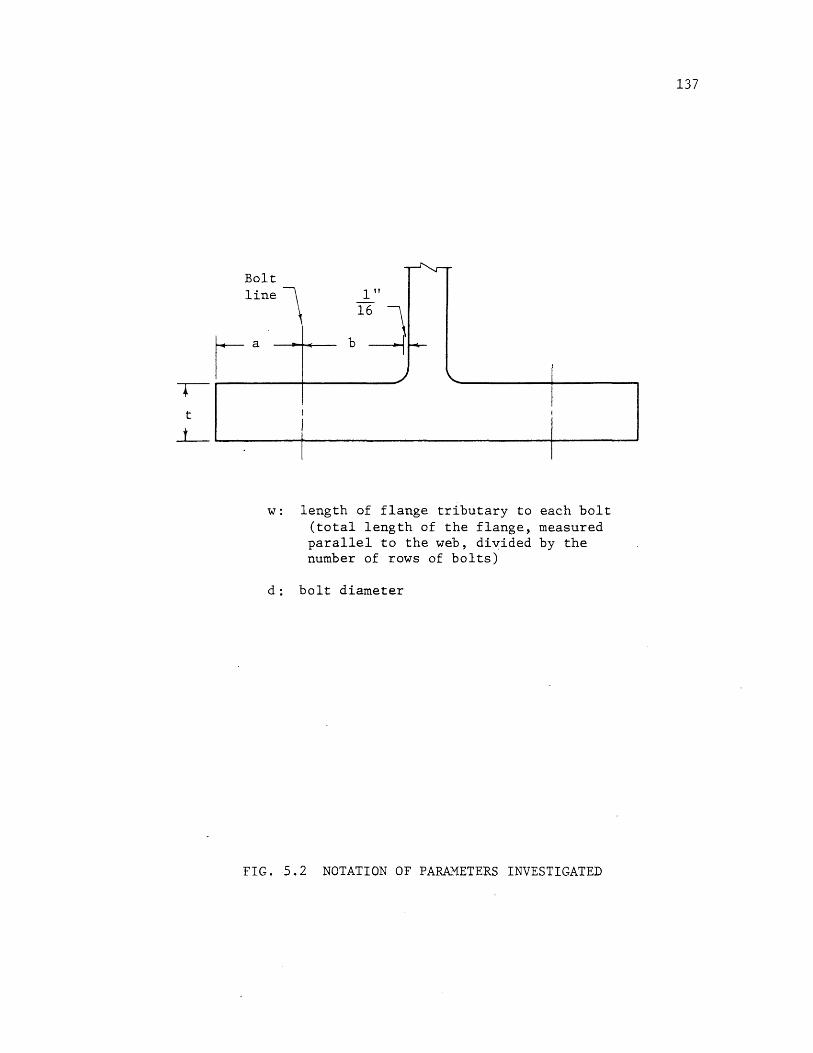
t
-L-
Bolt ~r
line \ 1"
16\ ,a b --i f-'.--"-
I I
w: length of flange tributary to each bolt (total length of the flange, measured parallel to the web, divided by the number of rows of bolts)
d: bolt diameter
FIG. 5.2 NOTATION OF PARAMETERS INVESTIGATED
137

0.6------------~--~--------r-------~
;j ,,-... P-l -...... 0' '--'
OJ ~
~
0.5
0.4 1
a = 1 3/4 in.
t = 1 1/16 in. 2 -1 wid = 6.69 in.
I
~ *, , B 0.3-~ cd
o 'M ~ cd ~
bO q 'M :>.. H
P-l
0.21 iVI /
0.11 ., /
0.0 ~ 1 2
2
It
2! 2
3
a = 2 1/2 in. 2 -1 wid = 4.01 in.
Analysis Eq. (6.6)
Eq. (6.7)
~ 2
2 21 2
/ /
3
Distance From Bolt Line to Face of Web Minus 1/16 inch, b, inches
?,-r
~
3l 2
FIG. 5.3 EFFECT OF DISTANCE FROM BOLT LINE TO FACE OF WEB ON PRYING RATIO AT ULTIMATE IN TEE-CONNECTIONS WITH A325 BOLTS
4
~ l0 00

::J ,,-.... ~
......... 0' '-'"
Q) ~ cU S
"M ~ r--t ~
~ cU
o "M ~
cU ~
bO Q
"M :>... H ~
0.6-. ------~-----r------r_----I
a = 1 3/4 in.
t = 1 1/16 in.
O 5 ~ w/.d2 = 6.69 in.-11 • .' j
0.41 II I
0.31 II I I
0.21 // I
0.1, . II r j J
1 ~ 2 2 2! 2 3
a = 2 1/2 in. 2 -1 wid = 4.01 in.
Analysis
---- Eq. (6.6)
--- Eq. (6.7)
~ 2 2
/ /
1/
:/. ~
2! 2 3
Distance From Bolt Line to Face of Web Minus 1/16 inch, b, inches
3! 2
FIG. 5.4 EFFECT OF DISTANCE FROM BOLT LINE TO FACE OF WEB ON PRYING RATIO AT ULTIMATE IN TEE-CONNECTIONS WITH A490 BOLTS
4
~ LU ~

0.6
0.5
;:::3 ,--. P-l -- 0.4 0'
... <lJ ~
Cd S
'r-! ~ 0.3 M :::> ~ Cd
0 'r-! ~ Cd 0.2 ~
bll ~
'r-! :>.. H P-l
0.1
0.0
o
b = 1 3/4 in.
t = 1 1/16 in.
w/d 2 = 6.69 in. -1
Analysis
--'-- Eq. (6.6) --- Eq. (6.7)
~~. r-. ........ ...... ~ ' ..........
~ ~--== - ..... --~
1 2 3
~ '\
b 3 1/2 in.
, \ ~ f\,
2 -1 wid 4.01 in.
t 2 in. ~ --.-"'r---... ----- -- t-=:::- - --- --~.-
4 o 1 2 3 4
Edge Distance, a, inches
FIG. 5.5 EFFECT OF EDGE DISTANCE ON PRYING RATIO AT ULTIMATE IN TEE-CONNECTIONS WITH A325 BOLTS
5
I-' +:-o
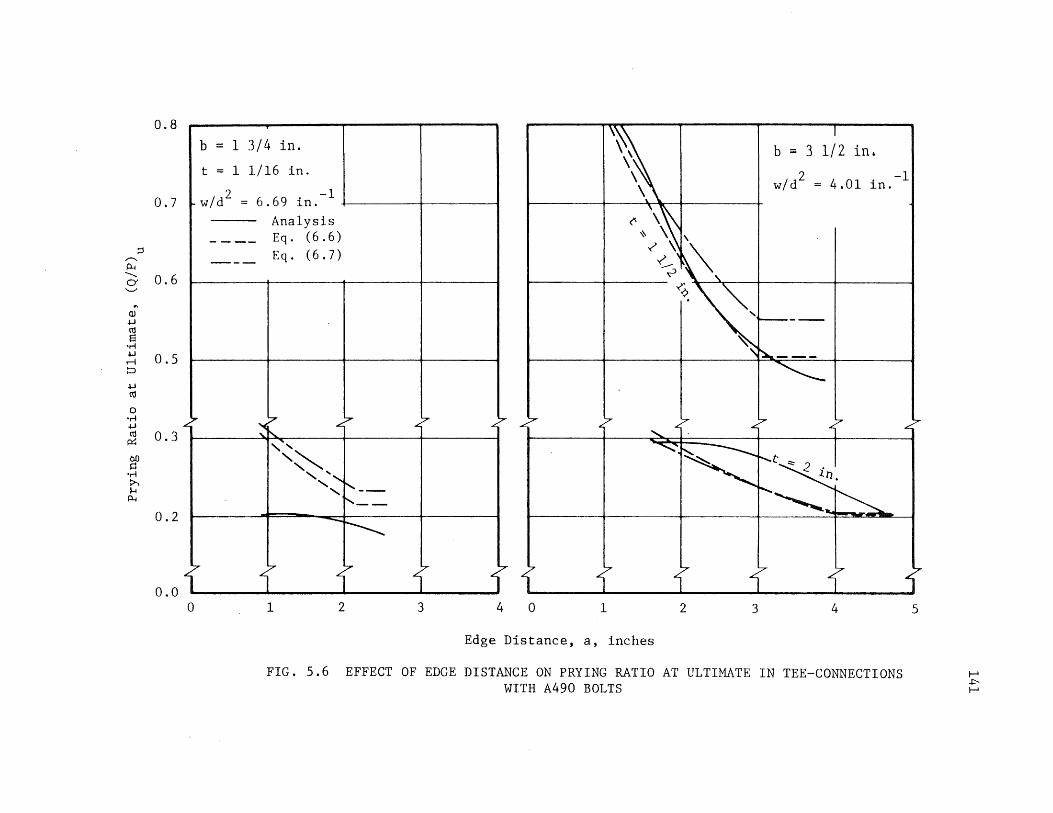
0.8
0.7
;:1 ,,-... ~
........... 0.6 CY ......."
... (l) .w rd S
or-! .w 0.5 r--l P .w rd
0 or-! .w rd 0.3 p:::
bJ) s::
or-! >. H ~
0.2
0.0
b = 1 3/4 in. b = 3 1/2 in. t = 1 1/16 in.
2 -1 wid = 6.69 in.
2 -1 wid = 4.01 in.
Analysis ---- Eq. (6.6)
--- Eq. (6. 7)
~
~ <If!:.
7' L. L.
"-,', ,~
" " ...... '--...... t'--- _
--....;;;
~
~ { { { i 1 o 1 2 3 4 0 1 2 3 4
Edge Distance, a, inches
FIG. 5.6 EFFECT OF EDGE DISTANCE ON PRYING RATIO AT ULTIMATE IN TEE-CONNECTIONS WITH A490 BOLTS
5
I--' +:-I--'

::l ,....... P-l
........... 0' '-"
... Q)
.w m S
or-f .w r-I P .w m 0
or-f .w m ~
bO r.:l
or-f ~ H
P-l
0.6
0.5
0.4
0.3
0.2
0.1
0.0 5
8 3 7;
\
a = 1 5/8 in. a = 2 1/2 in.
b = 1 3/4 . 1n. 2 -1 wid = 4.01 in.
\ w/d 2 = 6.69 in.-1
• Analysis Eq. (6.6)
\ \ Eq. (6.7)
7 "8
, " " " ,
1
•
I! II 8 2
1~ 8
Flange Thickness, t, inches
12 4
'" "
FIG. 5.7 EFFECT OF FLANGE THICKNESS ON PRYING RATIO AT ULTIMATE IN TEE-CONNECTIONS WITH A325 BOLTS
2 21: 8
I--' +:-N
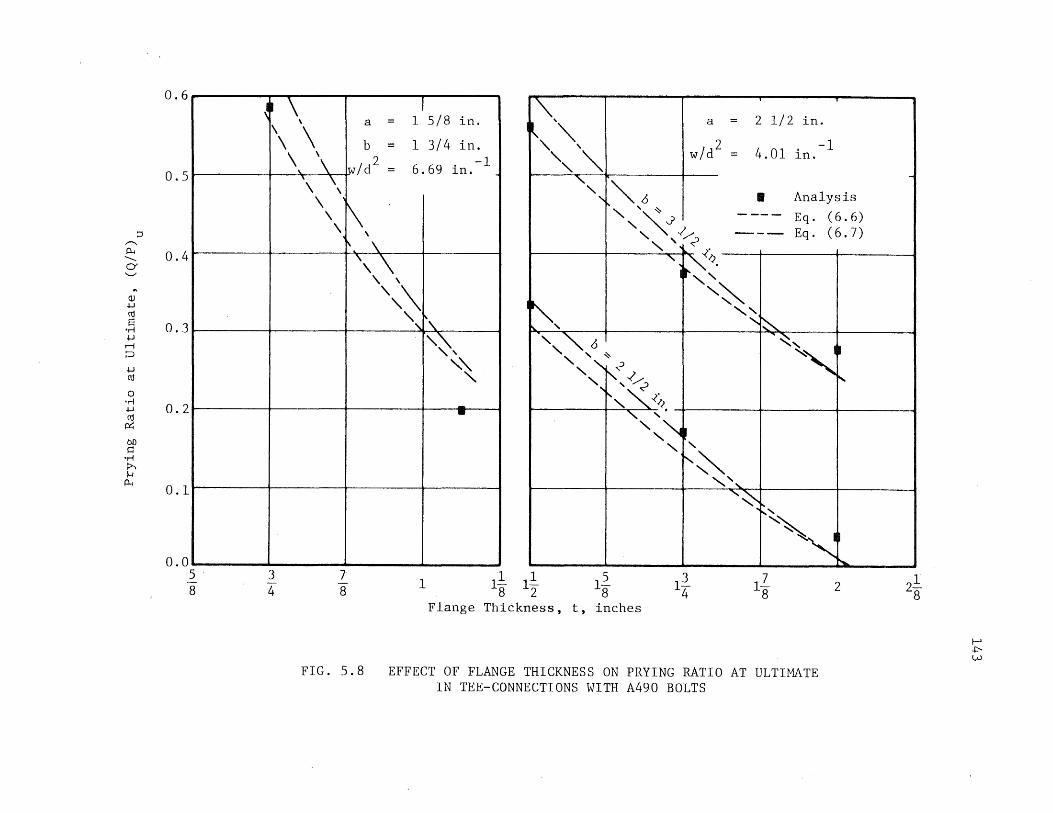
0.6
0.5
;j ",--.
P-I 0.4 '-.. CY '-"
ClJ ~
Ctl s 0.3 ',...j ~ rl 0
~ Ctl
0 ',...j
0.2 ~
Ctl rY:
bO r::
',...j
~ H
P-I 0.1
~I \ \ a
\ \ \ b
I = 1 5/8 in.
=
~, ~" "'-,
a 2 1/2 in.
1 3/4 in. \ \ 2 -1
.. \ lYl/d = 6.69 in. " " w/d2 = 4,01 -1
in.
3 4
, \-\ \
\ \ \ 1\ \
f\
7 8
\
", \
,
"-, 1"'6 i '~~
" ...J , -1/
• Analysis
Eq. (6.6) Eq. (6. 7)
\
',\
,,~t0¢.
'~~ '" ~, " ", ,~\ ,,"
" •
1 Il 11: 8 2
"" 6 ''''''~~ < "" , -1/< ,,'- -('
12 8
" " l)
Flange Thickness, t, inches
12 4
~
~""l
~~,
'~ 12
8 2
FIG. 5.8 EFFECT OF FLANGE THICKNESS ON PRYING RATIO AT ULTIMATE IN TEE-CONNECTIONS WITH A490 BOLTS
-
2! 8
f-J ~ w

;j r--.. P-l --.. CY '-'
., (l)
oW ttl S
'M oW .-; p
oW ttl
0 'M oW ttl ~
bO ~
'M ~ H P-l
0.6
\ , 0.5 \
, \
~ , " 0.4
0.3
0.2
0.1 a =
b = t =
0.0 6"
\ , ~
r\ ~ ,
',,'\ '-' ,,\
" ..
~\ "\ e \,
.,
e
l' ,,~,
\' ',', ,
" e
1 5/8 in. a = 1 3/4 in. a
1 3/4 in. b = 2 5/8 in. b
3/4 in. t = 1 1/16 in. t L .. ____ -------------'-_
8 10 6 8 10 2
Flange Length Tributary to Each Bolt Square of Bolt Diameter
I
e Analysis
--- Eq. (6.6)
, --- Eq. (6.7)
~\
\ t~ \
'\ \~ \\
\ "
~ \' f\ \ \.
f\ ' ,\ \e\
\ \ \ '\
, "-= 2 1/2 in. \ ~
\ ,
= 3 1/2 in. \ " = 1 1/2 in. \
4 6 8
"W 2 ' inches-
1
d
FIG. 5.9 EFFECT OF FLANGE LENGTH AND BOLT DIAMETER ON PRYING RATIO AT ULTIMATE IN TEE-CONNECTIONS WITH A325 BOLTS
-
" "" 10
!-I +:-+:--

;j ,-..... ~
............. 0.4 0' ........,
... (J) oW til S
'M oW 0.3 ,..; p
oW til
0 . 'M
oW 0.2 til ~
0.6 ~ \,
'\ \ '\ ,
" \ " ,\
" ,\ " ~
I
\ '\~\
.'\ , ~
I\'\. ",\
\'\ , , \..,
"
II
~ II Analyses \
~ \ \, - - - Eq. ( 6 . 6 ) \ ~--- Eq. (6.7) -\\
\ '~
~ \ \\~
\\ ,\ \\
\\, \ p..
\
0.5
bO P
'r-! ~
\\\ 1-l ~
0.1 a = b =
t = 0.0 6,
1 5/8 in. a = 1 3/4 in. a
1 3/4 in. b = 2 5/8 in. b
3/4 in. t = 1 1/16 in. t -
8 10 6 8 10 2
Flange Length Tributary to Each Bolt Square of Bolt Diameter
= 2 1/2 in.
= 3 1/2 in.
= 1 1/2 in.
4 6 8
w d 2 ' inches-
1
FIG. 5.10 EFFECT OF FLANGE LENGTH AND BOLT DIAMETER ON PRYING RATIO AT ULTIMATE IN TEE-CONNECTIONS WITH A490 BOLTS
'\.\~ I , "'
'" " 10
I--' -l>VI
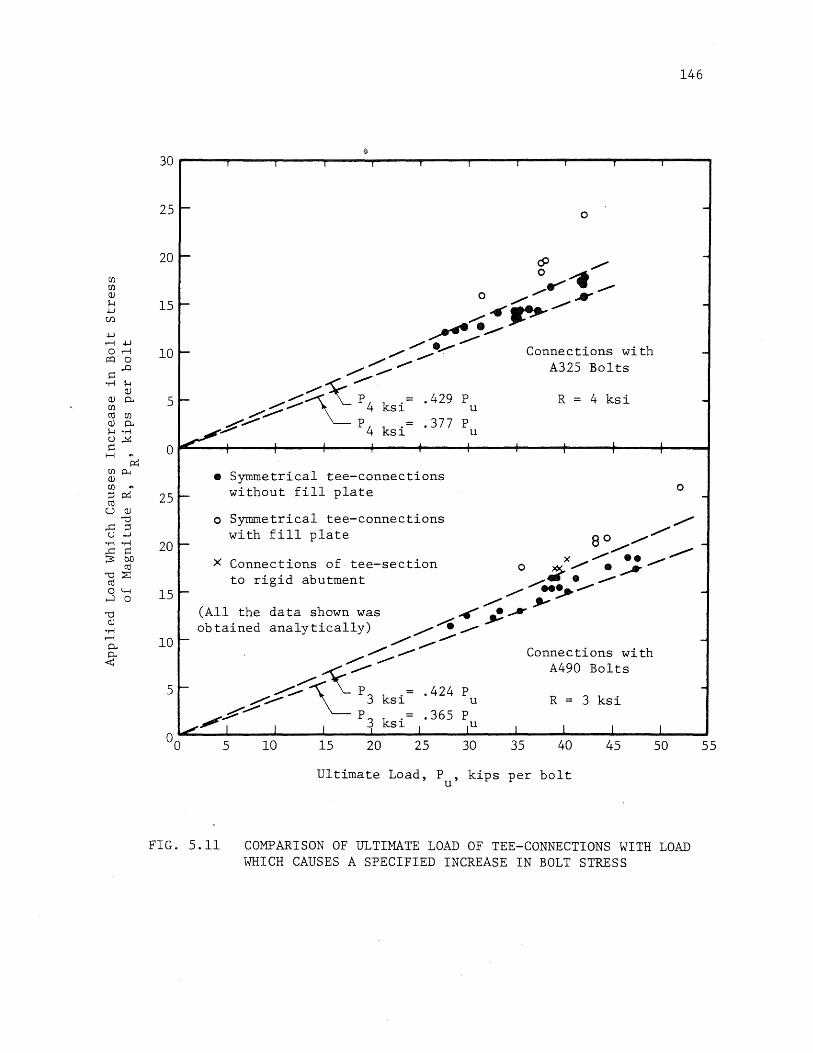
CI.l CI.l Cl)
H +J Cf)
+J rl+J Orl
r:Q 0 ..0 :::
-ri H Cl)
Cl) P. CI.l cU CI.l Cl) P. H 'ri CJ~ ::: H '"
p::; CI.l~ Cl) CI.l .. ;:jp::; cU
U Cl) "'0
,..c: ;:j CJ +J ·ri ·ri ,..c: ::: ~ bO
cU "d::E
cU 04-4 H 0
"d Cl)
-ri rl P. P. <
146
30F-----~,----~,------~,----~,----~,----~,~----~,----~,----~,~----r-,----,
25 ~ o
20 - c9 ",..
O ...... 't ~ o ",../ ......
/ . ..,.,~ ~"..., . .......-'
,.., ~.~ Connections with
15 t-
10 t-",.. ~" A325 Bolts
5 >- ----;::~~;4 k· .429 P R = 4 ksi "",,,..., L Sl U
£~ P4
.377 P ~..;;;-' ksi U
o I 1
25 -
• Symmetrical tee-connections without fill plate
. I I I
-
-
-
-
-
,
o -
20 -
o Symmetrical tee-connections with fill plate
".,... ./
8 0 "", -
x "",~. ~ x Connections of tee-section to rigid abutment
o ~",.. ......... ~ /. . ,..,.,
",.. .. ~~ ,,/" ".
(All the data shown was ~ • ...AI" obtained analytically) ./ ...... ,.- ,...
15 ~
10 ~ ./~.,.,,~ ",.. ,..,.,
,....-:~"..., -
Connections with A490 Bolts
5r- ".,...~ \2: P3 k .- .424 P /",- Sl U R = 3 ksi
~~ p.= .365 P ~, 1 I I ~ kSl I IU I I
00 5 10 15 20 25 30 40 35
Ultimate Load, P , kips per bolt U
I
45 1
50
FIG. 5.11 COMPARISON OF ULTIMATE LOAD OF TEE-CONNECTIONS WITH LOAD WHICH CAUSES A SPECIFIED INCREASE IN BOLT STRESS
-
-
-
55

y
1
Beam with depth t; width w
T T
~ ____________________ ~~ ____________________ ~ ----- x
~ IQ I
L
Alternative conditions studied:
(a) Elastic beam; bolt elongation = 2y x=b
(b) Plastic hinge in beam at x=O
Q t I I ~
FIG. 6.1 MODEL FOR COMPUTATION OF APPROXIMATE PRYING ACTION RELATIONSHIPS
147

148
1.0
• Analyses, A325 bolts
0 Tests, A325 bolts
I Analyses, A490 bolts
0 Tests, A490 bolts
0.8
0.6 ~----------~----------~--------~~--------~~--------~
0.4~----------~--------~~--------~----------~----------~
0.2 ~------~--~~~------~--------~~--------~----------~
o
o o
O.O .. ~ ______ ~ __________ ~ ________ ~~ ________ ~ ________ ~
0.0 0.2 0.4 0.6 0.8 1.0
Prying Ratio 'at Ultimate, (Q/P) , Computed Using Eq. (6.6) u
FIG. 6.2 COMPARISON OF VALUES OF PRYING RATIO AT ULTIMATE OBTAINED FROM TESTS AND ANALYSES WITH THOSE COMPUTED USING EQUATION (6.6)
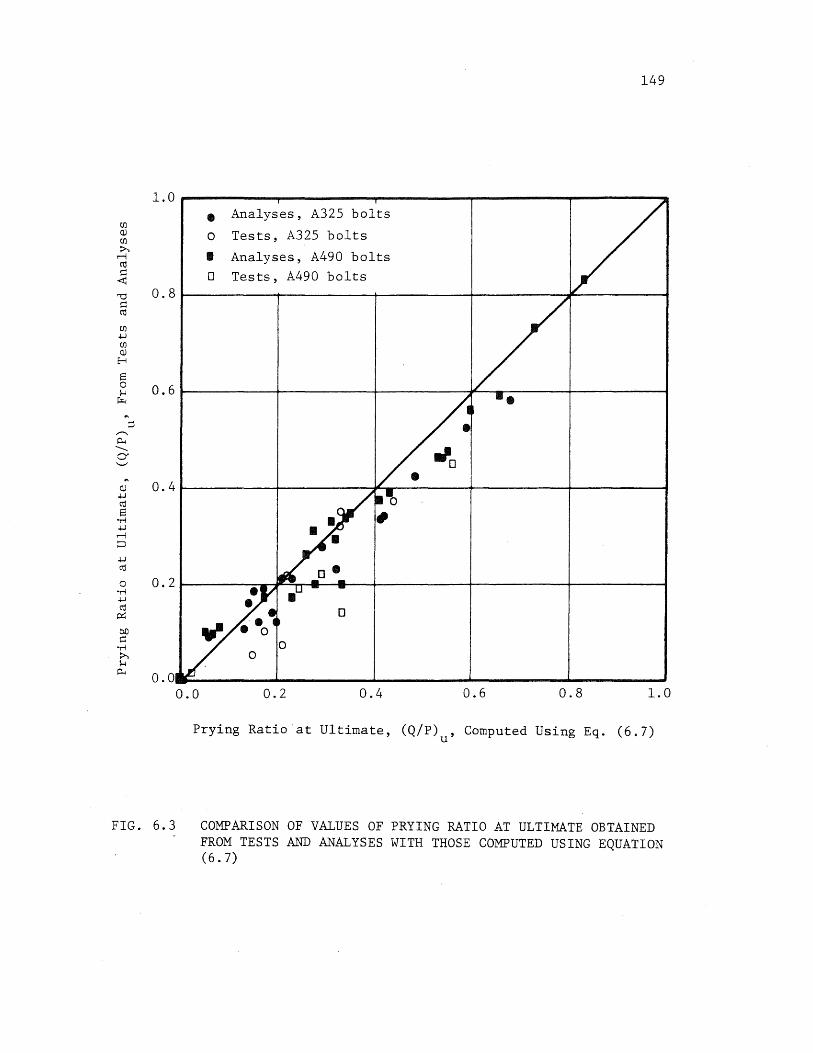
149
1.0
• Analyses, A325 bolts
0 Tests, A325 bolts
I Analyses, A490 bolts 0 Tests, A490 bolts
0.8
0.6~--------~----------~--------~-'r-------r---------,
'" ~ 0.4~----------~--------~~r-------~----------~r---------~
,j..J
cO S
"ri ,j..J ,....., ;:J
,j..J
cO
o "ri ,j..J
cO ~
0.2~------~~~~~~-+----------r---------~---------;
o
o o
O.O~~ ______ ~ ________ ~ __________ ~ ________ ~ ________ __
0.0 0.2 0.4 0.6 0.8 1.0
Prying Ratio 'at Ultimate, (Q/P) , Computed Using Eq. (6.7) u
FIG. 6.3 COMPARISON OF VALUES OF PRYING RATIO AT ULTIMATE OBTAINED FROM TESTS AND ANALYSES WITH THOSE COMPUTED USING EQUATION (6. 7)
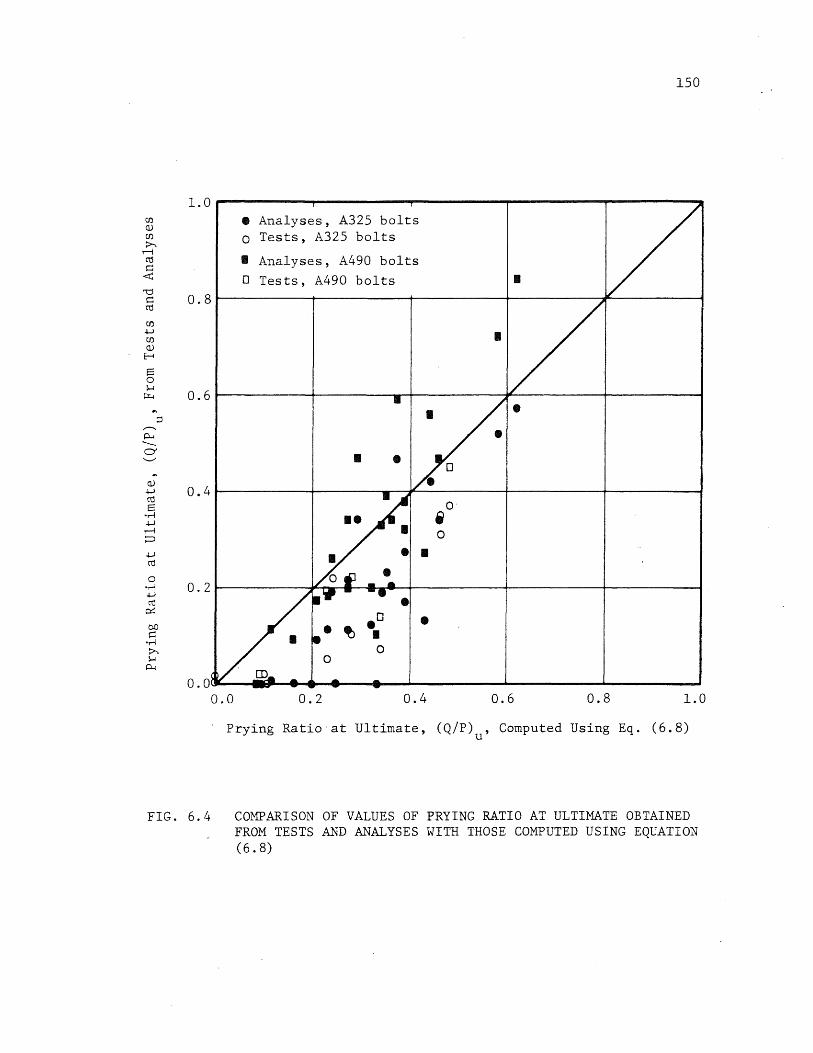
1.0
0.8
0.6
0.4
0.2
0.0
FIG. 6.4
150
• Analyses, A325 bolts 0 Tests, A325 bolts
I Analyses, A490 bolts 0 Tests, A490 bolts I
I
• I •
0 i 0
•
.0 • ~ I 0
0
0.0 0.2 0.4 0.6 0.8 1.0
Prying Ratio 'at Ultimate, (Q/P)u' Computed Using Eq. (6.8)
COMPARISON OF VALUES OF PRYING RATIO AT ULTIMATE OBTAINED FROM TESTS AND ANALYSES WITH THOSE COMPUTED USING EQUATION (6.8)

1.0
C/)
Cl.l C/)
~ r-i cU C
<:t:
'"0 0.8 c cU
C/)
+.J C/)
Cl.l H
S 0 0.6 H ~
.... ::l
---P-l ........... 0-'-"
.... 0.4 Cl.l +.J cU S 'r! .j..J
r-i 0 .j..J
cU
0 0.2 'r! .j..J
cU p::;
bD C
'r! ~ H P-l 0.0
0.0
FIG. 6.S
151
.. Analyses, A325 bolts 0 Tests, A325 bolts I Analyses, A490 bolts 0 Tests, A490 bolts
I
I I
.. I • •
I 0
• • .. 0
I
• • • 0
~ • 0
0 CD
0.2 0.4 0.6 0.8 1.0
Prying Ratio at Ultimate, (Q/P)u' Computed Using Eq. (6.9)
COMPARISON OF VALUES OF PRYING RATIO AT ULTIMATE OBTAINED FROM TESTS AND ANALYSES WITH THOSE COMPUTED USING EQUATION (6.9)

(a)
(b)
y
center line of tee-section
CI)
H
~ T ~ 0 o ~
co C
'r-! ~ 0..
CI)
r-1 C\l .w
~ 0
o
Average Spring Deformation, /::, s
/::, u
FIG. A.I IDEALIZED REPRESENTATION OF TEE-CONNECTION
152
x

FIG. A.2
D. , 1
i=l, 2, .. , nc
STRUCTURE WITH MODIFIED BOUNDARY CONDITIONS
153
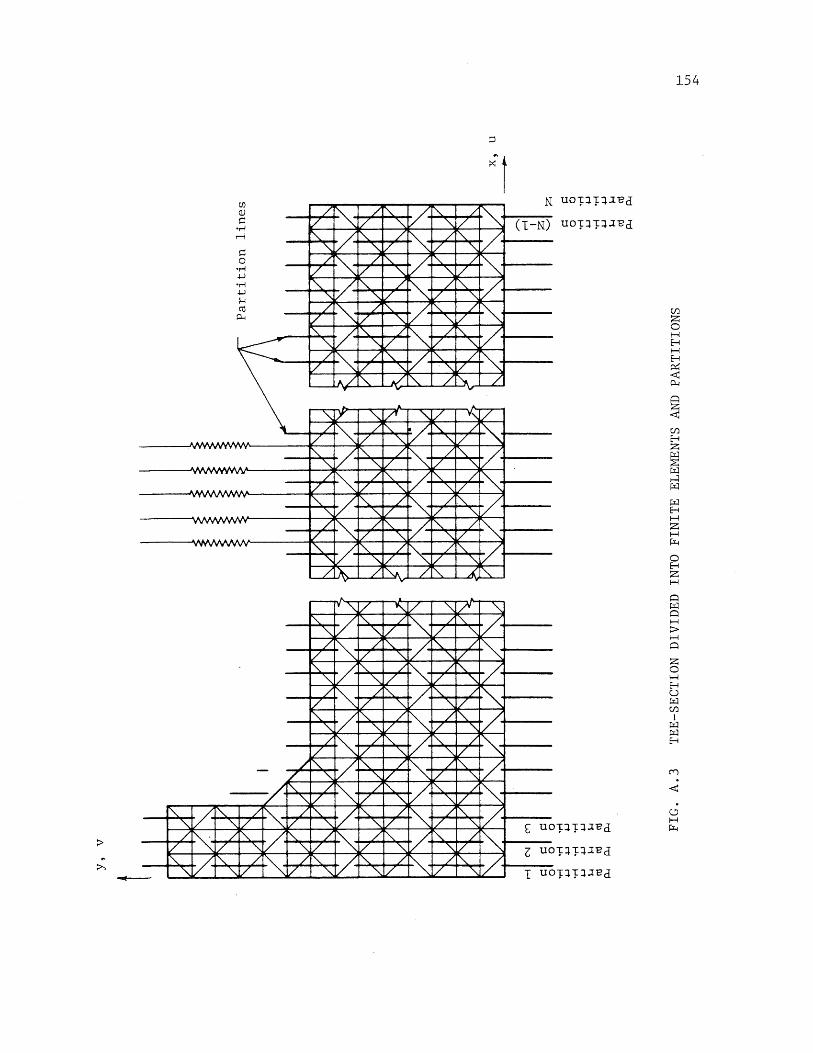
(/) (l)
P °H H
p 0
°H +oJ °H oW l--4 m
0...
A • AA .... A ,y 'yYYI ••
. A . A .A'" .Ie y 'Y ••• v.
A A .......... "V VY
A YVY'VYYV'IY
...... A ... .... VYyV'VV
-
--/ "" Vf". /~ ''\ "'1/
/ ~ / ~ V V 1/ " ['\.. V ~ / ~ '\ " V
/ ~ / r'\.. V ~ / ~ v [7
"'" " [7 r'\. V "" / ~ / r'\.. V S "\ V V '" / ~ 7 !"\:: V I'-. / ~ V V " " f7 [\" V f'... / ~ / f'... V '\ "-V V "-
/ .", / "' V "" 7 ~ V / "- '" V ['. V '\.. /
~ / "'- V ~ "-V V '\
/ ~ / " V ['\.. / ~ V V "- .'\.. V A/ ~ J i'-. /~ L.L
.... ...
- .. v~r7 '" lY '" V' "-V
/ ~ / '" V ["'\. / P'\ [7 [7
"'" " V ~ V f'... / ~ / ['\.. V " " V V '" / ~ / I'-.. V "" / ~ [7 V '\. '" V "- V " / ~ / ~ V '\.. '" V V " / ~ / f'\... v- f'-. / ~ V [7 " "-V C\:. V ~ / l'.. / f'\... P " " V " V " LL~ /'vo /""- -=\~
"
rv",,-V "V ,,[/--S '" VI' /~ /'\.. v-
" '\[7 / '\ / ~ / ['\..
~/ ~ / ~ [7 i/ "- '" IV !"\:: r/ '" / ~ / f'\... ~/ '" " / V '" / ~ / ~ V f'\... / ~ [7 / "- '" 1/ f'\. V ['\.. / ~ / f'-. ~/ '" "-17 IV " / ~ / r'\: V '" -;
~ V V " "-17 / f'\. V " / ~ / ~ ./ / '\ " V V " " / ~
/ ['\.. V '" / ~ "'-V V '" '" / / ['\.. V "" / ~ ;; ""'- t/ V '" '" 17 1/ '" '" / ~ / ~ V '" / ~ " V V " '" V
/ "" V :" / ~ / f'\... -/ [7 " " r7 V ~
(1-N)
( uo
Z uo
1 uo
1=:n:=l.lB d
1==l1==l.lBd
154
Cf.l H :z;
~ r::t:l H r::t:l
r::t:l H H :z; H Pt-l
o H :z; H
q r::t:l q H :> H q
:z; o H H U r::t:l Cf.l I
r::t:l r::t:l H
. <

155
I .... a ~ ~ a -I
T 2 4 2 4
Ci:l
1 1 3 1 3
Type I Type II
2 Y, v r
Ci:l
1 3 X, u Type III
Thickness of element t
FIG. A.4 ELEMENTS USED IN THE ANALYSIS

(a) Original Structure (Structure I)
Reactions: {FB}
Stresses: {ST}
:5 c
Spring forces:
156
{t } s
Spring deformations: {c5 } s
Reactions: {FA}; displacements: {UA}
(b) Modified Structure (Structure- II)
Reactions: {FB}
Forces: FD{l} nc
Stresses: {ST}
Spring forces: {FC}
Spring deformations: {DC}
Forces: {FA}; displacements: {UA}
FIG. A.5 FORCES AND DEFORMATIONS IN ORIGINAL AND MODIFIED STRUCTURES