behavior of biological and aqueous systems at low temperature
TRANSCRIPT

BEHAVIOR OF BIOLOGICAL AND AQUEOUS SYSTEMS AT LOW
TEMPERATURE
A Dissertation
Presented to the Faculty of the Graduate School
of Cornell University
In Partial Fulfillment of the Requirements for the Degree of
Doctor of Philosophy
by
Matthew Adam Warkentin
February 2010

© 2010 Matthew Adam Warkentin

BEHAVIOR OF BIOLOGICAL AND AQUEOUS SYSTEMS AT LOW
TEMPERATURE
Matthew Adam Warkentin, Ph. D.
Cornell University 2010
The fields of protein crystallography, cryo-electron microscopy and cryopreservation
require that aqueous biological samples or aqueous solutions be cooled to very low
temperatures. The outcomes of experiments in those fields also depend on the
behavior of the water contained in such samples. This makes understanding that
behavior central to such experiments, even if that understanding is not the aim of the
research. In particular, samples often must be cooled so that the water is in a
metastable amorphous state, i.e. so that no crystalline ice forms.
This dissertation covers topics ranging from the very practical matter of how this
metastable state can be achieved and maintained to more fundamental questions
surrounding its formation. A cheap and simple method by which tiny samples can be
cooled at very high rates is demonstrated, which will allow cooling at rates previously
requiring expensive and complicated apparatus. The relationship between the cooling
rate required to produce an amorphous sample and the amount of solute in the sample
is demonstrated to be a simple exponential, which may indicate the fundamental
mechanism by which ice forms from supercooled solution. Finally, the radiation
sensitivity of protein crystals is shown to be linked with the diffusive motions of the
supercooled solvent within them: radiation sensitivity is suppressed by lowering the
temperature because diffusive motion is also suppressed.

BIOGRAPHICAL SKETCH
Matthew was born in Portland, Oregon in 1982. He attended Banks High School in
Banks, Oregon and developed an interest in physics outside of school. He attended
the University of California at Santa Cruz, earning a degree in Physics. His
undergraduate thesis project there involved the analysis and interpretation of EXAFS
data, which impressed upon him the tremendous power of synchrotron X-rays as a tool
to understand the world. In August of 2004 he entered the graduate program in
physics at Cornell University with the intention of doing experimental research using
the synchrotron at Cornell. In June of 2005 he began his research in the group of
Robert Thorne, with this dissertation as one result.
iii

ACKNOWLEDGMENTS
I would like to thank the professors that I learned so much from during my undergrad.
In particular: Zach Schlesinger, Josh Deutsch, Onuttom Narayan, and Frank “Bud”
Bridges. These people taught me how to think about physics problems, and, in the
case of Bud, how to think about research.
I must also thank the people in my life who have provided the essential emotional
support that any normal human needs: My family, and my housemates in Ithaca. In
particular I need to thank Ryan Shannon for making me lunch every day.
I want to express my gratitude for having had Rob Thorne as an advisor. He has given
me just the right amount of guidance and encouragement as I pursued my research
projects.
I will acknowledge financial support from the physics department at Cornell, the
Department of Education, the National Institutes of Health, and the Cornell High
Energy Synchrotron Source (CHESS, and MacCHESS).
iv
v
TABLE OF CONTENTS
BIOGRAPHICAL SKETCH iii
ACKNOWLEDGEMENTS iv
TABLE OF CONTENTS v
LIST OF FIGURES ix
1 INTRODUCTION 1
REFERENCES 10
2 HYPERQUENCHING FOR PROTEIN CRYSTALLOGRAPHY 12
2.1 Introduction 12
2.2 Methods and Results 14
2.2.1 Plunge cooling of small volumes: A puzzle 14
2.2.2 The cold gas layer: Temperature versus height 16
2.2.3 Plunging through cold gas 19
2.2.4 Removing the cold gas layer 21
2.2.5 Cooling rates with cold gas layer removal 23
2.2.6 Tiny cryoprotectant concentrations for tiny samples 25
2.3 Discussion 28
2.3.1 Two limiting approaches to cryopreservation 28
2.3.2 Cold gas layer removal as a route to hyperquenching 29
2.3.3 Puzzles resolved 29
2.3.4 Implications for macromolecular crystallography 30
2.4 Conclusion 31
REFERENCES 32
3 Schlieren imaging of a cold gas stream for cryocrystallography 35
3.1 Introduction 35

3.2 Experiment 36
3.2.1 Imaging 37
3.2.2 Thermal histories 39
3.2.3 Images 41
3.2.4 Annealing during mounting 44
3.2.5 Improved method using liquid nitrogen stream wetted to the base 44
3.3 Discussion 47
3.3.1 Sample size determines thermal response time 48
3.3.2 Comparison to previous work 50
3.3.3 Effect of reducing sample size 51
3.4 Conclusions 52
REFERENCES 53
4 CRYOCRYSTALLOGRAPHY IN CAPILLARIES: CRITICAL GLYCEROL
CONCENTRATIONS AND COOLING RATES 55
4.1 Introduction 55
4.2 Materials and Methods 58
4.2.1 Critical concentration measurements 58
4.2.2 Cooling rate measurements 60
4.3 Results 62
4.3.1 Estimation of cooling rates 62
4.3.2 Comparison to previous work 66
4.4 Discussion 67
4.4.1 Implications for cryocrystallography in capillaries 67
4.4.2 Critical Cooling Rate vs. Glycerol Concentration 69
4.5 Conclusion 73
REFERENCES 74
vi

5 CRITICAL DROPLET THEORY FOR NUCLEATION OF CUBIC ICE IN
AQUEOUS SOLTUTIONS 78
5.1 Introduction 78
5.2 Experimental Methods 81
5.3 Discussion 82
5.3.1 Nucleation vs. growth 84
5.3.2 Critical droplet theory 85
5.3.3 Modifications to the simple theory 88
5.3.4 Comparison to previous work 90
5.4 Conclusion 91
REFERENCES 95
6 SLOW COOLING OF PROTEIN CRYSTALS 97
6.1 Introduction 97
6.2 Methods 100
6.3 Results 106
6.4 Discussion 108
6.4.1 Slow cooling gives high diffraction quality 108
6.4.2 How much ice is present in slow-cooled crystals? 113
6.4.3 Why can crystals be slow cooled without cryoprotectants? 115
6.4.4 Origins of disorder on cooling 116
6.4.5 Comparison to previous work 119
6.4.6 A generally applicable method? 121
6.5 Conclusion 122
REFERENCES 124
7 TEMPERATURE DEPENDENCE OF X-RAY RADIATION DAMAGE TO
PROTEIN CRYSTALS: ACTIVATION ENERGY OF SECONDARY DAMAGE 129
vii

7.1 Introduction 129
7.2 Methods 133
7.2.1 Crystallization 133
7.2.2 Glycerol Soaks 134
7.2.3 Crystal mounting 135
7.2.4 X-ray diffraction experiments 136
7.2.5 Data processing 136
7.3 Results 137
7.4 Discussion 143
7.4.1 The glass transition in radiation sensitivity 143
7.4.2 The character of global damage is temperature-independent 146
7.4.3 Comparison to previous work 148
7.5 Conclusion 150
REFERENCES 152
APPENDIX A 156
A.1 Introduction 156
A.2 Manuscript 156
REFERENCES 166
viii

ix
LIST OF FIGURES
2.1 Minimum glycerol concentrations for vitrification of drops of different sizes 17
2.2 Gas temperature above liquid nitrogen in a dewar 20
2.3 Temperature during conventional plunge cooling 22
2.4 Temperature during plunge cooling with gas layer removal 26
2.5 Minimum glycerol concentrations with gas layer removal 27
3.1 Cryostream schematic 38
3.2 Schlieren imaging setup 40
3.3 Schlieren images of operating cryostream 42
3.4 Schlieren images of sample mounting 43
3.5a Typical thermal history of sample during mounting 45
3.5b Worst-case thermal history of sample during mounting 46
3.6 Mounting method to eliminate unintentional annealing 49
4.1 Minimum glycerol concentrations in different sizes of tubing 61
4.2 Temperatures during plunge cooling of tubes 64
4.3 Cooling rates during plunge cooling of tubes 65
4.4 Critical cooling rate versus glycerol concentration 72
5.1 Critical cooling rate versus solute concentration for different solutes 83
5.2 Predicted nucleation radius versus solute radius 87
5.3 Dynamical phase diagram of water-glycerol solutions 92
5.4 Comparison between experimental data and the model of Lu & Liu 93
6.1 Removal of mother liquor from a thaumatin crystal 102
6.2 Thaumatin crystal before and after slow cooling 104
6.3 Diffraction of thaumatin during slow cooling 109
6.4 Unit-cell, mosaicity, and B-factor of thaumatin during slow cooling 110

6.5 X-ray diffuse scatter from thaumatin during slow cooling 111
6.6 Unit cell anisotropy of thaumatin crystals during slow cooling 118
7.1 Representative dose curves from thaumatin at different temperatures 138
7.2a Coefficient of sensitivity versus temperature for trypsin 139
7.2a Coefficient of sensitivity versus temperature for lysozyme 140
7.2a Coefficient of sensitivity versus temperature for thaumatin 141
7.3 Coefficient of sensitivity versus temperature for thaumatin 145
7.4 Correlation between coefficient of sensitivity and half-dose 147
A.1 Phase diagram of supercooled water near the theorized critical point 162
A.2 Unit cell volume of lysozyme and trypsin crystals on cooling 163
A.3 Phase transition in lysozyme and trypsin crystals on cooling 164
x

1
CHAPTER 1
INTRODUCTION
Water is an unusual substance in many respects. It is ubiquitous on earth and in many
astrophysical objects. The molecule itself has a simple structure. It is of course
essential for life. For these and other reasons it ranks among the most studied of all
substances, and as a result it is very well understood. It serves as the canonical
example for countless phenomena, at all stages of our education, including heat
capacities and latent heats, surface tension, phase transformations, and “the three
phases of matter”. One phenomenon for which it is not particularly known is glass
formation. This is because it is a poor glass former.
Water is a poor glass former in two senses of the phrase. Literally, it is a poor glass
former because it requires a comparatively large cooling rate to avoid crystallization.
But it is also a poor glass former because it is a poorly understood glass former. It
doesn’t seem to follow the same rules as most other glass forming substances, and so
the lessons from the study of other glasses don’t always apply to water. There is every
reason to understand it, though, because the glassy behavior of water is important to
many diverse fields.
Cryo-electron microscopy, macromolecular crystallography, and cryopreservation all
rely on the glassy (or amorphous) state of water. The goal of a particular study might
be to determine the structure of a protein or virus, understand how misfolded proteins
cause disease, or even to produce a panda from frozen semen, but the glassy state of
water will be important in every case. This is because the transformation to the
crystalline state of water is discontinuous, and often distorts the data to the point of

irrelevance or else prevents data collection altogether. In the case of cryopreservation,
it may damage or destroy whatever is being preserved.
An overarching theme in this thesis is the cooling of small aqueous samples. The
remainder of this introduction will serve as an introduction to the field, and a guide to
the chapters.
In 1985, Erwin Mayer reported the vitrification of pure water by splat-cooling ~10
μm-sized droplets on a copper plate. (Mayer, 1985) It was reckoned that the required
cooling rate for vitrification was 105 - 106 K/s, which has been supported by
experiments that followed. (Johari et al., 1987; Huang & Bartell, 1994) The
vitrification of water is of central importance to the fields of cryopreservation,
cryoelectron microscopy, and macromolecular crystallography.
The classic review of vitrification for cryoelectron microscopy was written by
Dubochet et al. (1988). The reason vitrification is necessary for electron microscopy
of biological specimens is twofold: First, the formation of nanometer- to micron-sized
ice clusters disrupts the biological structures that exist on those same length scales
which are the aim of the study. Second, the sharp contrast between the amorphous and
crystalline phases in the sample obscure the (often lesser) contrast between different
types of biological structure.
In practice, vitrification is achieved by cooling small samples, and using liquid
cryogens such as propane and ethane. Samples of characteristic size ~50 μm or
smaller are common in this field, and allow cooling rates approaching 100,000 K/s.
Another important point is made by Zasadzinski (1988) and Zasadzinski & Bailey
2
(1991): for the cooling conditions of interest for electron microscopy (small samples,
cooling in liquid propane or ethane), the process of cooling is well approximated by
the so-called "lumped approximation". In this approximation, the sample is regarded
as having a constant temperature throughout, with a thermal gradient in the cryogen at
its surface. This simplification implies that the sample is completely described by its
thermal mass and surface-to-volume ratio. That is, the sample's composition only
matters insofar as the thermal mass is concerned. Since there are no gradients in the
sample, its thermal conductivity is irrelevant to the cooling rate, and every part cools
at the same rate.
Cryopreservation also concerns itself with the cooling of aqueous biological samples,
but the cooling regime is completely different. Mazur (1970) provides a review.
Samples tend to be very large (centimeters), so that cooling rates are limited to ~1 K/s
or slower. Because of this, large amounts (~50 %) of cryoprotectant (alcohols,
glycerol, sugars, etc) must be added to prevent (or control) ice formation during
cooling. The nucleation and growth of ice in these aqueous solutions is has been
studied for decades (Mackenzie, 1977), but studies have been limited to very slow
cooling rates (~1 K/s or slower). Correspondingly large concentrations of
cryoprotectant are typically employed, which limits the parallels that can be drawn to
the experience of the electron microscopy community.
Cryocooling in protein crystallography is at the intersection between these two cooling
regimes. Samples can be as large as 0.5 - 1.0 mm, (if the liquid surrounding the
crystal is included), or as small as 5 - 10 μm. This means that both rapid cooling and
cryoprotectants are involved in the process of cooling protein crystals. The present
day methods for cryocooling in protein crystallography were developed in the late 80s
3

and early 90s. (Hope, 1988; Hope, 1990; Rodgers, 1994) Since that time, some
attention has been paid to the systematic study of the methods. A recent systematic
exploration of the effect of flash-freezing temperature on the quality of nucleosome
crystals (Edayathumangalam & Luger, 2005) suggests that if more attention is paid to
the details of protein crystal freezing, substantial gains might be made in practice.
However, this is still an exceptional case, as most systems do not attract the kind of
intense study as the nucleosome.
Cooling rates using "standard methods" have been measured to be in the 100 - 1000
K/s range (Walker et al., 1998; Teng & Moffat, 1998), but no systematic effort has
been made to determine their effect on experimental outcomes. Of course, faster
cooling does reduce concentration of cryoprotectant needed, but experimenters have
chosen to focus on sample size, as opposed to cooling rate, as the determinant of the
needed concentration. (Chinte et al., 2005; Berejnov et al., 2006) Theoretical work
has argued that protein crystallography samples can be considered to be in the
"lumped model" regime of heat transfer (Kriminski et al., 2003), unless very efficient
cryogens (propane, ethane) are employed.
This dissertation covers a number of topics, each related to the behavior of water at
low temperatures. Some are very practical, like Chapters 2 and 3, others are a mixture
of practical methods and fundamental science. Each chapter begins with a technical
introduction and review of the literature. Here, a brief summary is given only, with as
little jargon as possible.
Chapter 2 deals with the problem of cooling samples rapidly. As mentioned above,
water is a poor glass former, which means that it must be cooled at a very high rate
4

(about 1 million degrees Kelvin per second) to avoid the formation of crystalline ice.
Depending on how many (and what kind) of molecules are dissolved in a solution, the
required cooling rate will be lower. What this means is that the faster an experimenter
can cool their samples, the wider a range of solute concentrations the samples may
contain and still be studied at low temperature.
In both cryo-electron microscopy and protein crystallography, samples are cooled to
low temperatures to reduce the harmful effects of the radiation (electrons or X-rays)
that are inherent to the experiment. Expensive robots exist that can attain cooling rates
of 100,000 K/s and are commonly used for cryo-electron microscopy experiments, but
in for protein crystallography, simply plunging samples into a dewar of liquid nitrogen
is the most common method. While it should be possible to achieve cooling rates in
the 10 – 20 kK/s range with liquid nitrogen, it was found that cooling rates were
limited to the hundreds of K/s. The reason for this turned out to be very simple.
A dewar of liquid nitrogen sitting on a lab bench will be at its boiling point (77.25 K),
and so it will be constantly evolving fresh gas. This gas will form a layer above the
liquid, with warmer gas at the top and colder gas at the bottom. Large samples are not
affected by the gas layer, but smaller ones (which should cool faster in the liquid)
instead cool in the gas as they are plunged into the dewar. The result is a limiting
cooling rate about 20 times slower than would be possible without the gas layer for a
100 micron sample.
The solution to this problem was just as simple as the problem itself: direct a stream of
warm, dry nitrogen gas at the liquid. The size of the cold gas layer is reduced to under
5

100 microns, and cooling rates during plunging are what they should be (Warkentin et
al., 2006)
Tiny samples are advantageous in that they can be cooled very rapidly, but care must
be taken because they are so sensitive to thermal variations. This is the subject of
Chapter 3. Once a sample is frozen, it must be kept at liquid nitrogen temperature
during transportation and mounting in the experimental apparatus. In the case of
protein crystallography, storage of samples is under liquid nitrogen, but data collection
takes place in a stream of cold nitrogen gas. During the transfer process from liquid to
gas, there is the possibility for the sample to warm up briefly, which nullifies whatever
effect the initial rapid cooling might have had.
This chapter describes measurements of the sample temperature during this mounting
process, showing that small enough samples can indeed warm to unacceptably high
temperatures. The reason for the warming is investigated using schlieren imaging of
the cold gas stream during the transfer process. Schlieren imaging allows for thermal
gradients (between regions of warm and cold gas) to be displayed in sharp contrast.
Videos were recorded of the sample as it was placed into the cold gas stream, and
turbulent mixing of warm and cold gas can be clearly seen at the sample position.
To overcome this difficulty, a method was developed that keeps the sample wetted
with liquid nitrogen during the entire mounting process. A stream of liquid nitrogen is
directed at the sample position prior to mounting, and only removed after the sample
is in place. The measured sample temperatures using this method showed no sign of
warming, implying that the effects of rapid cooling had been preserved.
6

Chapter 4 focuses on aqueous samples in small capillaries, and would apply as well to
rod-shaped samples, such as muscle fibers. First, the rate at which capillaries of
various sizes can be cooled in liquid nitrogen and liquid propane was measured.
Tubes with diameters as low as 150 microns are investigated. Not surprisingly,
smaller tubes cool more rapidly than large ones, with a relationship that can be
predicted theoretically in some (but not all) cases. Since capillaries of a given
diameter cool at a given rate, there will be some concentration of solute (in this case
glycerol) that will yield a glassy sample. So next, this “critical concentration” was
determined for each diameter of capillary as well.
These findings are important for protein crystallography because doing experiments
on crystals frozen into capillaries has been proposed as a method that could simplify
data collection. If samples are to be cooled in capillaries, experimenters will need to
know how much of a given solute will yield a glassy sample. On a more fundamental
level, the amount of solute should not depend on the capillary diameter at all, it should
only depend on the cooling rate of the sample. So there is a fundamental relationship
revealed by the data in Chapter 4 as well: The critical cooling rate for glass formation
as a function of solute concentration. This study has determined this quantity up to
cooling rates approaching 10,000 K/s, a hundred times higher than in any previous
study. The result is a clear exponential dependence, which extrapolates to the correct
value for pure water. (Warkentin et al., 2008)
This fundamental relationship is explored further in Chapter 5, where a variety of
solutes are studied. Each one shows an exponential dependence of critical cooling rate
on solute concentration, but the characteristic of the exponential is different for each
solute. One explanation for the exponential dependence is that the solutes modify the
7

free energy barrier to the formation of the critical nucleus. If this were the case, the
characteristic of the exponential would be related to the critical nucleation radius – a
fundamentally important quantity. The characteristic is correlated with the size of the
solute however, so the data cannot be interpreted unambiguously.
In Chapter 6, it is shown that the channels of a protein crystal are at least as effective
at suppressing ice formation as a very large amount of solute (70 % glycerol, for
example). This is demonstrated by cooling protein crystals very slowly (at 0.1 K/s,
ten-million times slower than the rate required to prevent ice formation in pure water).
Despite the very slow cooling, and the large water content of the protein crystals
studied (56 % by volume), no ice forms at any temperature. This result is of important
practical consequence: it opens the door to the study of protein crystals at any
temperature from room temperature down to very low temperature. (Warkentin &
Thorne, 2009)
In Chapter 7, one such temperature-dependent study is described. The radiation
sensitivity of protein crystals is measured as a function of temperature, at temperatures
ranging from room temperature down to 100 Kelvin. This covers the full range of
temperatures likely to be of interest in protein crystallography. The radiation
sensitivity is shown to be tied to the diffusive motions of protein and solvent atoms
inside the protein crystal down to 170 Kelvin, where diffusive motion is believed to
cease. Below that temperature, the radiation sensitivity is relatively constant, in
accord with other organic crystals in which there is no diffusive motion.
8

With the results of Chapters 6 and 7, all the pieces are in place for temperature
dependent studies of proteins in crystals, including the interesting temperature range
near 200 K, where biological activity has been shown to first appear.
9

REFERENCES
Bailey, S. M. & Zasadzinski, J. A. N. (1991). Journal of Microscopy-Oxford 163, 307-
320.
Bartell, L. S. & Huang, J. F. (1994). Journal of Physical Chemistry 98, 7455-7457.
Berejnov, V., Husseini, N. S., Alsaied, O. A., & Thorne, R. E. (2006). Journal of
Applied Crystallography 39, 244-251.
Chinte, U., Shah, B., DeWitt, K., Kirschbaum, K., Pinkerton, A. A., & Schall, C.
(2005). Journal of Applied Crystallography 38, 412-419.
Dubochet, J., Adrian, M., Chang, J. J., Homo, J. C., Lepault, J., Mcdowall, A. W., &
Schultz, P. (1988). Quarterly Reviews of Biophysics 21, 129-228.
Edayathumangalam, R. S. & Luger, K. (2005). Acta Crystallographica Section D-
Biological Crystallography 61, 891-898.
Hope, H. (1988). Acta Crystallographica Section B-Structural Science 44, 22-26.
Hope, H. (1990). Annual Review of Biophysics and Biophysical Chemistry 19, 107-
126.
Johari, G. P., Hallbrucker, A., & Mayer, E. (1987). Nature 330, 552-553.
Kriminski, S., Kazmierczak, M., & Thorne, R. E. (2003). Acta Crystallographica
Section D-Biological Crystallography 59, 697-708.
Mackenzie, A. P., Derbyshire, W., & Reid, D. S. (1977). Philosophical Transactions
of the Royal Society of London Series B-Biological Sciences 278, 167-&.
Mayer, E. (1985). Journal of Applied Physics 58, 663-667.
Mazur, P. (1970). Science 168, 939-&.
Rodgers, D. W. (1994). Structure 2, 1135-1140.
Teng, T. Y. & Moffat, K. (1998). Journal of Applied Crystallography 31, 252-257.
10
Walker, L. J., Moreno, P. O., & Hope, H. (1998). Journal of Applied Crystallography
31, 954-956.
Warkentin, M., Berejnov, V., Husseini, N. S., & Thorne, R. E. (2006). Journal of
Applied Crystallography 39, 805-811.
Warkentin, M., Stanislavskaia, V., Hammes, K., & Thorne, R. E. (2008). Journal of
Applied Crystallography 41, 791-797.
Warkentin, M., & Thorne, R. E. (2009). Journal of Applied Crystallography 42, (in
press.)
Zasadzinski, J. A. N. (1988). Journal of Microscopy-Oxford 150, 137-149.
11

CHAPTER 2
HYPERQUENCHING FOR PROTEIN CRYSTALLOGRAPHY
2.1 Introduction
The introduction of cryocrystallographic methods in the late 1980’s revolutionized the
determination of protein structures by X-ray diffraction (Hope, 1988; Hope, 1990). As
is known from cryoelectron microscopy (Zeitler, 1982; Dubochet et al., 1982),
lowering the sample’s temperature to cryogenic temperatures (~100 K) dramatically
reduces radiation damage, because the glass transition temperature for solvent within
crystals is typically in the range 150-200 K. (Weik et al., 2001; Weik et al., 2005).
Diffusion of atomic and molecular radicals produced by irradiation is greatly reduced,
and the rigidified water network provides a scaffold for the protein that prevents large
motions in response to local damage. With advances in synchrotron X-ray sources,
optics and X-ray detectors, cryocrystallographic methods now allow complete data
sets to be obtained from macromolecular crystals smaller than 10 μm. It is generally
assumed (although seldom verified in detail (Earnest et al., 1991)) that the low
temperature structures correspond to the biologically active form.
Despite these triumphs, cryopreservation of protein crystals has remained a
problematic art (Juers and Matthews, 2004). Protein crystal order and especially
mosaicity nearly always degrade during flash cooling. Many cooled crystals do not
yield usable diffraction. Formation of hexagonal ice both inside and outside the crystal
can damage it and introduce ice rings that interfere with diffraction from the protein
lattice. Ice rings can be eliminated and damage reduced by cooling fast enough to
obtain vitreous or amorphous ice. For pure water, the required cooling rates are ~106
12

K/s (Bruggeller & Mayer, 1980; Johari et al, 1987), orders of magnitude larger than
those achieved in current cryocrystallography practice. Adding cryoprotectants such as
glycerol, ethylene glycol, and MPD can reduce required cooling rates to 102 K/s or
less (Peyridieu et al., 1996; Lu & Liu, 2003). Unfortunately, cryoprotectants can be
unfriendly to the protein's native conformation, they can cause osmotic stress, and they
affect protein solubility, and so can cause crystal cracking, dissolution and structural
changes, especially at the relatively high concentrations (20-30% w/v) used in current
practice. Furthermore, internal solvent (whose crystallization is strongly inhibited by
the protein) and external solvent should in general be cryoprotected differently
(Kriminski et al., 2002). As a result, optimizing cryoprotectant conditions can be time
consuming.
Protein crystals are cooled by direct insertion into a stream of cold nitrogen gas at
T~100 K, or by plunging into liquid nitrogen (Tv=77 K) or liquid propane (Tm=86 K)
(Rodgers, 1994; Chayen et al., 1996; Garman & Schneider 1997; Garman, 1999;
Pflugrath, 2004). Simple physical arguments, scaling analysis (Kriminski et al., 2003)
and the experience of cryoelectron microscopists clearly suggest that plunge cooling in
liquid cryogens should produce far larger cooling rates and thus better (or at least
different) diffraction outcomes than gas stream cooling. However, diffraction
outcomes obtained using cold gases and liquids have not differed substantially, and
two studies to determine the most effective method (Teng & Moffat, 1998; Walker et
al., 1998) reached different conclusions, so that both methods remain in wide use
(Garman & Owen, 2006). Even more puzzling — and troubling — is that the
measured cooling rates achieved in conventional plunge or gas stream cooling of
ordinary-size samples (200-1500 K/s) are small (Teng & Moffat, 1998; Walker et al.,
1998). Crystals take a fraction of a second to cool below water's glass transition
13

temperature and on the order of 0.1 s to cool below T=220 K (Snell et al., 2002),
where conformational motions are largely frozen out (Fraunenfelder et al., 1979;
Tilton et al., 1992; Halle, 2004).
Here we show that during plunge cooling into liquid cryogens of the small volume
(<0.1 μl) samples typical in protein crystallography, the cooling rate in the critical
region between room temperature and T=150 K is controlled not by the liquid but by
heat transfer to the cold gas layer that exists above it. By removing this cold gas layer,
cooling rates can be increased to at least 1.5 × 10⁴ K/s in liquid nitrogen and cooling
times reduced to <10 ms to reach 77 K (the temperature of boiling liquid nitrogen).
With these high cooling rates, cryoprotectant concentrations required to achieve
vitrification of water-glycerol mixtures are reduced from ~30% to less than 6% w/v.
Consequently, cooling-induced crystal damage should be reduced, and cryoprotectant
screening should be simplified.
2.2 Methods and Results
2.2.1 Plunge cooling of small volumes: A puzzle
To obtain vitreous ice, the time to cool to below Tg should be shorter than the
characteristic time for nucleation of crystalline ice. Cryoprotectants like glycerol slow
down or inhibit crystalline ice nucleation, decreasing the required cooling rate.
Smaller volume samples have larger surface-to-volume ratios and should cool more
quickly, decreasing the required cryoprotectant concentration. An elementary analysis
suggests that the cooling rate should scale as V-1/2 (Kriminski et al., 2003).
14
Berejenov et al. (2006) examined the minimum concentration required to achieve
vitrification of aqueous mixtures of fourteen different cryoprotectants as a function of
the liquid volume V, for plunge cooling in liquid nitrogen using standard methods. As
illustrated in Figure 2.1 (open circles) for glycerol, at large volumes (>10 μl)
Berejnov et al. found that the required cryoprotectant concentration is large and
independent of volume, as expected in the limit when cooling rates are so slow that
nucleation must be completely inhibited. At smaller volumes, the cryoprotectant
concentration decreases with decreasing volume, as expected based on the argument in
the preceding paragraph. However, for volumes below ~0.1 μl — for glycerol and all
other cryoprotectants studied by Berejnov et al. — the required cryoprotectant
concentration becomes roughly independent of volume. Similar volume-independent
glycerol concentrations were required for volumes below ~0.1 μl when drops were
plunge cooled in liquid propane. This volume range corresponds to crystals smaller
than about 500 μm in all three dimensions, i.e., to essentially all crystals of interest in
macromolecular X-ray crystallography.
The apparent small-volume saturation found by Berejnov et al. cannot represent an
intrinsic feature of glycerol-water mixtures because pure water can be vitrified at high
cooling rates (Mayer, 1985). To explore the origin of this saturation, aqueous mixtures
were prepared in 2% (w/v) glycerol increments. An aerosol spray of each mixture
deposited drops with a range of sizes onto the bottom of a cup made from 25 μm
copper foil. The cup plus drops was then plunged into liquid nitrogen and the result
photographed through a microscope. As in previous work (Garman & Schneider,
1997; McFerrin & Snell, 2002; Chinte et al., 2005; Berejnov et al., 2006), clear drops
were judged to be vitrified, while opaque drops were judged to be polycrystalline. The
largest drop volume for which the drops were consistently transparent was then
15

recorded as the critical volume for vitrification at that glycerol concentration. Drop
volumes were estimated based on the drop radius and separate calibration
measurements of drop height versus radius on copper foil.
Copper's thermal conductivity is much larger than that of the boiling gas layer that
envelops drops when they are directly plunged into liquid cryogens. This fact is used
to advantage in the splat freezing method (in which drops are sprayed onto cold
metals) to vitrify ~10 μm drops of pure water (Mayer, 1985). Our variant of this
method yields frozen drops with much simpler shapes, allowing more accurate volume
estimation. As shown by the solid circles in Figure 2.1, the saturation of critical
concentration at small drop volumes disappears, and the concentration decreases
monotonically (approximately logarithmically) with volume down to the smallest
volume (~40 pl) studied. For large volumes, data from the two methods almost agree,
with the points from copper foil being slightly higher. This is most likely due to the
added mass of copper that must also cool.
2.2.2 The cold gas layer: Temperature versus height above the liquid cryogen
The gas immediately above a liquid cryogen will be cooled through radiation,
convection and conduction by the cold liquid below. For large sample volumes, the
sample can pass through the resulting cold gas layer without appreciable internal
temperature drop, so that cooling occurs mainly in the liquid cryogen. For small
sample volumes, the sample will remain in equilibrium with the surrounding gas as it
passes through the cold gas layer. Most of the cooling as well as solidification of the
solvent within the sample (vitrification or crystallization) may then occur in the gas,
before the sample reaches the liquid. The dangers of cold gas layers have been
16

Figure 2.1
Minimum glycerol concentration required for vitrification of glycerol-water mixtures
versus drop volume. Open circles are data collected by plunging drops held in
tungsten wire loops (for volumes above 1 μl) or in MicroMounts (below 1 μl) into
liquid nitrogen, from Berejnov et al. (2006). Solid circles represent data collected by
spraying drops onto the bottom of a 25 μm thick copper cup and then plunging into
liquid nitrogen. Vertical lines indicate corresponding linear dimensions of cubic
samples.
17
discussed in the context of cryo-electron microscopy (Ryan et al., 1992), and the
problem of heat transfer from a small drop moving through the cold gas above a liquid
cryogen has been analyzed (Chang & Baust, 1991). In the protein crystallography
community, the cold gas layer's existence has been recognized (Pflugrath, 2004) but
its effects have not been quantified.
To quantify the cold gas layer, a glass hemispherical dewar 12 cm across and 8 cm
deep (Pope Scientific Inc, Saukville, WI, USA) was filled with liquid nitrogen at T=77
K. The temperature of the gas above the liquid was measured using a chromel-
constantan (E-type) bare-wire thermocouple with a 120 μm bead and 75 μm diameter
leads, and recorded using a computer with an SCB-386 DAQ interface and running
LabView. The thermocouple was initially positioned well above the liquid nitrogen
surface and then lowered by a stepper motor under computer control. The recorded
temperature vs. time was converted to temperature vs. height using the measured
speed of the stepper motor. To check for, e.g., radiative cooling of the thermocouple
below the gas temperature, measurements were repeated at speeds from 0.1 mm/s to 5
mm/s and in the reverse direction, and no appreciable variation in temperature profiles
was observed. To emulate conditions used by crystallographers, no special effort was
made to isolate the dewar, and so air currents in the room randomly perturbed the gas
layer. Measurements were thus repeated until a satisfactorily clean curve was
obtained. Temperature versus height profiles were recorded at different radial
distances from the dewar's center, and showed no measurable variations from the
center to the inner walls.
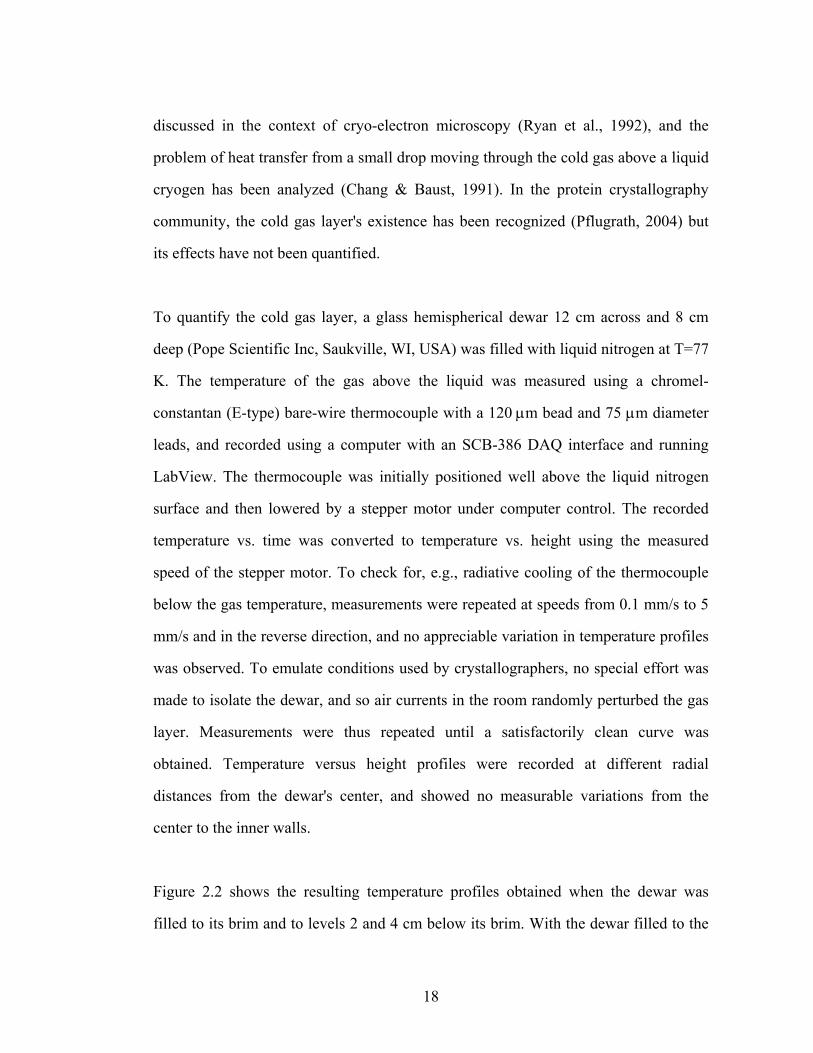
Figure 2.2 shows the resulting temperature profiles obtained when the dewar was
filled to its brim and to levels 2 and 4 cm below its brim. With the dewar filled to the
18
brim, the gas temperature falls below water's freezing point 1 cm above the surface,
and below water's glass transition Tg about 4 mm above the surface. For a more typical
and safe fill level of 4 cm, the cold gas layer extends more than 2 cm above the liquid
surface, and the temperature drops below Tg nearly 1 cm above the liquid surface.
2.2.3 Plunging through cold gas
We next investigated cooling rates obtained when plunging a thermocouple through
the cold gas layer into liquid nitrogen, as a function of the layer thickness (dewar fill
level) and plunge velocity. To obtain the fastest temperature response time, a
thermocouple with an 80 μm bead and 25 μm diameter leads was flattened between
two machine-tool bits to a thickness of 20 μm. This allowed us to explore the thermal
mass/response time regime relevant to cryocooling sub-100 μm protein crystals. Our
geometry is particularly relevant to crystals with thin plate or rod-like morphologies.
The thermocouple was plunged by hand, and the plunge velocity was determined
using frame-by-frame analysis of a video of the experiment.
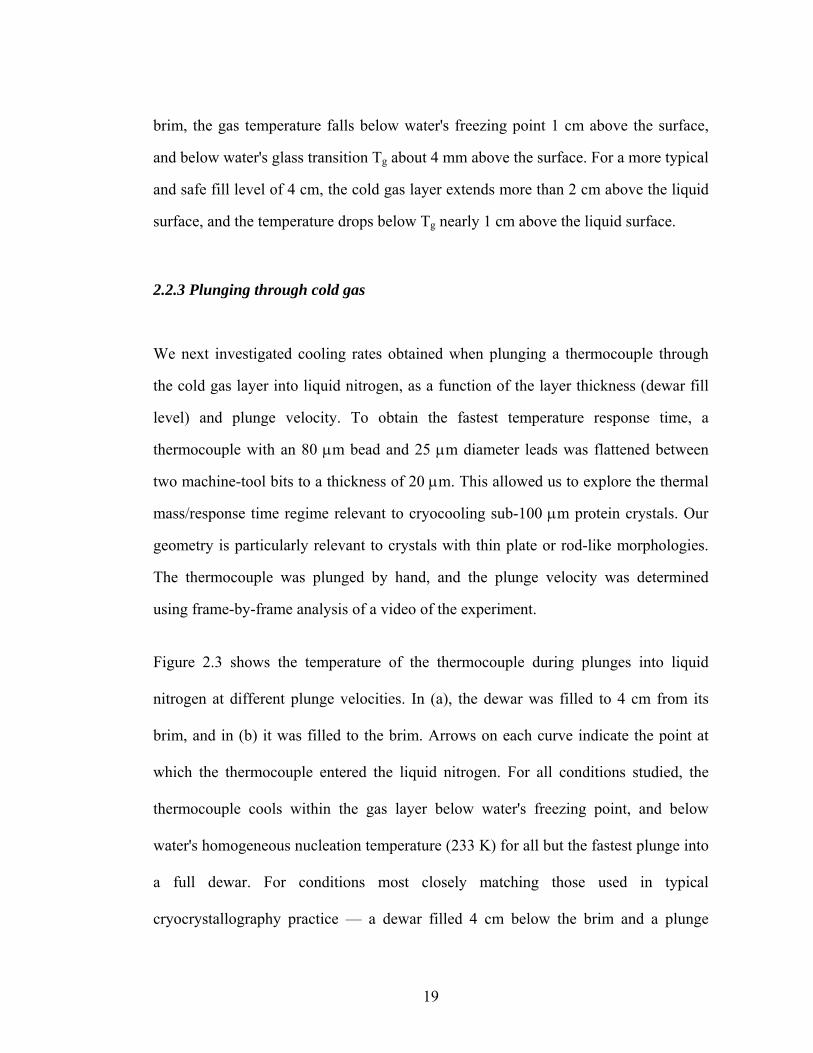
Figure 2.3 shows the temperature of the thermocouple during plunges into liquid
nitrogen at different plunge velocities. In (a), the dewar was filled to 4 cm from its
brim, and in (b) it was filled to the brim. Arrows on each curve indicate the point at
which the thermocouple entered the liquid nitrogen. For all conditions studied, the
thermocouple cools within the gas layer below water's freezing point, and below
water's homogeneous nucleation temperature (233 K) for all but the fastest plunge into
a full dewar. For conditions most closely matching those used in typical
cryocrystallography practice — a dewar filled 4 cm below the brim and a plunge
19

Figure 2.2
Gas temperature as a function of height above liquid nitrogen held in a 12 cm diameter
hemispherical dewar, for different liquid fill levels (measured in cm from the brim).
Fluctuations at large height are due to room air currents. Inset: Gas temperature versus
height above liquid nitrogen when dry nitrogen gas is blown along the thermocouple's
path, as described in the text. Blowing reduces the thickness of the cold gas layer
above the liquid from ~2 cm to less than 100 μm, a reduction of more than two orders
of magnitude.
20

speed of 0.4 m/s — the thermocouple cools below Tg within the gas layer. The time
required is ~0.1 s, corresponding to a cooling rate of 1500 K/s. This is only three times
larger than reported by Teng & Moffat (1998), despite our use of a thermocouple six
times thinner and with leads six times smaller in diameter.
The maximum cooling rate prior to entering the liquid increases roughly linearly with
increasing plunge velocity. Once the thermocouple enters the liquid, the cooling rate
in all cases is much larger (~15,000 K/s). Unlike in the gas, cooling rates in liquid are
largely unaffected by the plunge velocity in the velocity range examined.
One way to defeat the cold gas layer is to plunge at high velocity (>5 m/s) into a full
dewar. High speed plunging is used in commercial devices for cooling electron
microscopy samples, which are comprised of very thin (sub-micron) films mounted on
thick (20-30 μm) metal grids that have much higher thermal mass than protein
crystallography mounts. It is not clear that the more delicate samples and mounts used
in protein crystallography could routinely survive such treatment, except when the
sample thickness and thus the force on entering the liquid is small. Large accelerations
and decelerations (>100 times that due to gravity), required for a compact device and
to prevent enormous splashing when the goniometer base holding the sample impacts
the liquid cryogen, could also be problematic.
2.2.4 Removing the cold gas layer
Another way to increase cooling rates is to remove the cold gas layer, producing an
abrupt transition along the plunge path from gas at room temperature to liquid at
cryogenic temperature. To remove the cold gas layer, we simply blow it away.
21

Figure 2.3
Temperature versus time recorded as a thermocouple is plunged at different velocities
into a dewar of liquid nitrogen. The liquid level is (a) 4 cm from the brim and (b) at
the brim. Arrows indicate the time the thermocouple enters the liquid. Measurements
used a chromel-constantan bare-wire thermocouple with 25 μm leads and a flattened,
~20 μm thick bead (see text.)
22
A Teflon nozzle with a diameter of 8 millimeters was connected to a cylinder of dry
nitrogen gas through a high flow-rate rotameter. The nozzle was positioned 30 cm
from the liquid level and tipped 10 degrees from the vertical, and its flow directed at
the radial center of the liquid surface. Other geometries for the nozzle and its
positioning were examined and most were found to be satisfactory, but the geometry
described here gave the most repeatable results.
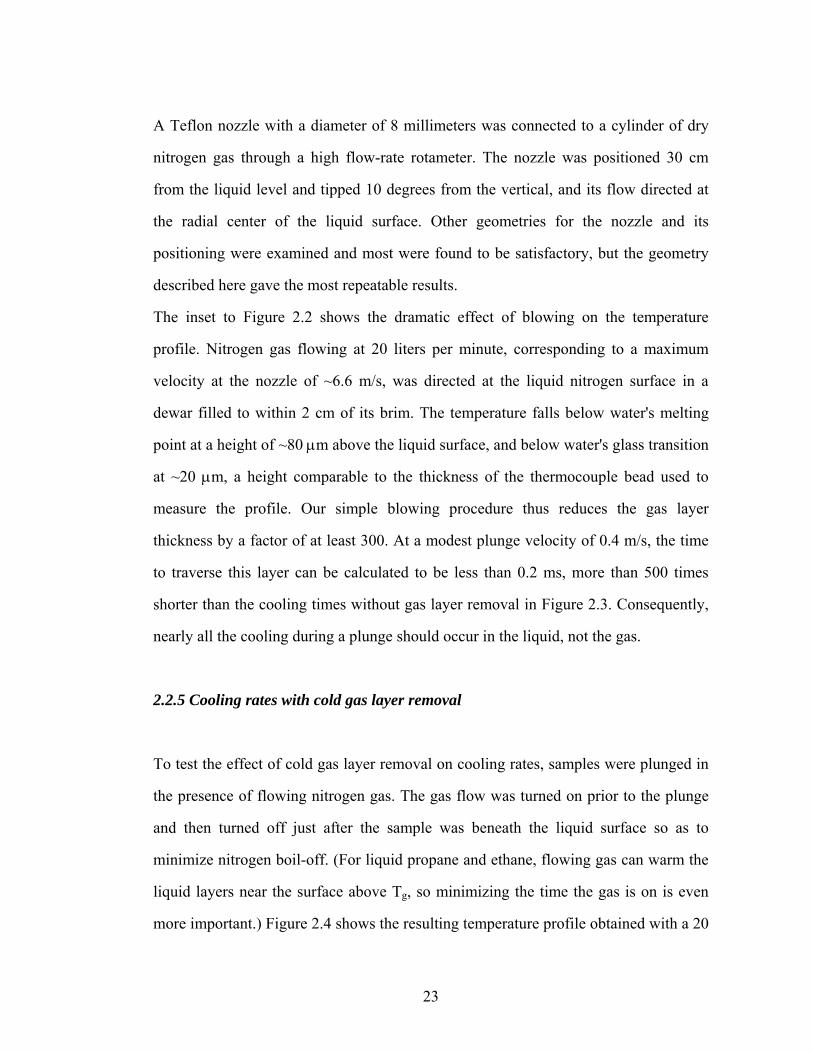
The inset to Figure 2.2 shows the dramatic effect of blowing on the temperature
profile. Nitrogen gas flowing at 20 liters per minute, corresponding to a maximum
velocity at the nozzle of ~6.6 m/s, was directed at the liquid nitrogen surface in a
dewar filled to within 2 cm of its brim. The temperature falls below water's melting
point at a height of ~80 μm above the liquid surface, and below water's glass transition
at ~20 μm, a height comparable to the thickness of the thermocouple bead used to
measure the profile. Our simple blowing procedure thus reduces the gas layer
thickness by a factor of at least 300. At a modest plunge velocity of 0.4 m/s, the time
to traverse this layer can be calculated to be less than 0.2 ms, more than 500 times
shorter than the cooling times without gas layer removal in Figure 2.3. Consequently,
nearly all the cooling during a plunge should occur in the liquid, not the gas.
2.2.5 Cooling rates with cold gas layer removal
To test the effect of cold gas layer removal on cooling rates, samples were plunged in
the presence of flowing nitrogen gas. The gas flow was turned on prior to the plunge
and then turned off just after the sample was beneath the liquid surface so as to
minimize nitrogen boil-off. (For liquid propane and ethane, flowing gas can warm the
liquid layers near the surface above Tg, so minimizing the time the gas is on is even
more important.) Figure 2.4 shows the resulting temperature profile obtained with a 20
23

liter per minute gas flow when the thermocouple was plunged at 0.3 m/s along the axis
of a dewar filled to within 2 cm of its brim. Unlike in all of the data of Figure 2.3,
there is no evidence of cooling by the gas; all cooling occurs in the liquid nitrogen.
The cooling time from room temperature to below Tg is ~0.01 s, 10 times shorter than
without gas removal. The average cooling rate over this temperature range is 15,000
K/s, 10 times larger than without gas layer removal, and it is slightly larger than the
cooling rate achieved without gas removal at a plunge velocity of 5 m/s into a full
dewar. Very similar temperature-time curves are obtained for plunge velocities from
0.01 m/s to 1 m/s and flow rates from 10 to 60 LPM, with only a slight increase in
liquid cooling rate for larger plunge velocities. This is a significant advantage of cold
gas layer removal: very large cooling rates are achieved even with very leisurely
plunges that pose no risk to the sample.
In every temperature history shown in Figures 2.3 and 2.4 in which the thermocouple
enters the liquid with a temperature well above 150 K, (i.e., with blowing or high
plunge velocities), there is a transition to a higher cooling rate at 130-150 K. This is
due to a change from film boiling to nucleate boiling of the nitrogen near the sample
surface (Incropera & DeWitt, 2002). In the film boiling regime, the cooling rate within
the liquid increases slightly with increasing plunge velocity (roughly 30% for a factor
15 in velocity). A similar very weak dependence of cooling rate on plunge velocity is
observed in liquid propane and ethane, which cool only in the nucleate boiling regime
(Ryan et al., 1992).
24

2.2.6 Tiny cryoprotectant concentrations for tiny samples
Finally, we return to the experiments of Berejnov et al. (2006) on the minimum
(critical) cryoprotectant concentration required to achieve vitreous ice as a function of
sample volume. Glycerol-water drops mounted on MicroMounts (Mitegen, Ithaca,
NY) and ranging in size from 1 μl down to 100 pl were plunge cooled into liquid
nitrogen, using the set-up described in Section 2.2.4 to remove the cold gas layer. The
state of the drop (vitreous or polycrystalline) after plunge cooling was deduced by
visual observation through a microscope, as described by Berejnov et al. The results
are shown in Figure 2.5, along with those of Berejnov et al. obtained without cold gas
removal. The small volume saturation of critical concentration is removed, and
glycerol concentrations decrease monotonically with drop volume down to the
smallest drop examined. At all volumes studied, the required concentrations are
somewhat lower than for drops cooled on copper foil (Figure 2.1). For a 100 pl drop,
corresponding to a 60 μm diameter sample, the required glycerol concentration is
reduced from 28% w/v without blowing to 6% w/v. The point for vitrification of pure
water (0% glycerol) at a volume of ~4 pl was measured by Mayer (Mayer, 1985) using
splat freezing on cold copper. If the extrapolation of the fit to our data in Figure 2.5 is
valid, then plunging into liquid nitrogen with cold gas removal should cool small
samples as effectively as splat freezing, the standard method for achieving the highest
cooling rates.
25

Figure 2.4
Temperature versus time recorded as a thermocouple is plunged into liquid nitrogen,
with and without cold gas layer removal by blowing. Without blowing, the plunge
velocity required to minimize the effect of the gas layer is ~5 m/s. With blowing, very
similar curves are obtained for all plunge velocities and fill heights. These
measurements used the same thermocouple as in Figure 2.3.
26

Figure 2.5
Minimum glycerol concentration required for vitrification of glycerol-water mixtures
versus drop volume. Open circles are the data of Figure 1 for a direct plunge into
liquid nitrogen without cold gas layer removal, taken from Berejnov et al. (2006).
Solid squares are data collected for a direct plunge into liquid nitrogen using a dry
nitrogen gas stream to remove the cold gas layer. These data show an approximate
logarithmic variation of concentration with volume over four orders of magnitude in
volume (suggesting an exponential variation of critical cooling rate with
concentration.) Extrapolating this variation to zero concentration roughly yields the
maximum volume of pure water that can be vitrified by spraying drops onto cold
copper surfaces.
27

2.3 Discussion
2.3.1 Two limiting approaches to cryopreservation
One can imagine two limiting approaches to cryopreservation. The first is to cool very
slowly (e.g., 0.1 K/s) through the vitrification point, using large cryoprotectant
concentrations (e.g., 60% w/v glycerol) to prevent crystallization. Since all physico-
chemical properties are temperature dependent, this might allow relaxations and
redistributions to occur so as to maintain quasi-equilibrium and achieve a
homogeneous low temperature state. Variants on this approach have been used for
cryopreservation of cells and tissues (Mazur, 1970), but in most cases it is impractical
for protein crystals.
The other limiting approach is to cool so quickly that the high temperature state is
frozen in. This approach is loosely referred to as hyperquenching, and is typically
achieved by splat cooling on cold metals (Mayer, 1985; Johari et al., 1987).
Unfortunately, cooling rates achieved in cryopreservation of protein crystals by plunge
or gas stream cooling are 103 K/s or less (Teng & Moffat, 1998; Walker et al., 1998),
too fast to allow gentle relaxations, and yet too slow to be in the hyperquenching
regime. Although sufficiently fast to produce full solvent vitrification (with sufficient
cryoprotectant), these modest cooling rates produce inhomogeneities within the crystal
(evident in X-ray topography and in measurements of lattice constant distributions)
that correlate with degradation of mosaicity and resolution (Kriminski et al., 2002).
These inhomogeneities are due at least in part to incomplete relaxation of stresses
associated with differential thermal expansion of solvent and protein that can occur at
28
modest cooling rates (Juers & Matthews, 2001; Kriminski et al., 2002). Although most
conformational flexibility is thought to be frozen out by T=220 K, with current
methods the time to cool to this temperature can be of the order of 0.1 s. This is
sufficiently long to allow side chains (perhaps including those in the active site of a
protein) to undergo important conformational changes (Deacon et al., 1997; Scheidig
et al., 1999; Sandalova et al., 1999).
2.3.2 Cold gas layer removal as a route to hyperquenching
Our experiments show that cooling rates of protein crystals can be increased by at
least a factor of 10-20 over current best practice — to greater than 15,000 K/s in liquid
nitrogen — by removing the cold gas layer above the liquid. The cooling rate should
vary roughly as the square root of crystal volume (consistent with the data in Figure
2.5 and more detailed analysis in Berejnov et al. (2006)). Using ~10 μm microcrystals
and liquid propane or ethane, cooling rates approaching 100,000 K/s should be
achievable. The apparatus required to achieve these large improvements over current
practice is trivial.
2.3.3 Puzzles resolved
The presence of the cold gas layer explains the saturation of minimum cryoprotectant
concentrations required to achieve vitreous ice at volumes below ~0.1 μl, observed for
plunge cooling in both liquid nitrogen and liquid propane (Berejnov et al., 2006). For
essentially the entire range of sample sizes of relevance in protein crystallography and
for experimentally convenient plunge velocities, much of the cooling occurs in the
cold gas layer, not the liquid. The fact that the cryoprotectant concentration is roughly
29

volume independent (rather than just showing a change in slope) for volumes below
0.1 μl suggests that these volumes remain in quasi-equilibrium with the surrounding
gas during the plunge. For the same plunge velocity and cold gas layer thickness, they
all then cool at the same rate, and so require the same cryoprotectant concentration.
Cooling in the cold gas layer may in part explain why flash cooling outcomes for
samples prepared and cooled in seemingly similar ways can be so variable. That one
good crystal may have been plunged as a lab mate walked by, blowing away the cold
gas.
Cooling in the cold gas layer explains why plunge cooling in liquid cryogens has so
far not proven to be reliably superior to cooling in cold gas streams. In all cases,
cooling rates have been limited by heat transfer to a gas, not to a liquid.
2.3.4 Implications for macromolecular crystallography
The present results, by allowing implementation of highly reproducible cooling
protocols with dramatically increased cooling rates, will have broad consequences for
macromolecular crystallography. Increased cooling rates will reduce conformational
changes between room and low temperature structures. They will reduce the
relaxations that occur during slow cooling and that give rise to inhomogeneities
responsible for mosaic broadening and resolution degradation. They will dramatically
reduce — by a factor of 4 or 5 — the cryoprotectant concentrations required to prevent
formation of crystalline ice in protein-free solution that may surround the crystal,
simplifying the search for cryoprotection conditions. And because the high protein
concentrations within the crystal provide excellent protection against ice
crystallization (Kriminski et al., 2002), it may routinely be possible to go from
30

crystallization tray to liquid cryogen to X-ray beam and obtain useable diffraction with
no cryoprotectants, for all but the highest solvent-content crystals. Cryoprotectants
play other roles aside from inhibiting ice crystallization (Juers & Matthews, 2001;
Kriminski et al., 2002), and so they may still be required to obtain the best resolution.
2.4 Conclusion
Cooling protein crystals by plunging into liquid cryogens has been powerfully
enabling and annoyingly troublesome, dramatically reducing radiation damage while
introducing other damage that limits the quality of X-ray determined structures. It has
long been evident that there is a cold gas layer above the liquid cryogen, and that this
gas layer can cool a sample that passes through it. What has not been evident is that,
for sample sizes spanning essentially the entire range of interest in protein
crystallography, most cooling occurs in this gas layer, not in the liquid cryogen. This
unfortunate coincidence has limited cooling rates, allowing internal relaxations that
disrupt crystal order. By banishing the cold gas layer, the full potential of plunge
cooling to capture and preserve protein structure may finally be realized.
31
REFERENCES
Berejnov, V., Husseini, N. S., Alsaied, O. A., & Thorne, R. E. (2006). Journal of
Applied Crystallography 39, 244-251.
Bruggeller, P. & Mayer, E. (1980). Nature 288, 569-571.
Chang, Z. H. & Baust, J. G. (1991). Journal of Microscopy-Oxford 161, 435-444.
Chayen, N. E., Boggon, T. J., Cassetta, A., Deacon, A., Gleichmann, T., Habash, J.,
Harrop, S. J., Helliwell, J. R., Nieh, Y. P., Peterson, M. R., Raftery, J., Snell, E. H.,
Hadener, A., Niemann, A. C., Siddons, D. P., Stojanoff, V., Thompson, A. W., Ursby,
T., & Wulff, M. (1996). Quarterly Reviews of Biophysics 29, 227-278.
Chinte, U., Shah, B., DeWitt, K., Kirschbaum, K., Pinkerton, A. A., & Schall, C.
(2005). Journal of Applied Crystallography 38, 412-419.
Deacon, A., Gleichmann, T., Kalb, A. J., Price, H., Raftery, J., Bradbrook, G., Yariv,
J., & Helliwell, J. R. (1997). Journal of the Chemical Society-Faraday Transactions
93, 4305-4312.
Dubochet, J., Lepault, J., Freeman, R., Berriman, J. A., & Homo, J. C. (1982). Journal
of Microscopy-Oxford 128, 219-237.
Frauenfelder, H., Petsko, G. A., & Tsernoglou, D. (1979). Nature 280, 558-563.
Garman, E. (1999). Acta Crystallographica Section D-Biological Crystallography 55,
1641-1653.
Garman, E. F. & Schneider, T. R. (1997). Journal of Applied Crystallography 30, 211-
237.
Garman, E. F. & Owen, R. L. (2006). Acta Crystallogr. D. Biol. Crystallogr. 62, 32-
47.
Halle, B. (2004). Proceedings of the National Academy of Sciences of the United
States of America 101, 4793-4798.
32

Hope, H. (1988). Acta Crystallographica Section B-Structural Science 44, 22-26.
Hope, H. (1990). Annual Review of Biophysics and Biophysical Chemistry 19, 107-
126.
Incropera, F. P. & DeWitt, D. P. (2002). Fundamentals of heat and mass transfer, 5th
ed ed. New York: J. Wiley.
Johari, G. P., Hallbrucker, A., & Mayer, E. (1987). Nature 330, 552-553.
Juers, D. H. & Matthews, B. W. (2001). Journal of Molecular Biology 311, 851-862.
Juers, D. H. & Matthews, B. W. (2004). Quarterly Reviews of Biophysics 37, 105-119.
Kriminski, S., Caylor, C. L., Nonato, M. C., Finkelstein, K. D., & Thorne, R. E.
(2002). Acta Crystallogr. D. Biol. Crystallogr. 58, 459-471.
Kriminski, S., Kazmierczak, M., & Thorne, R. E. (2003). Acta Crystallographica
Section D-Biological Crystallography 59, 697-708.
Lu, Z. P. & Liu, C. T. (2003). Phys. Rev. Lett. 91, 115505.
Mayer, E. (1985). Journal of Applied Physics 58, 663-667.
Mazur, P. (1970). Science 168, 939-&.
McFerrin, M. B. & Snell, E. H. (2002). Journal of Applied Crystallography 35, 538-
545.
Peyridieu, J. F., Baudot, A., Boutron, P., Mazuer, J., Odin, J., Ray, A., Chapelier, E.,
Payen, E., & Descotes, J. L. (1996). Cryobiology 33, 436-446.
Pflugrath, J. W. (2004). Methods 34, 415-423.
Rodgers, D. W. (1994). Structure 2, 1135-1140.
Ryan, K. P., Bald, W. B., Neumann, K., Simonsberger, P., Purse, D. H., & Nicholson,
D. N. (1990). Journal of Microscopy-Oxford 158, 365-378.
Ryan, K. P. (1992). Scanning Microscopy 6, 715-743.
Sandalova, T., Schneider, G., Kack, H., & Lindqvist, Y. (1999). Acta
Crystallographica Section D-Biological Crystallography 55, 610-624.
33

Scheidig, A. J., Burmester, C., & Goody, R. S. (1999). Structure 7, 1311-1324.
Snell, E. H., Judge, R. A., Larson, M., & van der Woerd, M. J. (2002). Journal of
Synchrotron Radiation 9, 361-367.
Teng, T. Y. & Moffat, K. (1998). Journal of Applied Crystallography 31, 252-257.
Tilton, R. F., Dewan, J. C., & Petsko, G. A. (1992). Biochemistry 31, 2469-2481.
Walker, L. J., Moreno, P. O., & Hope, H. (1998). Journal of Applied Crystallography
31, 954-956.
Weik, M., Kryger, G., Schreurs, A. M. M., Bouma, B., Silman, I., Sussman, J. L.,
Gros, P., & Kroon, J. (2001). Acta Crystallographica Section D-Biological
Crystallography 57, 566-573.
Weik, M., Vernede, X., Royant, A., & Bourgeois, D. (2004). Biophysical Journal 86,
3176-3185.
Weik, M., Schreurs, A. M. M., Leiros, H. K. S., Zaccai, G., Ravelli, R. B. G., & Gros,
P. (2005). Journal of Synchrotron Radiation 12, 310-317.
Zeitler, E. (1982). Journal of Ultrastructure Research 81, 397.
34

35
CHAPTER 3
SCHLIEREN IMAGING OF A COLD GAS STREAM FOR
CRYOCRYSTALLOGRAPHY
3.1 Introduction
Protein X-ray crystallography is performed at 100 K in nearly every case. This is
because low temperatures mitigate radiation damage and allow for easy transportation
and storage of samples (Rodgers, 1994; Garman & Schneider; 1997). One important
step in this process is the placement of the sample holder onto the goniometer,
whether this is done manually or with an automatic mounting system (Parkin & Hope,
1998; Pflugrath, 2004). This step is non-trivial because the sample must be
transferred from under liquid nitrogen to a stream of cold gas without significant
warming.
As the typical experimental setup moves toward larger X-ray flux and a smaller beam,
the crystal size required to obtain a complete dataset is reduced, and complete data has
been obtained from crystals on the order of 10 μm on a side (Sanishvili et al., 2008).
As the size of the sample is reduced, it responds to changes in its thermal environment
increasingly rapidly. This is one reason to expect that unintentional annealing during
mounting would be more of a problem in recent work utilizing smaller crystals.
One previous study has examined the mounting process using tongs (Parkin & Hope,
1998). This study found that no measurable annealing occurred, but the thermocouple
used in the study lacked the sensitivity required for comparison with tiny samples used
in modern experiments.

This paper explores the importance of crystal size when transferring the crystal to the
goniometer. We find that for samples smaller than 80 μm, large temperature spikes
can be expected to occur randomly and unacceptably frequently. It has been reported
that in some cases annealing crystals briefly can improve diffraction quality, but this is
only done when diffraction is poor to begin with (Harp et al., 1998; Harp et al., 1999;
Stevenson et al., 2001; Hanson et al., 2003). Furthermore, successive annealing trials
and extended annealing times on a single crystal have been shown to eventually
degrade the crystal perfection. (Kriminski et al., 2002; Hanson et al., 2003; Juers &
Matthews, 2004). A temperature spike to ~ 240 K can allow for the formation of
crystalline ice in the sample as it cools again at a significantly lower rate than it
originally did in the liquid nitrogen. Also a random and uncontrollable amount of
annealing in the process of mounting will cause additional variability in cryocooling
outcomes that are already unpredictable.
To further understand the source of the temperature spikes, we use a schlieren
technique to produce a video of the motions of the gas surrounding the crystal during
mounting. These videos show that the gas is turbulent during the process of mounting,
partly explaining the variability in thermal histories.
3.2 Experiment
The experiments were carried out on an Oxford Cryosystems 700 Series Cryostream
(Oxford Cryosystems, Oxford, UK). A warm, dry gas stream surrounds the cold
stream so that humid ambient air is never in contact with the gold gas. Otherwise ice
would slowly build up on the nozzle or the crystal. The velocities of the two gases
must be matched so that the flow is laminar past the sample position. The flow rate
36

ranges from 5 to 10 liters per minute (of cold gas), so that the velocity is 4 to 8 m/s
through the 5 mm diameter nozzle. The cold gas stream is positioned so that the
sample position is on the axis of the nozzle, 5 mm from the opening. A schematic of
the cryostream and sample is shown in Figure 3.1.
A previously-cooled crystal will already be mounted on a crystal mount, glued into a
goniometer base (Mitegen, Ithaca, NY, USA). A plastic cap is typically either
screwed, or held magnetically over the base and mount. In order to mount the crystal,
the cap was held with forceps and the vial/cap was withdrawn from the storage dewar.
It was then tipped horizontally, at which point any liquid nitrogen remaining in the cap
spilled out as the base was attached to the goniometer head. The cap was then
detached from the base and pulled away to expose the crystal to the cold gas stream.
During this final motion, there was no longer any liquid nitrogen in contact with the
sample, but the gas stream had yet to settle over it and reach steady state. This
allowed for the annealing due to warm gas entrained by the turbulent flow as the cap is
removed.
3.2.1 Imaging
Schleiren imaging allows for the visualization of temperature (or pressure) variations
in a transparent medium. A schematic of the system is shown in Figure 3.2. Light
emerges from a point source at A, and is collimated by a mirror at B. Parallel rays
travel across the imaging area at C, to a second mirror at D. The image of the point
light source is focused at E, onto the edge of a razor blade. A camera at F focuses on
37

the imaging area through the mirror at D, but half of the light coming from the image
Figure 3.1
A schematic representation of the cryostream is shown. Cold (typically 100 K)
nitrogen gas (light gray) flows out of the end of the cryostream nozzle (thick lines)
while ambient-temperature nitrogen gas flows out of a sheath surrounding the nozzle.
There is a region of laminar flow that extends past the nozzle, and the sample is
positioned in the cold gas in this region.
38

area is blocked out by the razor blade. This filtering gives rise to contrast variations
because regions of varying refractive index deflect the light either onto or away from
the razor blade.
For our experiments, the light source was a 150 W Schott Fostec Ace (Schott,
Southbridge, MA, USA), covered with aluminum foil, with a 50 um hole in the foil.
The mirrors were 114 mm diameter, f/8, with a surface accuracy of 1/8 wave from
www.e-scopes.cc. A goniometer head and Cryostream were positioned in the imaging
area, and the images were recorded with a digital camera.
3.2.2 Thermal histories
To record the temperature at the sample position during mounting, a thermocouple
with a very small bead was placed there. Since goniometer bases and mounts are
metallic, the thermocouple leads were coated with non-conductive glue. The glue was
applied so as not to increase the size (and thermal mass) of the thermocouple bead.
A chrome-constantan thermocouple from Omega Engineering (catalog number
CHCO-001) was connected to Labview (www.ni.com/labview) through a 6025e PCI
DAQ interface (National Instruments, www.ni.com), and positioned on a base, inside
a vial, as though it was a previously frozen crystal. Several mounting trials were then
carried out as the temperature was recorded.
39

Figure 3.2
A schematic representation of the apparatus used in schlieren imaging. Light from a
point source (A) is collimated and then refocused by two mirrors (B and D). A razor
blade (E) is positioned at the focus. A small refractive index variation in the imaging
area (C) will produce a deflection in the path of the light so that it is blocked either
more or less by the razor blade, giving sharp contrast to the image recorded by the
camera (F). Note that the camera has a separate lens system (not shown) focused on
the imaging area (C).
40
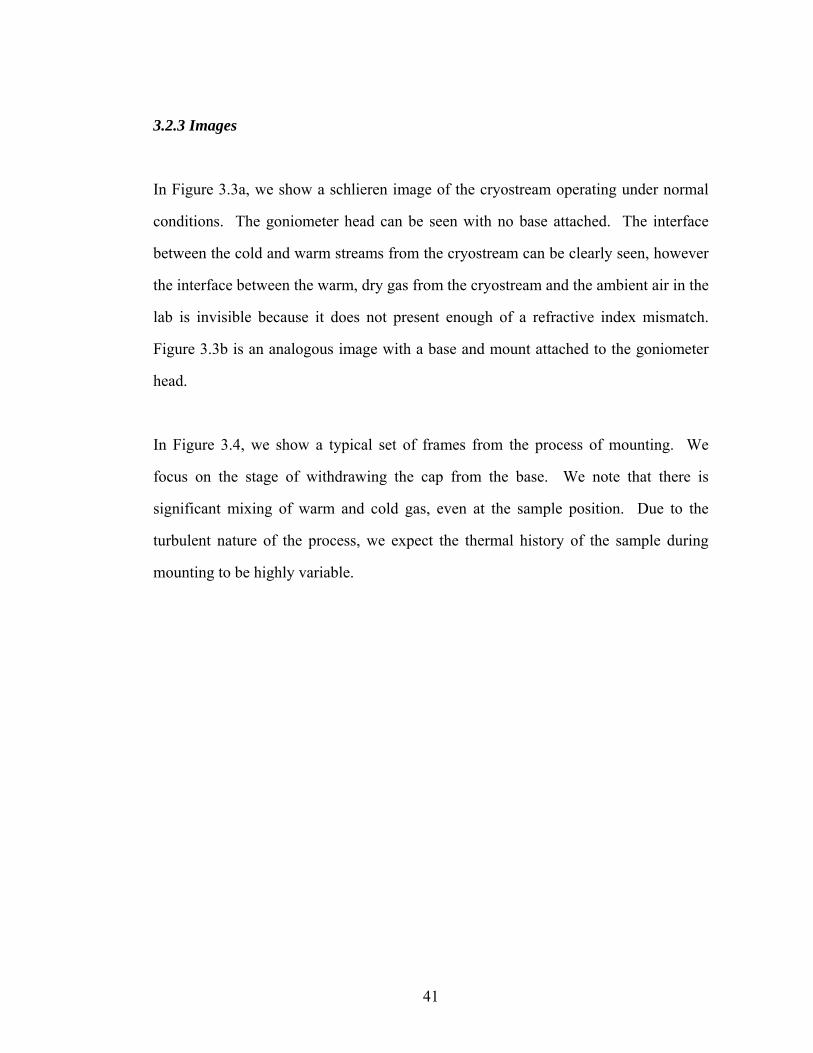
3.2.3 Images
In Figure 3.3a, we show a schlieren image of the cryostream operating under normal
conditions. The goniometer head can be seen with no base attached. The interface
between the cold and warm streams from the cryostream can be clearly seen, however
the interface between the warm, dry gas from the cryostream and the ambient air in the
lab is invisible because it does not present enough of a refractive index mismatch.
Figure 3.3b is an analogous image with a base and mount attached to the goniometer
head.
In Figure 3.4, we show a typical set of frames from the process of mounting. We
focus on the stage of withdrawing the cap from the base. We note that there is
significant mixing of warm and cold gas, even at the sample position. Due to the
turbulent nature of the process, we expect the thermal history of the sample during
mounting to be highly variable.
41

Figure 3.3
Schlieren images of the cryostream in operation. The goniometer spindle is visible in
a), and a base + mount can be seen attached to the spindle in b. It is evident that the
base + mount does not disturb the flow appreciably in steady state.
42

Figure 3.4
Schlieren images from successive frames of a video of mounting the base on the
goniometer head. As the vial is withdrawn, large disturbances in the cold gas flow are
observed, suggesting that the sample may come in contact with ambient-temperature
air.
43
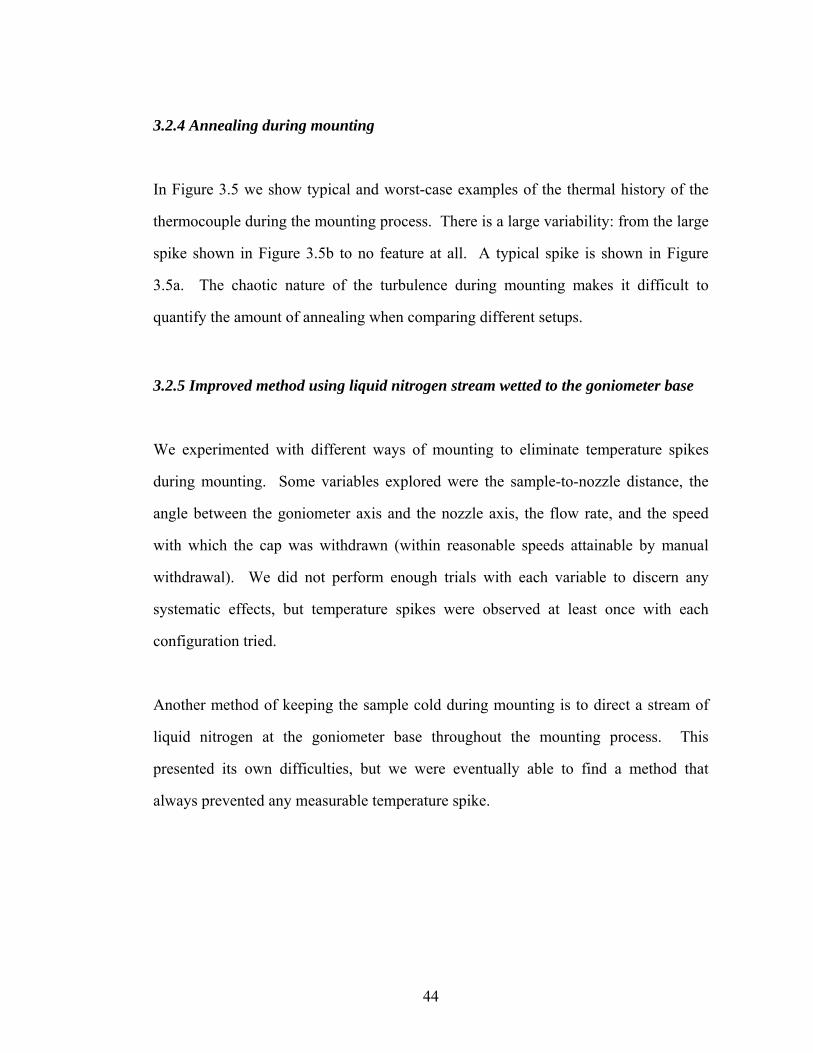
3.2.4 Annealing during mounting
In Figure 3.5 we show typical and worst-case examples of the thermal history of the
thermocouple during the mounting process. There is a large variability: from the large
spike shown in Figure 3.5b to no feature at all. A typical spike is shown in Figure
3.5a. The chaotic nature of the turbulence during mounting makes it difficult to
quantify the amount of annealing when comparing different setups.
3.2.5 Improved method using liquid nitrogen stream wetted to the goniometer base
We experimented with different ways of mounting to eliminate temperature spikes
during mounting. Some variables explored were the sample-to-nozzle distance, the
angle between the goniometer axis and the nozzle axis, the flow rate, and the speed
with which the cap was withdrawn (within reasonable speeds attainable by manual
withdrawal). We did not perform enough trials with each variable to discern any
systematic effects, but temperature spikes were observed at least once with each
configuration tried.
Another method of keeping the sample cold during mounting is to direct a stream of
liquid nitrogen at the goniometer base throughout the mounting process. This
presented its own difficulties, but we were eventually able to find a method that
always prevented any measurable temperature spike.
44
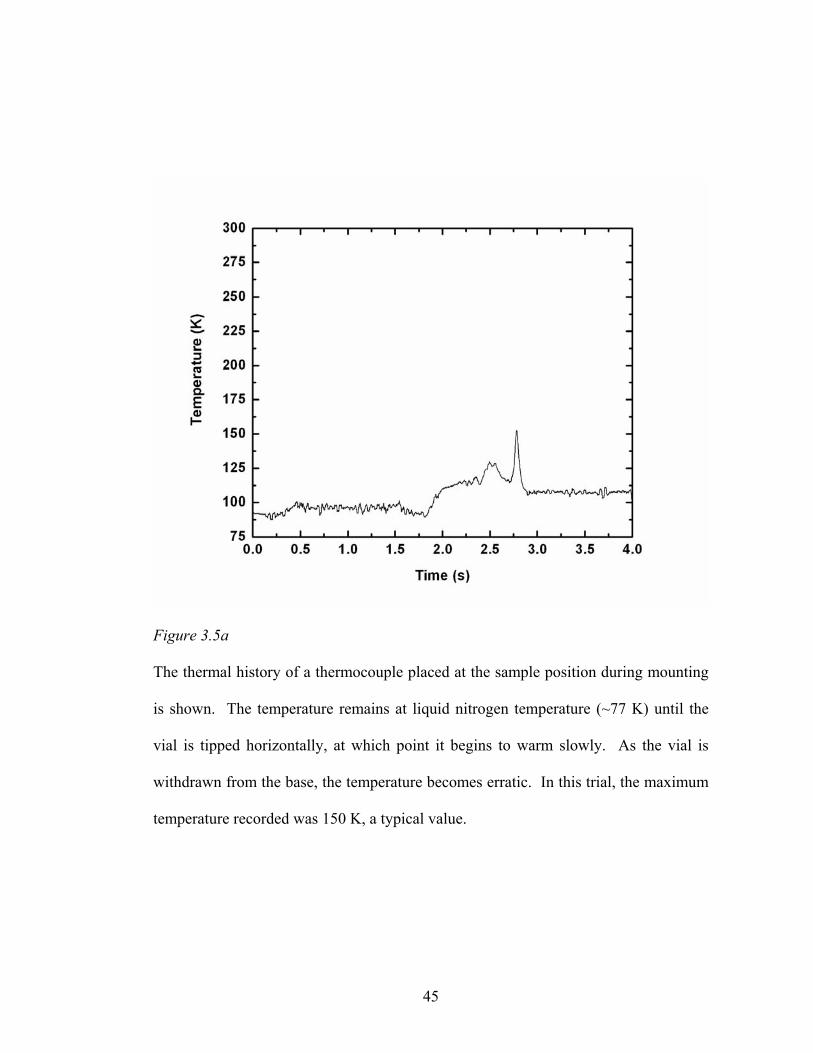
Figure 3.5a
The thermal history of a thermocouple placed at the sample position during mounting
is shown. The temperature remains at liquid nitrogen temperature (~77 K) until the
vial is tipped horizontally, at which point it begins to warm slowly. As the vial is
withdrawn from the base, the temperature becomes erratic. In this trial, the maximum
temperature recorded was 150 K, a typical value.
45

Figure 3.5b
A second trial identical to the one shown in Figure 3.5a is shown. In this case, the
sample temperature reaches 240 K.
46

If liquid nitrogen comes in contact with a room-temperature surface, it will not wet the
surface due to the boiling regime (a property of the liquid). Instead, a thin layer of gas
will form between the liquid and the warm surface. At lower temperatures, the liquid
will wet the surface, and cling to it because of surface tension. The temperature at
which the wetting transition occurs is called the Leidenfrost temperature (Incropera &
DeWitt, 2002).
This means that if the stream of liquid nitrogen is directed at a warm part of the
apparatus, it will simply slide off. If it instead is directed at a cold part (the pin of the
mount, or the pin of the base, for example), it will stick. An example of the type of
wetting desired is shown in Figure 3.6. If the stream is directed along the pin, it will
run all the way down to the end of the pin and keep the sample wetted. This ensures
that it remains at 77 K during the entire mounting process.
3.3 Discussion
The unintentional annealing of protein crystals during mounting is undesirable for
several reasons. When designing a cooling strategy, experimenters typically add
cryoprotectants (solutes that inhibit ice formation) (Garman & Mitchell, 1996; Chinte
et al., 2005; Berejnov et al., 2006). Once a sufficiently high concentration of
cryoprotectant is reached, no ice will be observed on cooling. However, the required
concentration decreases as the cooling rate increases. Small samples that can be
cooled rapidly require less cryoprotectant, or even none at all (Warkentin et al., 2006).
Since sample sizes vary from experiment to experiment, different amounts of
cryoprotectant will be required with each experiment. This unpredictability leads
47

experimenters to err on the side of caution, often using more cryoprotectant than is
necessary. Unintentional annealing adds to this variability, and exaggerates the
required cryoprotectant concentration.
If care is taken to cool a sample into a state far from equilibrium (perhaps by
hyperquenching (Warkentin et al., 2006) or at high pressure (Kim et al., 2007)),
annealing can allow the system to relax, undoing whatever effect the special protocol
might have had. For example, the thermocouple used in this study will cool at
~20,000 K/s during hyperquenching, and yet the re-cooling following unintentional
annealing in Figure 3.3 proceeds at 1,000 K/s.
The cooling process itself almost always produces disorder in the crystal. The amount
of disorder produced varies from sample to sample in an unpredictable way. If
methods of cooling are to be devised that reduce this disorder, it is important to reduce
variability as much as possible. Introducing an unknown amount of annealing into
each trial will add to the variability and confound the search for optimal cooling
protocols.
3.3.1 Sample size determines thermal response time
It is important that the reported thermal response of our thermocouples reflects the
actual thermal response of biological samples. In general, the thermal response is a
determined by properties of the sample and the surroundings. In particular, the
sample's thermal mass and conductivity are important, as well as its geometry. The
properties of the surroundings can be summarized in the boundary layer
approximation with a fixed heat transfer coefficient. In the limit of infinite sample
48

Figure 3.6
A photograph of a mounting method that prevents unintentional annealing is shown.
Liquid nitrogen emerges from a pipette tip and clings to the base. This technique can
be used to keep the sample wetted with liquid nitrogen during the entire mounting
process. Once the cryostream reaches steady state, the stream can be taken away.
49

thermal conductivity, the cooling rate is determined completely by the heat transfer
coefficient, the sample's surface-to-volume ratio, and the sample's thermal mass. It
has been shown that cooling of samples of the size under consideration take place in
this regime, both for metals and aqueous samples (Zasadzinski, 1988; Bailey &
Zasadzinski, 1991). We point out in addition that the volumetric heat capacities of
chrome and constantan (the materials comprising our thermocouples) differ from that
of water by less than 50 %.
If differences in volumetric heat capacities are ignored, then the thermal mass is
determined by the sample volume. Additionally, if all samples are assumed to be
spherical, then the thermal response is determined entirely by the size of the sample
size. These approximations will be valid to at least a factor of two for most protein
crystallography experiments, making the measured thermal histories a valid
comparison.
3.3.2 Comparison to previous work
Parkin & Hope, (1998) have measured sample temperature during the mounting
process and observed that no measurable annealing occurs. They used a home-made
thermocouple with 76 μm leads. They do not state the size of the junction however,
and the junction size determines the sensitivity of the probe (see previous section).
We can get an estimate of the response of their thermocouple based on its rise time. In
Figure 9a of their paper, the thermocouple warms at ~10 K/s once mounted in the
cryostream. This is the fastest temperature change they observe. By comparison, the
thermocouple we used cools at a rate of ~1000 K/s following the large temperature
50

spike shown in Figure 3.3 of this chapter. Based on this comparison, we conclude that
their thermojunction had a rise time approximately 100 times larger than the one used
in this study. This suggests that they could not have observed the thermal fluctuations
even if they were present.
Another difference in that study was the use of tongs for mounting, as opposed to vial
+ forceps. It is possible that tongs eliminate unintentional annealing, but this
conclusion cannot be drawn based on the Parkin & Hope study due to the limited
sensitivity of the thermocouple used in that study.
3.3.3 Effect of reducing sample size
As already mentioned, the sensitivity of a sample to its thermal environment is
determined almost exclusively by its overall size. In protein crystallography, there are
a number of reasons that smaller and smaller samples are being used. It is easier to
grow small crystals than it is to grow large ones. Most proteins simply do not
crystallize, but of those that do, few grow to sizes in excess of 100 - 200 μm.
Additionally, X-ray sources have become bright enough that a complete dataset can be
obtained from a 20 - 50 μm crystal in a reasonable amount of time. This means that
there is no need to work towards growing larger crystals. Finally, the sample size is
determined by the size of the crystal plus the volume of surrounding liquid. To obtain
the highest resolution datasets, practitioners work to eliminate as much surrounding
liquid as possible, because it contributes to the diffuse background in the diffraction
pattern obtained.
51
The importance of sample size has also been seen in the case of plunging into liquid
nitrogen in a dewar. As the sample size is reduced, cold gas above the liquid nitrogen
in the dewar becomes the determining factor in the cooling rate. This is because a
small sample (less than 100 μm) equilibrates with the cold gas in a time comparable to
the time required to traverse the cold gas layer. The solution in this case is simple:
blow the gas away using warm, dry nitrogen (Warkentin et al., 2006).
3.4 Conclusions
Size is the most important determinant of a sample's sensitivity to temperature
fluctuations. As the samples used in protein crystallography have gotten progressively
smaller, complications have arisen that were not present with larger samples. In this
study, we have examined the susceptibility of tiny samples to unintentional annealing
during the mounting process. We find that samples of size ~ 20 μm can warm to ~240
K during standard procedures. We have used schlieren imaging to show that the
source of this annealing is the chaotic nature of the cold gas during mounting. This
implies that even a robotic system will be unable to prevent the annealing. Finally, we
have demonstrated a simple method to eliminate the annealing completely, in every
case. We direct a stream of liquid nitrogen at the sample during the entire mounting
process.
52
REFERENCES
Bailey, S. M. & Zasadzinski, J. A. N. (1991). Journal of Microscopy-Oxford 163, 307-
320.
Berejnov, V., Husseini, N. S., Alsaied, O. A. & Thorne, R. E. (2006). Journal of
Applied Crystallography 39, 244-251.
Chinte, U., Shah, B., DeWitt, K., Kirschbaum, K., Pinkerton, A. A. & Schall, C.
(2005). Journal of Applied Crystallography 38, 412-419.
Garman, E. F. & Mitchell, E. P. (1996). Journal of Applied Crystallography 29, 584-
587.
Garman, E. F. & Schneider, T. R. (1997). Journal of Applied Crystallography 30, 211-
237.
Hanson, B. L., Harp, J. M. & Bunick, G. J. (2003). Methods in Enzymology, Vol. 368.
Macromolecular Crystallography, Pt C, pp. 217-235.
Harp, J. M., Hanson, B. L., Timm, D. E. & Bunick, G. J. (1999). Acta
Crystallographica Section D-Biological Crystallography 55, 1329-1334.
Harp, J. M., Timm, D. E. & Bunick, G. J. (1998). Acta Crystallographica Section D-
Biological Crystallography 54, 622-628.
Incropera, F. P. & DeWitt, D. P. (2002). Fundamentals of heat and mass transfer.
New York: J. Wiley.
Juers, D. H. & Matthews, B. W. (2004). Acta Crystallographica Section D-Biological
Crystallography 60, 412-421.
Kim, C., Hao, Q. & Gruner, S. (2007). Biophysical Journal 317A-317A.
Kriminski, S., Caylor, C. L., Nonato, M. C., Finkelstein, K. D. & Thorne, R. E.
(2002). Acta Crystallographica Section D-Biological Crystallography 58, 459-471.
Parkin, S. & Hope, H. (1998). Journal of Applied Crystallography 31, 945-953.
53

Pflugrath, J. W. (2004). Methods 34, 415-423.
Rodgers, D. W. (1994). Structure 2, 1135-1140.
Sanishvili, R., Nagarajan, V., Yoder, D., Becker, M., Xu, S. L., Corcoran, S., Akey, D.
L., Smith, J. L. & Fischetti, R. F. (2008). Acta Crystallographica Section D-Biological
Crystallography 64, 425-435.
Stevenson, C. E. M., Mayer, S. M., Delarbre, L. & Lawson, D. M. (2001). Journal of
Crystal Growth 232, 629-637.
Warkentin, M., Berejnov, V., Husseini, N. & Thorne, R. (2006). Journal of Applied
Crystallography 39, 805-811.
Zasadzinski, J. A. N. (1988). Journal of Microscopy-Oxford 150, 137-149.
54
55
CHAPTER 4
CRYOCRYSTALLOGRAPHY IN CAPILLARIES: CRITICAL GLYCEROL
CONCENTRATIONS AND COOLING RATES
4.1 Introduction
Capillary tubes have long been used to grow macromolecular crystals (Salemme,
1972; McPherson, 1982). They provide a convenient way of controlling crystallization
conditions and of handling and storing the resulting crystals. If thin-walled glass or
plastic capillaries are used, crystals can be examined in situ by X-ray diffraction.
A variety of growth methods can be implemented in capillaries, including equilibrium
dialysis (Zeppezauer et al., 1968), liquid counterdiffusion (Salemme, 1972), gel
acupuncture (García-Ruiz and Moreno, 1994), vapor diffusion along the capillary
(Sibille et al., 1991), and vapor diffusion through the capillary walls (Kalinin &
Thorne, 2005). Vapor diffusion rates along the capillary between liquid plugs can be
controlled by the choice of separating liquid or gas. When polymer capillaries are
used, vapor diffusion rates can be controlled by adjusting the wall thickness and
ambient humidity.
Crystal growth in capillaries is attracting renewed interest in the high-throughput era
as an alternative to growth in crystallization plates. Using conventional liquid handling
devices (Meldrum et al., 2000) or microfluidics (Li et al., 2006; Zheng et al., 2005;
Zheng et al., 2004; Zheng et al., 2003), a large number of small-volume crystallization
experiments can be conducted in a single capillary. Reagent volumes and the extent of
reagent mixing can be precisely controlled. The system described by Meldrum et al.
accurately dispenses volume increments as small as 0.3 nl in glass capillaries with an

inner diameter of 340 µm. The microfluidic system described by Zheng et al.
dispenses 10-100 nl volumes in glass or Teflon capillaries with diameters near 200
µm. Recent implementations replace free-standing capillary tubes with arrays of
capillary lines fabricated in a flat PDMS/Teflon or plastic "card".
An important reason for interest in capillary growth is the possibility of in-situ X-ray
examination of individual drops, both as a compliment to optical examination in
screening and for full structure determination. Well-faceted crystals are often poorly
ordered, and any crystals present in a drop may be visually obscured by precipitate or
by "skins" covering the drop surface. X-rays directly probe the presence of crystalline
order and the extent of this order, the properties of interest in crystallography. For X-
ray examination in capillaries, the capillary walls should be thin (typically 10 µm for
glass and 25-50 µm for polymers) and of an amorphous, isotropic material to
minimize background scatter. Thin-walled polyethylene terephthalate (PET), Kapton
and Teflon tubing with good optical and X-ray clarity is commercially available, and
unlike glass does not crack or shatter during handling (Kalinin et al., 2005).
In situ structure determination at room temperature is complicated by rapid
accumulation of radiation damage and by crystal slippage/sedimentation as the
capillary is rotated during data collection. Slippage can be reduced by removing
excess liquid (which is not practical when multiple drops are dispensed in a single
capillary) or by growing the crystals in gels (which increases background scatter.) The
obvious solution to these difficulties is to cool the crystals in situ to cryogenic
temperatures. Solidification of the solvent inside the crystals dramatically reduces
radiation damage rates, and solidification of the solvent outside the crystals
immobilizes them. In situ capillary cryocrystallography using crystals grown with
cryoprotectants and heavy atom compounds has been demonstrated for some model
proteins (Lopez-Jaramillo et al., 2001; Gavira et al., 2002; Ng et al., 2003). High
56

pressure freezing without cryoprotectants has also been demonstrated as a route to
structure solution in capillaries (Kim et al., 2007).
When cooling at ambient pressure, cryoprotectants such as glycerol, polyethylene
glycols, and 2-methyl-2,4-pentanediol are added to inhibit formation of crystalline ice,
both within the crystal and in the surrounding liquid. Ice creates diffraction rings that
obscure diffraction from the protein crystal, and growth of ice crystals can disrupt the
crystal lattice. Typical cryoprotectant concentrations required to inhibit crystallization
of the surrounding liquid are 20-30% w/v (Garman & Mitchell, 1996). In high-
throughput capillary growth, these cryoprotectants must be introduced with the
original mother liquor, and can thus constrain the search for optimal crystallization
conditions. Cryoprotectant concentrations required to prevent crystalline ice formation
can be reduced by cooling the sample faster (Chinte et al., 2005; Berejnov et al., 2006;
Warkentin et al., 2006) or by increasing the pressure (Kim et al., 2007).
Here we report the cooling rates achieved when thin-walled PET tubing containing a
glycerol-water solution is plunged into liquid nitrogen and into liquid propane, and the
corresponding minimum glycerol concentrations required to prevent crystalline ice
formation. Tubing diameters from 150 µm to 3.3 mm, covering the range of interest
for protein crystallography and cryopreservation, are examined. Maximum cooling
rates are significantly smaller and minimum glycerol concentrations and significantly
larger than can be achieved when crystals are cooled in standard loop or
microfabricated X-ray crystallography mounts (Warkentin et al., 2006). Combining
our results with those of previous studies, we find a nearly exponential dependence of
the minimum cooling rate for vitrification on glycerol concentration, spanning more
57

than five orders of magnitude in cooling rate. This relation provides a basis for
designing cryopreservation protocols.
4.2 Materials and Methods
4.2.1 Critical concentration measurements
One way to determine the efficacy of capillaries for cryopreservation is to measure the
minimum amount of cryoprotectant required for vitrification of water-cryoprotectant
solutions as a function of tubing diameter and wall thickness. Smaller diameters
should give larger cooling rates and require smaller cryoprotectant concentrations.
Optical assays have long been used to quantify phase separation and crystallization in
aqueous mixtures and in biological samples, especially during rapid cooling of small
volumes for which microcalorimetry measurements are extremely challenging.
Density fluctuations associated with the appearance of new phases produce refractive
index fluctuations that scatter light, and index variations of as little as 10-5 on scales of
roughly one-tenth the optical wavelength produce visible contrast and cloudiness.
Previous studies have explored the structural state (vitreous/amorphous or crystalline)
of rapidly cooled aqueous cryoprotectant solutions. If the sample vitrifies as it cools, it
remains transparent; if ice microcrystallites form, they scatter light and the sample
becomes cloudy (Luyet, 1957; Fahy et al., 1984; Garman & Schneider, 1997;
McFerrin & Snell, 2002, Chinte et al., 2005). The transition from transparent to non-
transparent occurs over a narrow range of glycerol concentration (less than 2%), if all
else is held fixed (Garman & Mitchell, 1996; Berejnov et al,. 2006). Although earlier
X-ray diffraction measurements suggested the presence of crystalline ice in optically
transparent samples (McFerrin & Snell, 2002, Chinte et al., 2005), more recent
58

measurements with more accurate evaluation of the first visual deviation from
complete transparency confirm that this deviation corresponds to a state change from
vitreous to microcrystalline, and limit any discrepancy between the optical and X-ray
deduced transitions to less than 2% in glycerol concentration (Berejnov et al., 2006).
The PET tubing used for all experiments was obtained from Advanced Polymers
(Salem, NH, USA), and has excellent X-ray transparency (Kalinin et al., 2005).
Tubing inner diameters ranged from 150 µm to 3.3 mm. Wall thicknesses were either
25 or 50 µm for diameters of 500 µm and larger, and either 12 or 25 µm for smaller
diameters. Open-ended pieces of tubing at least ten diameters long were completely
filled with water-glycerol solutions of increasing concentration, in increments of 2 %
w/v. The solutions were prepared by first weighing out the appropriate amount of
glycerol, and then thoroughly mixing in water to bring the total solution volume to the
desired value. Each solution’s refractive index was measured and indicated an error in
final concentration of less than 0.2 % w/v, or 10% of our concentration increment.
Each sample was then plunged at ~0.5 m/s into liquid propane or liquid nitrogen and
held horizontally until all boiling ceased. Sample transparency was determined by
holding the sample immediately above the liquid surface and observing it against a
black paper background with fiber optic illumination and a boom-mounted
stereomicroscope.. For each tubing diameter, the smallest glycerol concentration that
resulted in a completely transparent sample was recorded, as shown in Figure 4.1.
Liquid nitrogen was held in a glass hemispherical Dewar, 12 cm across and 8 cm deep
(Pope Scientific Inc, Saukville, WI, USA), with the liquid level maintained within 2
cm of the brim. Commercial liquid propane, (Coleman brand) was transferred from the
tank into a 50 ml centrifuge tube held under liquid nitrogen. Commercial propane is
safer (due to additives that give it a putrid smell) and cheaper than pure propane and,
because of impurities, freezes at a lower temperature. 10 ml of liquid propane was
59

poured from the tube into a custom aluminium trough roughly 10 cm long, 2 cm deep
and with 1 mm thick walls that was partially submerged in liquid nitrogen. The
propane’s temperature was measured using a chrome-constantan thermocouple
(CHCO-005, Omega Engineering), and remained in the range 90 to 95 K provided that
the liquid nitrogen level was kept halfway up the side of the trough.
For 150 and 200 µm diameter capillaries plunged in liquid nitrogen, the fastest cooling
was obtained by blowing away the cold gas layer that forms above the liquid using dry
room temperature nitrogen gas (Warkentin et al., 2006), and only those data are
reported. For larger capillaries, the cold gas layer had no effect on the critical
concentration. For plunging into liquid propane, the propane was held in a fume hood.
The flowing air kept the thickness of the cold gas layer small, and additional blowing
was not used so as to minimize warming of the liquid.
4.2.2 Cooling rate measurements
The temperature inside the capillary during cooling was measured using chrome-
constantan thermocouples with lead diameters of either 25 µm or 75 µm and bead
diameters of 80 µm or 125 µm, respectively (CHCO-001 or CHCO-003 Omega
Engineering). Thermocouple response times were measured by directly plunging into
propane and into nitrogen, and were much shorter than all measured cooling times of
liquid-filled capillaries.
For cooling rate measurements in capillaries, a thermocouple was threaded lengthwise
through the capillary to place its bead near the center. The capillary was filled with a
60 % w/v glycerol solution, which vitrifies for all cooling rates and thus does not
exhibit temperature anomalies associated crystallization and release of latent heat.
60

Figure 4.1
The concentration of glycerol in water required to obtain a completely transparent
sample upon plunging into either liquid propane or liquid nitrogen. PET tubing wall
thicknesses are 12.5 or 25 μm for diameters below 500 μm and 25 or 50 μm for larger
diameters.
61

These samples were plunged into the liquid cryogen as in the critical concentration
measurements. The thermocouple’s bead size and radial position should affect the
measured temperature. In practice, capillary time-temperature profiles for different
bead sizes and positions within the capillary were indistinguishable — within the
typical 20% trial-to-trial variation in measured cooling rates — down to the smallest
capillary sizes. This variation is small compared with the nearly three-order-of-
magnitude variation in cooling rate with tubing diameter. Temperature versus time
data were recorded by a 6025e PCI DAQ interface controlled by LabView
(http://www.ni.com/labview), both from National Instruments.
4.3 Results
4.3.1 Estimation of cooling rates
Figure 4.2 shows representative cooling curves for capillaries filled with 60% w/v
glycerol solution and plunged into liquid nitrogen or liquid propane. Because the
slopes of these curves are not constant, it is not immediately clear how to define the
relevant cooling rate. For propane, the cooling rate is highest immediately after the
sample enters the propane. For nitrogen, the cooling rate is largest midway through the
cooling process, just after the transition from film to nucleate boiling at ~200 K
(Incropera & DeWitt, 2002; Gakhar & Wiencek, 2005). The region of the cooling
curves most relevant to successful cryocooling will depend upon the properties of the
solution being cooled, as cryoprotectants decrease the homogeneous nucleation
temperature and increase the glass transition temperature. (Rasmussen & Luyet, 1970;
MacKenzie, 1977).
62

We thus estimated three different cooling rates, as shown in Figure 4.2. For cooling in
liquid propane (Figure 4.2c), we evaluated the average cooling rate from the initial
temperature down to T=150 K. The latter temperature was chosen because the glass
transition temperatures of most cryoprotectant solutions (MacKenzie, 1977; Harran,
1987) and of the solvents within protein crystals (Weik, 2001; Weik, 2004; Weik,
2005) are between 140 and 180 K. For cooling in liquid nitrogen (Figure 4.2d), there
are two distinct regimes of cooling. In the nucleate boiling regime at lower
temperatures, the liquid nitrogen directly contacts the sample and the cooling rate is
large. In the film boiling regime at higher temperatures, the cooling rate is roughly an
order of magnitude smaller due to a layer of vapor insulating the sample from the
liquid nitrogen. The transition between these two regimes occurs at the Leidenfrost
temperature. (Incropera & DeWitt, 2002). We thus evaluated the average cooling rate
in the film boiling regime from room temperature down to the Leidenfrost
temperature, and the maximum cooling rate just below this temperature in the nucleate
boiling regime. A fourth cooling rate (not shown in Figure 4.2) — the average cooling
rate in nitrogen from the initial temperature down to T=150 K — was also evaluated,
and is close to the average cooling rate in the film boiling regime.
Figure 4.3 shows the resulting cooling rates versus capillary diameter d. All cooling
curves show a smooth variation with tubing size. They are well fit by power laws
dT/dt ~ dα with exponents α of -1.75 for cooling in liquid propane, -1.46 for the film
boiling regime in liquid nitrogen, and -1.14 for the nucleate boiling regime in liquid
nitrogen. An exponent of 1 is expected if the cooling rate is dominated by the gas or
liquid boundary layer immediately adjacent to the tubing, while a value of 2 is
expected if the cooling rate limited by thermal diffusion (e.g., through the sample, or
through a coolant in which convection was unimportant) (Zasadzinksi, 1988; Bailey &
Zasadzinksi, 1991).
63

Figure 4.2
Representative cooling curves when capillaries containing 60% glycerol-water
solutions are plunged into liquid propane and liquid nitrogen. The slopes of the
straight lines give the cooling rates shown in Figure 4.3.
64

Figure 4.3
Cooling rates as a function of tubing diameter, for liquid propane and liquid nitrogen,
as estimated in Figure 4.2. Each data point represents an average over 5 to 10 trials.
The trial-to-trial variation was 10% (for larger diameters) to 20% (for smaller
diameters), and comparable to the height of the symbols used to mark the data.
65

4.3.2 Comparison to previous work
Previous studies of cooling using loop-mounted samples found cooling rates similar to
those reported here for similar size samples. Teng and Moffat (1998) examined 125
µm to 450 µm thick films of cryoprotected crystallization buffers suspended on 1.5
mm loops, and found cooling rates in gas streams, liquid nitrogen and liquid propane
ranging from 130 to 1200 K/s, depending upon the film thickness, the cooling agent,
and (in the case of liquid nitrogen) the boiling regime. These rates are in rough
agreement with the corresponding rates observed in a ~350 µm capillary shown in
Figure 4.3. Walker et al. (1998) found average cooling rates of 250 K/s and 750 K/s in
liquid nitrogen and liquid propane, respectively, for a rubber cement coated
thermocouple forming a spherical sample of diameter 0.7 mm. Interpolating the data
of Figure 4.3 to a capillary tube with 0.7 mm diameter gives cooling rates of 67, 338,
and 726 K/s for film-boiling liquid nitrogen, liquid propane, and nucleate-boiling
liquid nitrogen, respectively.
The material at the sample’s surface (aqueous solution in the case of loop mounted
samples, PET or glass for capillary mounted samples) affects the Leidenfrost
temperature and so should modify observed cooling rates in liquid nitrogen (Gakhar &
Wiencek, 2005). With a higher Leidenfrost temperature, the nitrogen near the
sample’s surface will enter the nucleate boiling regime sooner, and the cooling rate to
~150 K will be larger. For example, the Leidenfrost temperatures for the bare
thermocouples (chrome/constantan alloy surfaces) used by Gakhar & Wiencek (2005),
and by Warkentin et al. (2006), were 130-150 K, compared with nearly 200 K for the
PET covered samples here (see Figure 4.3). In addition, surface roughness can
influence the Leidenfrost temperature and the rate of heat transfer in the nucleate
66

boiling regime (Bald & Wang, 1976; Dhir, 1998), in both liquid nitrogen and (for
larger samples) liquid propane.
In the film boiling regime, the mechanism of heat transfer is comparatively well
understood. For a horizontally held cylinder of diameter d, Bromley (1950) derived a
heat transfer coefficient h ~ d-1/4. The cooling rate should then follow dT/dt ~ d-5/4.
Subsequent experiments revealed deviations from this power law at small diameters
that have been fit with more sophisticated empirical forms for h (Breen & Westwater,
1962; Baumeister & Hamill, 1967). Over the range of diameters examined here, these
forms can be approximated by h ~ d-7/12 (Bakhru & Lienhard, 1972). The cooling rate
in the film boiling regime is then dT/dt ~ d-1.58. The exponent is close to the value of -
1.46 observed here. A more detailed fit based upon the correlation of Baumeister &
Hamill (1967) gives even closer agreement with our experimental results.
4.4 Discussion
4.4.1 Implications for cryocrystallography in capillaries
Figure 4.1 indicates that successfully cooling protein crystals in capillaries at ambient
pressure will require large cryoprotectant concentrations to prevent crystalline ice
formation in the liquid surrounding the crystal. Even with 150 μm diameter tubing,
30% and 20% w/v glycerol will be required for cooling in liquid nitrogen and liquid
propane, respectively. Similarly large concentrations of other cryoprotectants can be
expected (Berejnov et al., 2006). For samples in this range of surface-to-volume ratios
that are cooled using these cryogens, it has been shown experimentally and
theoretically that the thermal conductivity of the sample does not affect the cooling
67

rate (Zasadzinksi, 1988; Bailey & Zasadzinksi, 1991; Kriminski et al., 2003), and so
these results will approximately hold for capillaries made from other materials as well.
Figure 4.1 suggests that more manageable cryoprotectant concentrations may be
achieved using 10 to 50 µm diameter capillaries. For a fixed pressure drop, the speed
of capillary flow varies as d4 (Poiseuille’s Law), so filling such small capillaries may
be problematic. Handling such tiny capillaries and obtaining useable diffraction from
the tiny crystals inside would also be difficult. Arrays of capillary tubes can be
fabricated in flat plastic sheets, but these have a much larger thermal mass per unit
length of capillary and a more unfavorable geometry for heat transfer than isolated
capillary tubes.
Compared with crystals on loops (Teng, 1990) or microfabricated mounts (Thorne et
al., 2003), performing cryocrystallography on crystals in capillaries presents
substantial difficulties. Large cryoprotectant concentrations are required to prevent ice
crystallization in the mother liquor surrounding the crystals. Much less cryoprotectant
is required to prevent ice formation within the crystal itself, because protein acts as a
excellent cryoprotectant at the concentrations found within the crystal (Kriminski et
al., 2002). For crystals in loops or on microfabricated mounts, surrounding mother
liquor can be wicked away or replaced with low-viscosity oil. For capillary-grown and
mounted crystals, removing or replacing this mother liquor without damaging the
crystal is not easy, and would be less-so in high-throughput applications where each
small-diameter capillary contains multiple samples. Furthermore, the mother liquor
typically has a much larger total mass and thermal mass than the crystals that grow
within it; the mother liquor + crystal have a much larger volume and thus a much
smaller surface to volume ratio than the crystal itself; and cylindrical capillaries have
1/3 the surface-to-volume ratio of equal volume spherical samples. As a result,
68

achievable cooling rates in capillaries are much smaller than for conventionally
mounted crystals, and penetrating cryoprotectants must be included in large
concentrations.
The surrounding mother liquor present in capillaries produces background scatter that
reduces a data set’s signal-to-noise and ultimate resolution. In batch growth, 1-3% w/v
of the initial growth solution (10-30 mg/ml) is protein, so that the maximum protein +
solvent mass that ends up within crystals is typically less than 5% of the total mass. A
100 × 50 × 30 µm crystal examined by a 100 µm X-ray beam in a 200 µm capillary
will typically have to compete with background scatter from surrounding liquid more
than ten times its own volume.
The large amount of surrounding liquid present in capillaries will exert non-uniform
stresses on the crystal during cooling, resulting from differences in thermal
expansion/contraction of the crystal, of the surrounding liquid and of the capillary
itself. Crystals with rod or plate-like shapes are likely to crack under these stresses,
broadening their mosaicities.
4.4.2 Critical Cooling Rate vs. Glycerol Concentration
The data in Figures 4.1 and 4.3 can be combined to estimate the minimum cooling rate
required to vitrify a given glycerol concentration, for a wide range of concentrations.
The critical cooling rate to achieve vitrification is an intrinsic property of the solution,
so it does not depend upon details such as sample geometry or coolant type, and
directly reflects the fundamental physics of glass formation in the water-glycerol
system. It can thus be used to design practical cryoprotection protocols in a variety of
biological applications. Figure 4.4 is a composite showing our results (taken from
69
Figures 4.1 and 4.3), results for high concentrations / slow cooling rates determined by
differential scanning calorimetry (DSC) on emulsified samples (Sutton, 1991), results
where cooling rates were estimated from the time between the initial plunge into liquid
nitrogen and the Leidenfrost transition to nucleate boiling (Berejnov et al., 2006), and
results for pure water (Brugeller & Mayer, 1980). Our data span a large range of
glycerol concentrations/cooling rates between those examined in previous studies. A
crude fit to the merged data (solid line in Figure 4.4) suggests a simple exponential
relation between glycerol concentration and cooling rate. The required cooling rate is
halved with the addition of each ~3% glycerol concentration increment.
In generating Figure 4.4 we have assumed that the cooling rate of a capillary filled
with 20-40% glycerol (data from Figure 4.1) is the same as the cooling rate of that
same capillary filled with 60% glycerol (data from Figure 4.3). For samples cooled
with liquid nitrogen or propane and having surface-to-volume ratios in the range
studied here, it has been shown experimentally and theoretically (Zasadzinksi, 1988;
Bailey & Zasadzinksi, 1991) that cooling rates depend upon the surface-to-volume
ratio, the heat transfer coefficient (a property of the coolant), and the volumetric heat
capacity of the sample. Similar cooling rates are obtained for samples differing in
thermal conductivity by three orders of magnitude. In our experiments, the small
difference in heat capacities of 20% glycerol and 60% glycerol solutions modifies
cooling rates by less than 10%, and the small difference in thermal conductivity
(~30%) is too small to affect our conclusions.
A potentially important issue in comparing cooling rate results from different
measurements is the residual crystalline ice fraction at which a sample is deemed
vitrified. Kresin & Korber (1991) reported measurements similar to Sutton's, using
70

DSC on emulsified samples. For Sutton's 59 % w/v sample, they estimate an ice
fraction of 0.023, and suggest that reducing the ice fraction to 10-6 would require a
cooling rate almost two orders of magnitude larger. The emulsion's drop size is also
important: Kresin & Korber estimate that bulk systems would require a factor of two
larger cooling rates than their 2.4 µm diameter droplets. Measurements of cooling
rates to vitrify pure water also have uncertainties associated with the residual
crystalline fractions.
In the X-ray diffraction experiments connecting the transparent to non-transparent
visual transition with the vitreous ice to crystalline ice transition, crystalline ice
becomes clearly noticeable when the ice ring intensity becomes significant compared
to the intensity produced by the amorphous ice fraction of the sample (Berejnov et al.,
2006). The minimum detectable crystalline fraction can be estimated from
measurements of scattered X-ray intensities from crystalline and amorphous samples
versus d spacing. The signal-to-background ratios at the ice ring d spacing for typical
amorphous and crystalline samples are ~1.5 and 10, respectively. If we assume a
minimum detectable ice ring intensity of 1/10 the background intensity from vitreous
ice, then this implies a minimum detectable crystalline ice fraction of roughly 0.01.
This is comparable the fraction estimated for Sutton’s experiment, but much smaller
than that in Kresin & Korber. Since the visual assay for crystallinity (Luyet, 1957;
Fahy et al., 1984; Garman & Mitchell, 1996) corresponds so well with X-ray
diffraction measurements (Berejnov et al., 2006), the values quoted by Sutton are most
appropriate for comparison to cooling rates determined here.
71

Figure 4.4
Minimum cooling rates to achieve vitrification of glycerol-water solutions as a
function of glycerol concentration. Data inferred from the present study, as well as
data for pure water and for glycerol-water solutions obtained in previous studies are
shown. The thin line corresponds to an exponential relation between cooling rate and
glycerol concentration.
72
4.5 Conclusion
We have determined the cooling rates of a glycerol-water solution inside thin-walled
capillaries when plunged into liquid nitrogen and liquid propane, and the
corresponding minimum glycerol concentrations required to prevent formation of
crystalline ice. These results can be combined to yield the minimum cooling rate to
achieve a vitreous sample as a function of glycerol concentration, a fundamental
property of the water-glycerol solution. For PET capillary tubes of diameters ranging
from 150 µm to 3.3 mm, the minimum required glycerol concentration is 20% and
30% for cooling in nitrogen and propane, respectively. These values are comparable to
those currently used in cryocrystallography practice, but are much larger than is
generally necessary to prevent ice crystallization within the crystal itself. Maximum
achievable cooling rates of 300 K/s to 7000 K/s are at least an order of magnitude
smaller than can be achieved using crystals on loop or microfabricated mounts. In situ
capillary cryocrystallography will thus likely involve higher cryoprotectant
concentrations, more crystal damage during cooling and much larger background
scatter from surrounding liquid, and so in most cases is unlikely to yield the highest
resolution structures. Its primary benefit will be in screening diffraction properties and
crystallization outcomes in high throughput capillary crystallization.
73

REFERENCES
Bailey, S. M. & Zasadzinski, J. A. N. (1991). Journal of Microscopy-Oxford 163, 307-
320.
Bakhru, N. & Lienhard, J. H. (1972). International Journal of Heat and Mass Transfer
15, 2011-2025.
Bald, W. B. & Wang, T. Y. (1976). Cryogenics 16, 314-315.
Baumeister, K. M. & Hamill, T. D. (1967). Mechanical Engineering 89, 79-88.
Berejnov, V., Husseini, N. S., Alsaied, O. A., & Thorne, R. E. (2006). Journal of
Applied Crystallography 39, 244-251.
Breen, B. P. & Westwater J.W. (1962). Mechanical Engineering Progress 58, 67-72
Bromley, L. A. (1950). Chemical Engineering Progress 46, 221-227.
Bruggeller, P. & Mayer, E. (1980). Nature 288, 569-571.
Chinte, U., Shah, B., DeWitt, K., Kirschbaum, K., Pinkerton, A. A., & Schall, C.
(2005). Journal of Applied Crystallography 38, 412-419.
Dhir, V. K. (1998). Annual Review of Fluid Mechanics 30, 365-401.
Fahy, G. M., Macfarlane, D. R., Angell, C. A., & Meryman, H. T. (1984).
Cryobiology 21, 407-426.
Gakhar, L. & Wiencek, J. M. (2005). Journal of Applied Crystallography 38, 945-950.
Garcia-Ruiz, J. M. & Moreno, A. (1994). Acta Crystallographica Section D-
Biological Crystallography 50, 484-490.
Garman, E. F. & Mitchell, E. P. (1996). Journal of Applied Crystallography 29, 584-
587.
74
Garman, E. F. & Schneider, T. R. (1997). Journal of Applied Crystallography 30, 211-
237.
Gavira, J. A., Toh, D., Lopez-Jaramillo, J., Garcia-Ruiz, J. M., & Ng, J. D. (2002).
Acta Crystallographica Section D-Biological Crystallography 58, 1147-1154.
Harran, D. (1978). Bulletin de la Societe Chimique de France Partie I-Physicochimie
des Systemes Liquides Electrochimie Catalyse Genie Chimique I40-I44.
Incropera, F. P. & DeWitt, D. P. (2002). Fundamentals of heat and mass transfer, 5th
ed ed. New York: J. Wiley.
Johari, G. P., Hallbrucker, A., & Mayer, E. (1987). Nature 330, 552-553.
Kalinin, Y. & Thorne, R. (2005). Acta Crystallographica Section D-Biological
Crystallography 61, 1528-1532.
Kida, M., Kikuchi, Y., Takahashi, O., & Michiyoshi, I. (1981). Journal of Nuclear
Science and Technology 18, 501-513.
Kim, C. U., Hao, Q., & Gruner, S. M. (2007). Acta Crystallographica Section D-
Biological Crystallography 63, 653-659.
Kresin, M. & Korber, C. (1991). Journal of Chemical Physics 95, 5249-5255.
Kriminski, S., Kazmierczak, M., & Thorne, R. E. (2003). Acta Crystallographica
Section D-Biological Crystallography 59, 697-708.
Li, L., Mustafi, D., Fu, Q., Tereshko, V., Chen, D. L. L., Tice, J. D., & Ismagilov, R.
F. (2006). Proceedings of the National Academy of Sciences of the United States of
America 103, 19243-19248.
Lopez-Jaramillo, F. J., Garcia-Ruiz, J. M., Gavira, J. A., & Otalora, F. (2001). Journal
of Applied Crystallography 34, 365-370.
75

Luyet, B. J. (1957). Proceedings of the Royal Society of London Series B-Biological
Sciences 147, 434-451.
Mackenzie, A. P., Derbyshire, W., & Reid, D. S. (1977). Philosophical Transactions
of the Royal Society of London Series B-Biological Sciences 278, 167-189.
McFerrin, M. B. & Snell, E. H. (2002). Journal of Applied Crystallography 35, 538-
545.
Meldrum, D. R., Evensen, H. T., Pence, W. H., Moody, S. E., Cunningham, D. L., &
Wiktor, P. J. (2000). Genome Research 10, 95-104.
Ng, J. D., Gavira, J. A., & Garcia-Ruiz, J. M. (2003). Journal of Structural Biology
142, 218-231.
Rasmussen ,D. & Luyet, B. (1970). Biodynamica 11, 33-44.
Salemme, F. R. (1972). Archives of Biochemistry and Biophysics 151, 533-539.
Sibille, L., Clunie, J. C., & Baird, J. K. (1991). Journal of Crystal Growth 110, 80-88.
Sutton, R. L. (1991). Journal of the Chemical Society-Faraday Transactions 87, 101-
105.
Teng, T. Y. (1990). Journal of Applied Crystallography 23, 387-391.
Teng, T. Y. & Moffat, K. (1998). Journal of Applied Crystallography 31, 252-257.
Thorne, R. E., Stum, Z., Kmetko, J., O'Neill, K., & Gillilan, R. (2003). Journal of
Applied Crystallography 36, 1455-1460.
Walker, L. J., Moreno, P. O., & Hope, H. (1998). Journal of Applied Crystallography
31, 954-956.
Warkentin, M., Berejnov, V., Husseini, N. S., & Thorne, R. E. (2006). Journal of
Applied Crystallography 39, 805-811.
76
Weik, M., Kryger, G., Schreurs, A. M. M., Bouma, B., Silman, I., Sussman, J. L.,
Gros, P., & Kroon, J. (2001). Acta Crystallographica Section D-Biological
Crystallography 57, 566-573.
Weik, M., Vernede, X., Royant, A., & Bourgeois, D. (2004). Biophysical Journal 86,
3176-3185.
Weik, M., Schreurs, A. M. M., Leiros, H. K. S., Zaccai, G., Ravelli, R. B. G., & Gros,
P. (2005). Journal of Synchrotron Radiation 12, 310-317.
Zasadzinski, J. A. N. (1988). Journal of Microscopy-Oxford 150, 137-149.
Zeppezauer, M., Eklund, H., & Zeppezauer, E. S. (1968). Archives of Biochemistry
and Biophysics 126, 564-573.
Zheng, B., Roach, L. S., & Ismagilov, R. F. (2003). Journal of the American Chemical
Society 125, 11170-11171.
Zheng, B., Tice, J. D., Roach, L. S., & Ismagilov, R. F. (2004). Angewandte Chemie-
International Edition 43, 2508-2511.
Zheng, B., Gerdts, C. J., & Ismagilov, R. F. (2005). Current Opinion in Structural
Biology 15, 548-555.
77

78
CHAPTER 5
CRITICAL DROPLET THEORY FOR NUCLEATION OF CUBIC ICE IN
AQUEOUS SOLTUTIONS
5.1 Introduction
The transformation of liquid water to crystalline ice is relevant to a wide range of
scientific fields. It is central to cryopreservation of cells and tissues (Mazur, 1970),
cryocooling of protein and virus crystals (Hope, 1988; Rodgers, 1994), or any field
that concerns itself with cooling biological systems to freezing temperatures.
Atmospheric science is affected by it because of its importance to cloud formation in
the upper atmosphere, which has implications for climate change (Baker, 1997).
Finally, it provides insight into nucleation and growth phenomena, which are of
fundamental interest to science. Water is also an exceptional example in many ways,
because of its many anomalous properties at low temperatures (Debenedetti, 2003).
Many studies have shed light on various aspects of the behavior of water below the
freezing point, but there is still much work to be done. Water converts to cubic ice
(ice Ic) very rapidly (in ~10 μs) near T = 200 K (Bartell & Huang, 1994), so many
experimenters have found ways to increase the timescale (hopefully) without
modifying the underlying phenomena to the point of irrelevance.
One important strategy is extrapolation from experimentally accessible temperature
ranges. The nucleation and growth of the hexagonal form of ice (ice Ih) has been
studied near the homogenous nucleation temperature of T ~ 240 K, where it occurs at

a manageable rate (Wood & Walton, 1970). As the temperature is lowered, the
nucleation rate increases rapidly, appearing to diverge at T = 228 K (Pruppacher,
1995). It is thus questionable whether any extrapolation to temperatures below 228 K
would be meaningful.
Amorphous solid water (glassy water) can be prepared by a variety of methods
(Angell, 2004), and it is metastable on laboratory timescales below T ~ 150 K (Hage
et al., 1994). Extrapolations to higher temperatures can provide additional
information. It is important to note that the phase of crystalline ice that is formed at
these low temperatures (and near ~ 200 K) is the cubic form (ice Ic). Given enough
time (and a large enough volume), ice Ic will convert to ice Ih, but ice Ic forms
comparatively more quickly, and can grow from a smaller nucleus (Johari, 2005). For
the purposes of this section, we will neglect the various differences that can exist
between different forms of amorphous water.
Another way to access the first stages of ice formation is by increasing the pressure.
In fact, at large enough pressures ice formation can be completely suppressed in pure
water. The same is also true of adding solutes (such as salts, sugars, polymers,
alcohols, etc.). This is perhaps not surprising, as there is a correspondence between
increased pressure and increased solute concentration in the thermodynamic phase
diagram of water (Koop, 2000).
Finally, ice formation can be slowed (or suppressed completely) by confining water to
~ nm-sized pores. Below a certain pore size, only cubic ice is observed, and at even
smaller pore sizes, ice formation is completely suppressed (Rault et al., 2003).
79

Based on these studies, it is generally accepted that ice Ic is the kinetically favored
form of ice, which has a stable nucleation radius of ~1 nm, while Ih is the
thermodynamically favored form, requiring a considerably larger nucleus. If the
conditions are almost (but not quite) sufficient to suppress ice formation entirely, ice
Ic forms, while ice Ih is found under more "natural" conditions. As a result,
understanding ice formation in general can be broken into two parts: first, an ice Ic
nucleus forms from liquid water and grows, second, the nucleus reaches a threshold
size and converts to ice Ih given sufficient time.
The goal of this study is to understand the first stage of ice formation: the nucleation
of ice Ic. We use solutes to slow the formation of ice to a measurable range, and the
rate of formation is determined for a range of solute concentrations and for a variety of
solutes. The rate is found to depend exponentially on the solute concentration, with a
different characteristic for each solute.
We use critical droplet theory to understand the exponential dependence of the
nucleation rate, by taking into account the osmotic pressure of the solution. This
approach is able to explain the observed dependence of nucleation rate on
concentration, giving a reasonable value for the one free parameter: the critical radius.
Unfortunately, when different solutes are compared, they each predict a different value
for the critical radius, and there is a correlation between solute size and predicted
critical radius. Two additions to the theory are discussed which can explain this
inconsistency. First, the differing sizes of the solutes in solution cause them to probe
different "apparent" critical radii. Second, there is the enthalpic contribution to the
free energy, which becomes dominant for large solutes.t
80

5.2 Experimental Methods
The rate of ice formation in each aqueous solution was determined by measuring the
critical cooling rate (CCR) above which no ice was observed on cooling in liquid
nitrogen. Below the critical rate, the sample turns opaque on cooling, indicating the
formation of polycrystalline ice. As the rate is increased, an abrupt transition to
transparent samples is observed.
It has been shown that this transition is abrupt, and corresponds to a transition in the
X-ray diffraction patterns obtained from the frozen samples (Berejnov et al., 2006).
Clear samples show diffuse rings characteristic of a glassy state, whereas opaque
samples show a sharp ring characteristic of a crystalline powder. The method used to
measure the CCR has been described elsewhere (Warkentin et al., 2008), and will be
summarized here.
Briefly, plastic tubing of varying diameter was filled with the solution of interest and
plunged into liquid nitrogen. The state (crystalline or amorphous) was determined
visually by noting the transparency or opacity of the frozen sample. Separately, the
cooling rate in each piece of tubing was determined using tubes filled with a 60 %
(w/v) solution by threading a thermocouple down the center of the tube and plunging
into liquid nitrogen.
For each tubing diameter, solutions in 2 % (w/v) increments were sequentially frozen
until the transition was observed, and the cooling rate in that tubing diameter was
recorded as the CCR for that concentration. Data for glycerol were taken from
81

Warkentin et al., 2008, and it should be noted that they were in agreement with
differential scanning calorimetry measurements from an earlier study in a higher
concentration range (Sutton, 1991). Additional data were obtained for ethylene
glycol, poly-(ethylene glycol) 200, dextrose, trehalose, dimethylsulfoxide (DMSO),
sodium chloride, methanol, ethanol, isopropanol, secondary butanol, and tertiary
butanol. Representative data are shown in Figure 5.1.
Two features are obvious in the figure. First, each solute shows an exponential
dependence of CCR on concentration. Second, each exponential extrapolates to a
value between 105 and 106 K/s for pure water, in agreement with the estimated value
for that quantity (Bruggeller & Mayer, 1980). This suggests that the CCR is in fact
exponential over the entire range of concentrations in which ice forms for every solute
tested.
5.3 Discussion
In Figure 5.1, it is clear that there is a simple exponential dependence of CCR on
concentration for every solute tested. This dependence appears to extend over the
entire range of concentrations. This suggests that a simple theory, encompassing all
solutes and concentrations, can be used to understand the mechanism of ice formation
in aqueous solutions. Since the exponentials extrapolate to the correct value for pure
water, the theory should encompass pure water as well.
82

Figure 5.1
The dependence of critical cooling rate (CCR) on solute concentration is shown for a
range of representative solutes. In each case there is an exponential dependence of
CCR on solute concentration.
83

5.3.1 Nucleation vs. growth
It is not immediately clear whether nucleation or growth is the rate limiting step
determining the CCR. We know, however, that as the cooling rate is increased there is
an abrupt (discontinuous) jump in both optical clarity and X-ray diffraction pattern. If
growth was the limiting step, we would expect to see a smooth transition from opaque
to transparent samples, as well as a smooth transition from amorphous-like to
crystalline-like diffraction patterns.
In Berejnov et al., 2006, diffraction patterns were recorded at concentrations either
just above or just below the opaque-to-transparent transition. They show that the
width of the primary diffraction peak increases by ~5 times on going through the
transition. Since samples with the narrower diffraction peak were also opaque, this
suggests the presence of ~ 100 nm crystallites, 1000 times larger than the critical
nucleation radius of cubic ice. What this means is that if a critical nucleus forms, it
grows to become very large.
One reason that this is sensible is that as the nucleus grows, it releases heat. Since the
cooling rate is not controlled (as in scanning calorimetry), this results in a much lower
cooling rate than would exist in the absence of a phase transformation. Because of
this effect, our experiment is highly sensitive to the formation of ice: if any forms at
all, the heat released causes much more to form.
Based on this reasoning, we will consider nucleation when modeling the data in Figure
5.1.
84

5.3.2 Critical droplet theory
Even if a new phase is energetically favorable, it will not necessarily form. The
system must cross an energy barrier, which is only possible when the barrier height is
of the same order of magnitude as the thermal energy. In case of phase
transformations, the energy barrier is often a barrier to the formation of a sufficiently
large cluster of the new phase, so that it is equally likely to grow as it is to shrink.
This cluster is called the critical nucleus. A very simple model describing this process
is critical droplet theory, or classical nucleation theory (Bradley, 1951; Buckle, 1961)
as follows.
The new phase is assumed to have a lower free energy ρ, per unit volume than the
original phase. This is what drives it to form in the first place. The barrier to
formation results from a free energy cost, σ, per unit area at the interface between the
two phases. Thus the total free energy of the formation of a cluster of the new phase
with radius R is given by
0 34 43G R 2Rπρ πσΔ = − + (5.1)
The free energy has a maximum for a cluster of radius
0 2cR σ
ρ= (5.2)
The free energy required to cross this maximum is the nucleation barrier. The rate of
crossing this barrier (in this case the nucleation rate) is proportional to the Boltzmann
factor associated with this energy:
(5.3) 0 /
0 ~ c BG k TK e−Δ
85

In our model, the free energy is modified to include the energy cost of excluding all
solute molecules from the critical nucleus. This cost is simply the osmotic pressure of
the solute:
3 24 443 3n
BG R R nkπρ πσ πΔ = − + + 3TR (5.4)
where n is the number density of solute molecules. The critical radius is modified to
2nc
BR nk T
σρ= − (5.5)
and the barrier height is: (5.6) 0 0 2( )n
c c c BG G V nk T O nΔ = Δ + +
where is the volume of the critical nucleus at zero concentration. The nucleation
rate at an arbitrary number density of solute can then be expressed as
0cV
(5.7) 0
0cV n
nK K e−=
This result implies that the concentration dependence of the nucleation rate is related
to the critical radius of pure water. Equation (5.7) can be fit to the data in Figure 5.1
to give a value of for each solute. The corresponding critical radii range from 7.3 to
12.2 Å, in good agreement with the best estimate available in the literature of 10
0cV
5± Å
(summarized in Zasetski et al., 2009). This indicates that the simple treatment just
described is a plausible explanation for the strong concentration dependence of the
nucleation rate.
2( )O n corrections to the free energy can be ruled out based on Figure 5.1. If the
various terms of that order (arising from the expansion that led to (5.6), the excluded
volume of the solute, and van der Waals attraction between solute molecules) are of
non-negligible magnitude, they must cancel out so that the sum is negligible, because
the data are well fit by straight lines. If second-order polynomials are fit instead, the
coefficients on the O(n) terms are essentially unchanged, giving essentially no
correction to the predicted value of . 0cV
86

Figure 5.2
The critical droplet theory of equation (5.8) predicts a critical radius that depends
strongly on solute radius, even after the solute radius has been taken into account. The
points in red are, from top to bottom, tertiary butanol, secondary butanol, and
isopropanol. One interpretation is that their non-polar methyl groups order a layer of
water around them of ~ 1 Å thickness, giving them a larger effective size.
87

5.3.3 Modifications to the simple theory
The most obvious correction that can be made to the model is to include the non-zero
size of the solute molecules. This is done by requiring that they be excluded from a
sphere of radius sR R+ where sR is the radius of a sphere with volume equal to that
occupied by one molecule in the pure substance. (This is equal to the molar volume
divided by Avogadro's number.) The resulting free energy is ( 33 24 443 3
nBG R R nk T Rπρ πσ πΔ = − + + + )sR (5.8)
The result of the calculation analogous to equations (5.5) through (5.7) is simply that
the critical radius is overestimated by precisely sR . The range of predicted critical
radii is reduced to 8.7 to 4.8 Å. This correction is plausible because larger molecules
do give larger estimates for , but there is still a residual dependence of predicted
critical radius to solute radius as shown in Figure 5.2. Note that isopropanol,
secondary butanol, and tertiary butanol appear to have larger radii than would be
predicted from their molar volume. One explanation for this is that they are largely
non-polar, and so they "order" a ~ 1 Å layer of water. We note that secondary and
tertiary butanol were barely soluble enough to make the measurements, and so they
may not be valid for that reason as well.
0cV
Another important correction to the theory is to include the non-zero heat of mixing of
the solute at the nucleation temperature, that is, ~200 K. Of course that quantity is
likely to be impossible to measure, but it is worthwhile to explore the implications of
including it in the theory. The free energy would be:
3 24 44 ( /3 3n
B AG R R n k T L Nπρ πσ πΔ = − + + + Δ 3)R
88

Where is the enthalpy of mixing at ~200 K, per mole of solute, and is
Avogadro's number. The result is that the predicted critical radius is off by a factor
LΔ AN
.
1/3/(1 )A
B
L Nk T
Δ+
which is greater than one for positive (exothermic) heats of mixing.
In the case of glycerol, ethylene glycerol, and 1,2-propanediol, the heat of mixing has
been taken into account for the study of ice nucleation, albeit in an unrelated regime,
by Boutron (1984). His interest in the heat of mixing was simply to correctly estimate
the amount of ice that had formed in calorimetry. In all three cases, the heats of
mixing are positive, and they lie in the range ~5 - 15 kJ/mol, and depend on solute
concentration and temperature.
The inclusion of the heat of mixing in the theory can explain the variation in predicted
critical radii apparent in Figure 5.2. First, a heat of mixing of ~4 kJ/mol is enough to
increase the apparent critical radius by 50 %, so the effect is large enough to explain
the variation. Second, the effect will be more pronounced for the larger solutes, since
the heat of mixing, will be larger per mole. This could explain the correlation between
solute size and apparent critical radius. However, with no detailed information on the
heats of mixing at that temperature, it is impossible to correct the data for this effect.
89

5.3.4 Comparison to previous work
Previous attempts to understand the critical cooling rates of glass forming substances
have used semi-empirical correlations. Recently, a large study correlated data for
nearly 100 different glass forming systems (Lu & Liu, 2003). Their finding was that
~ b x
g l
TCCR AeT T
γ γ− =−
(5.9)
where , , and x gT T Tl are the devitrification temperature, glass temperature, and melting
temperature, respectively. A and b are empirical constants that depend on the class of
glass forming system under consideration. (In their study, the three classes are
metallic glasses, glassy oxides, and cryoprotective aqueous solutions.) For
cryoprotective aqueous solutions, , and 105 10 K/sA = • 46.804b = − .
(We note that the Lu & Liu study made an error of factor 60 for the cryoprotective
solutions, because the references they cite all give CCR in K/min, whereas they used
K/s without making this correction, i.e. , which we will use.) 105 10 K/minA = •
Data for the glass and melting temperatures of glycerol solutions are available over a
wide range of concentrations (MacKenzie, 1977; Harran, 1978), however,
devitrification temperatures are only available for concentrations that can be vitrified
in sufficient volume for use in scanning calorimetry. Values of xT are available at 57
and 63 % (w/v), considerably above the concentration range studied here (Hey &
MacFarlane, 1996). Nevertheless, we can obtain a very crude estimate for xT from the
data available by simply assuming that there is a fixed temperature difference between
xT and gT of 9 degrees (the value at 57 % (w/v) glycerol). As we will show, the error
90

resulting from this assumption is irrelevant. The data used to calculate γ are shown in
Figure 5.3.
The predicted values of CCR are shown in Figure 5.4, along with the measured ones,
for glycerol solutions. It is clear that the Lu & Liu correlation works only in the limit
of highly concentrated solutions. We point out that the 25 data points in their study all
have CCR in the range , corresponding to very high concentrations of
cryoprotectant.
1 110 10 K/s− −
Of course, the most spectacular failure of the Lu & Liu correlation is for pure water,
for which they would predict a CCR of 30 K/s, at least four orders of magnitude too
low. This is most likely the explanation for the failure of the correlation to fit our data
as well: as the system becomes closer to the pure water limit, the discrepancy grows.
It should also now be clear that the crude estimate of xT used in Figure 5.3 is
irrelevant to that conclusion.
5.4 Conclusion
We have made critical cooling rate (CCR) measurements on a wide range of aqueous
solutions, at cooling rates up to 2 orders of magnitude larger than in previous studies.
The result is an unmistakable exponential dependence of CCR on solute concentration,
which appears to be valid all the way to zero solute concentration (pure water). A
simple theory which takes account of the osmotic pressure of the solution can explain
the exponential dependence, however it is not completely satisfactory because of a
remaining correlation of solute size to predicted critical nucleation radius.
91

Figure 5.3
The values for the melting temperature, glass temperature, and devitrification
temperature used to compute the critical cooling rates predicted by the correlation of
Lu & Liu, 2003 are shown.
92

Figure 5.4
A comparison between the measured critical cooling rates for each glycerol
concentration and values predicted by the correlation of Lu & Liu, 2003 is shown.
The correlation was formulated based on data for solutions of concentrations greater
than 50 % (w/v), and it clearly fails to predict critical cooling rates in solutions with
higher water content. All of the data on which the Lu & Liu correlation are based are
at cooling rates under 10 K/s, where the present data come closest to agreeing with the
correlation.
93

Nevertheless, the critical radius predicted for each solute is in good agreement with
the established value in the literature.
Compared to an empirical correlation based on scanning calorimetry, this theory
connects the CCRs of highly concentrated aqueous solutions (concentrations used in
scanning calorimetry) to the CCR of pure water. The failure of the empirical
correlation to encompass the data for pure water underscore the importance of a new
approach to understanding glass formation in aqueous systems.
94

REFERENCES
Angell, C. A. (2004). Annual Review of Physical Chemistry 55, 559-583.
Baker, M. B. (1997). Science 276, 1072-1078.
Bartell, L. S. & Huang, J. F. (1994). Journal of Physical Chemistry 98, 7455-7457.
Debenedetti, P. G. (2003). Journal of Physics-Condensed Matter 15, R1669-R1726.
Hage, W., Hallbrucker, A., Mayer, E., & Johari, G. P. (1994). Journal of Chemical
Physics 100, 2743-2747.
Hope, H. (1988). Acta Crystallographica Section B-Structural Science 44, 22-26.
Johari, G. P. (2005). Journal of Chemical Physics 122.
Mazur, P. (1970). Science 168, 939-&.
Pruppacher, H. R. (1995). Journal of the Atmospheric Sciences 52, 1924-1933.
Rodgers, D. W. (1994). Structure 2, 1135-1140.
Wood, G. R. & Walton, A. G. (1970). Journal of Applied Physics 41, 3027-&.
Rault, J., Neffati, R., & Judeinstein, P. (2003). European Physical Journal B 36, 627-
637.
Sutton, R. L. (1991). Journal of the Chemical Society-Faraday Transactions 87, 101-
105.
Berejnov, V., Husseini, N. S., Alsaied, O. A., & Thorne, R. E. (2006). Journal of
Applied Crystallography 39, 244-251.
Warkentin, M., Stanislavskaia, V., Hammes, K., & Thorne, R. E. (2008). Journal of
Applied Crystallography 41, 791-797.
Turnbull, D. & Fisher, J. C. (1949). Journal of Chemical Physics 17, 71-73.
Bradley, R. S. (1951). Quarterly Reviews 5, 315-343.
Lu, Z. P. & Liu, C. T. (2003). Physical Review Letters 91.
95

Mackenzie, A. P., Derbyshire, W., & Reid, D. S. (1977). Philosophical Transactions
of the Royal Society of London Series B-Biological Sciences 278, 167-&.
Hey, J. M. & Macfarlane, D. R. (1998). Cryobiology 37, 119-130.
Zasetsky, A. Y., Petelina, S. V., & Svishchev, I. M. (2009). Atmospheric Chemistry
and Physics 9 , 965-971.
96
97
CHAPTER 6
SLOW COOLING OF PROTEIN CRYSTALS
6.1 Introduction
X-ray crystallography performed on crystallized proteins is an essential tool in modern
structural biology. The structural data obtained depend upon the protein crystal's
temperature and thermal history. Protein crystals are typically grown at temperatures
between 277 and 300 K, and then flash cooled to T=100 K to reduce structural damage
caused by the X-rays (Hope, 1988; Hope, 1990; Rodgers, 1994; Garman & Schneider,
1997; Garman, 1999; Pflugrath, 2004). The cooling process increases the amount of
disorder within the crystal, most clearly manifested in large increases in mosaicity,
and this reduces the quality of the information about molecular structure that can be
obtained (Low et al., 1966; Singh et al., 1980).
Why and how cooling creates disorder in protein crystals is still not understood, but a
growing body of work has addressed this problem (Walker et al., 1998; Teng &
Moffat, 1998; Snell et al., 2002; McFerrin & Snell, 2002; Juers & Matthews, 2004a;
Gakhar & Wiencek, 2005). Crystal order at T=100 K has been examined using a
variety of methods including X-ray crystallography and X-ray topography (Kriminski
et al., 2002; Lovelace et al., 2006). Factors affecting this order including
cryoprotectant type and concentration (Mitchell & Garman, 1994; Juers & Matthews,
2004b), flash cooling protocol (Warkentin et al., 2006), application of high pressures
during cooling (Kim et al., 2005), and post-cool crystal annealing (Harp et al., 1998,
1999; Kriminski et al., 2002) have been examined.

Although nearly all protein crystallography is performed at T=100 K, X-ray data
collection at higher temperatures—especially between the solvent glass transition
temperature (~150-180 K) and room or body temperature—can provide information
about the protein's conformation, energy landscape and dynamics useful in
understanding protein function. A few studies have examined how protein and crystal
structure evolve with temperature, usually by flash cooling individual crystals from
room temperature to different final temperatures (Frauenfelder et al., 1979; Singh et
al., 1980; Chong et al., 2001; Edayathumangalam & Luger, 2005). These studies have
required large (~50%) cryoprotectant concentrations to prevent crystalline ice
formation below T~270 K, and these may have affected the protein structure and its
temperature evolution. Changes within individual flash-cooled crystals upon warming
from T=100 K toward 200 K have also been explored (Weik et al., 2001; Weik et al.,
2005).
Collecting usable diffraction data near T=200 K has proven particularly difficult
(Frauenfelder et al., 1979; Tilton et al., 1992; Rasmussen et al., 1992; Kurinov &
Harrison, 1995). For example, Tilton et al. reported that at T=200 K a ribonuclease A
crystal rapidly became opaque and ceased to diffract, despite the use of 50 % (v/v)
MPD. The only successes at this temperature used a methanol concentration of 75 %
(v/v) (Singh et al., 1980), or used crambin, an unusually small and dry protein crystal
system (Teeter et al., 2001).
The temperature-dependent properties of protein crystals depend upon both the protein
and the solvent. The protein molecules are fully (or nearly fully) hydrated, and their
packing leaves solvent-filled channels and pockets that are typically 15 – 30 Å in size
98
(and sometimes much larger.) Protein crystals are thus protein-solvent composites,
consisting of a regular lattice of protein molecules interwoven with a lattice of solvent-
containing channels. The temperature-dependent properties of the protein, the solvent
and their interaction must all be important in determining the temperature-dependent
properties of protein crystals.
Here we extend previous work by measuring the evolution of the diffraction properties
of a single protein crystal during cooling from 300 K to 100 K. We demonstrate that
crystals can be successfully cooled to 100 K without crystalline ice formation using
cooling rates of ~0.1 K/s, 103 to 104 times smaller than in previous studies, and even in
the absence of penetrating cryoprotectants. Successful slow cooling requires careful
removal of all external solvent, which otherwise will crystallize, generating intense ice
diffraction rings that obscure protein crystal diffraction, drawing solvent out of the
crystal (Weik et al., 2001), and seeding ice crystal growth within the crystal that
degrades crystalline order. Diffraction data can be collected continuously during
cooling, so that the evolution of crystal, protein and solvent properties can be
characterized as a function of temperature. Our method should be of particular use in
probing conformation changes such as in “kinetic crystallography”, where enzymatic
function is induced in the crystalline state and temperature variations can be used to
trap reaction intermediates (Bourgeois & Royant, 2005; Colletier et al., 2008,
Bourgeois & Weik, 2009). The present data also provides insight into the protein
glass/dynamical transition and into why crystal mosaicity increases during cooling.
99

6.2 Methods
Tetragonal crystals of thaumatin (MW = 24,000 Da, unit cell dimensions a = b = 58
Å, c = 151 Å, 56 % solvent, 25-35 Å diameter solvent channels) were grown
according to a standard recipe (McPherson, 1999). Protein from Sigma (Product no. T
7638, Lot no. 108FO299) was dissolved in 100 mM potassium phosphate buffer at pH
6.8 to a final concentration of 25 mg/ml. A well solution of 1.5 M sodium potassium
tartrate was prepared in the same buffer. In each well of a 24-well plate, a glass cover
slip with a hanging drop formed by mixing 5 μl of protein solution and 5 μl of well
solution was suspended above 500 ml of well solution, and the well sealed with
vacuum grease.
For the cryoprotectant soaks, solutions with glycerol concentrations of 10%, 20%,
30% and 40% (w/v) were prepared by mixing glycerol and well solution. Crystals
were serially soaked in solutions of increasing glycerol concentration until the desired
final concentration was reached. The crystal was allowed to equilibrate at
intermediate concentrations for ~ 1 minute and at the final concentration for between 5
and 10 minutes before further preparation.
Bulk solvent surrounding a crystal rapidly crystallizes during cooling through the
T=240 to 220 K temperature range, and must be completely removed for successful
slow cooling and X-ray data collection. Figure 6.1 illustrates the method used to
prepare crystals for slow cooling. ~300 μm crystals were transferred from their mother
liquor (the drop from which the crystal grew) or from a cryoprotectant soak to a large
drop of Paratone-n oil (Hampton Research, Aliso Viejo, CA, USA) (Figure 5.1a) or
NVH oil (Cargille Laboratories, Cedar Grove, NJ, USA), using a MicroMount
100

(Mitegen LLC, Ithaca, NY, USA) to minimize the transfer of excess mother liquor.
The mixture was stirred so that the crystals shed their surrounding solvent in a trail of
emulsified bubbles (Figure 5.1b). The crystals were then transferred to a fresh oil drop
and the process repeated until solvent trails were no longer visible. Pockets of solvent
often remained stuck to the crystal surface (Figure 5.1c), and were scraped off using a
MicroChisel (Mitegen LLC, Ithaca, NY, USA).
When this process was properly executed, the facets of the crystal became nearly
invisible (Figure 5.1d). The change was unmistakable and did not depend upon
illumination or magnification. We interpret this abrupt change in the appearance of
the crystal as follows. The refractive index of the solvent varies between ~1.33 (water)
and ~1.38 (40% glycerol); the refractive index of the crystal is likely near n~1.56
measured for tetragonal lysozyme (Cervelle et al., 1974); and the refractive index for
Paratone oil is likely near the n=1.52 of NVH oil (Cargille Labs, Cedar Grove, NJ,
USA). If there is a layer of solvent coating the crystal, it creates two interfaces — oil-
solvent and solvent-crystal — with large (Δn~0.15) refractive index steps. Since the
reflection coefficient of an interface is proportional to the refractive index difference,
light incident from either the oil or the crystal is strongly reflected at both interfaces.
When all the solvent has been removed (or at least when its remaining thickness is
much smaller than the illuminating light wavelength ~400 nm), the crystal is nearly
indexed matched with the oil, little reflection occurs at the oil-crystal interface, and the
crystal becomes nearly invisible. This simple visual test thus provides a very sensitive
probe of residual solvent.
101

Figure 6.1
Preparation of a thaumatin crystal for slow cooling. a) The crystal and surrounding
mother liquor are transferred to a large drop of Paratone-n oil. b) The crystal is stirred
to remove most of the external mother liquor. c) The remaining mother liquor, which
tends to form beads (indicated by the arrow), is scraped off with a MicroChisel. d)
When all the external solvent has been removed, the crystal becomes nearly invisible
in the oil, indicating that the solvent layer is no thicker than the wavelength of
illuminating light. The actual solvent layer is likely much thinner, because any
significant layer is unstable to beading on the surface.
102

A crystal thus prepared was captured together with a thick surrounding layer of
Paratone-n oil (to prevent dehydration during the initial stages of the experiment) in a
500 μm – 1 mm nylon Cryoloop (Hampton Research, Aliso Viejo, CA, USA) (Figure
6.2). The sample was immediately placed on a goniometer head and a T=300 K
nitrogen gas stream produced by an Oxford Cryosystems 600-Series Cryostream was
directed at it. The Cryostream was programmed to cool the sample at 0.1 K/s, and the
X-ray data collection software programmed to repeatedly collect five 1° oscillation
frames over the same five-degree wedge. A computer running Cryopad software
(Oxford Cryosystems) and connected to the Cryostream controller logged the gas
stream temperature, so that the temperature for each X-ray frame could be obtained by
matching time stamps in the frame file header and in the temperature log file. Cooling
and data collection continued until the Cryostream temperature reached 100 K, 34
minutes after the start of cooling.
To verify that radiation damage did not significantly affect our results, the same X-ray
dose was delivered as during cooling from T=300 K to 100 K, but with the
temperature held fixed at 300 K. Radiation damage for a given dose is approximately
50 - 100 times larger at 300 K than at 100 K (Kmetko et al., 2006), so that the
radiation damage measured at 300 K sets an upper bound on the damage incurred
during cooling experiments. The dose was measured using an ion chamber at the end
of the collimator, which was calibrated at the beginning and end of the experiment.
The delivered dose increased the unit cell volume by 0.02 %, the mosaicity by 0.04°,
and the B-factor by 1.5 Å2. These changes are small compared with those induced by
cooling.
103

This control experiment for radiation damage also serves as a control for dehydration,
since water's vapor pressure and the dehydration rate are largest at T=300 K; they are
insignificant at (and below) T=250 K, where the vapor pressure is a factor of 35
Figure 6.2
A thaumatin crystal prepared as in Figure 6.1 and then mounted in a 1 mm Cryoloop
with a large drop of oil, at (a) T=300 K and (b) after slow cooling to T=100 K. During
slow cooling the surrounding oil becomes cloudy, indicating formation of a crystalline
phase (see text). The thick oil layer prevents crystal dehydration.
smaller. Dehydration decreases the unit cell volume and usually has little effect on
mosaicity except at large dehydrations (Kriminski et al., 2001). No evidence of
dehydration-induced cell volume changes were observed in our control experiment, or
for a sample held for one hour at T=300 K before irradiation. The thick (~500 μm)
Paratone-n layer surrounding the crystal provides an excellent vapor barrier.
104

Several other approaches were explored before settling on the sample preparation
protocol described above. Mother liquor surrounding the crystal can be removed by
allowing it to slowly evaporate either in air or (for much slower removal) through a
very thin layer of oil while the sample is observed under a microscope. Unlike with
direct mechanical removal of the mother liquor, evaporation leaves behind non-
volatile salts that can crystallize, producing diffraction that interferes with that from
the protein. For protein crystals grown from high-salt mother liquors (e.g.,
ribonuclease A grown in 4 M sodium chloride), salt crystal diffraction is observed on
cooling even when surrounding mother liquor is mechanically removed, possibly
because cooling decreases the salt's solubility below the crystal’s initial salt
concentration.
The high-viscosity Paratone-n oil used to remove mother liquor from the crystal
surface and prevent dehydration also helps prevent sample motion during data
collection at higher temperatures. Thick layers of less viscous oils (e.g., mineral and
perfluoro(poly)ether oils) allow too much motion. Even with Paratone-n oil, the first
few high-temperature X-ray frames sometimes indicated large (~5 degree) crystal
motions. Pausing for ~5 minutes after mounting, centering and rotating the sample to
the intended data collection angle before collecting frames minimized these motions.
Paratone-n oil has one significant disadvantage that was not recognized until after the
bulk of our data collection was complete. As will be discussed later, when slowly
cooled to T~255 K, a small fraction of the oil forms a microcrystalline phase that
produces two sharp diffraction rings at 4.46 and 3.96 Å. These rings can be avoided
either by rapidly cooling to below T255 K, or by using NVH immersion oil (Cargille
105
Labs, Cedar Grove, NJ, USA), which is also highly viscous but does not crystallize at
cooling rates of 0.1 K/s (data not shown.)
Another approach to preventing dehydration during slow cooling is to enclose the
sample together with a plug of mother liquor in MicroRT tubing (Mitegen, Ithaca, NY,
USA) or in a glass X-ray capillary. Thick oil layers and associated crystal slippage can
be eliminated. Using a liquid plug with a vapor pressure slightly lower than that of the
mother liquor, the water surrounding the crystal can be evaporated without excessively
dehydrating the crystal, eliminating the need for mechanical solvent removal.
However, because the tubing/capillary length is comparable to or larger than the
diameter of the Cryostream's gas stream, ice crystals tend to condense from the
ambient air onto tubing outside the stream. Large temperature gradients across the
tubing drive transport and condensation of water from the warmer liquid plug onto the
colder sample, and this water eventually crystallizes. These difficulties can be
overcome by expanding the cold gas stream or by shortening the tubing so that the
tubing fits entirely within the constant-temperature portion of the stream.
X-ray data were collected at beam line A1 of the Cornell High-Energy Synchrotron
Source (CHESS) by a Quantum 210 detector (ADSC, Poway, CA) running in binned
mode using ADSC Quantum data collection software. Each five-degree wedge of data
was independently analyzed using Denzo and Scalepack (Otwinowski & Minor, 1997)
to determine unit cell parameters, mosaicity and Wilson B-factor. The Wilson B-
factor was determined by a fit to the intensity vs. resolution data in the output of
Scalepack, with a low-resolution cutoff of 4 Å.
106

6.3 Results
Thaumatin crystals survive slow-cooling to T=100 K, with or without a soak in 40%
glycerol, and exhibit low temperature diffraction properties that are comparable to or
better than flash cooled crystals. Figure 6.3a shows diffraction patterns acquired from
a single thaumatin crystal at four different temperatures as it was cooled. The crystal
contained no cryoprotectants, and the only solutes present in the mother liquor were
the buffer and 1.5 M sodium-potassium tartrate. Figure 6.3b shows diffraction patterns
from a second slow-cooled thaumatin crystal differing only in that it was first soaked
in mother liquor + 40 % (w/v) glycerol.
Neither set of diffraction patterns shows any qualitative change on cooling, except that
two sharp rings suddenly appear at T~255 K. These rings indicate that a crystalline
phase has formed, but their positions do not correspond to those for ice. Their sudden
appearance is not reflected in any change in the properties (unit cell, mosaicity, B-
factor) of the protein crystal, but coincides with a slight clouding of the oil
surrounding the sample, visible at T=100 K in Figure 6.2b. When a drop containing
only Paratone-n oil is slow cooled, identical diffraction rings form at the same
temperature, but no rings are observed when the drop is flash cooled. These results
suggest that the rings are an artefact of slowly cooling the oil, and that the crystalline
phase responsible does not interact with the protein crystal in any way.
Figure 6.4 shows the unit cell volume, mosaicity, and Wilson B-factor for two slow-
cooled thaumatin crystals, one taken directly from the mother liquor and one soaked in
a cryoprotectant solution. These quantities change most rapidly above T~200 K, and
are more weakly temperature dependent below that temperature. At T=100 K, the
107
mosaicities are 0.15° and 0.20° for the as-grown and 40 % glycerol samples,
respectively. All of the mosaicity increase on cooling to T=100 K occurs between
T=300 K and T~200 K; the mosaicity is constant below 200 K.
The B-factor in Figure 6.4c decreases on cooling, indicating a reduction in thermal
motions. For the glycerol-free sample, there is an abrupt change in slope dB/dT at
T~210 K. Below T~180 K in both glycerol-free and glycerol-containing samples, the
B-factor varies linearly with temperature with a slope of 3 · 10-5 Å2/K. As discussed
below, the slope change is a signature of the protein dynamical transition (glass
transition) and the value of the slope below T=180 K in principle provides information
about the protein’s potential energy landscape.
Figure 6.5 shows how the diffuse X-ray background varies with temperature. The low-
resolution diffuse intensity is clearly reduced at low temperatures. When this intensity
is plotted versus temperature (data not shown), it also changes most rapidly above
T~200 K, is relatively constant below that temperature, and shows an abrupt change in
slope near T~210 K. Arrows in Figure 6.5 indicate the expected positions of Ih
(hexagonal) and Ic (cubic) ice diffraction, but there is no evidence of either phase.
108

Figure 6.3
Diffraction images acquired at T=300 K, 255 K, 190 K and 100 K during slow cooling
of (a) a thaumatin crystal prepared from its mother liquor; and (b) a thaumatin crystal
first soaked in 40 % (w/v) glycerol/mother liquor solution. Although diffraction rings
from the Paratone oil appear at 255 K, the crystal’s diffraction quality does not visibly
degrade and no evidence for ice appears during slow cooling.
109

Figure 6.4
Relative cell volume, mosaicity and Wilson B-factor of native and 40% w/v glycerol-
soaked thaumatin crystals versus temperature during slow cooling. (a) The unit cell
volume for both samples rapidly contracts above ~200 K, and contracts more modestly
below 180 K. The contraction is anisotropic above 200 K but becomes isotropic below
110

180 K (see Figure 6.6.) The cell volume for both samples is referenced to an arbitrary
value midway between their respective initial cell volumes. (b) The mosaicity
increases most rapidly in the temperature range where the lattice contraction is both
rapid and anisotropic. (c) The B-factor decreases with decreasing temperature. The
abrupt change in slope at ~210 K (marked by an arrow) for the as-grown sample is
evidence of a dynamical transition in the protein.
Figure 6.5
The azimuthally-integrated X-ray background intensity versus resolution for the as-
grown and 40 % (w/v) glycerol thaumatin crystals, at temperatures (from top to
bottom) of 300, 250, 210, 170, 140 and 100 K. The data for the glycerol-soaked
111

crystal is shifted down by 25 for clarity. The large peak at 5.2 Å is diffuse scatter from
the Paratone-n oil, and the sharp rings are due to a crystalline phase that forms within
the oil during slow cooling. Arrows indicate the expected d values for Bragg scattering
from ice Ih or Ic would be expected. Most of the decrease in the diffuse scatter at low
resolution on slow cooling occurs above T=200 K, roughly tracking the behavior of
the B factor in Figure 6.4c.
6.4 Discussion
6.4.1 Slow cooling gives high diffraction quality without penetrating cryoprotectants
or high pressures
Slow cooling with no cryoprotectants — at rates 103 to 104 times smaller than are
achieved in flash cooling — yields thaumatin crystal mosaicities at T=100 K that are
as good as or better than have been obtained using any other method. The mosaicity of
the as-grown (cryoprotectant-free) crystal in Figure 6.3a increased from 0.08° to 0.15°
on cooling to 100 K. Of the four slow-cooled thaumatin crystals examined (two at 0%
glycerol, one at 30% glycerol and one at 40% glycerol), the average T=100 K
mosaicity is 0.2°. This can be compared with a typical mosaicity of 0.4 to 0.5° for
thaumatin crystals that have been flash cooled in our lab using conventional methods.
These results can also be compared with those of Kim et al. (2005), who examined
penetrating cryoprotectant-free thaumatin crystals that were cooled under high
pressures (up to 200 MPa) to prevent hexagonal ice formation. The average mosaicity
for the four thaumatin crystals studied was 0.3°, and the smallest mosaicity obtained
was 0.11°, much smaller than was obtained by Kim et al. using conventional flash
112

cooling. The crystals were coated in NVH oil to prevent dehydration during
pressurization — which removed external solvent — and the apparatus and cooling
protocol gave relatively slow cooling rates — perhaps at 1-10 K/s. Our results show
that high pressures were not needed to prevent ice crystallization within the crystals,
and that the improved mosaicities may have been primarily due to external solvent
removal by the oil, suppression of ice formation by the protein, and slower cooling.
High pressures may then only be necessary for crystals with very high solvent contents
and large solvent channels (at least larger than the ~35 Å in thaumatin), where the
protein alone may provide inadequate cryoprotection.
6.4.2 How much ice is present in slow-cooled crystals?
The diffraction data in Figure 6.5 shows no evidence for the ice rings expected from
either Ih (hexagonal) or Ic (cubic) ice, the two phases that can form at ambient
pressure. As discussed above, the two observed peaks/rings are not due to ice, and are
present when drops containing only Paratone-n oil are cooled. However, the smaller of
the two oil-related peaks lies very close to the expected position of the low-resolution
peak from ice Ic, and so could obscure the presence of a small amount of that ice
phase.
The presence of ice Ic could be revealed in at least two ways. First, Ic has a strong
second-order peak at 2.19 Å with an intensity 0.41 times that of the primary peak. No
peak is observed at this position (indicated by an arrow) in Figure 6.5. Second, the
abrupt formation of cubic ice at some temperature should abruptly change the intensity
ratio between the large and small Paratone-n peaks. No such change is observed.
113

An upper bound on the ice fraction present within our samples can be estimated as
follows. The total number of scattered X-rays (into all of k-space) from a given
crystalline phase is proportional to the total integrated electron density in that phase
that is illuminated (in real space) by the X-ray beam. Provided that a representative
region of k-space is examined, the ratio of the diffraction intensity from the two
phases is equal to the ratio of the number of electrons in each phase. For our estimate,
we include all diffraction collected in a series of five 1° oscillation frames to a
resolution of 1.8 Å, which includes the positions of all integrable reflections from the
protein and the first three rings from cubic ice. The total number of detected X-ray
photons contained in the protein peaks is computed for each frame (as the sum of
integrated peak intensities from Denzo), and varies by roughly 10% between frames.
This total, averaged over five frames, is ~2 ×10⁶ "intensity units" (as reported in the
dark-corrected image file produced by the ADSC Q-210 detector software). This total
is then used as an estimate of the total number of the illuminated electrons that are
associated with the protein (in arbitrary units). Any disorder in the protein or its lattice
shifts intensity from the peaks to the diffuse background, and so this is an
underestimate.
Figure 6.5 shows the X-ray intensity measured in a given resolution shell (one pixel
wide), averaged over 5 frames / 5° in φ (sample rotation), versus resolution. Pixels
within a 10 × 10-pixel square centered on the position of each reflection (obtained
from Denzo's .x output files) were omitted from the average A smooth fit to the
background gives an estimate of the fluctuations (from all sources) in this averaged
value of 0.1 “intensity units” per pixel. The ice Ic detection limit is proportional to this
fluctuation level. It is inversely proportional to the grain size of the cubic ice, which
114
determines the number of pixels over which ice diffraction is spread and thus the ice
intensity in each pixel.
Consider the as-grown thaumatin sample. Using the Scherrer equation, the width of
the powder ring (on the detector, in pixels) expected from microcrystallites of a given
size can be calculated. If cubic ice with a grain size of 15 nm is present, then its first
and second order reflections will illuminate approximately 105 pixels on the detector,
including those pixels within each powder ring's FWHM. If detecting the ice requires
an extra 0.1 “intensity units” in each of these pixels, then ~104 intensity units must be
scattered from cubic ice to be detectable. The total integrated intensity per frame from
protein for this sample was ~106, giving an order-of-magnitude upper bound for the
ice fraction of less than 1 %. If the ice instead has a grain size of 150 nm, then the
detection limit according to this crude estimate would be 0.1 %.
6.4.3 Why can crystals be slow cooled without cryoprotectants?
Key to the successful slow cooling of thaumatin crystals is the surprising fact that no
ice forms within them, even when no penetrating cryoprotectants are used. Previous
measurements on aqueous glycerol solutions (Sutton, 1991; Berejnov et al., 2006;
Warkentin et al., 2008) have shown that glycerol concentrations of at least 50 – 60 %
(w/v) are required to prevent ice formation at cooling rates of 1 K/s. Extrapolating to
the present cooling rate of 0.1 K/s implies that the protein and salt (derived from the
1.5 M sodium-potassium tartrate of the mother liquor within thaumatin crystals) is as
effective in inhibiting ice formation as 70% w/v glycerol. Sartor et al. (1995) have
determined the minimum cooling rates needed to prevent ice formation in hydrated
protein powders. For hydration levels of 0.56 to 0.73 (mass water/mass protein), the
115

required cooling rates were 25 K/s to 4 K/s. The hydration level in thaumatin (1.22) is
much larger, and the required cooling rate is much smaller. This suggests that regular
crystalline packing of the protein increases its ability to inhibit ice nucleation.
Experiments on pure water in porous glass found that crystalline ice only forms in
pores larger than ~25 Å. (Rault et al., 2003). In experiments on protein crystals,
crystalline ice formed from vitrified solvent on warming from 150 K to 200 K in
crystals with solvent channels 65 Å or larger, but no internal ice formed in crystals
with solvent channels smaller than 20 Å (Weik et al., 2001; Weik et al., 2005).
Because the first hydration layer behaves very differently from bulk water, a protein
crystal’s effective pore/channel size for nucleation is reduced from its geometric
value. Thus, the channel diameter of thaumatin crystals (25 – 35 Å) may be smaller
than is required for nucleation of cubic ice on our experimental timescales.
6.4.4 Origins of disorder on cooling
The mechanisms that create disorder on cooling should be affected by cooling rate.
Slower cooling allows more time for ice crystal nucleation and growth (and perhaps
other processes) that degrade protein crystal diffraction properties, and this has been
the most important obstacle in previous diffraction studies of slow-cooled crystals. On
the other hand, slower cooling reduces thermal gradients within the crystal and
associated crystal strains that can drive cracking and broaden mosaicity (Kriminski et
al., 2003).
Slower cooling may also reduce strains and disorder associated with the inherent
thermal expansivity mismatch between the protein lattice and the solvent that fills its
116

voids (Juers and Matthews 2001; Kriminski et al., 2002; Juers & Matthews, 2004b;
Lovelace et al., 2006). This mismatch requires that the solvent either flow (to the
crystal surface or to grain boundaries and other defective regions where the lattice is
weak) or compress. We estimate that pressures of 10 – 100 MPa could be generated
within the crystal if negligible flow occurs, based upon the observed expansivity of the
thaumatin lattice and the measured expansivity of water confined to 2 nm pores
(Mallamace et al., 2007). Slower cooling allows more time before vitrification for
solvent to flow and to accommodate the contracting protein lattice, and so may reduce
stresses and solvent pooling in defective regions and thereby help maintain crystal
order.
In the present experiments, essentially all of the mosaicity increase occurs above 200
K, where the mismatch between solvent expansion and lattice contraction is large
(Mallamace et al., 2007). The largest rate of mosaicity increase occurs at temperatures
(200 – 220 K) where the unit cell volume is rapidly decreasing and the solvent
viscosity is rapidly increasing. If expansion mismatch in fact accounts for some of the
increased crystal disorder, one might expect that adding glycerol, which unlike water
only contracts on cooling, would reduce the mismatch and the amount of disorder.
However, glycerol also strongly increases solvent viscosity and reduces solvent
diffusion, and so the flow required to relieve the stresses caused by any remaining
mismatch is inhibited.
We also note that above 200 K, thaumatin’s lattice contraction on cooling is strongly
anisotropic. Below 180 K it is very nearly isotropic (Figure 6.6), and occurs at a rate
(~10-4 K-1) very close to the thermal contraction of amorphous water (also ~10-4 K-1) at
that temperature (Mallamace et al., 2007). Anisotropic contraction requires transport
117

of solvent within the unit cell, i.e., solvent molecules must flow past or around protein
molecules. Below 200 K, solvent flow and translational diffusion are negligible (Weik
et al., 2004; Wood et al., 2007; Wood et al., 2008) and so contraction should become
nearly isotropic.
Figure 6.6
Lattice parameters a vs c during cooling for the as-grown and 40 % glycerol crystals.
Both crystals show very nearly isotropic contraction below ~180 K (indicated by an
arrow).
118

6.4.5 Comparison to previous work
Petsko and co-workers demonstrated that ribonuclease A goes through a “dynamical
transition” at ~220 K (Tilton et al., 1992; Rasmussen et al., 1992). This transition was
characterized by a kink in the crystallographic Debye-Waller factor (B-factor),
indicating the onset of long-range, anharmonic motions (e.g. translational diffusion in
the solvent, motion of surface side-chains, or larger conformational changes) on
warming above the transition temperature. This kink was also observed in mean-
square displacements measured in earlier Mössbauer spectroscopy studies of 57Fe in
myoglobin (Parak et al., 1982), as well as with inelastic neutron scattering (Doster et
al., 1989), but the transition does not appear in myoglobin’s crystallographic B-factors
(Chong et al., 2001).
Figure 6.4c shows the Wilson B-factors of two slow-cooled thaumatin crystals. The
crystal without glycerol shows a well-defined kink (change in slope) in B(T)
signalling a transition at 210 K, whereas the crystal soaked in 40 % glycerol shows
what could be interpreted as a broadened transition. The integrated diffuse background
intensity in the resolution range 15 – 5 Å, shown in Figure 6.5, also shows a kink. This
is not surprising, as both the B factor and diffuse scatter are related to thermal motions
(and/or static disorder) of the protein. However, for both crystals the transition as seen
through diffuse scatter occurs at a lower temperature than as seen through the B-factor
(associated with Bragg reflections). We note that this loss of diffuse intensity at low
resolution cannot be accounted for by the appearance of oil rings at T=255 K: the
diffuse intensity shows most of its decrease above 255 K, and it varies smoothly near
255 K despite the abrupt appearance of the oil rings.
119
Previous studies on flash-cooled protein crystals have shown that the solvent
undergoes an amorphous solid to liquid transition as the temperature is increased
through the range 180 K to 220 K, driving a solid-like to liquid-like transition in the
protein molecule itself. (Vitkup et al., 2000; Weik et al., 2001a; Weik et al., 2001b;
Weik et al., 2005; Wood et al., 2007; Wood et al., 2008). Below this transition, the B-
factor decreases linearly with decreasing temperature. This decrease is usually
attributed to a reduction in the amplitudes of harmonic thermal motions, consistent
with the notion that the system is solid-like below 180 K.
For slow-cooled thaumatin crystals (Figure 6.4c), the average mean-squared-
displacement's (MSD = B/8π2) variation with temperature below T=180 K is
dMSD/dT ~5 · 10-5 Å2/K. The dMSD/dT values obtained from crystals of myoglobin
(Parak et al., 1982; Chong et al., 2001), ribonuclease A (Tilton et al., 1992;
Rasmussen et al., 1992), lysozyme (Joti et al., 2002), maltose binding protein (Wood
et al., 2008) and purple membrane (Wood et al., 2007) are in the range 10-4 to 10-3
Å2/K; the rate for hexagonal ice is ~ 2 · 10-4 Å2/K (Teeter et al., 2001). These studies
followed a variety of thermal trajectories from room temperature to the measurement
temperature, including slow cooling and warming to each temperature (Parak et al.,
1982; Wood et al., 2007; Wood et al., 2008)), quenching from room temperature to
each measurement temperature (Tilton et al., 1992; Rasmussen et al.,1992; Chong et
al., 2001; Teeter et al., 2001), and quenching to low temperature and then slowly
warming to each measurement temperature (Joti et al., 2002). If the entire change in B
is due to changes in harmonic motions, then thaumatin must be an unusually “stiff”
protein in this temperature range. B(T) can also be affected by changes in static
disorder. A reduced magnitude of dB/dT could result if there is a gradual increase in
120

static disorder — either due to a gradual trapping of metastable microstates, or due to
an increase in lattice-level disorder — during slow cooling.
Previous temperature-dependent studies of protein crystals required the use of large
cryoprotectant concentrations. To prevent ice formation and loss of diffraction at
temperatures approaching 200 K, Singh et al. (1980) used 45% - 75% methanol in
their bovine trypsinogen crystals (47 % w/v solvent.) Tilton et al. (1992) used 50 %
methanol or 50 % MPD in their ribonuclease A crystals, but were still unable to obtain
data at 200 K because the crystals “rapidly became opaque and ceased to diffract”.
These results highlight how remarkable it is that thaumatin can be successfully cooled
to any temperature without cryoprotectants.
6.4.6 A generally applicable method?
The method described here has been applied to ribonuclease A (cell volume 225,000
Å3, solvent content 45 %), lysozyme (cell volume 220,000 Å3, solvent content 36 %),
trypsin (200,000 Å3, solvent content 42 %), insulin (cell volume 456,000 Å3, solvent
content 63 %), and urease (cell volume 4,900,000 Å3, solvent content 48 %) crystals
(Jabri et al., 1992; Jabri et al., 1995; Jabri & Karplus, 1996), in addition to the
thaumatin samples described above. As-grown (cryoprotectant-free) urease and insulin
crystals can be slow-cooled to T=100 K without ice formation or significant
degradation of diffraction quality, with a success rate of ~75 %, based upon
approximately 15 trials. Lysozyme and trypsin crystals can be successfully slow-
cooled in 40 % glycerol. But when as-grown (cryoprotectant-free) crystals are cooled,
diffraction quality abruptly degrades and cubic ice forms near T=210 K, and in almost
every case the diffraction is too poor to continue the experiment. Ribonuclease A
121

crystals were grown in high salt (4 M sodium chloride), and this salt precipitated out
as the temperature was lowered, destroying the crystalline order. These results suggest
that, with continued methodological refinement, it may be possible to slow cool a
substantial fraction of protein and virus crystals without the use of penetrating
cryoprotectants. Slow cooling may thus provide an alternative as well as a
complement to flash cooling in cryocrystallographic studies.
We have also successfully flash cooled thaumatin, lysozyme, trypsin, insulin and
urease crystals to specific temperatures between 300 K and 100 K using the same
solvent removal and mounting protocol as for slow cooling and then simply placing
them in a gas stream at the desired temperature. Although glycerol improves the
success rate significantly, high quality diffraction data has been obtained without use
of penetrating cryoprotectants from all five proteins.
6.5 Conclusion
The present results demonstrate that high-quality diffraction data can be continuously
collected from an individual crystal, over the entire temperature range between 300 K
and 100 K, by cooling at 0.1 K/s. Successful slow cooling does not require large
cryoprotectant concentrations or special apparatus (e.g., for generating high pressures),
but only that all external solvent be removed from the crystal. Thaumatin crystals
cooled in this way show exceptionally low mosaicity and no evidence of crystalline
ice at T=100 K. The small observed mosaicity increase occurs above 200 K, where the
mismatch between protein lattice contraction and solvent expansion is largest and
where the unit cell contraction is anisotropic. This suggests that the mismatch is an
important source of crystal disorder, as has been observed in previous studies.
122

Cooling rates 103-104 times slower than in conventional flash cooling (and 105-106
times slower than in hyperquenching (Warkentin et al., 2007)) will affect how a
protein explores its energy landscape and the conformational states observed during
and after cooling to low or intermediate temperatures. Slow cooling may thus provide
a new window into protein structure and function.
123

REFERENCES
Berejnov, V., Husseini, N. S., Alsaied, O. A., & Thorne, R. E. (2006). Journal of
Applied Crystallography 39, 244-251.
Bourgeois, D. & Royant, A. (2005). Current Opinion in Structural Biology 15, 538-
547.
Bourgeois, D. & Weik M. (2009). Reviews of Crystallography 15, 87-118.
Cervelle, B., Cesbron, F., Berthou, J., and Jolles, P. (1974). Acta Crystallogr. A 30
645-648.
Chong, S. H., Joti, Y., Kidera, A., Go, N., Ostermann, A., Gassmann, A., & Parak, F.
(2001). European Biophysics Journal with Biophysics Letters 30, 319-329.
Colletier, J. P., Bourgeois, D., Sanson, B., Fournier, D., Sussman, J. L., Silman, I., &
Weik, M. (2008). Proceedings of the National Academy of Sciences of the United
States of America 105, 11742-11747.
Doster, W., Cusack, S., & Petry, W. (1989). Nature 337, 754-756.
Edayathumangalam, R. S. & Luger, K. (2005). Acta Crystallographica Section D-
Biological Crystallography 61, 891-898.
Frauenfelder, H., Petsko, G. A., & Tsernoglou, D. (1979). Nature 280, 558-563.
Gakhar, L. & Wiencek, J. M. (2005). Journal of Applied Crystallography 38, 945-950.
Garman, E. (1999). Acta Crystallographica Section D-Biological Crystallography 55,
1641-1653.
Garman, E. F. & Schneider, T. R. (1997). Journal of Applied Crystallography 30, 211-
237.
Harp, J. M., Timm, D. E., & Bunick, G. J. (1998). Acta Crystallographica Section D-
Biological Crystallography 54, 622-628.
124
Harp, J. M., Hanson, B. L., Timm, D. E., & Bunick, G. J. (1999). Acta
Crystallographica Section D-Biological Crystallography 55, 1329-1334.
Hope, H. (1988). Acta Crystallographica Section B-Structural Science 44, 22-26.
Hope, H. (1990). Annual Review of Biophysics and Biophysical Chemistry 19, 107-
126.
Jabri, E., Lee, M. H., Hausinger, R. P., & Karplus, P. A. (1992). Journal of Molecular
Biology 227, 934-937.
Jabri, E., Carr, M. B., Hausinger, R. P., & Karplus, P. A. (1995). Science 268, 998-
1004.
Jabri, E. & Karplus, P. A. (1996). Biochemistry 35, 10616-10626.
Joti, Y., Nakasako, M., Kidera, A., & Go, N. (2002). Acta Crystallographica Section
D-Biological Crystallography 58, 1421-1432.
Juers, D. H. & Matthews, B. W. (2001). Journal of Molecular Biology 311, 851-862.
Juers, D. H. & Matthews, B. W. (2004). Quarterly Reviews of Biophysics 37, 105-119.
Juers, D. H. & Matthews, B. W. (2004). Acta Crystallographica Section D-Biological
Crystallography 60, 412-421.
Kim, C. U., Kapfer, R., & Gruner, S. M. (2005). Acta Crystallographica Section D-
Biological Crystallography 61, 881-890.
Kmetko, J., Husseini, N. S., Naides, M., Kalinin, Y., & Thorne, R. E. (2006). Acta
Crystallographica Section D-Biological Crystallography 62, 1030-1038.
Kriminski, S., Caylor, C. L., Nonato, M. C., Finkelstein, K. D., & Thorne, R. E.
(2002). Acta Crystallogr. D. Biol. Crystallogr. 58, 459-471.
Kriminski, S., Kazmierczak, M., & Thorne, R. E. (2003). Acta Crystallographica
Section D-Biological Crystallography 59, 697-708.
Kurinov, I. V. & Harrison, R. W. (1995). Acta Crystallographica Section D-Biological
Crystallography 51, 98-109.
125

Lovelace, J. J., Murphy, C. R., Pahl, R., Keith, B., & Borgstahl, G. E. O. (2006).
Journal of Applied Crystallography 39, 425-432.
Low, B. W., Chen, C. C. H., Berger, J. E., Singman, L., & Pletcher, J. F. (1966).
Proceedings of the National Academy of Sciences of the United States of America 56,
1746-&.
Mallamace, F., Branca, C., Broccio, M., Corsaro, C., Mou, C. Y., & Chen, S. H.
(2007). Proceedings of the National Academy of Sciences of the United States of
America 104, 18387-18391.
McFerrin, M. B. & Snell, E. H. (2002). Journal of Applied Crystallography 35, 538-
545.
McPherson, A. (1999). Crystallization of Biological Macromolecules. New York:
Cold Spring Harbor Laboratory Press.
Mitchell, E. P. & Garman, E. F. (1994). Journal of Applied Crystallography 27, 1070-
1074.
Otwinowski, Z. & Minor, W. (1997). Macromolecular Crystallography, Pt A 276,
307-326.
Parak, F., Knapp, E. W., & Kucheida, D. (1982). Journal of Molecular Biology 161,
177-194.
Pflugrath, J. W. (2004). Methods 34, 415-423.
Rasmussen, B. F., Stock, A. M., Ringe, D., & Petsko, G. A. (1992). Nature 357, 423-
424.
Rault, J., Neffati, R., & Judeinstein, P. (2003). European Physical Journal B 36, 627-
637.
Rodgers, D. W. (1994). Structure 2, 1135-1140.
Sartor, G., Hallbrucker, A., & Mayer, E. (1995). Biophysical Journal 69, 2679-2694.
126

Singh, T. P., Bode, W., & Huber, R. (1980). Acta Crystallographica Section B-
Structural Science 36 , 621-627.
Snell, E. H., Judge, R. A., Larson, M., & van der Woerd, M. J. (2002). Journal of
Synchrotron Radiation 9, 361-367.
Sutton, R. L. (1991). Journal of the Chemical Society-Faraday Transactions 87, 101-
105.
Teeter, M. M., Yamano, A., Stec, B., & Mohanty, U. (2001). Proceedings of the
National Academy of Sciences of the United States of America 98, 11242-11247.
Teng, T. Y. & Moffat, K. (1998). Journal of Applied Crystallography 31, 252-257.
Thorne, R., Kriminski, S., Caylor, C., & Kisselev, A. (2001). Biophysical Journal 80,
58A.
Tilton, R. F., Dewan, J. C., & Petsko, G. A. (1992). Biochemistry 31, 2469-2481.
Vitkup, D., Ringe, D., Petsko, G. A., & Karplus, M. (2000). Nature Structural Biology
7, 34-38.
Walker, L. J., Moreno, P. O., & Hope, H. (1998). Journal of Applied Crystallography
31, 954-956.
Warkentin, M., Berejnov, V., Husseini, N. S., & Thorne, R. E. (2006). Journal of
Applied Crystallography 39, 805-811.
Warkentin, M., Stanislavskaia, V., Hammes, K., & Thorne, R. E. (2008). Journal of
Applied Crystallography 41, 791-797.
Weik, M., Kryger, G., Schreurs, A. M. M., Bouma, B., Silman, I., Sussman, J. L.,
Gros, P., & Kroon, J. (2001). Acta Crystallographica Section D-Biological
Crystallography 57, 566-573.
Weik, M., Vernede, X., Royant, A., & Bourgeois, D. (2004). Biophysical Journal 86,
3176-3185.
127

Weik, M., Schreurs, A. M. M., Leiros, H. K. S., Zaccai, G., Ravelli, R. B. G., & Gros,
P. (2005). Journal of Synchrotron Radiation 12, 310-317.
Wood, K., Plazanet, M., Gabel, F., Kessler, B., Oesterhel, D., Tobias, D. J., Zaccai,
G., & Weik, M. (2007). Proceedings of the National Academy of Sciences of the
United States of America 104, 18049-18054.
Wood, K., Frolich, A., Paciaroni, A., Moulin, M., Hartlein, M., Zaccai, G., Tobias, D.
J., & Weik, M. (2008). Journal of the American Chemical Society 130, 4586-4587.
128

129
CHAPTER 7
TEMPERATURE DEPENDENCE OF X-RAY RADIATION DAMAGE TO
PROTEIN CRYSTALS: ACTIVATION ENERGY OF SECONDARY DAMAGE
7.1 Introduction
Any study of biological matter that utilizes ionizing radiation must contend with the
problem of radiation damage. Even under ideal experimental conditions, radiation
damage places a fundamental limit on the amount of information that can be obtained
from a sample before it stops yielding useful information. It is important to remember
that this limit is naturally arbitrary, as it depends on the experimenter’s definition of
“useful information”—indeed, the sample could be said to be “damaged” as soon as
the first inelastic scattering event takes place. An operational rule of thumb, with
origins in the cryo-electron microscopy community has been adopted and is
appropriate in most circumstances. (Henderson, 1990)
In X-ray protein crystallography, radiation damage is an important consideration when
planning and experiment. Originally, it was overcome by using large crystals, and
scaling together data from many crystals. Once reliable cryocrystallography protocols
were established, it became common practice to collect data at 100 K, where protein
crystals are approximately 50 – 100 times less sensitive to X-rays. (Nave & Garman,
2005; Southworth-Davies et al., 2008) Since that time, X-ray radiation damage to
protein crystals has become much better understood, at least at the practical level
required for structural biology.

The process of radiation damage proceeds in two phases, which have been called
"primary" and "secondary", as follows: First, a ~10 keV photon is absorbed or
inelastically scattered, either by a protein or solvent atom, depositing a large amount
of energy. This energy is then carried away from the location of the initial event as a
shower of ~10-100 eV electrons (Singh & Singh, 1982; Cowan & Nave, 2008). This
spur spreads out, resulting in a cascade of radiochemical reactions, and additional
photoelectrons, covering a range of ~3 microns (Holton, 2009). The reactions include
the production of free-radicals in the solvent, as well as the breaking of bonds in the
protein molecule itself. All of this occurs on sub-picosecond timescales, faster than
atomic motions (Henderson, 1995). As a result, these processes are expected to be
relatively temperature independent, and are called primary radiation damage.
Once primary damage has occurred, the free radicals and (now destabilized) protein
molecules can begin to move. These motions involve the diffusion of free radicals
through the solvent channels in the crystal to the protein molecules, where they may
react and cause further damage. They also involve the disordering of damaged protein
molecules, and the eventual amorphization of entire unit cells (Blake & Phillips,
1962). All of these processes require diffusive motions of large numbers of atoms,
which must move a distance that is many times larger than their vibrational extent.
These processes occur on the micro- to millisecond timescale, and are thus many
orders of magnitude slower than primary damage. In addition, they require long-range
diffusive motion of many atoms, and so they are expected to be strongly temperature-
dependent. Because there is such a clear separation of the two processes in timescale,
this second set of events is called secondary radiation damage.
130

The primary aim of this study is to shed light on the mechanism of radiation damage
by measuring its temperature dependence over the range 300 K to 100 K. It is known
that the sensitivity of typical protein crystals is reduced by a factor of 50 to 100 on
cooling from 300 K to 100 K (Nave & Garman, 2005). This effect is believed to be
due to the glass transition in the solvent + protein system, which limits the mobility of
both radical species and the protein molecules themselves. Our results confirm this
view. Between 300 and 170 K, the reduction in sensitivity is driven by the decreasing
rates of diffusion of protein hydration water, reaction of radical species, and
conformational motions of protein molecules. We measure an activation energy for
radiation damage of 2.7 kcal/mol, consistent with hydration water diffusion. This
“diffusion limited” view is further supported by the fact that the addition of 40 %
glycerol to the crystals causes the activation energy to increase by 50%. Below 170 K,
the sensitivity is relatively temperature independent, and in agreement with previous
studies.
We also discuss the nature of radiation damage in terms of how it is commonly
measured. Our understanding of radiation damage comes from two types of effects,
called "specific" and "global". Studies of specific damage examine systematic
changes in the molecular structure after irradiation.
These changes happen comparatively rapidly (Holton, 2009), vary greatly from
protein to protein and from site to site within a given protein (Burmeister, 2000), can
complicate phasing (Ravelli & McSweeney, 2000), and can affect the biological
relevance of the data (Weik et al., 2000). Specific damage can also be useful for
solving structures, because the anomalous differences introduced by the damage can
be used for phasing (Ravelli et al., 2003; 2005). It has also recently been introduced
131
as a tool in kinetic crystallography, where X-rays were used to drive a reaction in the
active site of an enzyme (Bourgeois & Royant, 2005; Colletier et al., 2008).
Studies of global damage measure the random disordering of the crystalline lattice (at
both the intra- and inter-molecular levels). In practice, a global measure of damage
includes any systematic changes as well as random ones. While global damage
reduces the overall quality of the data obtained, it is less likely to affect the biological
relevance of the data: Insofar as it only introduces random motions in each unit cell,
the effects will be averaged out in the final structure and just contribute to a loss of
resolution, not to errors at specific sites. What is more, all but the smallest crystals
yield a complete dataset long before appreciable global damage has occurred at 100 K.
For this reason, specific damage is of the most immediate practical concern to a
structural biologist using X-ray crystallography.
On the other hand, global damage lends itself more readily to systematic study. At
100 K, it has been shown to be relatively constant (within a factor of 2) for a variety of
different protein crystals (Kmetko et al., 2006; Owen et al., 2006; Holton, 2009), not
to depend on the dose rate (Leiros et al., 2001; 2006; Ravelli et al., 2002; Sliz et al.,
2003; Shimizu et al., 2007) and to depend linearly on the total absorbed dose. While
the mechanisms are still not completely understood, these facts suggest that there is a
general set of mechanisms, common to all protein crystals.
Finally, we show that the "character" of global damage is strikingly independent of
temperature. This was not expected, because many molecular motions are available at
300 K that are frozen out at 100 K. Specifically, one might expect that at high
temperature, large regions of the crystal would become totally amorphous, leading to a
132

complete loss of diffraction intensity. At low temperature, the solid solvent matrix
would confine motions to nearer to their ideal lattice positions, leading to an increased
Debeye-Waller factor (B-factor). If this were the case, then the ratio of the change in
total intensity to the change in B-factor would depend on the temperature. We find
instead that the ratio is constant (i.e. a fixed loss of total intensity corresponds to a
fixed increase in B-factor at all temperatures.) This finding also informs the
discussion of global metrics of radiation damage and facilitates comparisons between
studies carried out under different experimental conditions.
7.2 Methods
7.2.1 Crystallization
Tetragonal lysozyme crystals were grown in 24-well trays using the hanging drop
method. The well solution was comprised of 7 % (w/v) sodium chloride in 100 mM
sodium acetate buffer at pH 4.25. Protein from Sigma-Aldrich was obtained as a
purified powder, and dissolved to a concentration of 50 mg/mL in the same buffer. 10
μL hanging drops were prepared by mixing 5 μL each of the protein solution and well
solution. 500 μL of well solution was placed at the bottom of each well, and 22 mm
siliconized coverglass (Hampton Research, Aliso Viejo, CA, USA) was sealed over
the top of the well with high vacuum grease (Dow-Corning).
Tetragonal thaumatin crystals were grown in 24-well trays using the hanging drop
method. The well solution was comprised of 1 M sodium potassium tartrate in 100
mM potassium phosphate buffer at pH 6.8. Protein from Sigma-Aldrich was obtained
as a purified powder, and dissolved to a concentration of 25 mg/mL in the same
133

buffer. 10 μL hanging drops were prepared by mixing 5 μL each of the protein
solution and well solution. 500 μL of well solution was placed at the bottom of each
well, and 22 mm siliconized coverglass (Hampton Research, Aliso Viejo, CA, USA)
was sealed over the top of the well with high vacuum grease (Dow-Corning).
Orthorhombic trypsin crystals were grown in 24-well trays using the hanging drop
method. The well solution was comprised of 25 % (w/v) polyethylene glycol
(molecular weight 8000) and 0.2 M ammonium sulphate in 100 mM Tris buffer at pH
8. Protein from Sigma-Aldrich was obtained as a purified powder, and dissolved to a
concentration of 15 mg/mL in the same buffer. 10 μL hanging drops were prepared by
mixing 5 μL each of the protein solution and well solution. 500 μL of well solution
was placed at the bottom of each well, and 22 mm siliconized coverglass (Hampton
Research, Aliso Viejo, CA, USA) was sealed over the top of the well with high
vacuum grease (Dow-Corning).
7.2.2 Glycerol Soaks
To incorporate glycerol into the crystals, solutions of glycerol in the appropriate well
solution (see above) were prepared in increments of 10 % (w/v). Half of the
concentration of protein used for growth was also added to each soaking solution to
prevent the crystals from dissolving. For the larger concentrations of glycerol, very
small crystals of protein grew in the soaking solutions. Crystals were transferred from
their mother liquor to the 0 % glycerol solution (well solution + half initial protein
concentration), and from there to each successive solution up to 40 % (w/v). Times
between transfers were not controlled, and were on the order of 30 - 90 seconds. Each
134

crystal was allowed to sit in the final soaking solution for at least 5 minutes. Transfers
between soaking drops were done using MicroMounts (Mitegen, Ithaca, NY, USA).
7.2.3 Crystal mounting
In order to perform experiments at temperatures near 200 K, special techniques had to
be applied to prevent the formation of crystalline ice during data collection. These
techniques are described in detail in Warkentin & Thorne (2009), which is Chapter 6
of this dissertation. Briefly, the presence of aqueous solvent on the surface of the
crystal makes it susceptible to ice formation, which dehydrates the protein lattice,
often destroying it. When all of the external solvent is removed under oil, the crystal
can be cooled to any temperature without danger of ice formation. This is because ice
formation within the protein crystal is suppressed due to being confined in nanometer-
scale pores (Neffati et al., 2003).
At temperatures below 270 K, crystals were first transfered from their growth droplet
or cryoprotectant soak into thick immersion oil (Hampton Research, Aliso Viejo, CA,
USA). They were then manipulated under the oil with μTools, Micromounts
(Mitegen, Ithaca, NY, USA), and nylon loops (Hampton Research, Aliso Viejo, CA,
USA) until all of the solvent clinging to the surface had been removed. Finally, they
were mounted on a Micromount with as little surrounding oil as possible. They were
then simply placed on the goniometer and into the Cryostream set to the desired
temperature.
At temperatures of 270 K and 300 K, a large drop of oil was mounted surrounding the
crystal to prevent dehydration during the entire experiment.
135

7.2.4 X-ray diffraction experiments
Data were collected at MacCHESS at stations A1, F1, and F2 using a 100 μm
collimator (150 μm at F2), a Cryostream 700 (Oxford Cryosystems, Devens, MA,
USA), a Quantum 210 CCD detector (Quantum 270 at F1) (ADSC, Poway, CA,
USA), and an energy of 12.6 keV. The X-ray flux was determined using a 6 cm
nitrogen ionization chamber whose calibration was supplied by the CHESS staff.
Consecutive runs of 5 frames of data were collected, with an oscillation width of 1
degree per frame, always over the same 5 degree-wedge. As a result, the dose was
delivered to the same volume of crystal. (The spreading of the dose due to rotation of
the crystal causes the calculated dose to be overstated by a factor that depends on the
crystal's length along the beam. For our geometry, the effect is 4 % for a 200 μm
length and 9 % for a 400 μm length. Because it is so small, it is not included in the
reported sensitivities. To do so would require careful measurement of the crystal
geometry during experiments at the synchrotron.)
7.2.5 Data processing
Each run of 5 frames was indexed and integrated independently from the others, with
both MOSFLM (Leslie, 2006) and Denzo (Otwinowski & Minor, 1997). The total
intensities were calculated by simple summation of the intensities of each reflection
integrated by the respective programs. Virtually no differences were seen between the
resulting half-dose values calculated from the total intensity as a function of dose.
Relative B-factors between each set and the original set were obtained with SCALEIT
136

(www.ccp4.ac.uk) and with SCALEPACK (Otwinowski & Minor, 1997) as described
in Kmetko et al., (2006). Aside from a constant factor of 1.33, the results were again
very similar. (The relative B-factor values from SCALEPACK were consistently 1.33
times larger than those from SCALEIT.) SCALEPACK did produce smoother dose
curves, so those were used, but the coefficients of sensitivity were scaled down by
1.33 to reflect that would have been obtained from SCALEIT, so as to be in line with
Kmetko et al., (2006).
7.3 Results
Dose curves were obtained at 10 different temperatures in the range 300 K to 100 K.
Relative B-factors were determined by scaling successive 5 degree datasets against the
initial set as described in Kmetko et al., (2006) (see methods). Crystals of thaumatin,
trypsin, and lysozyme were investigated, both as-grown and with the addition of 40 %
glycerol (dataset 1). In Figure 7.1, we show the increase in the relative B-factor as a
function of dose for crystals of Thaumatin soaked in 40 % glycerol as an example. At
all temperatures, the response to the dose is linear, at least initially. It was found that
once the relative B-factor exceeded ~ 15 Å2 it would become constant vs. dose. (not
shown - It is not clear whether or not this effect is real, or an artifact of the scaling
procedure: once a sufficiently large number of high-resolution spots have faded to
zero intensity, the relative B-factor becomes poorly defined.)
The slope of the Brel versus dose curve is divided by 8π2 (so that it reflects the actual
atomic mean-squared displacement), and called the coefficient of sensitivity to
absorbed dose (sAD) (Kmetko et al., 2006). We have calculated the coefficient of
137

sensitivity for each sample at each temperature, from plots analogous to the one shown
in Figure 7.1. The results are presented in Figure 7.2.
Figure 7.1
Representative dose curves are shown for samples of thaumatin containing 40 % (w/v)
glycerol at each of the temperatures investigated. The curves level off for larger
doses, so only the initial, linear part of the curve is used in estimating the coefficient
of sensitivity.
138
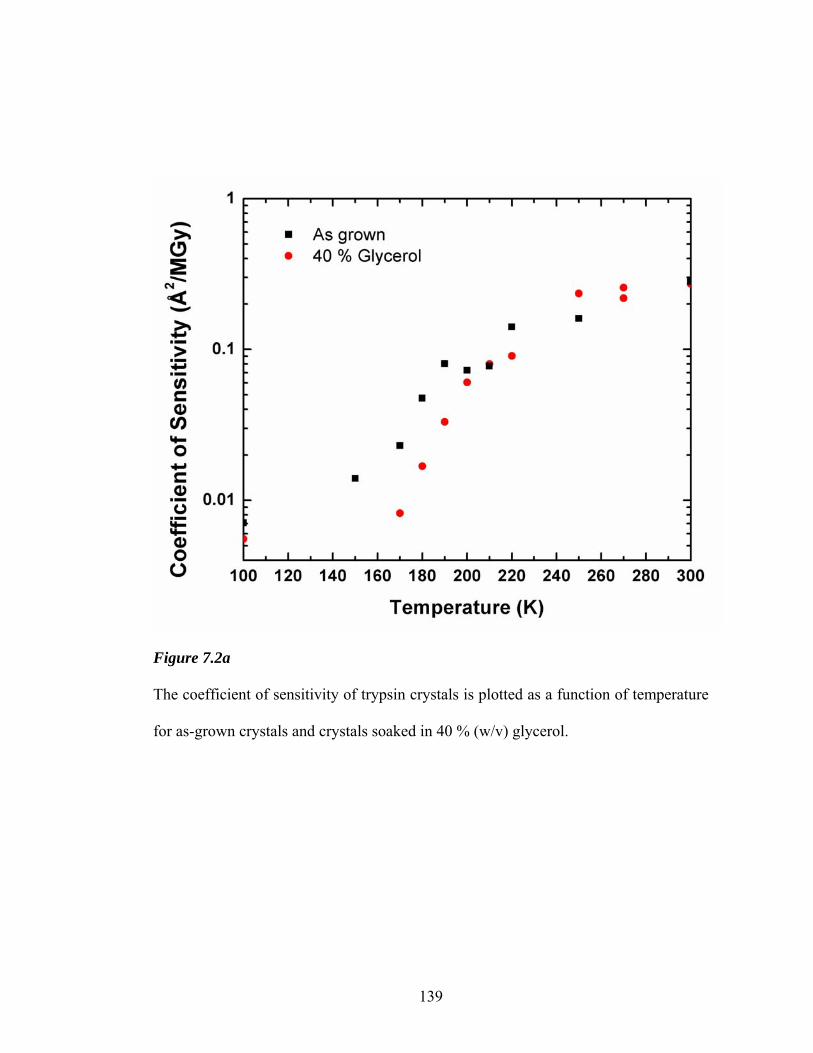
Figure 7.2a The coefficient of sensitivity of trypsin crystals is plotted as a function of temperature
for as-grown crystals and crystals soaked in 40 % (w/v) glycerol.
139
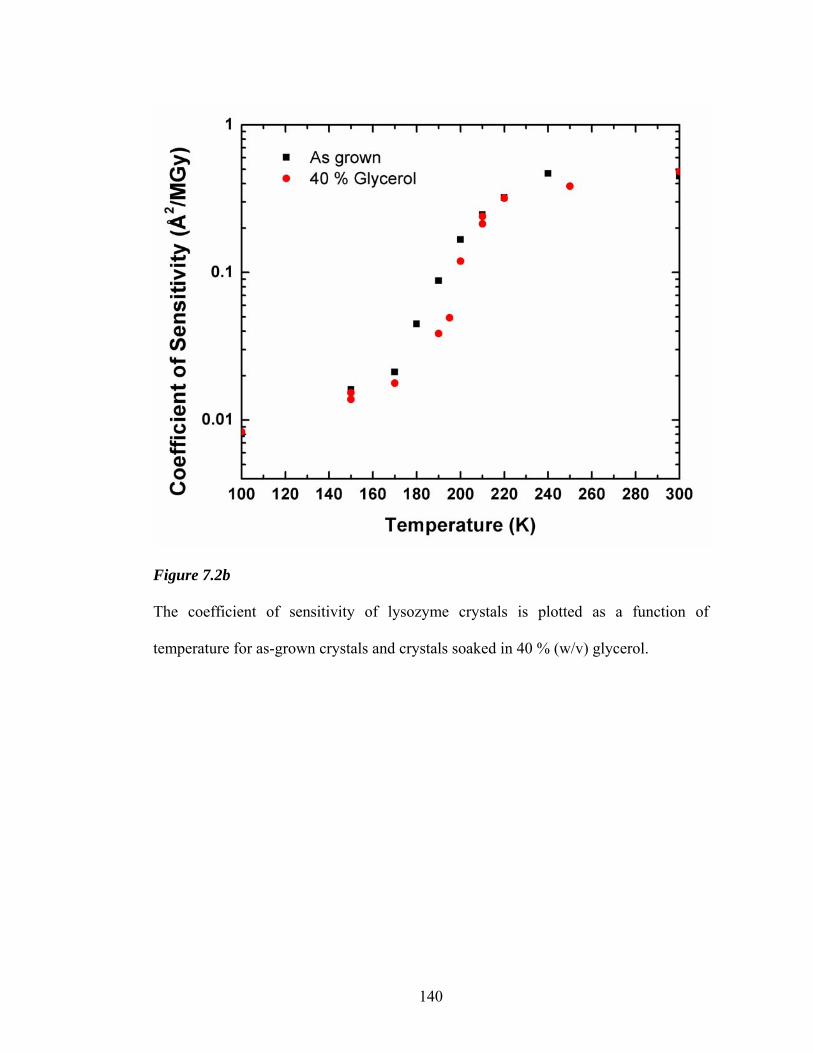
Figure 7.2b The coefficient of sensitivity of lysozyme crystals is plotted as a function of
temperature for as-grown crystals and crystals soaked in 40 % (w/v) glycerol.
140

Figure 7.2c The coefficient of sensitivity of thaumatin crystals is plotted as a function of
temperature for as-grown crystals and crystals soaked in 40 % (w/v) glycerol.
141

In every case, the total reduction in sensitivity is approximately the same (a factor of
50). The results for all three proteins has a similar “S” shape, with relatively small
variation at high and low temperatures and a steeper variation at intermediate
temperatures. The greatest reduction in sensitivity occurs in the range 220 K to 160 K,
with comparably less variation with temperature at either high or low temperatures.
The coefficients of sensitivity for the as grown and glycerol-soaked crystals are
similar at both T=300 K and T=100 K, but glycerol reduces the sensitivity in the range
200 K to 160 K.
Thaumatin was chosen for a more comprehensive study (dataset 2), and dose curves
were collected as described in the Methods section. Between 2 and 6 curves were
collected at each temperature down to 170 K. All of the measured coefficients of
sensitivity for each sample are shown in Figure 7.3, but they are separated by color
because data for the second study were collected on a different beamline (see
methods), and show a different behavior. The data are plotted on Arrhenius axes to
facilitate the discussion of activation energies below.
In addition to computing the relative B-factors and coefficients of sensitivity, we have
also computed the total integrated spot intensity for each dataset, and used the
resulting summed intensity dose curves to determine the half-dose (the X-ray dose at
which the total diffraction intensity has fallen to half of its initial value) for each
sample. As with the relative B-factors, the summed intensity was linearly related to
dose for low dose, in agreement with the previous studies that have used this metric
(Owen et al., 2006, Southworth-Davies et al., 2008). A comparison plot of the two
metrics for each sample is shown in Figure 7.4. The half dose is inversely
142
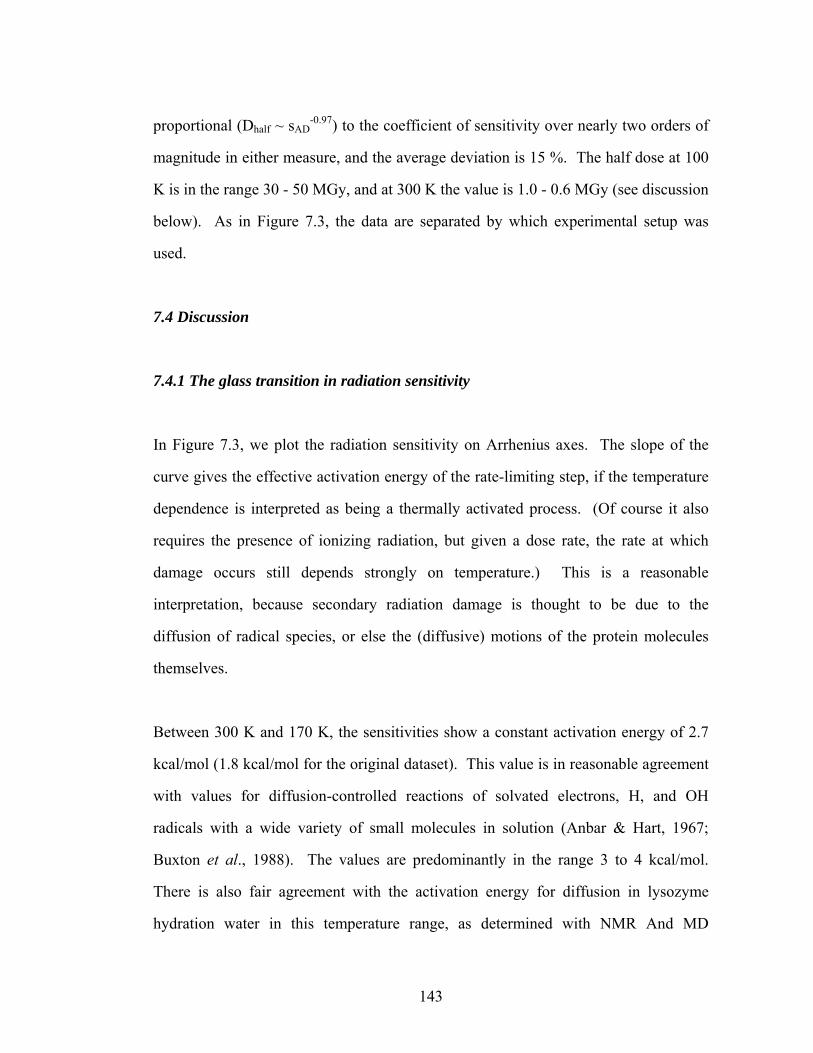
proportional (Dhalf ~ sAD-0.97) to the coefficient of sensitivity over nearly two orders of
magnitude in either measure, and the average deviation is 15 %. The half dose at 100
K is in the range 30 - 50 MGy, and at 300 K the value is 1.0 - 0.6 MGy (see discussion
below). As in Figure 7.3, the data are separated by which experimental setup was
used.
7.4 Discussion
7.4.1 The glass transition in radiation sensitivity
In Figure 7.3, we plot the radiation sensitivity on Arrhenius axes. The slope of the
curve gives the effective activation energy of the rate-limiting step, if the temperature
dependence is interpreted as being a thermally activated process. (Of course it also
requires the presence of ionizing radiation, but given a dose rate, the rate at which
damage occurs still depends strongly on temperature.) This is a reasonable
interpretation, because secondary radiation damage is thought to be due to the
diffusion of radical species, or else the (diffusive) motions of the protein molecules
themselves.
Between 300 K and 170 K, the sensitivities show a constant activation energy of 2.7
kcal/mol (1.8 kcal/mol for the original dataset). This value is in reasonable agreement
with values for diffusion-controlled reactions of solvated electrons, H, and OH
radicals with a wide variety of small molecules in solution (Anbar & Hart, 1967;
Buxton et al., 1988). The values are predominantly in the range 3 to 4 kcal/mol.
There is also fair agreement with the activation energy for diffusion in lysozyme
hydration water in this temperature range, as determined with NMR And MD
143

simulation, 4.14 and 3.48 kcal/mol, respectively (Lagi et al, 2008). Protein
conformational motions and folding have a wider range of activation energies, roughly
from 2 to 8 kcal/mol, and also must contribute to damage in this temperature range
(Wolynes et al., 1996; Socci et al; 1996; Schuler et al., 2002; Grabolle et al¸2006;
Munoz et al., 2006).
Further evidence that radiation damage is diffusion controlled in this temperature
range comes from the data for crystals containing glycerol. The activation energy for
diffusion in pure glycerol is 20 – 30 kcal/mol in this temperature range (Schneider et
al., 1998; Jain et al., 2009), and so the fact that the addition of 40 % glycerol increases
the activation energy from 2.7 to ~4.5 kcal/mol (not shown) supports the claim that
radiation damage is diffusion controlled. (Note that because of coupling between the
solvent and protein dynamics (Tilton et al., 1992; Wood et al., 2007; 2008a; 2008b),
an increase in the activation energy for diffusion in the solvent will lead to an increase
in the activation energy for (diffusive) motions of the protein surface.)
At low temperatures, diffusive motions in both the solvent and the protein are frozen
out, and the temperature dependence of the damage reflects this. A transition to a
nearly temperature-independent regime is observed at ~170 K. If this is taken to mean
that diffusive motions are frozen out below 170 K, then the dominant source of
damage in this temperature range is primary damage (defined here as the chemical and
physical changes produced by the inelastically-scattered X-ray and the resulting spur
of high-energy electrons, all of which happens in ~10-14 seconds.) It also means that
this is another manifestation of the protein glass transition (see below).
144

Figure 7.3 The coefficient of sensitivity of thaumatin crystals is plotted as a function of
temperature for as-grown crystals and crystals soaked in 40 % (w/v) glycerol.
145

7.4.2 The character of global damage is temperature-independent
We have discussed two ways to quantify global radiation damage: changes in the B-
factor (coefficient of sensitivity) and changes in the summed intensity (half dose).
These two metrics, while related, arise from distinct physical changes in the crystal.
As atoms move away from their ideal lattice positions, the intensities of reflections are
reduced, more so at higher resolution. This leads to a) a reduction in the total Bragg-
scatter, and b) an increase in the B-factor. This is the “disordered” state in the model
of Blake & Phillips, (1962). Eventually, some atoms will have moved so far from
their lattice positions that they no longer contribute to Bragg scatter at all. This is the
“amorphous” state, and causes a reduction in total Bragg scatter without a
corresponding increase in B-factor. The amount of each type of damage present in
the crystal can be characterized by the ratio of B-factor increase to total intensity
decrease (ΔB/ΔI).
It is reasonable to expect that at low temperatures, radiation damage would involve
many small displacements of atoms, thus leading to mostly “disordered” protein, and
ΔB/ΔI would be comparatively large. At high temperatures, large-scale motions are
possible, and the “amorphous” state is more readily reached. This suggests that ΔB/ΔI
would be comparatively low at high temperature. We find instead that ΔB/ΔI is
essentially temperature independent (Figure 7.4.) The surprising conclusion is that
radiation damage proceeds along the same pathway independent of temperature, at
least at low dose.
It is also evident from Figure 7.4 that the discrepancy between the two studies cannot
be explained by a difference in flux calibration. A change in the flux calibration of
146

one dataset would shift the cluster of points along its own length, never side-to-side.
This means that whatever difference exists between the two studies must be innate to
either the crystals or a detail of the experimental setup that has been overlooked. We
suggest that future studies quantifying radiation sensitivity report both half-dose and
coefficient of sensitivity, since they do not appear to be simply related, and are known
to measure different physical quantities.
Figure 7.4
The correlation between half-dose and coefficient of sensitivity. Different studies are
plotted in different colors. The difference between them cannot be explained by a
difference in dose calibration alone.
147

7.4.3 Comparison to previous work
Where our findings for radiation sensitivity overlap with previous studies, there is at
best factor-of-two agreement, which is typical for radiation damage studies conducted
in different labs (see below). One factor contributing to the continuing discrepancies
(even between supposedly identical experiments) is that articles rarely give all of the
information needed to reconstruct exactly how sensitivity was calculated. A
discussion of the many sources of error when comparing different studies is beyond
the scope of this paper. Here, we simply summarize previous findings that are most
readily compared to ours.
At 100 K, Kmetko et al. (2006) determined the coefficients of sensitivities of
lysozyme and thaumatin to be 0.012 and 0.018 Å2, respectively. These values are
larger than many of the values found here, even up to 240 K. Teng & Moffat (2000,
2002), however, found a linear dependence of B-factor on dose, which gives a value of
0.006 Å2 for lysozyme. Their 2002 study reported no temperature dependence in the
range 40 to 150 K, and reported a half-intensity-dose (half dose) of ~15 MGy, which
is at least half of our value of 30 - 50 MGy. Burmeister et al., (2000) report of a half
dose of ~23 MGy for mirosinase, and Owen et al., (2006) found a half dose of 43
MGy for holo- and apo-ferritin, after taking account of the different absorption cross-
sections of the two proteins. Owen et al. state that they did not take account of the
extra irradiated volume due to rotating the crystal, however, and if this is taken into
account (using the values they give: 100 μm square beam footprint, 200 μm cubed
crystal, 30 degree range of phi), the actual half dose is 31 MGy.
148

Meents et al. (2007) measured the sensitivity of insulin and holoferritin using I/σ(I),
which differs from the usual method of determining half dose, however, they obtained
I/σ(I)-half dose values of ~20-25 MGy for both protein crystals, at both 15 K and 90
K, after assuming that the iron-rich core of ferritin reabsorbs whatever Auger electrons
are generated there due to an inelastic X-ray scattering event (a factor of 4 effect).
They also observe a slight temperature dependence, although it is very weak compared
to the one we measure between 160 K and 100 K. The weakening of the temperature
dependence below 100 K is corroborated by Borek et al. (2007), who studied glucose
isomerase. They obtained relative sensitivity data as high as 200 K, and in general
found similar temperature dependencies to the ones we found, both between 100 K
and 160 K, and between 160 K and 200 K (see above).
The coefficient of sensitivity can be calculated from the data given in Shimizu et al.
(2007) for lysozyme crystals, giving very approximate values in the range 0.001 to
0.004 Å2, with the smaller values obtained at higher X-ray energies (16.5 to 33 keV.)
Based on the beam size, oscillation range, and the sizes of the crystals used, these
sensitivities are probably understated by a factor of two, due to the irradiated volume
effect. The dose calculations were performed with RADDOSE (Murray et al., 2004),
which does not take account of this effect. This would bring most of their observed
sensitivities into the range we measure.
At 300 K, Southworth-Davies et al., (2008) reported half doses for lysozyme crystals
in the range 0.4 to 1.7 MGy, which were positively correlated with the dose rate in the
range 6 to 10 Gy/s (home source). We find a half dose of 0.7 MGy, at a dose rate of
20 kGy/s. This value is in the middle of their range of half doses, which suggests that
the dose rate correlation is limited to low dose rates. We also note that the
149

Southworth-Davies et al., study does not take account of the irradiated volume effect,
though they provide the necessary information in their paper to do so. In some cases,
the correction to the half-dose they report is in excess of a factor of two.
7.5 Conclusion
In agreement with Borek et al., 2007, the dependence of radiation sensitivity on
temperature is relatively weak below ~170 K. This supports the conclusion that
temperature-dependent studies are possible in that temperature range without much
additional concern about radiation damage. This is perhaps most useful in the
developing field of kinetic crystallography, where temperature can be used as a
parameter to control reaction rates within crystals.
We also point out that there are clearly many factors contributing to radiation
sensitivity and its measurement that have not been fully understood. We have
observed variations between nominally identical experiments of up to a factor three at
temperatures between 300 K and 170 K. Though these variations are smaller at lower
temperatures, (see Meents et al., 2007), they are still considerable. While it is possible
that these variations are innate to the samples themselves, further investigation is
required to draw this conclusion.
Despite these difficulties, we have demonstrated an Arrhenius dependence of radiation
sensitivity, with an activation energy of ~2.7 kcal/mol. This value is in the same range
as that for translational diffusion of lysozyme hydration water (4.14 kcal/mol),
reactions of hydrated electrons, H, and OH radicals (3 - 4 kcal/mol), and protein
conformational motions (2 - 8 kcal/mol). This suggests that some combination of
150

these processes are responsible for protein radiation sensitivity above 170 K. Below
that temperature, they are frozen out, and radiation damage must proceed without
diffusional motions.
151

REFERENCES
Anbar, M. & Hart, E. J. (1967). Journal of Physical Chemistry 71, 3700-&.
Blake, C. & Phillips, D. C. Proceedings of the Symposium on theBiological Effects of
Ionising Radiation at the Molecular Level (Vienna:International Atomic Energy
Agency),pp. 183-191.
Bourgeois, D. & Royant, A. (2005). Current Opinion in Structural Biology 15, 538-
547.
Burmeister, W. P. (2000). Acta Crystallographica Section D-Biological
Crystallography 56, 328-341.
Buxton, G. V., Greenstock, C. L., Helman, W. P., & Ross, A. B. (1988). Journal of
Physical and Chemical Reference Data 17, 513-886.
Colletier, J. P., Bourgeois, D., Sanson, B., Fournier, D., Sussman, J. L., Silman, I., &
Weik, M. (2008). Proceedings of the National Academy of Sciences of the United
States of America 105, 11742-11747.
Cowan, J. A. & Nave, C. (2008). Journal of Synchrotron Radiation 15, 458-462.
Grabolle, M., Haumann, M., Muller, C., Liebisch, P., & Dau, H. (2006). Journal of
Biological Chemistry 281, 4580-4588.
Henderson, R. (1990). Proceedings of the Royal Society of London Series B-Biological
Sciences 241, 6-8.
Henderson, R. (1995). Quarterly Reviews of Biophysics 28, 171-193.
Holton, J. M. (2009). Journal of Synchrotron Radiation 16, 133-142.
Jain, P., Levchenko, A., Yu, P., & Sen, S. (2009). Journal of Chemical Physics 130.
Lagi, M., Chu, X. Q., Kim, C. S., Mallamace, F., Baglioni, P., & Chen, S. H. (2008).
Journal of Physical Chemistry B 112, 1571-1575.
152

Leiros, H. K. S., McSweeney, S. M., & Smalas, A. O. (2001). Acta Crystallographica
Section D-Biological Crystallography 57, 488-497.
Leiros, H. K. S., Timmins, J., Ravelli, R. B. G., & McSweeney, S. M. (2006). Acta
Crystallographica Section D-Biological Crystallography 62, 125-132.
Leslie, A. G. W. (2006). Acta Crystallographica Section D-Biological
Crystallography 62, 48-57.
Munoz, V., Ghirlando, R., Blanco, F. J., Jas, G. S., Hofrichter, J., & Eaton, W. A.
(2006). Biochemistry 45, 7023-7035.
Murray, J. W., Garman, E. F., & Ravelli, R. B. G. (2004). Journal of Applied
Crystallography 37, 513-522.
Nave, C. & Garman, E. F. (2005). Journal of Synchrotron Radiation 12, 257-260.
Otwinowski, Z. & Minor, W. (1997). Macromolecular Crystallography, Pt A 276,
307-326.
Owen, R. L., Rudino-Pinera, E., & Garman, E. F. (2006). Proceedings of the National
Academy of Sciences of the United States of America 103, 4912-4917.
Rault, J., Neffati, R., & Judeinstein, P. (2003). European Physical Journal B 36, 627-
637.
Ravelli, R. B. G. & McSweeney, S. M. (2000). Structure 8, 315-328.
Ravelli, R. B. G., Theveneau, P., McSweeney, S., & Caffrey, M. (2002). Journal of
Synchrotron Radiation 9, 355-360.
Ravelli, R. B. G., Leiros, H. K. S., Pan, B. C., Caffrey, M., & McSweeney, S. (2003).
Structure 11 , 217-224.
Ravelli, R. B. G., Nanao, M. H., Lovering, A., White, S., & McSweeney, S. (2005).
Journal of Synchrotron Radiation 12, 276-284.
Schneider, U., Lunkenheimer, P., Brand, R., & Loidl, A. (1998). Journal of Non-
Crystalline Solids 235, 173-179.
153

Schuler, B., Lipman, E. A., & Eaton, W. A. (2002). Nature 419, 743-747.
Shimizu, N., Hirata, K., Hasegawa, K., Ueno, G., & Yamamoto, M. (2007). Journal of
Synchrotron Radiation 14, 4-10.
Singh, A. & Singh, H. (1982). Progress in Biophysics & Molecular Biology 39, 69-
107.
Sliz, P., Harrison, S. C., & Rosenbaum, G. (2003). Structure 11, 13-19.
Socci, N. D., Onuchic, J. N., & Wolynes, P. G. (1996). Journal of Chemical Physics
104, 5860-5868.
Southworth-Davies, R. J., Medina, M. A., Carmichael, I., & Garman, E. F. (2007).
Structure 15, 1531-1541.
Tilton, R. F., Dewan, J. C., & Petsko, G. A. (1992). Biochemistry 31, 2469-2481.
Warkentin, M. & Thorne, R. E. (2008). Journal of Applied Crystallography 41, 791-
797.
Weik, M., Ravelli, R. B. G., Kryger, G., McSweeney, S., Raves, M. L., Harel, M.,
Gros, P., Silman, I., Kroon, J., & Sussman, J. L. (2000). Proceedings of the National
Academy of Sciences of the United States of America 97, 623-628.
Weik, M., Kryger, G., Schreurs, A. M. M., Bouma, B., Silman, I., Sussman, J. L.,
Gros, P., & Kroon, J. (2001). Acta Crystallographica Section D-Biological
Crystallography 57, 566-573.
Weik, M., Vernede, X., Royant, A., & Bourgeois, D. (2004). Biophysical Journal 86,
3176-3185.
Weik, M., Schreurs, A. M. M., Leiros, H. K. S., Zaccai, G., Ravelli, R. B. G., & Gros,
P. (2005). Journal of Synchrotron Radiation 12, 310-317.
Wolynes, P. G., LutheySchulten, Z., & Onuchic, J. N. (1996). Chemistry & Biology 3,
425-432.
154

Wood, K., Plazanet, M., Gabel, F., Kessler, B., Oesterhel, D., Tobias, D. J., Zaccai,
G., & Weik, M. (2007). Proceedings of the National Academy of Sciences of the
United States of America 104, 18049-18054.
Wood, K., Plazanet, M., Gabel, F., Kessler, B., Oesterhelt, D., Zaccai, G., & Weik, M.
(2008). European Biophysics Journal with Biophysics Letters 37, 619-626.
Wood, K., Frolich, A., Paciaroni, A., Moulin, M., Hartlein, M., Zaccai, G., Tobias, D.
J., & Weik, M. (2008). Journal of the American Chemical Society 130, 4586-4591.
155

APPENDIX A
A PROTEIN CRYSTAL AS A COMPRESSION CELL, AND THE LIQUID-
LIQUID PHASE TRANSITION IN SUPERCOOLED WATER
A.1 Introduction
The following is a manuscript that, at the time of this writing, has not been submitted
to a journal. The implications of the supposed finding are far-reaching, and of
immense scientific interest, but the evidence is not conclusive. In particular, the
abrupt unit-cell contraction shown in Figure A.2 can be explained by the formation of
a small amount of ice in the crystals. In Chapter 6 it is argued that up to ~1 % of a
protein crystal may be ice without the signal being detectable by X-ray diffraction.
While the contractions of the solvent space shown in Figure A.2 are 4 and 9 %, the ~1
% estimate from Chapter 6 is an order-of-magnitude estimate only.
A.2 Manuscript
Recent results1-3 for supercooled water confined to nanometer-sized pores have
demonstrated many of the features of the highly-anticipated liquid-liquid phase
boundary4-6. These studies have the advantage that water in pores smaller than
~2 nm does not crystallize7, allowing access to the supercooled state at any
temperature. Still, no direct observation of the phase transition (i.e. an abrupt
change in density as a function of temperature or pressure) exists in the
temperature range where water is a liquid (above 150 K). Here we describe how
the solvent confined to the 1 to 2 nm channels in a protein crystal pressurizes as
156

the system cools, so that the trajectory taken through the P-T plane crosses the
likely location of the liquid-liquid phase boundary at ~210 K. We then present
cooling experiments in which an abrupt ~4-9% increase in density is observed at
this temperature in two different protein crystal systems (tetragonal lysozyme
and orthorhombic trypsin), which we attribute to this crossing. These results will
inform more detailed studies of this transition in the future, as well as open the
door to temperature-dependent studies of protein crystal systems.
It has been known for a long time that the various thermodynamic properties of water
show anomalous behavior on supercooling, appearing to diverge at temperatures just
below the homogenous nucleation temperature8-10. This, combined with the discovery
of a first order phase transition between two amorphous forms of ice as a function of
pressure11, led some to speculate that this phase boundary extends to higher
temperatures, either terminating at a critical point4, or else connecting to the liquid-
vapor phase boundary at negative pressures12. The location of the phase boundary in
the temperature range 200-230 K has been investigated by
compression/decompression induced melting experiments13,14, neutron measurements
of the fragile-to-strong crossover15, computer simulations16,17, and scaling theory18,
among others, reviewed by Stanley and Mishima5. Additionally, the notion of the
phase boundary terminating at a critical point, as opposed to continuing to negative
pressures, is supported by ambient pressure measurements of heat capacity3, density1,
and relaxation-time/diffusivity2. They show a continuous evolution, with anomalies
where the phase boundary would be, were there no critical point. This line, along
which fluctuations are maximal, is the continuation of the phase boundary past the
critical point, and is called a Widom line19.
157
The investigations described above must contend with the fact that supercooled water
spontaneously crystallizes below ~235 K at ambient pressure8. This difficulty can be
avoided by working with water confined to nanopores no larger than ~2 nm7.
Previously, porous silica1-3 has been used to achieve confinement. We recognize that
in protein crystals, water is confined to solvent channels in the range 1 to 2 nm (and
up), and focus on the protein crystal system as a possible place to study the properties
of supercooled water. One immediate advantage is that in X-ray diffraction, the unit
cell volume can be determined very accurately, providing a measurement of the
density. Another interesting twist in protein crystal systems is that simply lowering
the temperature can create large pressures, as we will now describe.
As a protein crystal cools, the protein molecules move closer together, reducing the
total volume available to the solvent. At the same time, the solvent should be
expanding, so it must either compress or flow (to the surface of the crystal or to a
grain boundary). Since a pressure is required to drive the flow, compression and flow
will happen simultaneously. Near the vicinity of the critical point, the compressibility,
expansivity, and viscosity of the solvent are not known, however what data are
available can be used to produce an estimate of the trajectory that the system follows
through the P-T plane.
Using constant values of αs and κ for the expansivity and compressibility of the
solvent, and αc for the thermal contraction coefficient of the protein lattice, it can be
shown that the slope of the trajectory is ( ) /s cα α κ− in the absence of flow. To the
extent that flow also occurs, the slope will be less than this value. In the opposite
limit, the solvent is incompressible. If the protein crystal is modeled as a tube of
158

length L and diameter d, with L being the average grain size and d being the channel
diameter, the pressure required to drive a flow of rate v through the tube is
4
128 Lp vdη
π= (1)
The flow rate is related to the temperature through the cooling rate and the thermal
expansion coefficients of the crystal lattice and solvent. This condition sets a
maximum on the pressure at any given temperature. The trajectory taken by the
crystal is then the one that never exceeds either maximum: it follows (1) if the slope is
less than ( ) /s cα α− κ , otherwise it follows a straight line of slope ( ) /s cα α− κ .
A trajectory of the type described is shown in Figure A.1, along with data and
estimates of the location of the critical point and phase boundary. Due to uncertainties
in both the trajectory and the phase boundary, the temperature at which they cross
cannot be predicted with precision. There is also the question of how large a region of
metastability exists at this temperature, which might allow the sample to remain
untransformed long after crossing the equilibrium phase boundary. However, it
should be clear from the figure that the crossing is inevitable, and is likely to be in the
range 200 - 220 K.
At this temperature, the pressure is in the range 100 - 200 MPa. It is important to note
that the bulk modulus of protein crystals is 2.7 - 5.3 GPa at room temperature20, and
that it increases rapidly with decreasing temperature21. At a temperature of 210 K, it is
likely to be in excess of 10 GPa, so the strain at 100 MPa is only 1%, still in the elastic
regime.
The results of two separate experiments of the type described above are shown in
Figure A.2. For both a lysozyme and trypsin crystal, a constant contraction of the unit
159

cell volume is observed down to a temperature of ~210 K, at which point an abrupt
decrease occurs. This coincides with a shift in the intensity of the diffuse scatter to
larger scattering-angle (smaller d-spacing), indicating that the amorphous solvent in
the sample has undergone an abrupt increase in density. We attribute this density
increase to the crossing of the liquid-liquid phase boundary pictured in Figure A.1.
One important assumption in the calculation of the P-T trajectory shown in Figure A.1
is that the grain size is large. In order for pressure to build up, the solvent must need
to flow a large distance (~100 μm), before reaching a grain boundary. Evidence that
this is the case comes from two measures of crystalline order shown in Figure A.3.
That they both remain constant down to the transition temperature implies that a
relatively minor amount of solvent has escaped the crystalline lattice (see caption).
The sharp jump in these measures of disorder is consistent with a first-order transition,
in which a front of phase transformation sweeps through the sample, causing many
tiny cracks, as has been observed for the same transition at ~140 K22.
There are a number of reasons to expect that the transition described here should differ
from that in pure, bulk water. The most obvious is the confinement, but this has been
discussed previously, and has been shown in several studies not to have a major
effect1-3,7,23,24. There is also the effect of the protein side-chains, which have been
shown to decrease the diffusion constant of protein hydration water by a factor of 1023.
Finally there are the solutes contained in the solutions from which the crystals grew.
For lysozyme there is 1.2 M NaCl, and for trypsin there is 25 % PEG 6000. The effect
of solutes on the thermodynamic properties of water -- in particular, the location of
phase boundaries -- has been shown to be equivalent to that of an effective pressure,
through the two variables' effect on the water activity25. Thus one would expect that
solutes (or side chains) would shift the phase boundary to lower pressures, and this has
160

been demonstrated by Mishima26. Based on their correspondence through water
activity, and on Mishima's measurements in LiCl solutions, the solutions used in this
study are expected to shift the phase boundaries for lysozyme and trypsin to lower
pressures approximately 50 MPa. This also explains why the same experiment, with
the inclusion of 40 % glycerol, shows no phase transition (data not shown): in that
case the phase boundary would be shifted entirely to negative pressures, and the
solvent would always be in the high-density-like phase.
161

Figure A.1
The P-T phase diagram of supercooled water is shown, with the trajectory of a protein
crystal being cooled at 0.1 K/s superimposed. Black circles are points from
compression/decompression induced melting of H2O and D2O ices, and the red line is
the result from a semi-empirical equation of state18 based on data from ref. 26. The
maximum pressure attainable in the crystal is shown as a thin black line, and this line
is the trajectory followed by the system when its slope is less than ( ) /s cα α− κ (see
text). Otherwise the trajectory is a line of that slope. Viscosity values used are the
geometrical average of T/D measurements in pure confined water2, and protein
hydration water24, linearly scaled so as to agree with actual viscosity measurements in
pure water27.
162

Figure A.2
The result of slow-cooling experiments on lysozyme and trypsin crystals. Panel a)
shows the relative change in the volume of the confined solvent, determined from unit
cell measurements, and corrected for the contraction of the protein molecule28, and the
solvent fraction of the cell in lysozyme and trypsin. In panel b), the relative change in
intensity of the diffuse scatter in the resolution range 3 - 3.3 Å is shown, where the
smooth variation is due to the contraction of the oil surrounding the crystal. In both
panels, an abrupt transition at ~210 K is evident, indicating a density increase of 9%
for the lysozyme solvent and 4% for the trypsin solvent.
163

Figure A.3
The mosaicity a), and b-factor b), for both crystals. The fact that they are relatively
temperature independent down to the transition temperature indicates that the crystals
are composed of a small number of large grains, and that they contract and pressurize
uniformly. If there were many small grains, a large amount (~5% of total sample
volume28) of solvent would flow to grain boundaries, resulting in increased
misalignment of the grains, and increased disorder. The mosaicity is a measure of the
width of the angular distribution of grains, and the b-factor is proportional to the root-
mean-square displacements of individual atoms from their locations in an ideal lattice.
Both were determined using the HKL 2000 suite.
164
The difference in the density jumps in trypsin and in lysozyme may be accounted for
by this difference in their solution activity. It may also have to do with the greater
disorder in the trypsin crystal, which could be due in part to more grain boundaries.
While many grains were large enough to produce the necessary pressure, some
fraction of the grains in both crystals surely were not, and remained in the low-density
phase. In this view, both the ~4% density jump in trypsin and the ~9% density jump
in lysozyme should represent lower limits on the true value of the density
discontinuity across the phase boundary in pure water.
Finally we will address the question of the reproducibility of these results. The most
common outcome when slowly cooling lysozyme or trypsin crystals is a curve that
looks very much like that in Figure A.2, except that the sudden contraction of the
solvent is typically so large that it results in a total loss of diffraction from the crystal,
terminating the experiment at ~200 K. We have observed this type of sudden
contraction in lysozyme, trypsin and (less often) in thaumatin crystals, always between
200 and 225 K, and only when using the pure solutions from which the crystals grew -
- never in the presence of 30 - 40% glycerol or equivalent. Since the transition always
occurs in a narrow range of temperature, is seen to be very similar across several
different protein crystal systems, and is eliminated by the addition of too much
glycerol, we conclude that it is a feature of the aqueous solvent. In particular, it is the
first (albeit uncontrolled) observation of the liquid-liquid phase transition in
supercooled water.
165

REFERENCES
1. Mallamace, F. et al. The anomalous behavior of the density of water in the
range 30K < T < 373K. Proceedings of the National Academy of Sciences of the
United States of America 104, 18387-18391 (2007).
2. Chen, S. H. et al. The violation of the Stokes-Einstein relation in supercooled
water. Proceedings of the National Academy of Sciences of the United States of
America 103, 12974-12978 (2006).
3. Oguni, M., Maruyama, S., Wakabayashi, K. & Nagoe, A. Glass transitions of
ordinary and heavy water within silica-gel nanopores. Chemistry-An Asian Journal 2,
514-520 (2007).
4. Poole, P. H., Sciortino, F., Essmann, U. & Stanley, H. E. Phase-Behavior of
Metastable Water. Nature 360, 324-328 (1992).
5. Mishima, O. & Stanley, H. E. The relationship between liquid, supercooled
and glassy water. Nature 396, 329-335 (1998).
6. Mishima, O. Application of polyamorphism in water to spontaneous
crystallization of emulsified LiCl-H2O solution. Journal of Chemical Physics 123,
(2005).
7. Rault, J., Neffati, R. & Judeinstein, P. Melting of ice in porous glass: why
water and solvents confined in small pores do not crystallize? European Physical
Journal B 36, 627-637 (2003).
8. Debenedetti, P. G. Supercooled and glassy water. Journal of Physics-
Condensed Matter 15, R1669-R1726 (2003).
9. Kanno, H. & Angell, C. A. Water - Anomalous Compressibilities to 1.9-Kbar
and Correlation with Supercooling Limits. Journal of Chemical Physics 70, 4008-
4016 (1979).
166

10. Hare, D. E. & Sorensen, C. M. Densities of Supercooled H2O and D2O in 25-
Mu Glass-Capillaries. Journal of Chemical Physics 84, 5085-5089 (1986).
11. Mishima, O. Reversible 1St-Order Transition Between 2 H2O Amorphs at
Similar-To-0.2 Gpa and Similar-To-135-K. Journal of Chemical Physics 100, 5910-
5912 (1994).
12. Speedy, R. J. Stability-Limit Conjecture - An Interpretation of the Properties of
Water. Journal of Physical Chemistry 86, 982-991 (1982).
13. Mishima, O. & Stanley, H. E. Decompression-induced melting of ice IV and
the liquid-liquid transition in water. Nature 392, 164-168 (1998).
14. Mishima, O. Liquid-liquid critical point in heavy water. Physical Review
Letters 85, 334-336 (2000).
15. Liu, L., Chen, S. H., Faraone, A., Yen, C. W. & Mou, C. Y. Pressure
dependence of fragile-to-strong transition and a possible second critical point in
supercooled confined water. Physical Review Letters 95, (2005).
16. Harrington, S., Zhang, R., Poole, P. H., Sciortino, F. & Stanley, H. E. Liquid-
liquid phase transition: Evidence from simulations. Physical Review Letters 78, 2409-
2412 (1997).
17. Sciortino, F., Poole, P. H., Essmann, U. & Stanley, H. E. Line of
compressibility maxima in the phase diagram of supercooled water. Physical Review e
55, 727-737 (1997).
18. Fuentevilla, D. A. & Anisimov, M. A. Scaled equation of state for supercooled
water near the liquid-liquid critical point. Physical Review Letters 97, (2006).
19. Xu, L. M. et al. Relation between the Widom line and the dynamic crossover
in systems with a liquid-liquid phase transition. Proceedings of the National Academy
of Sciences of the United States of America 102, 16558-16562 (2005).
167

168
20. Speziale, S. et al. Sound velocity and elasticity of tetragonal lysozyme crystals
by Brillouin spectroscopy. Biophysical Journal 85, 3202-3213 (2003).
21. Morozov, V. N. & Morozova, T. Y. Elasticity of Globular-Proteins - the
Relation Between Mechanics, Thermodynamics and Mobility. Journal of
Biomolecular Structure & Dynamics 11, 459-481 (1993).
22. Mishima, O. & Suzuki, Y. Propagation of the polyamorphic transition of ice
and the liquid-liquid critical point. Nature 419, 599-603 (2002).
23. Liu, L. et al. Quasielastic and inelastic neutron scattering investigation of
fragile-to-strong crossover in deeply supercooled water confined in nanoporous silica
matrices. Journal of Physics-Condensed Matter 18, S2261-S2284 (2006).
24. Mallamace, F. et al. Role of the solvent in the dynamical transitions of
proteins: The case of the lysozyme-water system. Journal of Chemical Physics 127,
(2007).
25. Koop, T., Luo, B. P., Tsias, A. & Peter, T. Water activity as the determinant
for homogeneous ice nucleation in aqueous solutions. Nature 406, 611-614 (2000).
26. ocrystallization of emulsified LiCl-H2O solution. Journal of Chemical Physics
123, (2005).
27. Osipov Y.A., Zheleznyi B.V. & Bondarenko N.F. The Shear Viscosity of
Water Supercooled to -35 C. Russian Journal of Physical Chemistry 51, 748-749
(1977).
28. Juers, D. H. & Matthews, B. W. Reversible lattice repacking illustrates the
temperature dependence of macromolecular interactions. Journal of Molecular
Biology 311, 851-862 (2001).