before: spend a few minutes exploring the energy skate...
TRANSCRIPT

Before:
Spend a few minutes exploring the Energy Skate Park simulation at http://phet.colorado.edu/en/simulation/energy-skate-park . Can you edit the design of the track? What do the pie chart and the bar graph show? What other tools are available?
After Activity 2:
1) You have used three different representations for energy: pie charts, bar graphs, and energy vs. position graphs. What are the advantages and disadvantages of each one?
2) Is there one representation that you think is superior to the others? Why? (There’s no right or wrong answer to this.)
Student directions Energy Skate Park Activity 2: Relating Graphs, Position and Speed (no time graphs)
http://phet.colorado.edu
10/21/2008 Loeblein http://phet.colorado.edu 1
2
1 3
4
Learning Goals: Students will be able to: 1. Describe Energy -Pie, -Bar, and -Position Charts from position or selected speeds.
a. Explain how changing the Skater affects the situations above. b. Explain how changing the surface friction affects the situations above.
2. Predict position or estimate of speed from Energy -Pie, -Bar, and -Position Charts 3. Look at the position of an object and use the Energy -Pie, -Bar, and -Position charts to
predict direction of travel or change in speed.
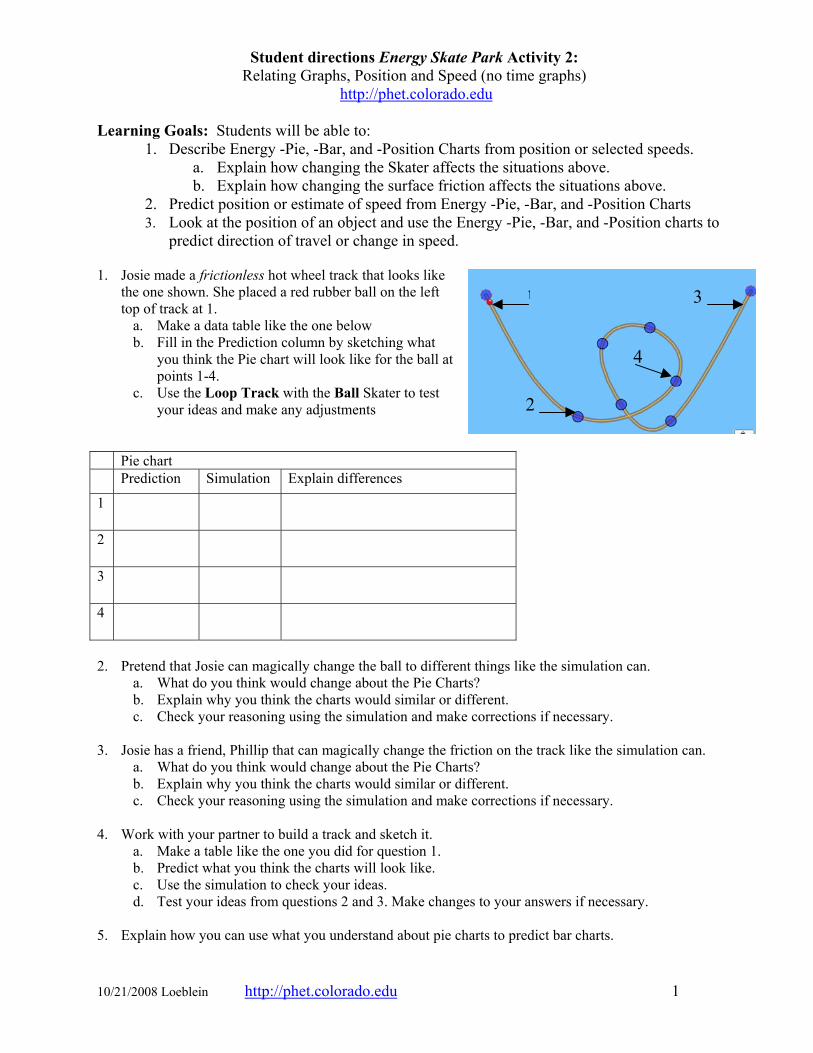
1. Josie made a frictionless hot wheel track that looks like the one shown. She placed a red rubber ball on the left top of track at 1.
a. Make a data table like the one below b. Fill in the Prediction column by sketching what
you think the Pie chart will look like for the ball at points 1-4.
c. Use the Loop Track with the Ball Skater to test your ideas and make any adjustments
Pie chart Prediction Simulation Explain differences
1
2
3
4
2. Pretend that Josie can magically change the ball to different things like the simulation can.
a. What do you think would change about the Pie Charts? b. Explain why you think the charts would similar or different. c. Check your reasoning using the simulation and make corrections if necessary.
3. Josie has a friend, Phillip that can magically change the friction on the track like the simulation can.
a. What do you think would change about the Pie Charts? b. Explain why you think the charts would similar or different. c. Check your reasoning using the simulation and make corrections if necessary.
4. Work with your partner to build a track and sketch it.
a. Make a table like the one you did for question 1. b. Predict what you think the charts will look like. c. Use the simulation to check your ideas. d. Test your ideas from questions 2 and 3. Make changes to your answers if necessary.
5. Explain how you can use what you understand about pie charts to predict bar charts.
Student directions Energy Skate Park Activity 2: Relating Graphs, Position and Speed (no time graphs)
http://phet.colorado.edu
10/21/2008 Loeblein http://phet.colorado.edu 2
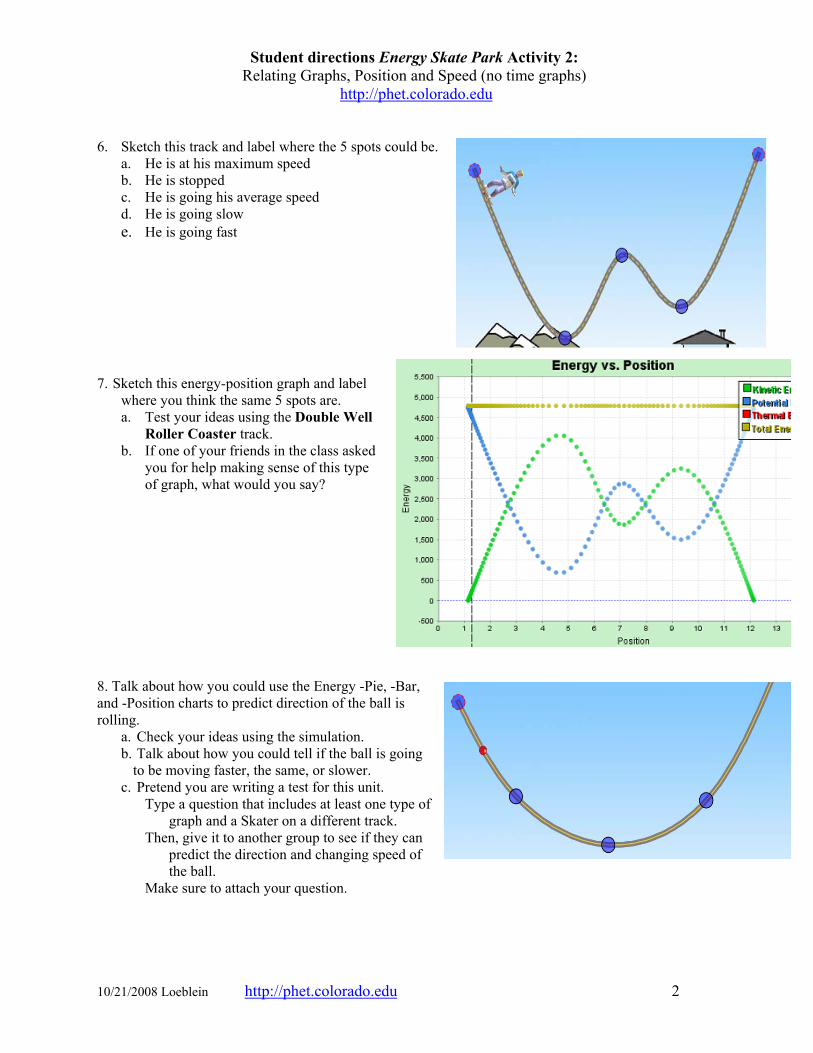
6. Sketch this track and label where the 5 spots could be.
a. He is at his maximum speed b. He is stopped c. He is going his average speed d. He is going slow e. He is going fast
7. Sketch this energy-position graph and label
where you think the same 5 spots are. a. Test your ideas using the Double Well
Roller Coaster track. b. If one of your friends in the class asked
you for help making sense of this type of graph, what would you say?
8. Talk about how you could use the Energy -Pie, -Bar, and -Position charts to predict direction of the ball is rolling.
a. Check your ideas using the simulation. b. Talk about how you could tell if the ball is going
to be moving faster, the same, or slower. c. Pretend you are writing a test for this unit.
Type a question that includes at least one type of graph and a Skater on a different track.
Then, give it to another group to see if they can predict the direction and changing speed of the ball.
Make sure to attach your question.

Student directions Energy Skate Park activity 4: Calculations with Conservation of Mechanical Energy using time graphs
Learning Goals: Students will be able to use Energy-Time graphs to… at a given time.
• Estimate a location for the Skater on a track. • Calculate the speed or height of the Skater • Predict energy distribution for tracks with and without friction.
Directions:
1. This graph was made with the 75 kg Skater Guy riding on the track shown. Without using the simulation, talk with your partner to predict the answers to these questions. Record your predictions!
a. Where was he at time zero? At 7 seconds? At 8 seconds? 5 seconds? b. If his maximum height is 4 m, what is his height at time zero? At 7 seconds? At 8 seconds?
5 seconds? c. What is his speed at time zero? At 7 seconds? At 8 seconds? 5 seconds? d. Sketch what the graph would look like between 13 and 15 seconds.
2. Use the Skate Park simulation to check your answers and make corrections. Show examples of
calculations by giving the formula and substitution. 3. Without using the simulation, talk with your partner to predict the answers to these questions about
the same Track, Skater and Starting point as #1. Record your predictions!
a. Sketch what the graph might look like between 0 and 9 seconds if the Track Friction was turned on.
b. How do you think his location will be affected? Think about both horizontal and vertical location.
c. How do you think his speed on the track will be affected? d. Test your ideas using the simulation and make corrections to your predictions.
4. Consider if the 60kg Skater Gal rode on the same Frictionless Track and Starting point. a. How do you think her position, speed and energy will compare to the Guy’s? b. Sketch what the graph might look like between 0 and 5 seconds. c. If you used the same amount of track friction, how would your answers to question three
compare? d. Test your ideas using the simulation and make corrections to your predictions.
6/28/2008 Loeblein http://phet.colorado.edu