beef cattle and range - oregon state university
TRANSCRIPT
1980 Progress Report...
Beef Cattle and Range
Eastern Oregon Land Resource Planning and Oregon State University Beef Cattle DayJohn Day, Oregon
Special Report 583Agricultural Experiment Station
May 1980Oregon State University, Corvallis
CONTENTS
WATERSHED CONSIDERATIONS IN LAND RESOURCE PLANNINGJohn Buckhouse 1
HOW A FOREST AFFECTS THE FORAGE CROPBill Krueger
UTILIZATION OF LIQUID SUPPLEMENTS WITH RYEGRASS STRAWR. 0. Kellems
BEEF CATTLE BREEDING AT OREGON STATE UNIVERSITYWilliam D. Hohenboken
THE OREGON RANGE VALIDATION PROJECT FROM A RANCHER's VIEW POINTRich Wilburn
SELECTION OF APPROPRIATE GRAZING SYSTEMS--A VITAL PART OFRANGELAND RESOURCE MANAGEMENT PLANNINGW. A. Laycock 25
TAKING AN ECOLOGICAL APPROACH TO MULTIPLE USE PLANNINGFrederick C. Hall 37
THE LOCAL COSTS OF PUBLIC LAND USE RESTRICTIONSFrederick W. Obermiller 48
THE NEED FOR COOPERATIVE LAND USE PLANNINGLewis M. Work 72
COORDINATED RESOURCE PLANNINGArleigh Isley 74
8
18
22

CONTRIBUTORS
Dr. John Buckhouse - Assistant Professor Range Resource,Oregon State University.
William K. Farrell - Executive Vice-President, Blue Mountain ResourceCouncil.
Paula Fitzgerald - President, Withycombe Club, Oregon State University.
Dr. Fred Hall - Principal Plant Ecologist, U.S. Forest Service.
Dr. W. D. Hohenboken - Associate Professor of Animal Breeding andGenetics, Oregon State Universtiy.
Arleigh Isley - Extension Chairman, Grant County.
Dr. Richard Kellems - Assistant Professor Animal Nutrition, Oregon StateUniversity.
Dr. Bill Krueger - Leader Range Resources, Oregon State University.
Dr. William A. Laycock - Agricultural Research; Science and EducationAdministration U.S.D.A., Colorado State University.
Dr. Fred Obermiller - Associate Professor of Agriculture Resource Economics,Oregon State University.
Dr. J. E. Oldfield - Head, Department of Animal Science, Oregon StateUniversity.
Rich Wilburn - Grant County Rancher.
King Williams - Grant County Rancher, President Grant County Stock GrowersAssociation.
Lew Work - Forester, Boise Cascade Corporation.
WATERSHED CONSIDERATIONS IN LAND RESOURCE PLANNING
John C. Buckhouse
Watershed management can be defined as the science and art ofcontrolling the quantity, quality, and timing of streamflow froma land basin while protecting and enhancing products of the land.Consequently, there are many activities and intensities of use whichhave a corresponding effect upon the environment of an area.
This paper focuses primarily on the drier regions of the Westand deals only with principal uses of these lands.
Rangeland watershed management can be described in terms ofa water balance equation like this: SRO = P - I - ET + AS where
SRO = surface runoffP = precipitationI = infiltration
ET = evaporation and transpiration (evapotranspiration)AS = change in soil moisture storage
Since we generally are unable to alter P, we must look toother parts of the equation to influence the amount, quality or
•the timing of the discharge of streamflow. Any of the severalland uses which affect these variables therefore will affect SRO.
For example, infiltration generally is enhanced by dense vege-tative cover, by roots which bind and provide organic matter tothe soil, and by certain microbes or soil organisms which "work"the soil and make it friable. On the other hand, anything that com-pacts the soil, be it mechanical or flesh and bone, usually de-creases infiltration. Soil temperature and moisture levels playan important ameliorating role, however. A dry soil compacts lessthan a wet one. A tightly frozen soil is much less subject to com-paction than an unfrozen one. To enhance infiltration, considerlogging or grazing the area during the winter months when the groundis frozen and avoiding it during the early spring when it is bothwet and unfrozen.
Evapotranspiration reductions vary according to elevation andclimate. A hot, dry climate may be subject to far more evapora-tive loss than it is to transpirational loss. This is especiallytrue if the plants growing there have adapted themselves to methodsof transpirational reduction. An example of such an adaptationwould be the ability of sagebrush to drop its ephemeral leaves,retaining only the smaller, more water-efficient persistent leaves,during times of soil moisture stress. On the other hand, at cooler,higher elevations, the physical evaporative process may be muchless important than the transpirational process.
In the first example, an attempt to "save" water by cuttingor grazing vegetation would be counterproductive since it would
1
simply expose more soil surface to direct sunlight and increase theevaporative loss. In a wetter situation, however, the removal ofcertain overstory species could provide additional water for stream-flow.
One generally finds that vegetation manipulation in arid andsemi-arid regions does not increase streamflow, but that it may"release" available water for another purpose. For example, a jun-iper removal project or a sagebrush eradication program and subse-quent grass planting are not likely to result in more water in theJohn Day River. However, it may be beneficial in increasing theherbaceous production several fold.
There is a great deal of interest and concern about water qual-ity as it is impacted by land usage. In the arid and semi-aridWest, this concern often seems to focus on livestock grazing inriparian zones. The volume of research in this area is skimpy(Meehan and Platts, 1978). From the few scientific and observation-al studies available, it is clear that abusive grazing can causedeterioration of streambank physiognomy, an increase in water tem-peratures, and an increase in bacterial and sediment load. However,what is less certain is what degree of use these areas are able towithstand and what managerial techniques are available for amelior-ating these effects.
In a multi-disciplinary study funded by the Pacific NorthwestForest and Range Experiment Station, Range and Wildlife HabitatLaboratory, USFS, La Grande, Oregon, a number of grazing seasonsand systems are being evaluated for these kinds of things. It issomewhat early to predict what the ultimate outcome from this studywill be, but experience has convinced me that riparian zones arecomplex and rather resilient. I suspect that with proper grazingmanagement, taking advantage of season of use, intensity of use,and animal behavior or preferences, it should be possible to designa prescription of grazing management for any riparian zone whichwill enable the manager to maintain the productivity of all the re-sources which emanate from this zone.
Literature Cited
Meehan, W. R., and W. S. Platts. 1978. Livestock grazing and theaquatic environment. J. Soil and Water Cons. Vol. 33:274-278.
2
HOW A FOREST AFFECTS A FORAGE CROP
William C. Krueger
Forage production on forested rangelands is principally controlled bythe trees making up the overstory. The trees exercise this control by modify-ing the complex interaction of light, heat, litter accumulation, and moisture.These environmental factors usually react within a continually changing eco-system further influenced by fluctuations in weather, periodic logging, andgrazing by livestock and wildlife.
Forest overstory and understory vegetation occupy the land somewhatindependently. The same tree canopy can exist over completely different under-story vegetation under normal circumstances. In the Pacific Northwest, wefind natural stands of ponderosa pine with an understory of needleandthreadgrass or natural stands of ponderosa pine with an understory of ninebark.
On the other hand, similar understory stands can exist beneath a differentoverstory. We have stands of ponderosa pine/ninebark as indicated above, buton different sites we can find Douglas-fir as the overstory dominant with nine-bark and its associated species as the understory dominants. Each of thesecommunity types responds to environmental stresses differently with respect toabsolute change but similarly in the nature of change to a specific pressure.When the community type or habitat type is known, specific responses to manage-ment can be defined.
Within a community type, development or management of the overstory in-fluences production, composition, and forage value of the understory in a predict-able fashion. Initial knowledge of the community type is necessary if actualpredictions of response are to be made.
Light
A tree overstory has a direct influence on light received by understoryvegetation. Some plant species grow and reproduce best under high light intensi-ties and others require some degree of shading for survival. Consequently, youwould not expect to find a shade tolerant plant such as meadowrue in a clearcutnor would you find bull thistle under a full canopy. Most grasses grow well infull light but can tolerate varying degrees of shade.
A tree canopy reduces the total light received by understory vegetation andfilters light rays selectively. A deciduous tree canopy reduces the relativeproportion of red and blue light rays, the most photosynthetically active rays.Light penetrating the canopy has proportional enrichment of orange, yellow, green,and infra-red. Yellow and orange light is related to cell elongation, whichpartially explains elongation often seen in shaded plants. Infra-red interactswith red to control plant hormones and subsequent induction of morphologicalchanges such as flowering. A coniferous tree canopy affects light quality simi-larly to a deciduous tree canopy but filters less of the red light. Consequently,light quality under the coniferous canopy is quite similar to that received inthe open on a cloudy day.
3
The specific ecological role of light quality is not well understood andfrequently is considered of little or no importance. Since little informationis available, this conclusion seems premature. The change in light qualityfrom shading probably has little influence on presence or absence of most plantspecies but may well influence physiological and morphological characteristicsof understory plants. Changes in these plant attributes could have significantbearing on nutritional value of understory forages as will be discussed later.
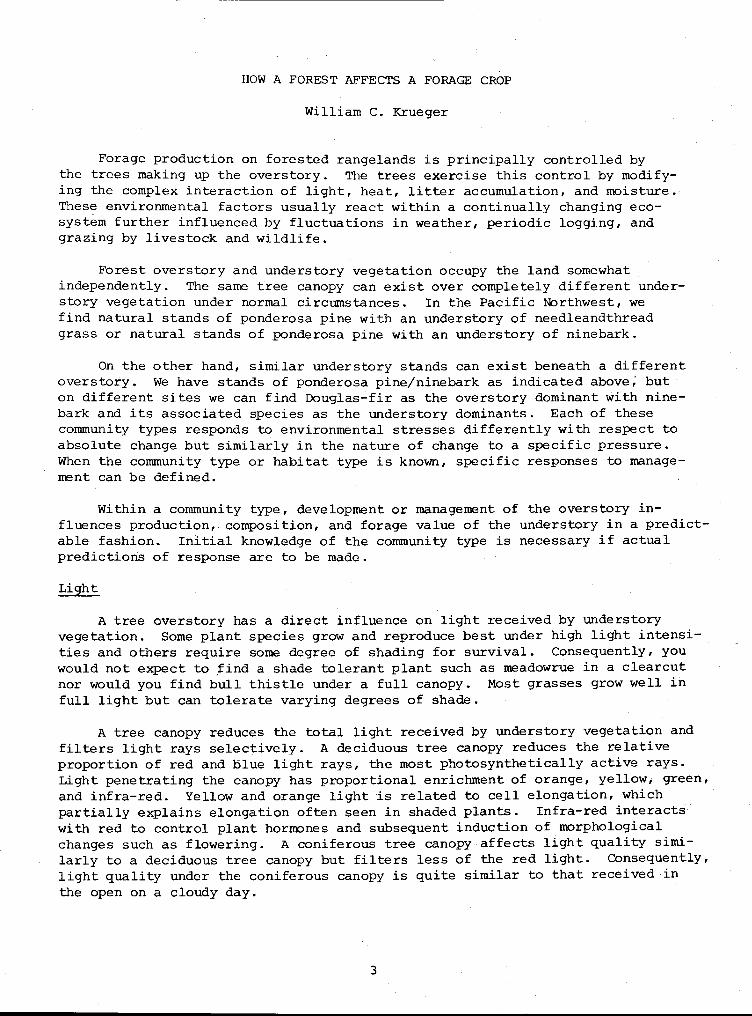
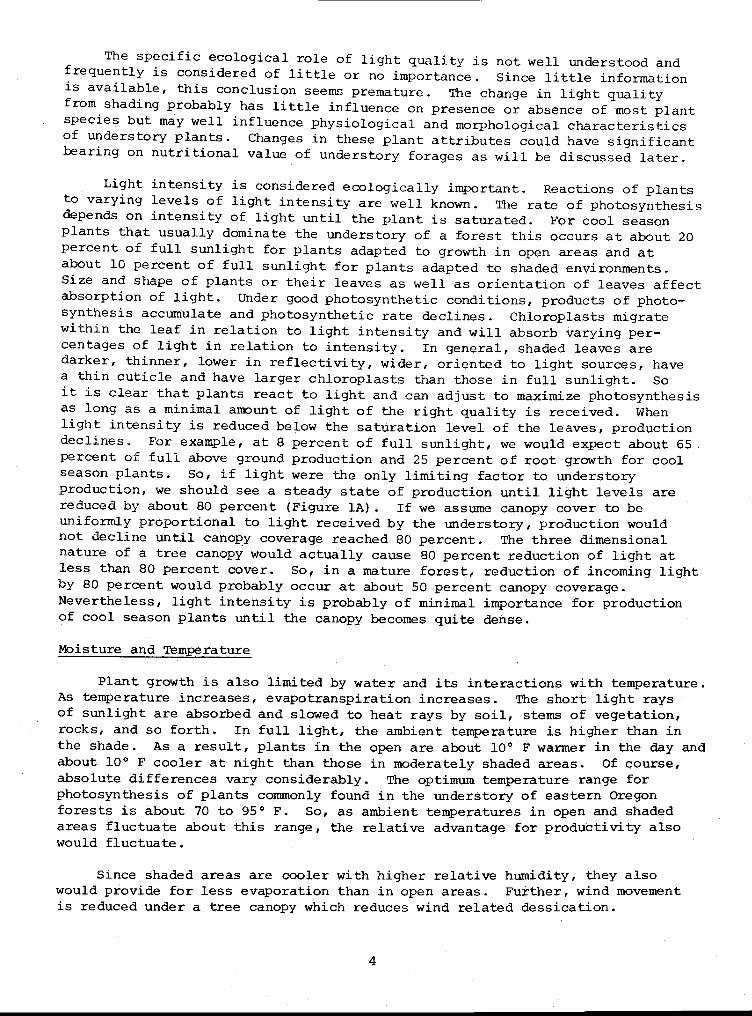
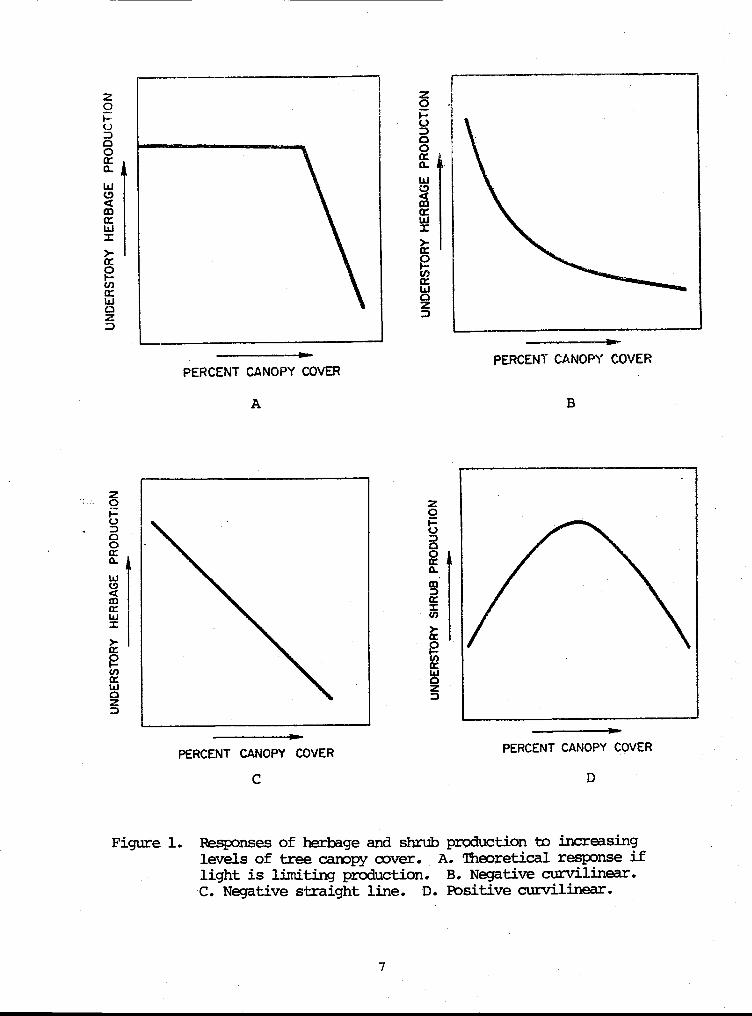
Light intensity is considered ecologically important. Reactions of plantsto varying levels of light intensity are well known. The rate of photosynthesisdepends on intensity of light until the plant is saturated. For cool seasonplants that usually dominate the understory of a forest this occurs at about 20percent of full sunlight for plants adapted to growth in open areas and atabout 10 percent of full sunlight for plants adapted to shaded environments.Size and shape of plants or their leaves as well as orientation of leaves affectabsorption of light. Under good photosynthetic conditions, products of photo-synthesis accumulate and photosynthetic rate declines. Chloroplasts migratewithin the leaf in relation to light intensity and will absorb varying per-centages of light in relation to intensity. In general, shaded leaves aredarker, thinner, lower in reflectivity, wider, oriented to light sources, havea thin cuticle and have larger chloroplasts than those in full sunlight. Soit is clear that plants react to light and can adjust to maximize photosynthesisas long as a minimal amount of light of the right quality is received. Whenlight intensity is reduced below the saturation level of the leaves, productiondeclines. For example, at 8 percent of full sunlight, we would expect about 65.percent of full above ground production and 25 percent of root growth for coolseason plants. So, if light were the only limiting factor to understoryproduction, we should see a steady state of production until light levels arereduced by about 80 percent (Figure 1A). If we assume canopy cover to beunifoLmly proportional to light received by the understory, production wouldnot decline until canopy coverage reached 80 percent. The three dimensionalnature of a tree canopy would actually cause 80 percent reduction of light atless than 80 percent cover. So, in a mature forest, reduction of incoming lightby 80 percent would probably occur at about 50 percent canopy coverage.Nevertheless, light intensity is probably of minimal importance for productionof cool season plants until the canopy becomes quite dense.
Moisture and Temperature
Plant growth is also limited by water and its interactions with temperature.As temperature increases, evapotranspiration increases. The short light raysof sunlight are absorbed and slowed to heat rays by soil, stems of vegetation,rocks, and so forth. In full light, the ambient temperature is higher than inthe shade. As a result, plants in the open are about 10° F warmer in the day andabout 10° F cooler at night than those in moderately shaded areas. Of course,absolute differences vary considerably. The optimum temperature range forphotosynthesis of plants commonly found in the understory of eastern Oregonforests is about 70 to 95° F. So, as ambient temperatures in open and shadedareas fluctuate about this range, the relative advantage for productivity alsowould fluctuate.
Since shaded areas are cooler with higher relative humidity, they alsowould provide for less evaporation than in open areas. Further, wind movementis reduced under a tree canopy which reduces wind related dessication.
4
However, water conservation in the cooler environment can be negated by waterneeds of the trees. Much water is used for transpiration of trees and con-siderable moisture can be intercepted by the canopy and never reach the ground.Furthermore, soil moisture levels in deep shade may be more critical becauseof reduced root systems of the understory and competition for moisture betweenoverstory and understory plants. Overall, it appears that moisture or competi-tion for moisture is the dominant force governing total yield of vegetationunder typical forest-range canopies in eastern Oregon. But, during seasonswhen moisture is abundant, light and temperature may be the controlling factors.
Changes in quantity and quality of light received by forages under a treecanopy do influence the annual growth cycle. Shaded plants tend to flowerlater in the growing season than those in the open. In fact, some shaded plantsdon't flower at all. Because of this later development, nutritional qualityof shaded plants for grazers is superior to that of plants in the open whenplants in these open areas begin to mature. At this time, shaded plants arehigher in protein, digestible energy, and probably phosphorous and are thus morenutritious. Earlier in the season, plants in the open should be better sourcesof digestible energy and perhaps phosphorous than shaded plants but probablyno differences will exist in protein levels. However, at this time, plants inboth environments should have sufficient nutrient levels to meet needs of lac-tating cows or growing steers.
Relationships of Forages to Trees
Studies of herbage production and canopy coverage suggest four relation-ships: negative curvilinear, negative straight line, positive curvilinear, orno relationship.
Forages with a negative curvilinear relationship to the tree canopy haverapid decline in herbage yield at low levels of canopy cover with less declineat moderate and high levels of canopy cover (Figure 1B). This relationshipis found when the understory is dominantly herbaceous vegetation and the standof trees has been established for a long time. Most of the yield loss willhave occurred by the time the tree canopy has reached 20 to 30 percent cover.Therefore, light intensity probably has little influence on the response. Underthese circumstances, the root systems of trees in the stand are highly developedand competition with the understory for moisture is extreme. This can be furthercomplicated by moisture retention in litter of coniferous trees so even lessmoisture reaches the soil surface.
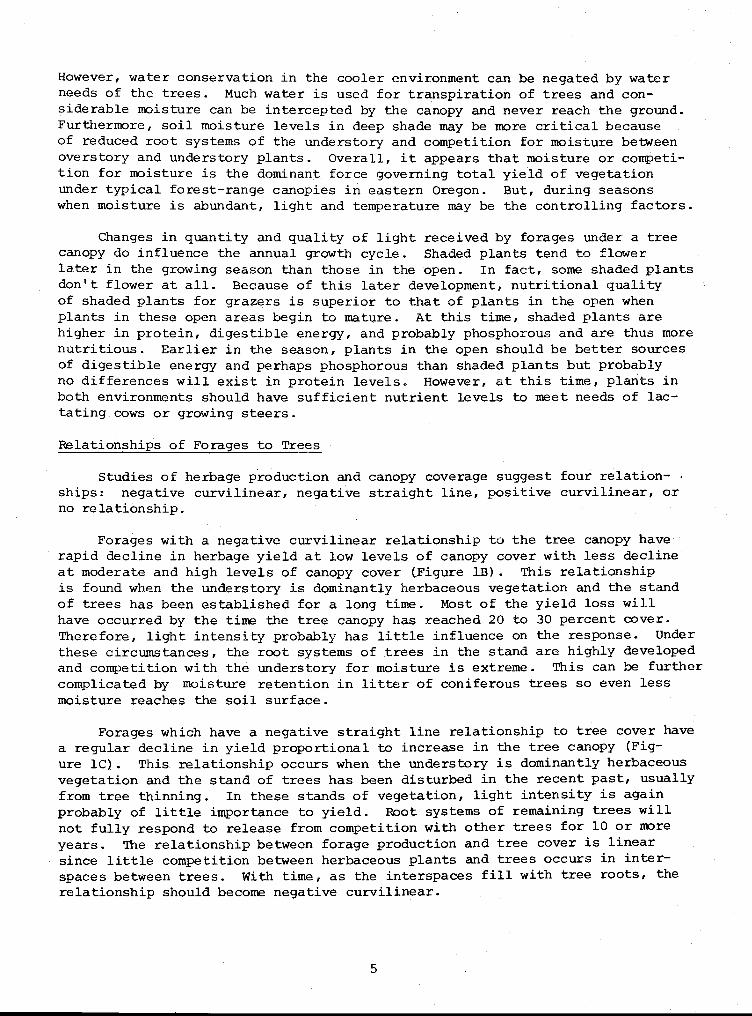
Forages which have a negative straight line relationship to tree cover havea regular decline in yield proportional to increase in the tree canopy (Figure 1C). This relationship occurs when the understory is dominantly herbaceousvegetation and the stand of trees has been disturbed in the recent past, usuallyfrom tree thinning. In these stands of vegetation, light intensity is againprobably of little importance to yield. Root systems of remaining trees willnot fully respond to release from competition with other trees for 10 or moreyears. The relationship between forage production and tree cover is linearsince little competition between herbaceous plants and trees occurs in inter-spaces between trees. With time, as the interspaces fill with tree roots, therelationship should become negative curvilinear.
5

Forages which have a positive curvilinear relationship to tree coverhave an increase in understory yield as canopy increases to a certain pointand then a decrease in yield with further increases in tree canopy (Figure 11)).This relationship has been found for understories dominated by shrubs. Theinitial increase is caused by light levels that are too high in open areasand under open canopies for shade tolerant shrubs. The reduction of yieldcomes at relatively high level of canopy cover and probably is caused by bothmoisture competition and reduced light intensity at the highest levels of canopycoverage.
No relationships between yield and tree cover have been found for foragesgrowing under aspen trees, which probably is related to both rooting patternsof aspen and the site characteristics where aspen grows. The clonal nature ofaspen insures a fairly uniform distribution of roots wherever the stems appear.This, coupled with fairly moist sites typical of aspen communities, suggeststhere is little opportunity for the aforementioned relationships to occur.Other work in which no relationships are found may be because of the limitedrange of canopies examined. Our work indicates no relationship between canopyof ponderosa pine and understory vegetation when studies are restricted toa 20 to 50 percent range of canopy coverage. Further, yield of some forbs likepussytoes and goldenrod in Pacific Northwest conditions appears independent ofcanopy coverage.
The most important feature of overstory/understory relation is that thereis no set response to all conditions. Accumulations of litter, particularlyunder ponderosa pine, can alter responses dramatically. If litter is notexcessive, most situations should fit one of the patterns identified, even thoughsome may intergrade with others. By deciding which, pattern of response is opera-ting, and defining the community type, management responses should become morepredictable and basic ecological responses can be separated from grazing re-sponses.
z0
U
0CCa.
CD
CD
cc
>-cc
Oz
z0
00
o_
co
co
)••CC
(/1CC
0zO
z0 •
O0
E
cr
>-CC0
Cf)Cr
O
PERCENT CANOPY COVER
A
a...-PERCENT CANOPY COVER
B
A
z0
UD00CC0-raDCC
N
>-CC0
U)CC
0z
PERCENT CANOPY COVER
C
PERCENT CANOPY COVER
D
Figure 1. production to increasing. Theoretical response ifB. Negative curvilinear.Positive curvilinear.
Responses of herbage and shrublevels of tree canopy cover. Alight is limiting pToduction.C. Negative straight line. D.
7
UTILIZATION OF LIQUID SUPPLEMENTS WITH RYEGRASS STRAW
R. 0. Kellems
Liquid protein supplements are palatable, readily accepted by livestockand can be self-fed. These characteristics, coupled with the need to providesupplemental protein to low quality forages to improve their utilization, haveincreased the use of liquid supplements by the United States cattle industry.Estimated sales in the United States in 1978 were 2.8 million tons.
Liquid supplements using urea as the only source of supplemental crudeprotein (CP) have shown negative responses (Phillips and Vavra, 1979) or noimprovement in forage utilization (Hennessy et al., 1978) when fed in combina-tion with low quality forages. The incorporation of true protein sources suchas fish solubles and alfalfa meal into liquid supplements has improved gains(Huber, 1972; Velloso et al., 1971).
The objectives of these studies were to evaluate the effect of incorpora-ting various preformed proteins--cottonseed meal, (CSM), single cell protein(SCP), feather meal (FM), liquefied fish (LF)--into liquid supplements fed incombination with chopped ryegrass straw and monitor the performance in thefeedlot.
MATERIALS AND METHODS
Trial I
In this trial, we evaluated the effect of incorporating 10 percent of thetotal crude protein (CP) of a 30 percent liquid supplement from either CSMor SCP which was harvested from a kraft pulp mill and sonically dehydrated.Both supplements were fed in combination with chopped ryegrass straw. Thesesupplemental sources of preformed protein were ground in a Wiley Mill equippedwith a 1 mm screen before being incorporated into the liquid supplements.The two liquid supplements were compared with a liquid supplement that hadurea as the only source of supplemental CP. Straw and liquid supplementswere fed free choice. The liquid supplements were dispensed from a 55-gallondrum equipped with a lick wheel. The formulation of the liquid supplementsis in Table 1.
Liquid supplements were prepared in a recirculating mixer equipped witha 5 horsepower centrifugal pump. The urea was dissolved initally in an equalamount of water before mixing the remaining ingredients. The ingredients werecirculated until all were dissolved or suspended.
Animals were randomly allotted to groups of five animals each with anaverage initial weight of 645 pounds. Group liquid supplement and strawconsumption and individual average daily gains (ADG) were determined. Waterand a salt mixture (50 percent trace mineralized salt + 50 percent bone meal)were available free choice. Animals were maintained on this feeding regimefor 59 days.
Trial II
Two 30 percent liquid supplements containing preformed protein (FM, SCP)were compared to a 100 percent urea based supplement when fed in combinationwith ryegrass straw under drylot conditions. Animal performance was monitoredin the liquid supplement feeding phase and subsequent feedlot phase.
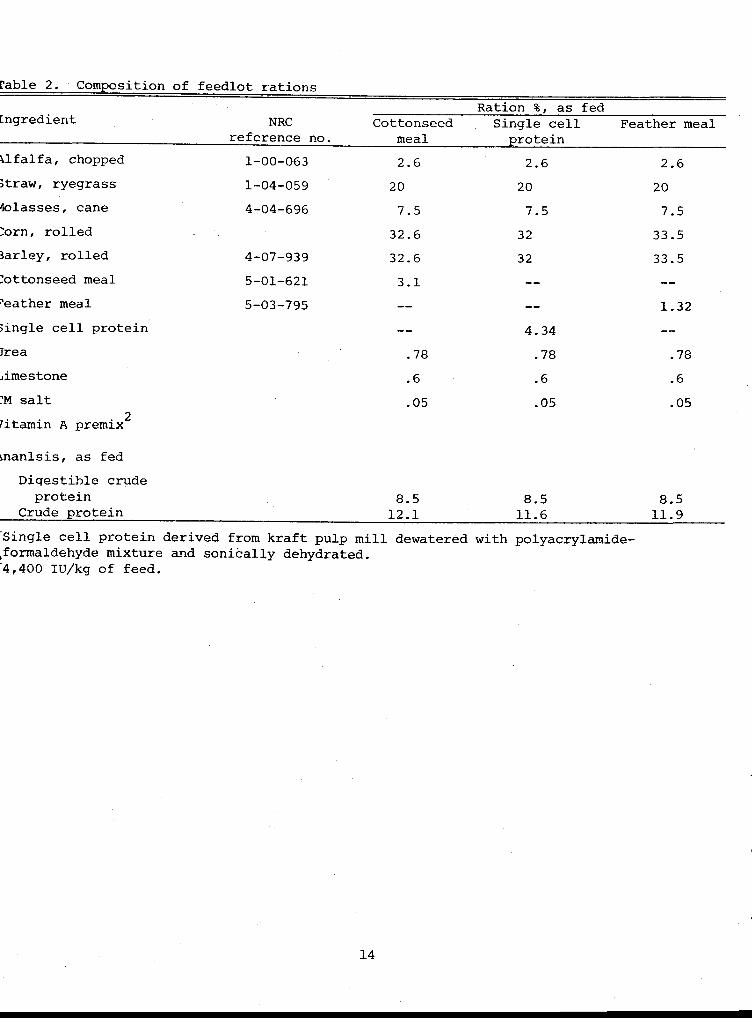
Initially, 15 beef steers were randomly allotted to three groups of fiveanimals each. Average initial weight was 680 pounds. Two of the liquid supple-ments had 10 percent of their total CP replaced with either FM or SCP derivedfrom a kraft pulp mill dewatered with a polyacrylamide-formaldehyde mixturebefore being sonically dehydrated. A Wiley Mill equipped with a 1 mm screenwas used to grind the SCP before incorporating it into the liquid supplement.The commercial feather meal was incorporated directly into the liquid supple-ment without grinding. The compositions of the liquid supplements are listedin Table 1. Steers were allowed free access to the liquid supplements andstraw during the 84-day feeding period. They had free access to water and asalt mixture (50 percent trace mineralized salt + 50 percent bone meal).Performance criteria were ADG, liquid supplement consumption, and straw con-sumption. After the liquid supplement feeding phase of the trial was completed,the animals were placed on a backgrounding ration for six days before the feed-lot portion of the trial began. The steers were randomly reallotted to threegroups of five animals each for the feedlot portion of the trial. In thefeedlot phase, three supplemental sources of protein--CSM, SCP, and FM--wereevaluated. Rations were formulated to contain 8.5 percent digestible CP on anas-fed basis using CP digestibility coefficients of 81 percent, 65.5 percent,•and 81 percent, respectively, for CSM, SCP, and FM. Compositions of the feed-lot rations are listed in Table 2. Steers were weighed at weekly intervals.The experiment was terminated for each steer when it reached 10 mm of backfatmeasured by an ultrasonic device. Performance criteria were ADG, feed con-sumption, feed conversion, and carcass data.
Trial III
This 120-day trial was completed in April 1980, and evaluated two molassesbased liquid supplements with the following basic formulation (Table 3):1) urea providing all supplementary CP; 2) 10 percent of the total CP pro-vided by liquefied fish. Each of these liquid supplements was fed to threegroups of five beef steers. The trial was divided into two phases. In thefirst 60-day period, the liquid supplements were formulated to contain 20 per-cent CP. During the second 60-day period, the CP level of the liquid supple-ment was increased to 30 percent CP. The liquid supplements were fed adlibitum via a lick tank. Steers had free access to chopped ryegrass straw,water, and a mineral mix (50 percent trace mineralized salt + 50 percent bonemeal) during the experimental period. The average initial weight of theanimals was 490.3 pounds. Average daily gains, liquid supplement, and strawconsumption were monitored. The objective of the trial was to determine theeffect that incorporating the liquefied fish and crude protein level (20 and 30percent) would have on ADG, liquid supplement, and straw consumption.
Data were analyzed statistically by use of one-way analysis of varianceprocedure as outlined by Steel and Torrie (1960) and means were comparedusing the Newman Kuel test for significance.
9
RESULTS AND DISCUSSION
Trial I.
The ADG, straw, and liquid supplement consumption was (pounds): .46, 9.7,1.37; .88, 8.8, 2.18; .33, 6.80, .62, ex pressed on a dry matter basis, respec-tively, for the urea, SCP, and CSM groups. The LS with SCP resulted ingreater gain (P<.10) than did the other protein sources. Average daily drymatter (DM) intakes for liquid supplement + ryegrass straw were (pounds): 11.0,11.0, and 7.4, respectively, for urea, SCP, and CSM groups. The ratios ofstraw intake to liquid supplement consumption (DM basis) were 7.1, 4 and 11,respectively, for urea, SCP, and CSM groups. This suggests that the source ofsupplemental preformed protein has an effect on consumption of the liquid supple-ments since other components of the liquid remained constant. The lower intakeof the CSM groups would explain the reduction in performance, but their per-formance was higher than expected, based on consumption data. The SCP groupsconsumed approximately the same amount of dry matter as did the urea groups,but their ADG was almost twice that of the urea group. This suggests that theincorporation of preformed protein in liquid supplements does improve per-formance, which would agree with the work of Jones et al. (1976). This effectcould be related to the quality and amount of protein reaching the lowerdigestive tract or to a more gradual metabolism in the rumen.
A problem noted with SCP and CSM liquid supplements was the inability tomaintain them in suspension. This might have accounted in part for differencesobserved in performance among the liquid supplements. Based on previous invitro solubility work (Kellems and Church, 1979), the SCP seems to be lesssoluble under simulated rumen conditions than CSM, suggesting that more is by-passing rumen degradation. During the initial 10 days on trial, all groupslost weight, then it appeared that they became adapted to the liquid supple-ments and started to gain and continued to gain during the remainder of thetrial.
Trial II.
The ADG for the 88-day, liquid supplement feeding period were (pounds):1.25, 1.34, and 1.58, respectively, for the urea, SCP, and FM groups. TheseADGs were not significantly different, but a trend for an improvement inperformance was observed for the liquid supplements containing preformedprotein. The FM showed the greatest improvement in performance.
The average individual daily consumption of dry matter from the liquidsupplement, straw, and liquid supplement + straw were (pounds): 1.94, 11.8,13.8; 1.36, 12.7, 14.1; 2.5, 11.97, 14.5, respectively, for urea, SCP, and FMgroups. The ratios of dry matter intake from straw/liquid supplement were6.1, 9.3, 3.7, respectively, for urea, SCP, and FM groups. These differencesin relative consumption of straw and liquid supplements are most likely relatedto preference or to an effect that the liquid supplements are having on nutrientutilization in vivo. The relative intake of preformed protein that is by-passing rumen degradation possibly could account for differences in performanceobserved. Whatever the reason for the differences, there was a pronouncedeffect on the relative amounts of liquid supplement and straw consumed amongthe three groups.
10
Steers were placed on a common ration for six days before the initiationof the feedlot trial; during this time they lost an average of 38.7 pounds perhead.
Feedlot performance data are summarized in Table 4. The ADG in thefeedlot were (pounds): 3.92, 4.64, 4.58, respectively, for CSM, FM, and SCPgroups. The FM and SCP groups gained faster (P<.10) than the CSM groups.These results would suggest that the digestible CP values for FM (81 percent)and SCP (65.6 percent) are underestimating their utilization in finishingrations. The general condition of the steers changed rapidly, with theaverage days to reach 10 mm backfat being 88, 82.5, 81.2, respectively, forCSM, FM, and SCP groups.
Trial III
The ADG, straw, and liquid supplement consumption (DM basis) for the 20percent CP feeding phase were (pounds): .39, 3.18, 7.11, .51, 3.99, 6.82,respectively, for the urea and liquefied fish supplements. The ADG for theliquefied fish groups tended to be higher compared to the urea groups. Theaverage daily total consumption of dry matter from straw and liquid supple-ment was 10.3 and 10.8, respectively, for urea and liquefied fish supplementedgroups. Dry matter intake expressed as a percent of body weight were; 2.03percent and 2.07 percent, respectively, for urea and liquefied fish groups.The ratio of straw to liquid supplement intake (DM basis) were 2.2 and 1.9,respectively, for the urea and liquefied fish groups.
During the second phase of this trial, when the CP levels were increasedto 30 percent, the ADG, liquid supplement, and straw consumptions (expressedon a dry matter basis) were (pounds): .51, 1.51, 7.13; .81, 2.0, 7.61,respectively, for the urea and liquefied fish groups. The average daily drymatter expressed as a percentage of body weight were 1.61 percent and 1.68percent, respectively, for the urea and liquefied fish groups. The ratio ofstraw to liquid supplement intake (DM basis) were 4.79 and 4.22, respectively,for the urea and liquefied fish groups. When the CP level of the liquidsupplement was increased, the consumption of liquid supplement was reduced andthe straw intake increased. These results would suggest that the 20 percentlevel was less effective in maximizing the utilization of ryegrass strawcompared to the 30 percent level. The incorporation of liquefied fish intoliquid supplements increased the consumption of the liquid supplement but didnot decrease consumption of straw.
Results from these three trials indicate liquid supplements fed incombination with ryegrass straw can be used to maximize the use of low qualityforages and crops residues in producing beef in Oregon.
1 1
LITERATURE CITED
Jones, S. R., W. B. Anthony, and J. P. Cunningham. 1976. Urea and proteinliquid supplements for steers. Proc. West. Sec. Amer. Soc. Anim. Sci.27:284.
Kellems, R. 0. and D. C. Church. 1979. Nutritional evaluation of singlecell protein harvested from secondary pulp mill clarifiers. Proc. West.Sec. Amer. Soc. Anim. Sci. 30:259.
Hennessy, D. W., J. V. Nolan, V. W. Norton, F. M. Ball, and R. A. Leng. 1978.Response of beef cattle to infused supplements of urea and of urea-molasses when offered a low quality grass hay. Aust. J. Exper. Agr.Anim. Husb. 18:477.
Huber, J. T. 1972. Research on liquid nitrogen supplements for dairycattle. J. Anim. Sci. 34:166.
Phillips, R. L. and M. Vavra. 1979. The influence of urea-molasses supple-ments on animal performance and fiber digestibility. Proc. West. Sec.Amer. Soc. Anim. Sci. 29:291.
Steel, R. G. D. and J. H. Torrie. 1960. Principles and Procedures ofStatistics. McGraw-Hill Book Co., New York.
Velloso, L., T. W. Perry, R. C. Peterson, and W. M. Beeson. 1971. Effectof dehydrated alfalfa meal and of fish sólubles on growth and nitrogenand energy balance of lambs and beef cattle fed a high urea liquidsupplement. J. Anim. Sci. 32:764.
12
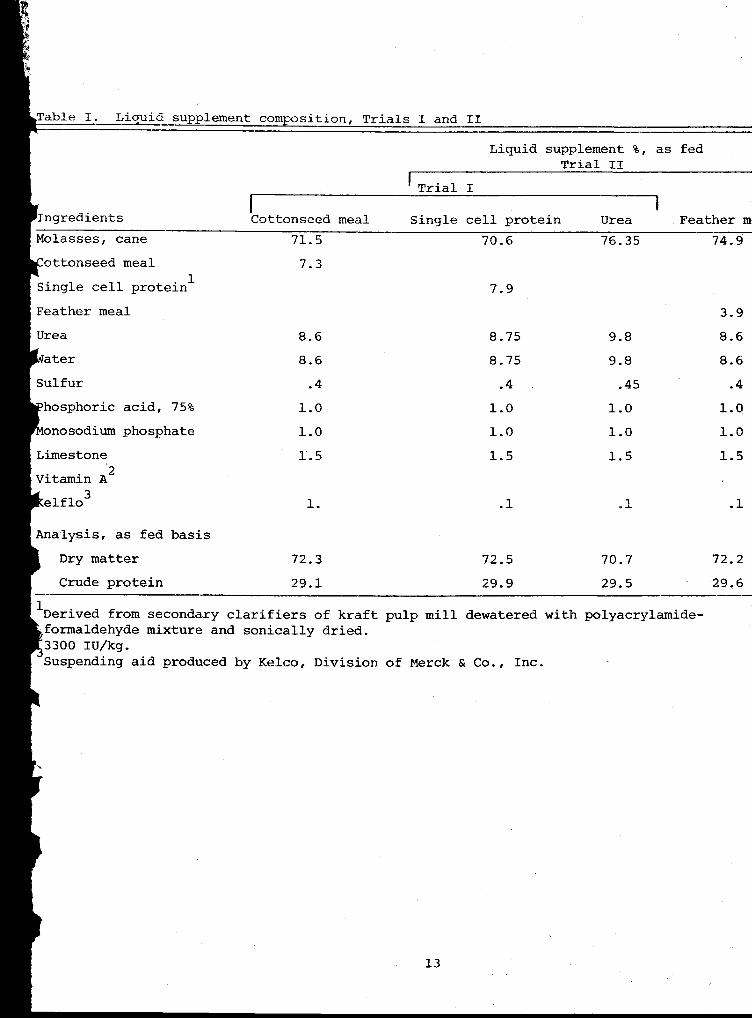
Table I. Liquid supplement composition, Trials I and II
Ingredients
Molasses, cane
Single cell protei
ottonseed meal1
Feather meal
Urea
ater
Sulfur
hosphoric acid, 75%
onosodium phosphate
Limestone
Vitamin A2
elflo3
Analysis, as fed basis
Dry matter
Crude protein
Liquid supplement %, as fedTrial II
Trial I
Feather m4Cottonseed meal Single cell protein Urea71.5 70.6 76.35 74.9
7.3
7.9
3.9
8.6 8.75 9.8 8.6
8.6 8.75 9.8 8.6
.4 .4 .45 .4
1.0 1.0 1.0 1.0
1.0 1.0 1.0 1.0
1.5 1.5 1.5 1.5
1. .1 .1 .1
72.3 72.5 70.7 72.2
29.1 29.9 29.5 29.6
Derived from secondary clarifiers of kraft pulp mill dewatered with polyacrylamide-formaldehyde mixture and sonically dried.3300 IU/kg.Suspending aid produced by Kelco, Division of Merck & Co., Inc.
13
Cable 2. Composition of feedlot rations
Engredient NRCreference no.
Ration %, as fedCottonseed
mealSingle cell
proteinFeather meal
\lfalfa, chopped 1-00-063 2.6 2.6 2.6
straw, ryegrass 1-04-059 20 20 204olasses, cane 4-04-696 7.5 7.5 7.5
)prn, rolled 32.6 32 33.5
3arley, rolled 4-07-939 32.6 32 33.5
Cottonseed meal 5-01-621 3.1
'eather meal 5-03-795 1.32
Single cell protein 4.34
Jrea .78 .78 .78
Limestone .6 .6 .6
14 salt .05 .05 .05
Titamin A premix2
►manlsis, as fedDigestible crude
protein 8.5 8.5 8.5Crude protein 12.1 11.6 11.9
'Single cell protein derived from kraft pulp mill dewatered with polyacrylamide-,formaldehyde mixture and sonically dehydrated..4,400 IU/kg of feed.
14
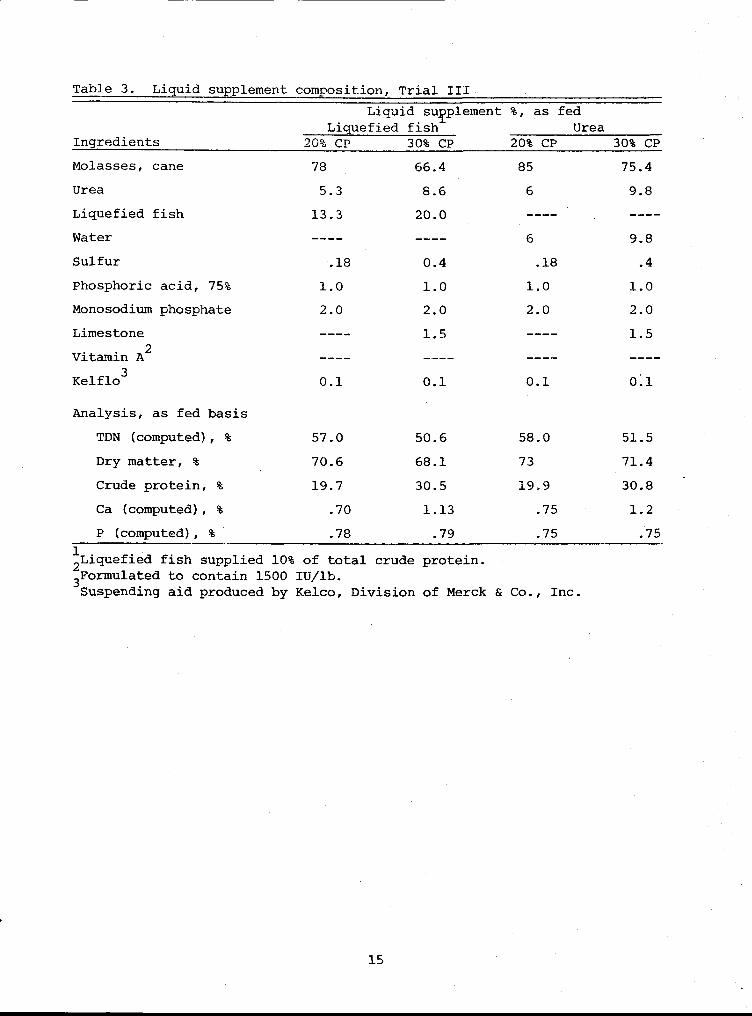
Table 3. Liquid supplement composition, Trial III
Ingredients
Liquid supplement %, as fedLiquefied fish Urea
20% CP 30% CP 20% CP 30% CP
Molasses, cane 78 66.4 85 75.4
Urea 5.3 8.6 6 9.8
Liquefied fish 13.3 20.0
Water 6 9.8
Sulfur .18 0.4 .18 .4
Phosphoric acid, 75% 1.0 1.0 1.0 1.0
Monosodium phosphate 2.0 2.0 2.0 2.0
Limestone 1.5 1.5
Vitamin A2
Kelflo3
0.1 0.1 0.1 0.1
Analysis, as fed basis
TDN (computed), % 57.0 50.6 58.0 51.5
Dry matter, % 70.6 68.1 73 71.4
Crude protein, % 19.7 30.5 19.9 30.8
Ca (computed), % .70 1.13 .75 1.2
P (computed), % .78 .79 .75 .75121'iquefied fish supplied 10% of total crude
3Formulated to contain 1500 IU/lb.Suspending aid produced by Kelco, Division of Merck & Co., Inc.
protein.
15
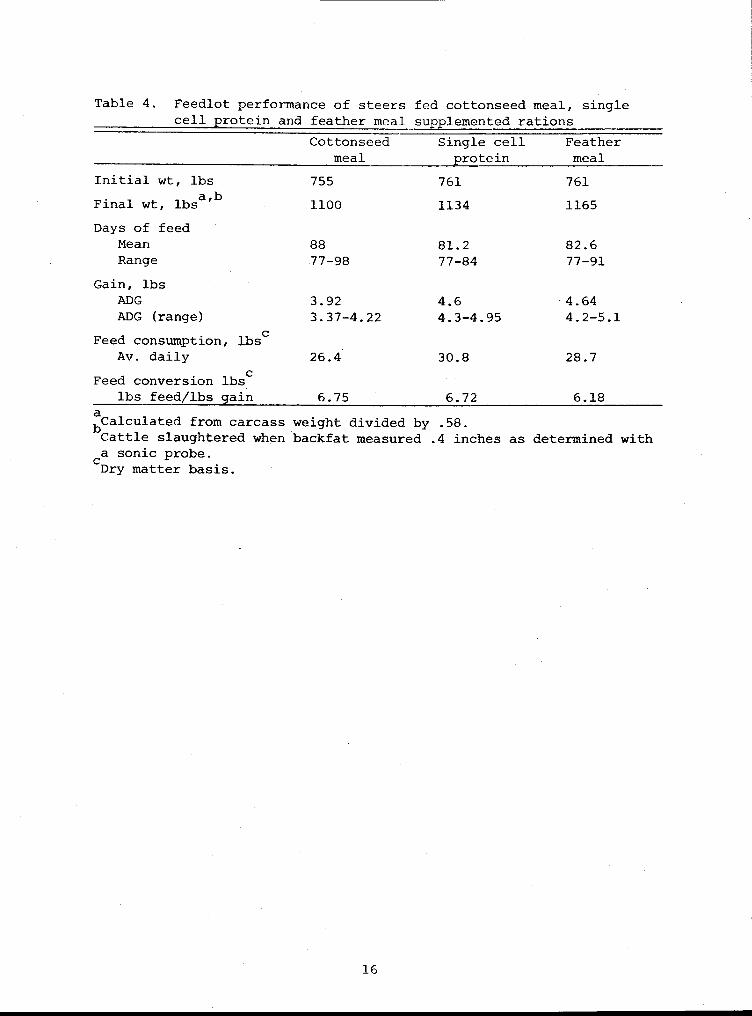
Table 4. Feedlot performance of steers fed cottonseed meal, singlecell protein and feather meal supplemented rations
Cottonseedmeal
Single cellprotein
Feathermeal
Initial wt, lbs 755 761 761
Final wt, lbsa,b
1100 1134 1165
Days of feedMean 88 81.2 82.6Range 77-98 77-84 77-91
Gain, lbsADG 3.92 4.6 4.64ADG (range) 3.37-4.22 4.3-4.95 4.2-5.1
Feed consumption, lbscAv. daily 26.4 30.8 28.7
Feed conversion lbsc
lbs feed/lbs gain 6.75
6.72 6.18abCalculated from carcass weight divided by .58.Cattle slaughtered when backfat measured .4 inches as determined with
ca sonic probe.Dry matter basis.
16
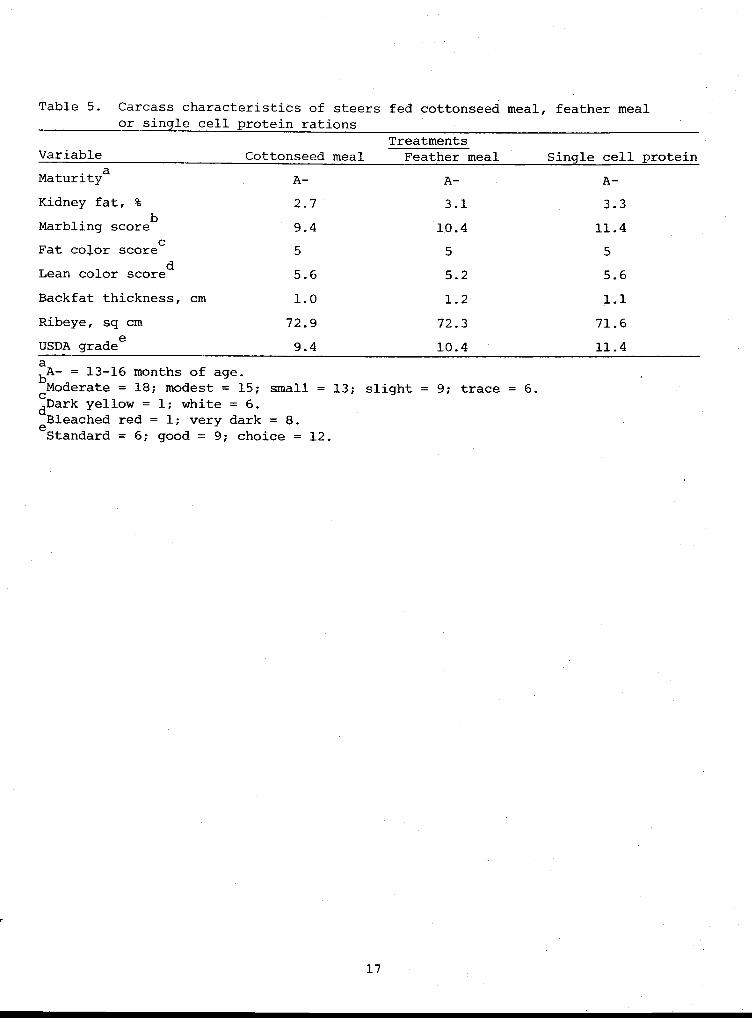
Table 5. Carcass characteristics of steers fed cottonseed meal, feather mealor single cell protein rations
Treatments Variable Cottonseed meal Feather meal Single cell protein
MaturityaA- A- A-
Kidney fat, % 2.7 3.1 3.3
Marbling scoreb
9.4 10.4 11.4
Fat color scorec5 5 5
Lean color scored5.6 5.2 5.6
Backfat thickness, cm 1.0 1.2 1.1
Ribeye, sq cm 72.9 72.3 71.6
USDA gradee
9.4 10.4 11.4abA- = 13-16 months of age.
cModerate = 18; modest = 15; small = 13; slight = 9; trace = 6.
dDark yellow = 1; white = 6.
eBleached red = 1; very dark = 8.Standard = 6; good = 9; choice = 12.
17

BEEF CATTLE BREEDING AT OREGON STATE UNIVERSITY
William D. Hohenboken
Beef cattle have made an important contribution to the agriculturaleconomy of the Pacific Northwest for as long as the area has had an agri-cultural economy. Beef production now accounts for larger farm receipts thanany other commodity in Oregon. OSU has about 706,000 cows and replacementheifers with some 75 percent located east of the Cascade Mountains. Overtime, beef populations and beef production systems have changed in responsenot only to changing availability of land and other inputs but also tochanges in available technology. This tendency is almost certain to continueand to accelerate in the foreseeable future. Factors influencing changes inbeef production systems include:
1) Changing patterns of beef consumption caused by lower demand forroasts and greater demand for ground beef by fast food outlets.This has been accompanied by a de-emphasis on conformation in gradestandards.
2) Changing price relationships among various producer inputs--capital,land, and feed grains, for example.
3) The recent availability of new breeds--largely continental European--which differ from traditional beef breeds in many importantcharacteristics.
Producers are faced with a confusing array of choices as they attemptto anticipate the future, to define production constraints, and to evaluatealternate production systems. Our research in beef cattle breeding andmanagement at Oregon State University is designed to help producers choosemanagement and genetic alternatives for profitable and efficient productionof beef that are acceptable to current and future consumer demand. The pur-pose of this report is to describe the status of some of that research.
CROSSBREEDING AT THE OSU SOAP CREEK RANCH
In the summer of 1978, approximately 200 Hereford, Angus and Angus X Here-ford crossbred cows were divided at random into four groups, the groups beingmated by artificial insemination to Tarentaise, Simmental, or Pinzgauer siresor to British breed bulls by natural service. The calves were born in Marchand April and were weaned in October 1979. Steer calves from these groups areinvolved in pasture and feedlot nutrition research at OSU; heifers weresaved for replacement and will be mated this summer. During June and July 1979,the cows were again mated to the same sire breeds, so our second crop ofSimmental, Tarentaise, Pinzgauer, and British breed and crossbred calves isnow on the ground. Again, steers and excess heifers will be alloted tonutrition, management, or physiology research after weaning; heifers again willbe saved as replacements. Our goal, over time, is to replace the cow herd withtheir crossbred daughters.
18

An interesting study has been superimposed onto this mating scheme byLindsay Norman, one of our graduate students. During both the 1979 and1980 calving season, blood samples have been collected from calves approximately24 and 36 hours after birth. Blood and colostrum samples from cows also werecollected within 12 hours of calving. The goals of the experiment are todetermine whether there are differences among cows in the production of anti-bodies in the colostrum milk and whether differences exist among calves intheir ability to absorb those antibodies from the first nursings. Differencesin the amount of antibodies accumulated by calves could be reflected in differ-ences in survival and vigor. If there are genetic differences in colostralantibody production or absorption, as research in sheep and dairy cattleindicates might be the case, the trait could be included in selection schemes,particularly in the choice of sires for artificial insemination. This work isbeing done in cooperation with Dr. Keith Kelly in the Department of AnimalScience at Washington State University.
As our crossbreeding study enters the second phase, when the exoticcrossbred heifers enter production in the herd, females will be evaluated, atthe appropriate stage of the life cycle, for as many of these characteristicsas possible:
1) Age at first estrus.
2) Length and regularity of estrous cycles.
3) Calving difficulty and pelvic size.
4) Days from parturition to first estrus.
5) Services per conception.
6) Calving interval.
7) Milk production and composition.
8) Mastitis incidence.
9) Dominance, maternal, and grazing behavior.
10) Diet preference or composition.
11) Weight and weight change pattern over time.
12) Condition score and fat thickness.
13) Reasons for mortality and removal from the herd.
We eventually will be able to characterize the Simmental, Tarentaise,and Pinzgauer breeds for their relative strengths and weaknesses in thecoastal Pacific Northwestern environment and to compare them, as crossbreds,for total production efficiency with Herefords and Hereford X Angus cross-breds. We also will be able to describe the importance of the traits listedabove on total production efficiency.
19
IDENTIFICATION OF TRAITS PREDICTIVE OF ECONOMIC MERIT
Many economically important traits in livestock populations aredifficult to change by genetic selection because they are not practical tomeasure (longevity of beef cows, for example), because they are limited toexpression in one sex (milk production in dairy cattle, for example), orbecause they are lowly heritable (reproductive traits in all classes of live-stock). An alternative to direct selection or progeny testing for such traitsis to find a highly heritable trait that is highly genetically correlated tothe trait of interest, then practice selection upon that trait. In so doing,the population should change, in the desired direction, for the trait in whichwe actually are interested.
This identification of traits for indirect selection is easier said thandone, but there are examples where it has been effective. For example, bullswith large testicles are more fertile and indications are that their daughtersare more fertile as well. In mice, males with larger testicles sire daughterswith higher ovulation rates and litter sizes; European research is being con-ducted to determine whether this is true in sheep as well. Our research onantibody level in young calves is this same type. We hope absorption ofcolostral antibodies is heritable and that it is highly correlated with calfvigor and survival.
Another of our graduate students, Steve Lukefahr, is conducting anexperiment to determine whether the length of the midpiece in bull sperm cellsis heritable and whether it is predictive of any important traits in cattlepopulations. Research conducted in Scotland found that midpiece length inmice was highly heritable and, what's more { that it was associated with growthrate. Since the midpiece is composed of mitochondria, the cellular organellesresponsible for the generation of energy, it is reasonable to examine therelationship between midpiece length and traits dependent on energy metabolism.
Steve first ran a pilot trial using frozen semen from 39 Holstein bulls.(The semen was donated by American Breeders Service at DeForest, Wisconsin,assistance gratefully acknowledged.) In that trial, he found that midpiecelength did vary among bulls but that midpiece length did not vary importantlybetween ampules of semen collected from the same bull at least six months apart.There was an indication from this trial that midpiece length was heritable. Itwas not related at all to the bulls' reproductive traits, but it was moderatelynegatively related to milk production of the bulls' daughters. That is, bullsabove average for midpiece length tended to be slightly below average forpredicted difference for milk.
This work is being extended to beef cattle. In cooperation with ColoradoState University, we are collecting semen samples from some 300 gain-testedbulls at the San Juan Basin Experiment Station at Hesperus, Colorado incooperation with USDA scientists, we are collecting approximately another 80bulls at the Livestock and Range Research Station, Miles City, Montana. Fromthese populations, we will estimate the heritability of sperm midpiece lengthand its association with economically important beef production traits.
20
MANAGEMENT ORIENTED RESEARCH
John Rosecrans, a graduate student working with Dr. Allen Nipper andme, is conducting a survey of western Oregon ranches using fall calving.Through visits and interviews, he is documenting advantages, disadvantages,problems, and potentials of the system. We also are seeking to identifyprimary research needs in that area.
In another project, we have attempted to foster newborn dairy calves ontobeef cows at the time their own calf was born. These cows were asked to raise,but not to bear, twins. In our first small trial, each of four spring calvingcows raised her own plus a Holstein bull calf. There were problems--twoHolstein calves died--but these cows each weaned about 880 pounds of calf com-pared to about 500 pounds for contemporary controls with singles.
In a second trial with fall calving cows, we thought problems of accept-ance of the alien calf might be lessened if each cow raised two new calves.Thus, our first cow to calve was given two Holsteins, the second receivedone Holstein plus the first cow's natural calf, etc. This seemed fairlysuccessful, but later observation showed that many calves did not "mother-up"properly. They led a precarious existence of nursing any cow that wouldtolerate them. Nevertheless, we lost only one such "twin" calf, and as weenter the spring grazing season, twin versus single rearing cows have anaverage of 537 and 386 pounds of calf, respectively.
It is important to realize that this system, even if we are successfulin working out the bugs, is not for everyone. First, it probably is feasibleonly if cows have a high inherent level of milk production and maternal instinct.Second, extra feed must be provided to cows and calves. Third, delayedrebreeding of cows could be a problem. The data on this are not in yet.Fourth, extra labor is required. We anticipate the system might allow a part-time or hobby farmer to increase beef production per cow and per acre butwe do not visualize its adoption by large commercial ranches.
SUMMARY
Research in beef cattle breeding and management at Oregon State Universityis designed to compare breeds and mating systems for economical beef productionin the coastal Pacific Northwest, to identify traits that will increaseresponse in economically important traits from indirect selection, and toidentify management techniques that will increase efficiency of production. Theresearch is ongoing. In future programs such as this, I will communicate theresults and applications of this work.
21

THE OREGON RANGE VALIDATION PROJECT
FROM A RANCHER'S VIEW POINT
Rich Wilburn
The Validation Story starts with three things. The first is a desire toexcel and squeeze everything as good as possible from something - in thiscase, a ranch. Second is a restlessness with the status quo and willingnessto change if need be. The third is a vehicle to facilitate the first twoand create positive reinforcement of both. These three things breed successin the Validation Program.
Our primary objectives were twofold. One was to increase our springpastures in quantity and quality. The other was to effectively manageour timber resources for both grass and lumber. We felt these two wouldresult in an coordinated unit where no holes would be present from cattleturn out time until cattle feeding time. Although we focused on thesetwo aspects, we did not shrink from analyzing the whole ranch to createa coordinated resource plan.
The Validation team consisted of the U.S. Forest Service, Oregon StateForestry, Fish and Wildlife, Soil Conservation Service, Extension, andmyself. Our first order was to inventory the ranch and see exactly whatwas here. The State Forestry people, under the leadership of Mark Labhartand Dan Shults, inventoried the timber. No only did they take a count butthey looked into tree conditions, canopy cover, areas that needed thinning,commercial thinned areas and insect problems. The U.S. Forest Servicelooked at the forest allotment to ascertain the needs in that area, debrisdisposal and pond repair being two of the major concerns. Fish andWildlife, under Errol Claire and Ralph Denney, made suggestions for biggame thermal cover, fence height, and bird habitat. The Soil ConsevationService, with Roy Manning and Dalton Montgomery, not only sampled everyfield as to forage output, but also analyzed it to see if fields wereregenerating or degenerating. They used stocking rates that gave us anidea of where each pasture or field fit into the scheme of the ranch andat what time of year would be optimum forage. Bill Farrell, Grant CountyExtension agent, helped pull all these people and agencies together toform a cohensive unit. He also loaned practical knowledge on hay fields,feed grounds, fence placement, spring developments, and cattle accesstrails.
Our next step was to put all this information together to get anidea of where our strong and weak points were. We had many sessions justtalking about certain areas to improve, the cost, the result, and how itwould affect the whole picture. The team took several trips to sites tosolidify ideas or get a feel for a certain practice. As we were doingthis, I would add practical experience from the ranch to either confirmor adjust ideas taken from the inventory. We then listed all the ideaswe thought would fit and were practical. In fact, we had a lot more goodideas than means to implement them. So then we threw in the time elementproblem and started to work from there.
22

Here is where coordinated planning really takes place. It takesthe expertise of all the aforementioned men and agencies to fit thepuzzle into a certain time span. It all has to revolve around cattle.Considerations involve a number of AUM's on spring, summer, and fallpastures. It also includes seedings, when to seed, how long it willtake to establish a crop, and when it can be harvested. Also, pre-commercial and commercial thinning, when to do it, when to seed back,and duration of establishment. Couple this with keeping animal numbersfairly high while not sacrificing summer pasture for two summers orspring pastures for two springs and it equals a fairly involved process.All coordinated resource planning hinges on the time sequence, worksequence problem.
From this stage, we went into actual practices in the field. Someof them included spring developments, juniper control, pre-commercialthinning, commercial thinning, debris disposal, mechanical seeding,livestock access trails, and fencing. The problems were logisticalproblems, machinery problems, weather problems, and just plain coordina-tion problems. We did the work ourselves, did it cheaper, did it betterand faster, but did a lot more paper work. All in all the problems wereof a smaller magnitude than one would realize because of the groundworkwe laid in our coordinated planning sessions. Time spent in thesesessions was well invested.
After a logical sequence then, one would ask: Results? Mostlygood. I would like to dwell on just as an example our lack of springpasture. We tipped over about 35 acres of junipers, plowed about 220acres of sage, and seeded it all to crested wheat. We were running about50 cows on this piece for two months. Now we can run 100 cows on itfor the same period and have them come off in much better shape. Itcreates bigger calves, better and earlier conception in cows breedingback, bigger replacements in the fall, less disease problem, and a betterbunched calf crop next spring. The only problem we have encountered asa result is that we are also running a lot more deer in the criticalearly growing season and the winter months also.
Let's look at wildlife just for a moment while we are at this stage.The Validation Program has increased big game numbers on the ranch. Iwish that we had pre-determined big game numbers for a certain areas onthe ranch when we were in the planning stages. I don't mind doing myshare of keeping deer, but I hate to see it increase to levels beyondtolerance.. Most ranchers, I believe, would welcome something to showthey are supporting vast numbers of big game animals, be it extra tagsor range improvement help or whatever. We have kept junipers and pinethickets for thermal cover, increased forage quantity and quality,increased water quantity and quality, and kept cover areas for bothdeer and birds. I believe the ranchers should be recognized for this.
23
Economically, the program will have far-reaching effects, both forthe rancher and the county. Prosperous ranchers create prosperouscounties. Commercial thinning creates jobs. The purchase of supplieslike seeds, fencing, and equipment multiplies throughout the countyand state. Closer to home, the rancher can create another acre fromwhat he has already by range improvements. We did this on springpasture from $32 per acre to $42 per acre. It's just like buyinganother production acre for what it cost to rejuvenate the first one.The value of thinning will be multiplied every year, not only in grassbut in tree growth also. This has an impact on the rancher everyyear in grass, but also in years ahead as timber is taken off. Thewhole program has to have a tremendous economic impact when you seebetter cattle, forage, wildlife, and better utilization of what is onthe ranch.
So, what have I learned as a rancher? Now I have a better ideaof where the ranch is going. I know how long it will take, how muchit will cost, how to do it, and what the results will be. It has beeninvaluable.
24
SELECTION OF APPROPRIATE GRAZING SYSTEMS--A VITAL PART OF RANGELAND
RESOURCE MANAGEMENT PLANNING
W. A. Laycock
The selection of an appropriate grazing system is one of the most impor-tant aspects of an adequate resource management plan on rangeland. To beeffective, a grazing system must be tailored to the life cycle and physiolo-gical requirements of the desirable plants, the nutritional needs of thelivestock, with due regard, as necessary, for watershed, wildlife, andother values. Too often a particular grazing system has been applied becauseit has worked elsewhere, because an agency is committed to using the systemseverywhere, or for no real reason at all.
Rest-rotation systems have been widely applied by both the BLM and ForestService in the last two decades. This system originally was designed for anIdaho fescue (Festuca idahoensis) bunchgrass-type range but it has been widelyexpanded into other vegetation types with varying success. Rest-rotationsystems have been proposed or applied to vegetation types where the physiologyor life cycle of the vegetation makes such a system inappropriate, such asranges dominated by cheatgrass brome (Bromus tectorum) or seeded to crestedwheatgrass (Agropyron cristatum or A. desertorum).
Few studies have been made to determine the effects of rest-rotationsystems on vegetation and livestock responses in comparison with other grazingsystems. The same is true of some of the "newer" systems now being proposedand implemented such as "HILF;" short duration grazing," etc.
The comparison between a rest-rotation and a season-long grazing systemreported here was part of a larger study designed to test practical and effi-cient systems of managing livestock on high elevation ranges in the Inter-mountain Region. Only part of the study is reported here. More details arereported by Laycock and Conrad (1980).
EXPERIMENTAL AREA
The study was conducted on the Diamond Mountain Cattle Allotment approximately 25 miles north of Vernal, Utah, on the Ashley National Forest. Theallotment is on the plateau on the east end of the Uinta Mountains. Elevationson the allotment vary from 7,000 to 8,200 feet. Soils are loams to clayloams. Average annual precipitation is approximately 24.0 inches.
The allotment is representative of the upper sagebrush-grass and loweraspen zones through the Intermountain area. The allotment covers approximately11,000 acres and is divided into seven pastures of units. Five of the unitscontained native vegetation and were in fair to good range condition at thestart of the study.
Two of the units were seeded with introduced grasses in the mid-1950sone unit to crested wheatgrass and the other to a mixture of crested wheatgrassand smooth brome (Bromus inermus).
25
METHODS
Grazing Treatments
During each year of the study, about 500 adult cattle (6 months old andolder) and approximately 350 calves (under permit by the National Forest)grazed on the allotment for an average of 126 days--June 2 to October 5.Entering the allotment in the spring, all the cattle grazed in one of theseeded units for approximately 34 days.
In early July, cattle were moved to the native units and the comparisonI will make is between continuous summer-long grazing every year and a threeunit rest-rotation. Both systems had well-distributed natural or artificialwater sources and had good riding and salt distribution. The animals in thethree unit rest-rotation system grazed for approximately 45 days in one unitand then were moved to the other unit which was to be grazed for another 45days. The early summer, late summer, and rest treatments were rotated eachyear. Cattle assigned to summer-long systems remained in the same unit theentire summer.
Cattle Response
To determine the responses of cattle to the various systems of grazing,approximately 40 nursing cows and 30 yearlings were weighed during each ofthe five grazing seasons from 1961 to 1965. An average of 20 calves wereweighed during each of four seasons from 1961 to 1964. No calves were weighedin 1965. The same, marked animals were weighed four times during the grazingseason: 1) when the cattle entered the allotment (about June 2); 2) whencattle were removed from the seeded pastures and divided into three groups(about July 4); 3) when the cattle in the three-unit rest-rotation systemchanged units (about August 11) and 4) just before the cattle left theallotment (about October 4) just before the cattle left the allotment (aboutOctober 4). Weighing dates varied somewhat from year to year because of rangereadiness and degree of forage utilization. Cattle were weighed immediatelyafter gathering without a shrinkage period.
The weighed cattle mostly were registered Herefords and were representativeof about 60 percent of the cattle on the allotment. The cows averaged aboutsix years of age. The calves were 3 to 4 months old and the yearlings were15 to 16 months old when they entered the allotment.
Vegetation Samplings on Study Plots
Several study plots were established in each unit in 1959, each consistingof an exclosure (33 feet x 33 feet) and an adjacent (within 50 feet) 50 feet x50 feet marked area open to grazing. The vegetation on study plots locatedthroughout each unit was sampled near the beginning of the study in 1961 and in1967, the year following the end of the study. Weight (peak abovegroundstanding crop) was determined for each species within square foot quadrats.Each time a study plot was sampled, 50 quadrats were estimated, 25 in theexclosure and 25 in the grazed area. Crown cover of shrubs also was estimatedon the same quadrats.
26
Herbage Production and Utilization Surveys
Before grazing each year, total grass production in each unit wasmapped by production classes using a reconnaissance method. This was doneindependently from the more detailed sampling of the study plots previouslydescribed. The total acreage covered by each production class multipliedby the midpoint of that production class enabled us to estimate total poundsof grass available for grazing in the unit excluding any growth or regrowththat took place during the grazing period.
The percentage utilization of each grass species was ocularly estimatedimmediately after cattle grazed in each unit each year. The entire unit wasalso surveyed by a reconnaissance method after grazing to estimate the totalpounds of grass removed and to calculate a weighted average percent utilizationfor the unit. Because production of regrowth during the grazing period wasnot taken into account, the total utilization figures for each unit probablyare slightly too low.
RESULTS AND DISCUSSION
Native Range
Utilization
In the native units, average utilization in the years grazed was the same(37 percent) for both the rest-rotation and the summer-long every year systems.When years of rest were included in the average, the system grazed summer-longevery year received the heaviest grazing rate (37 percent) while the rest-rotation system averaged 25 percent.
Trends in Production, 1961 to 1967
Patterns of herbage production changes generally were similar for the twograzing systems (Table 1). The differences that did occur are difficult toexplain and seem to be caused by factors other than the grazing system. Totalgrass production remained the same in the exclosures in the rest-rotationsystem and in the grazed areas in the summer-long system while grass production.increased in the grazed areas in the rest-rotation system and decreased in theexclosures in the summer-long system. This might indicate some response tograzing but forb production followed the same pattern except for an increaseinstead of a decrease in the exclosures in the summer-long system.
Shrub cover
Shrub cover (mainly sagebrush) remained constant at 12 to 15 percent in therest-rotation system but increased from 8 to 16 percent in the exclosure and from5 to 13 percent in the grazed area in the grazed summer-long system. Somesagebrush control (probably railing) was done in the early 1950s in the unitgrazed summer-long. The increase in sagebrush cover in this unit is a naturalrecovery of the sagebrush following control. This finding agrees withthat of Hughes (1980) who found that sagebrush return after removal isindependent of presence or absence of grazing and type of grazing system.
27
Cattle Weights
Before a comparison of weight gains between systems can be made we needto look at the pattern of gain for cattle for the entire time they were on theallotment (Table 2). Average weight gains for the entire season did notdiffer significantly among years for any class of cattle (Conrad and Laycock,1968). Over all years, the weight gain for cows was not significantly differentbetween the spring (June) and early summer (July-mid August) for any classof cattle. However, weight gains of cows and yearlings were significantlyless in late summer than in the earlier periods. The reduction in gain wasless for heifers than for cows. This reduction in gain undoubtedly is areflection of a decline in the quantity and quality of forage in late summer.
For both cows and yearlings, significantly higher gains occurred in thespring in some individual years and in early summer in other years. Thisprobably is related to both the condition of vegetation at the time the cattleentered the allotment each year and also the condition of the cattle. Calvesmaintained relatively uniform weight gains all summer every year.
When all years was averaged there were no significant differences betweenthe rest-rotation and the summer-long grazing system for any period--eitherearly summer, late summer, or the combined data for all summer (Table 3). Forcows and yearlings, some differences did occur between systems in specificyears but no pattern was present. For example, in late summer in 1962, cowsgained significantly less in the summer 1962, cows gained significantly lessin the summer-long system than in the rest-rotation system. However, in 1963,,cows gained significantly more in the summer-long system than in rest-rotationsystem and actually lost weight during the late summer period in the rest-rotation system.
Relatively few studies have been made of cattle gains on high elevationrangelands. The daily gains from this study were similar to those reported bySmith et al. (1967) for cattle on high elevation summer ranges in the Big HornMountains in Wyoming. They also found no differences in daily gains of steerson units grazed under season long use and gains on units grazed under arotation system. In this study, calves gained the same and cows gained aboutdouble the amounts reported by Harris and Driscoll (1954) on ponderosa pinesummer range in Oregon.
Total Gain Per Acre
The only statistic indicating any differences between the two grazingsystems was gain per acre summed for all classes of cattle (Table 4). However,gain per acre figures can be misleading unless careful comparisons are madethat include stocking rate and amount of utilization. When just the unitsgrazed each year were used in the computation, the two grazing systems onnative range had similar gains per acre. When the units rested were includedin the computations, the gain per acre in the unit grazed summer-long everyyear was almost twice that of the rest-rotation system.
This comparison was confounded by differential grazing pressure (asindicated by utilization)in , the two systems. Average utilization over all yearsin the unit grazed summer-long every year was 48 percent higher than utili-zation in the rest-rotation system. If stocking had been such as to achievethe same average utilization and if gain per head had been the same under theheavy stocking, the gains per acre in the various systems would have been muchcloser.
28
However, studies in other areas (Frischknecht and Harris, 1968; Hargrave,1949, Mcllvain and Savage, 1951) have reported that moderate to heavysummer-long grazing can produce greater daily gains than rotation grazing.
Discussion
Based on the available data, trends in production or composition ofvegetation showed no consistent differences between rest-rotation grazingand grazing summer-long every year. Earlier studies indicated that grazingon the allotment caused no measureable increases in soil bulk density(Laycock and Conrad, 1967).
Daily weight gains of all classes of cattle were the same for all grazingsystems. However, weight gain per acre, based on all the area assigned to agrazing system including areas not grazed, indicated a superiority of thesystem grazed summer-long every year. Gain per acre figures can be misleadingbecause high gains per acre resulting from too-heavy grazing can lead todeterioration of the range. However, neither of the grazing systems testedsignificantly affected either the vegetation or the soil. This indicatedthat, for the area and degree of forage utilization studied, grazing nativeranges summer-long every year will produce more beef per acre than rest-rotationsystem with no damage to the soil or vegetation resource. The cost of theadditional fencing needed for a rest-rotation system, and not needed for asummer-long system, also must be considered in an economic analysis of thesystems. In other areas or under equal or heavier grazing intensities, theresults might be different.
In many situations when a rest-rotation system is to be applied, fencesare built, water is developed, and salting, riding, and other management isintensified. Then, if a favorable response in the vegetation is detected, thetendency is to say--"Look what rest-rotation has done for this range." Inreality, the proper statement is--"Look what good range management has done."In this study, units in all systems had adequate and well-distributed water,good distribution of salt, and adequate riding at the same intensity for allsystems.
In spite of the fact that rest-rotation systems have been widely applied,especially on federally owned land in the western United States, few controlledstudies comparing rest-rotation with other systems have been made. The onlyattempt at evaluation of a rest-rotation system on mountain rangelands found inthe literature was published by Johnson (1965) on mountain grassland and shrubvegetation in the Medicine Bow Mountains of southeastern Wyoming. Rotation(4 units) and rest-rotation (4 units) grazing during the summer were reportedto have significantly reduced utilization of grasses. The biggest reductionresulted from the rest-rotation system where utilization during treatment wasabout one-half that during pre-treatment summer-long grazing. No explanationwas given for the great reduction in utilization. After four years, plant coverwas about the same under the rotation system but increased under the rest-rotation system. Stocking rates were much lighter in the rest-rotation systemthan in the rotation system.
29
Evaluation of the original rest-rotation study at Harvey Valley,California, contained many inconsistencies and the results are not assignificant as might be expected (Horman, 1970, Horman and Talbot, 1961,Hormay and Evanko, 1958, Ratliff et al., 1972). Evaluations of otherrest-rotation systems have been equally unconvincing. Ratliff et al.(1972) cited an example of "A 10 percent increase in the allowable numberof cattle after only one year of rest-rotation grazing. This was on arange grazed yearlong and with only nine inches of precipitation annually."After only one year no system can be evaluated to determine if it hasincreased carrying capacity, especially in a low rainfall area wherevegetation responses tend to be slow. Hughes (1979) found that rest-rotation systems in the Arizona strip caused undesirable changes inspecies composition if average utilization exceeded 55 percent. Useexceeding this caused deterioration regardless of the management system.In the same area, Hughes (1980) found that grazing systems, includingrest-rotation, failed to prevent return of sagebrush after removal.
Range managers should apply grazing systems that produce the most redmeat in the most economical manner, while preserving the productivity,watershed, open space, wildlife values, and other attributes of ranges ingood condition. If the best system for a given range type is a relativelycomplex system, like rest-rotation, then it should be used. If a simplersystem gets equally good or better results, then it should be used.
Seeded Range
The seeded units dominated by crested wheatgrass will be referred to asthe "crested wheatgrass unit." The other seeded unit had a mixture ofcrested wheatgrass and smooth brome on upland sites and almost pure smoothbrome on swale sites. This will be referred to as the "crested-brome unit."Both units were grazed heavily in the spring (June) in alternate years. Somecattle were left in the crested-brome unit for the remainder of the summerafter the majority were moved to the native units.
Utilization
The seeded units received much heavier use in the years they were grazedthan most of the native units. Average utilization of the total grassproduction in the seeded units was 44 to 55 percent in the years grazed but22 to 28 percent when averaged over all years. However, average utilizationwas considerably higher in swale study plots than in upland plots (Table 5).
Before the study, rather low utilization of crested wheatgrass had beena problem in the crested-brome unit. Under moderate grazing on upland sitesin 1959, 40 percent of the smooth brome was utilized; only 20 percent of thecrested wheatgrass was used. In the swales, brome was heavily utilized(80 percent). Under heavy grazing in alternate years, heavy utilization ofbrome (75 percent) continued. On upland sites, however, use of crestedwheatgrass (48 percent) was about 21/2 times greater than it had been in 1959and use of brome (58 percent) was only moderately higher. Thus, the heavygrazing resulted in much better utilization of the crested wheatgrass on uplandsites than under moderate grazing.
30
Grass Production
Total grass production in the seeded units increased considerably between1961 and 1967 on almost all plots (Table 7 and 8). The increase wasstatistically significant (P<.05). Much of this increase undoubtedly wascaused by more precipitation in 1967. Precipitation for the preceedingJuly-June period was 17.1 inches in 1960 to 1961 and 28.1 inches in 1966 to1967. It is interesting to note that production of the native grasses in1967 was not statistically significantly different from 1961 production.
On upland sites, the production increased as much or more in the grazedareas as it did in the exclosures (Table 7) indicating that the heavy usein alternate years was not detrimental to grass production. On upland in thecrested wheatgrass unit, little change in composition occurred. However,in the crested brome unit, smooth brome made up only 16 percent of the totalproduction on upland sites in 1961 and increased to 42 percent of totalproduction by 1967. On swale plots, smooth brome also increased in thecrested wheatgrass unit (Table 8). In the crested-brome unit, smooth bromewas the dominant species in the swales both in 1961 and 1967.
Shrub Cover
Sagebrush was beginning to reinvade the upland areas in the crested-brome unit at the start of the study. By 1967, cover of sagebrush hadincreased from 8 to 11 percent in the grazed areas but not in the exclosures,indicating that grazing may create conditions favorable for the returnof sagebrush. This would be expected on cattle ranges regardless of thegrazing system because cattle do not eat sagebrush even under heavy grazingpressure.
Cattle Gains
As indicated earlier (Table 2), cattle gained more on a per-head basis inthe seeded units grazed in the spring and the native units grazed in earlysummer than in the native units grazed in late summer. When only those unitsactually grazed are considered, the average gain per acre on the seeded unitswas more than twice as high as those on the native units for the entire summer(Table 4). However, when all years, including the alternate years of rest inthe seeded units, were included in the-average, the gain per acre of the seededunits was only slightly higher than gain on the native range grazed summer-long every year.
Discussion
The heavy grazing in alternate years maintained or increased productionof the introduced grasses in both seeded units. Earlier studies indicated thatthis heavy grazing in the spring failed to cause measureable increases in soilbulk density in the seeded units (Laycock and Conrad, 1967). In the crestedwheatgrass unit, grazing systems that have been used successfully in other areasand that call for moderate to heavy use more frequently than every other year,probably could have been used. In Utah, New Mexico, and Saskatchewan 65 to70 percent use of crested wheatgrass annually maintained the stands and producedsatisfactory cattle gains (Springfield, 1963; Frischknecht and Harris; 1968,Lodge, Smoliak, and Johnston, 1972). Fifty percent annual use of crestedwheatgrass in Idaho likewise produced favorable results (Sharp, 1970).
31

The high-producing crested wheatgrass stand on the Diamond Mountain CattleAllotment probably could withstand reasonably heavy grazing more often thanevery other year.
In the crested-brome unit, the heavy grazing in alternate years not onlyincreased grass production but it also solved the problem of poor utili-zation of crested wheatgrass that occurred with moderate grazing. When thegain per acre figures for the combined spring (20 lbs/A) and summer (9 lbs/A)grazing periods are added, the average amount of beef produced per year inthis unit was almost 30 pounds per acre, even when the alternate years ofrest were considered. This was much higher than the gain per acre figuresfor any other unit or system in the study and was accomplished with increasedproduction and improved composition of the vegetation. Some system similarto that studied probably should be recommended for high elevation pastureswith a mixed smooth brome-crested wheatgrass composition.
SUMMARY
Several grazing systems were . compared on the Diamond Mountain CattleAllotment of the Ashley National Forest in Utah. The area is about 8,000 feetin elevation and received 20 to 25 inches of precipitation annually. On nativesagebrush-grass range, a comparison of summer-long (July to September)grazing every year and three-unit rest-rotation systems revealed no differencesbetween systems in production or species composition of vegetation after sevenyears of grazing. Average daily gains of cattle over the entire period werethe same for all systems. During the period of study on this range, whichwas in fair to good condition and grazed at a moderate intensity, rest-rotation was not a better system than summer-long grazing. The key to thislack of difference was management. Rest-rotation, systems require intensivemanagement of water, salt , riding, etc. All units in both systems in thestudy had good distribution of water and salt and adequate riding to insureuniform cattle distribution. The unit grazed summer-long every year receivedthe same degree of management and thus remained as productive as rangesunder rest-rotation management. On seeded units of the allotment, heavygrazing in June in alternate years increased production on areas dominatedby crested wheatgrass and smooth brome.
LITERATURE CITED
Conrad, P.W., and W. A. Laycock. 1968. Cattle weight gains on mountainranges in eastern Utah. West. Livestock J. 47(5):12-15.
Frischknecht, Non crestedUSDA Tech.
. C., and L. E. Harris. 1968. Grazing intensities and systemwheatgrass in central Utah: Response of vegetation and cattle.Bull. 1388, 47 page.
Hargrave, H. J. 1949. Dominion Range Experiment Station, Manyberries, Alberta.Progr. Rep. (1937-1949) Dominion Dep. Agr., Ottawa, Ontario.
Harris, R. W., and R. S. Driscoll. 1954. Gains made by cattle on summer range.Oregon Cattleman 3(5):5-24.
32
Hormay, A. L. 1970. Principles of rest-rotation grazing and multiple-useland management. USDI and USDA Bull. TT-4, 26 p.
Hormay, A. L., and A. B. Evanko. 1958. Rest-rotation grazing....a manage-ment system for bunchgrass ranges. USDA, California Forest and RangeExperiment Station, Paper No. 27, 11 p.
Hormay, A. L., and M. W. Talbot. 1961. Rest-rotation grazing...A new manage-ment system for perennial bunchgrass ranges. U.S. Dep. Forest Service,Prod. Res. Rep. No. 51, 43 p.
Hughes, L. E. 1979. Rest-rotation grazing on the Arizona Strip: an observa-tion. Rangelands 1:106-108.
Hughes, L. E. 1980. Six grazing exclosures with a message. Rangelands 2:17-18.
Johnson, W. M. 1965. Rotation, rest-rotation, and season-long grazing on amountain range in Wyoming. USDA, Forest Service, Res. Paper RM-14, 16 p.
Laycock, W. A., and P. W. Conrad. 1967. Effect of grazing on soil compactionas measured by bulk density on a high elevation cattle range. J. RangeManage. 20:136-140.
Laycock, W. A., and P. W. Conrad. 1980. Responses of vegetation and cattleto various systems of grazing on seeded and native mountain rangelandsin eastern Utah. J. Range Manage. 33(5): (accepted for publication).
Lodge, R. W„ S. Smoliak, and A. Johnston. 1972. Managing crested wheatgrasspastures. Agriculture Canada Pub. 1473. 20 p.
Mcllvain, E. H., and D. A. Savage. 1951. Eight-year comparisons of continuousand rotational grazing on the Southern Plains Experimental Range. J.Range Manage. 4:42-47.
Ratliff, R. D., J. N. Reppert, and R. J. McConnen. 1972. Rest-rotation grazingat Harvey Valley...range health, cattle gains, costs. USDA Forest Service,Res. Paper PSW-77, 24 p.
Sharp, L. A. 1970. Suggested management programs for grazing crested wheat-grass. Forest, Wildlife and Range Exp. Sta., Univ. of Idaho. Bull. 4, 19 p.
Smith, D. R., H.G. Fisser, N. Jefferies, and P.O. Stratton. 1967. Rotationgrazing on Wyoming's Big Horn Mountains. Agr. Exp. Sta., Univ. ofWyoming. Res. J. 13, 26 p.
Springfield, H. W. 1963. Cattle gains and plant responses from spring grazingon crested wheatgrass in northern New Mexico. USDA, Forest Service,Prod. Res. Rep. 74, 46 p.
33
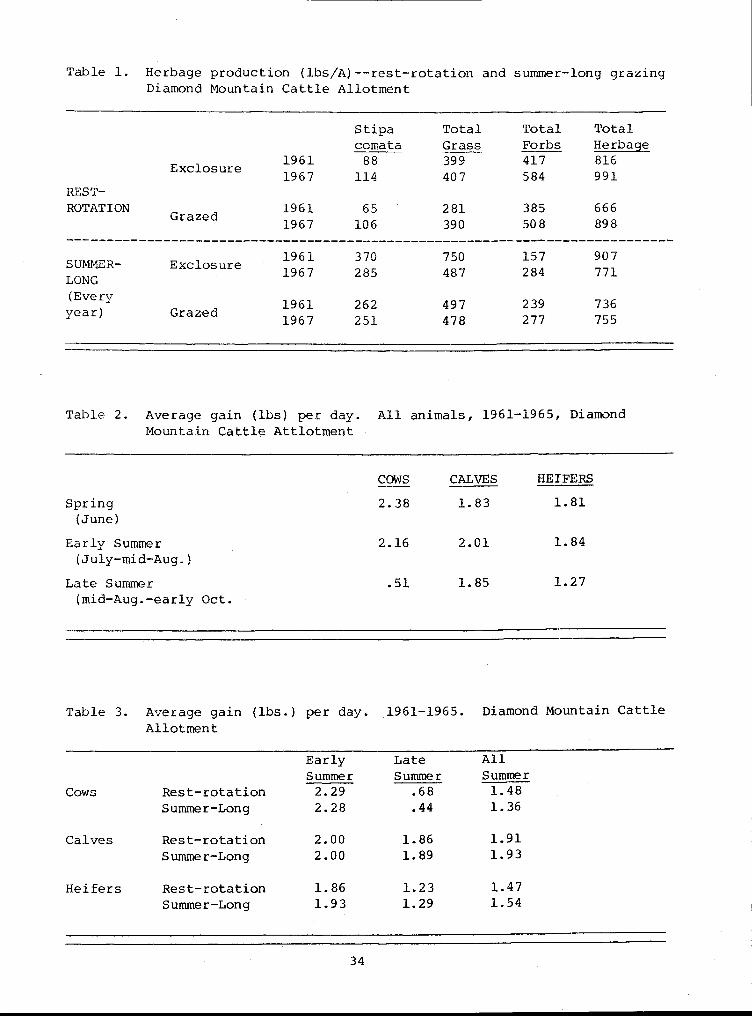
Table 1. Herbage production (lbs/A)--rest-rotation andDiamond Mountain Cattle Allotment
summer-long grazing
Exclosure19611967
Stipacomata
TotalGrass
TotalForbs
TotalHerbage
88114
399407
417584
816991
REST-ROTATION 1961 65 281 385 666
Grazed1967 106 390 508 898
SUMMER-LONG
Exclosure19611967
370285
750487
157284
907771
(Everyyear) Grazed
19611967
262251
497478
239277
736755
Table 2. Average gain (lbs) per day. All animals, 1961-1965, DiamondMountain Cattle Attlotment
COWS CALVES HEIFERS
Spring 2.38 1.83 1.81(June)
Early Summer 2.16 2.01 1.84(July-mid-Aug.)
Late Summer .51 1.85 1.27(mid-Aug.-early Oct.
Table 3. Average gain (lbs.) per day.Allotment
1961-1965. Diamond Mountain Cattle
EarlySummer
LateSummer
AllSummer
Cows Rest-rotation 2.29 .68 1.48
Summer-Long 2.28 .44 1.36
Calves Rest-rotation 2.00 1.86 1.91
Summer-Long 2.00 1.89 1.93
Heifers Rest-rotation 1.86 1.23 1.47Summer-Long 1.93 1.29 1.54
34
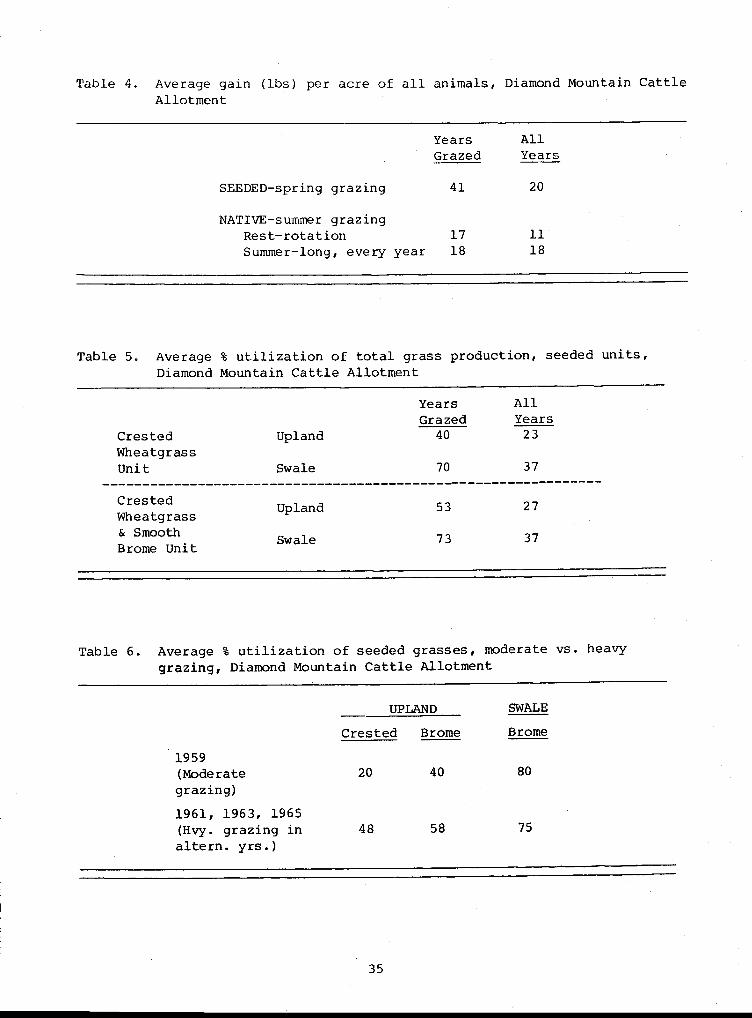
Table 4. Average gain (ibs) per acre of all animals, Diamond Mountain CattleAllotment
Years AllGrazed Years
SEEDED-spring grazing 41 20
NATIVE-summer grazingRest-rotation 17 11Summer-long, every year 18 18
Table 5. Average % utilization of total grass production, seeded units,Diamond Mountain Cattle Allotment
CrestedWheatgrassUnit
CrestedWheatgrass& SmoothBrome Unit
Years AllGrazed Years
Upland 40 23
Swale 70 37
Upland 53 27
Swale 73 37
Table 6. Average % utilization of seeded grasses, moderate vs. heavygrazing, Diamond Mountain Cattle Allotment
1959
UPLAND SWALE
Crested Brome Brome
(Moderategrazing)
20 40 80
1961, 1963, 1965(Hvy. grazing in 48 58 75altern. yrs.)
35

Table 7. Seeded units, grass production on uplandDiamond Mountain Cattle Allotment
(lbs/A) 1961-1967,
Crested Exclosure 19611967
CrestedWh. qr. brome
Smooth TotalGrass
12271542
379
1,3381,579
WheatgrassUnit Grazed 1961 911 24 947
1967 1596 34 1,724
Crested Exclosure 1961 124 278 653
& Smooth 1967 97 993 1,291
BromeUnit Grazed 1961
1967194207
131651
5121,177
Table 8. Seeded units, grass production in swales (lbs/A)Diamond Mountain Cattle Allotment
1961-1967,
CrestedWh. qr.
Smoothbrome
TotalGrass
CrestedWheatgrass
Exclosure 19611967
635718
66342
1,0281,356
Unit 1961 417 120 903Grazed
1967 57 319 702
Crested& Smooth
Exclosure 19611967
32
10092735
1,1292,864
BromeUnit Grazed
19611967
00
3541124
5371,932
36
TAKING AN ECOLOGICAL APPROACH TO MULTIPLE USE PLANNING
Frederick C. Hall
This discussion will include a review of livestock grazingand timber management and will be based on examples from the BlueMountain landmass in central Oregon and southwestern Washington.This five million-acre area has diverse kinds of vegetation whichhave been classified according to types of plant communities.For example, ponderosa pine/wheatgrass is a savanna community typecomprising the forest edge of low tree productivity.
Next is the ponderosa pine/Idaho fescue, moist savannacommunity type. It is marginally commercial forest land. Withincreasing elevation, ponderosa pine/elksedge is encountered. Itis a commercial forest site in which elksedge dominates groundvegetation. And finally, within the forest zone is found themixed conifer/pinegrass community type. It is good commercialforest land, and comprises the largest acreage of grazable landin the central and southern Blue Mountains. I will use the mixedconifer/pinegrass community type for all illustrations and data.
CHARACTERISTICS OF MIXED CONIFER/PINEGRASS COMMUNITY TYPE
The mixed conifer/pinegrass community type is often dominatedby ponderosa pine (Pinus ponderosa), at least in the overstory.White fir (Abies grandis) and/or Douglas-fir (Pseudotsuga menziesii) vary from sparse reproduction to moderately dense polesto co-dominant in the overstory. Ground vegetation is clearlydominated by pinegrass (Calamagrostis rubescens) with significantamounts of elksedge (Carex geyeri) and heartleaf arnica (Arnica cordifolia), strawberry (Fragaria spp.), vetch (Vicia americana),and several species of balsam woollyweed (Hieracium spp.).
Surface Fire Occurrence
Fire scarred stumps are common in this community type reflectingrecurrent ground fires. Before fire control (about 1910) surfacefires damaged these trees an average of once every 10 to 12 years.The fires were probably started by lightning strikes which arefrequent in the Blue Mountains.
Periodic burning has tended to thin reproducing ponderosapine by killing young trees thus maintaining open stocking con-ditions of the stands. With fire control, ponderosa reproductionhas not been thinned resulting in thousands of acres in stagnatedcondition. Universal stagnation of ponderosa pine is highlysignificant. Ponderosa in the Blue Mountains did not developaccording to "normal stand development" concepts which imply
37
that dominant trees have exerted their influence, killed suppressedtrees, and eventually created an old-growth stand. Ponderosa pinecannot develop according to "normal stand development" -- insteadit stagnates. This means the land manager must maintain stockinglevel control to grow usable wood. It also means that pristinegrazing conditions of abundant pinegrass under open crown canopiesof pine are not possible with fire control.
Surface fires also have tended to selectively kill Douglas-firand white fir while leaving ponderosa pine. Firs were selectivelykilled because of their bark characteristics. Ponderosa pinedevelops a dead, insulating layer of bark by the time the tree istwo or three inches in diameter. White fir and Douglas-fir barkremains green, alive, and photosynthetically active until the treeis four to six inches in diameter. This bark is so sensitive thattemperatures exceeding 175 degrees F. can kill it. In fact, whena young white fir is suddenly exposed to full sunlight, heat fromthe sun can scald the tender bark and kill it. Thus, ponderosapine/pinegrass is a fire climax plant community.
With fire control, fir is free to regenerate and increaseunderneath the shelterwood of ponderosa pine. Eventually this"pine/pinegrass fire climax" will become a fir/pinegrass climax.Fir crown cover tends to be denser than ponderosa. As fir regen-erates and grows under the pine, this dense shade reduces groundvegetation. Under ponderosa of 40 to 60 percent crown cover,pinegrass and elksedge produce 450 to 550 pounds of forage peracre, about five acres per AUM (Animal Unit Month). Underincreasing fir cover, pinegrass and elksedge decrease in densityand volume and the variety of plant species tends to decrease.Finally, under an overstory of fir and some fir reproduction,little useful livestock forage is produced.
Fire has had another, fortunate effect. It periodicallyconsumed 100 percent of the native plants. In other words, theydeveloped under periodic, 100 percent use and in some shade.This means they have genetically developed with the ability towithstand at least some grazing. The mixed conifer/pinegrassplant community not only produces useful forage but also has theinherent ability to withstand periodic utilization.
Forest Productivity
Mixed conifer/pinegrass is capable of growing three primarytrees: white fir, Douglas-fir, and ponderosa pine. In addition,at upper elevations and/or northerly slopes, it will supportwestern larch (Larix occidentalis) and, occasionally, lodgepolepine (Pinus contorta). Table 1 summarizes tree productivity ofof this community type.
38
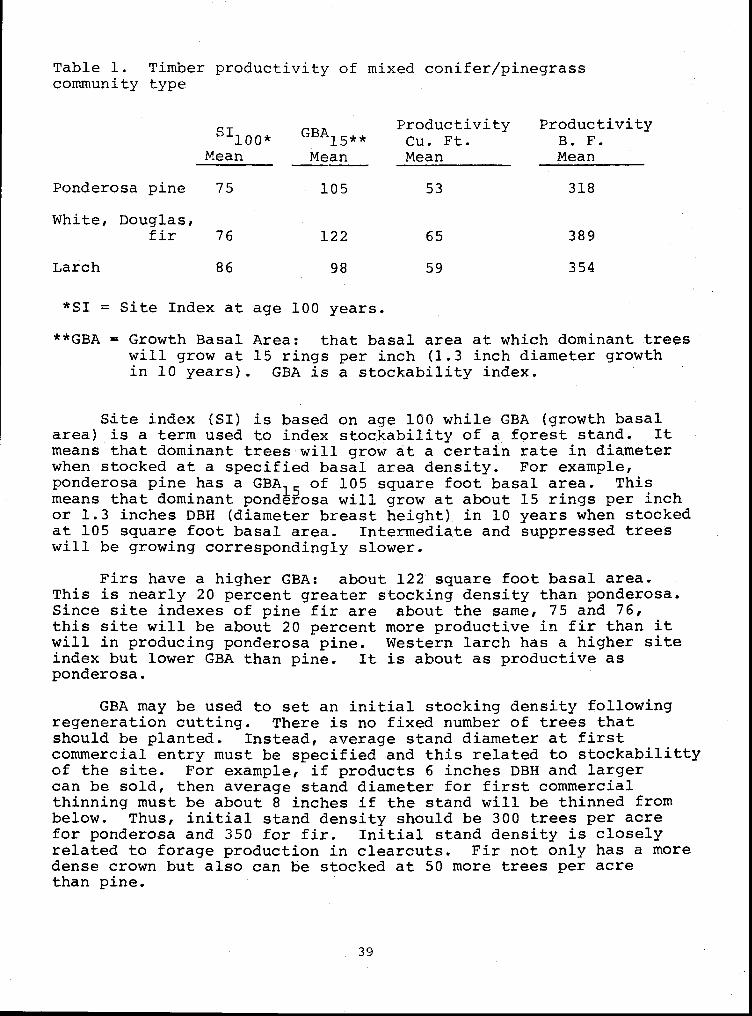
Table 1. Timber productivity of mixed conifer/pinegrasscommunity type
Productivity ProductivitySI100* GBA15** Cu. Ft. B. F.Mean Mean Mean Mean
Ponderosa pine 75
105 53 318
White, Douglas,fir 76 122 65 389
Larch
86 98 59 354
*SI = Site Index at age 100 years.
**GBA g Growth Basal Area: that basal area at which dominant treeswill grow at 15 rings per inch (1.3 inch diameter growthin 10 years). GBA is a stockability index.
Site index (SI) is based on age 100 while GBA (growth basalarea) is a term used to index stockability of a forest stand. Itmeans that dominant trees will grow at a certain rate in diameterwhen stocked at a specified basal area density. For example,ponderosa pine has a GBA15 of 105 square foot basal area. Thismeans that dominant ponderosa will grow at about 15 rings per inchor 1.3 inches DBH (diameter breast height) in 10 years when stockedat 105 square foot basal area. Intermediate and suppressed treeswill be growing correspondingly slower.
Firs have a higher GBA: about 122 square foot basal area.This is nearly 20 percent greater stocking density than ponderosa.Since site indexes of pine fir are about the same, 75 and 76,this site will be about 20 percent more productive in fir than itwill in producing ponderosa pine. Western larch has a higher siteindex but lower GBA than pine. It is about as productive asponderosa.
GBA may be used to set an initial stocking density followingregeneration cutting. There is no fixed number of trees thatshould be planted. Instead, average stand diameter at firstcommercial entry must be specified and this related to stockabilittyof the site. For example, if products 6 inches DBH and largercan be sold, then average stand diameter for first commercialthinning must be about 8 inches if the stand will be thinned frombelow. Thus, initial stand density should be 300 trees per acrefor ponderosa and 350 for fir. Initial stand density is closelyrelated to forage production in clearcuts. Fir not only has a moredense crown but also can be stocked at 50 more trees per acrethan pine.
39
Condition and Trend
Undergrowth species in the mixed conifer/pinegrass have differentpalatabilities. Elksedge is the most palatable but is generallynot dominant over pinegrass. However, pinegrass and elksedgeoften grow so closely together, since they are rhizomatous, theycan both be considered decreasers under cattle use.
Poor range condition is characterized by low forage produc-tion (between 50 and 200 pounds) and dominance of heartleaf arnica,strawberry, some Ross sedge (Carex rossii), and woollyweed. Totalplant density in poor condition is only 20 to 30 percent of thatin good condition. Instead of increasing, plants like strawberryand heartleaf arnica remain unchanged. Moisture formerly utilizedby pinegrass tends to be utilized for some increase in tree growth.
Poor range condition caused by overgrazing not only resultsin greatly decreased forage production but also results in increasedtree regeneration and thus tends to increase the number of acresin stagnated ponderosa pine. Generally, the greatest number ofacres and the greatest stand densities of stagnated pine occur onareas formerly heavily grazed.
Density and composition of pinegrass and elksedge on range inpoor condition from livestock grazing are similar to density andcomposition under dense fir cover. There is no significantdifference in density or species composition between range inpoor condition from livestock overgrazing compared to range underdense fir crown cover.
"Poor range condition" and "downward trend" must be relatedto causal agents. Were they the result of increasing fir cover?If so, any adjustment in livestock utilization will not alter adownward trend nor improve range condition. Were they related toexcessive livestock use with no change in tree overstory? Inthis case, adjustment in livestock management can have a signifi-cant impact on range condition and range trend. But what ifovergrazing by livestock and fire control have fostered an increasein fir regeneration? Both tree cover and livestock have beencausative factors. Adjustment in livestock management will beonly a partial, temporary solution to the problem.
Clearly, data for evaluating range condition and means forinterpreting range trend cannot be based on climax vegetation.In forested range, condition and trend must be related to treecover as well as to livestock use. Methods must be used toevaluate trend that account for changes in tree overstory.
40
Revegetation
Grasses such as orchardgrass can be seeded effectively inthe mixed conifer/pinegrass community type, producing two timesmore than pinegrass on the same area. It does not compete withtree growth as much as pinegrass and is significantly morenutritious. Pinegrass protein decreases to 7 percent by aboutJuly 1 and orchardgrass only decreases to 7 percent by September 15.Also,orchardgrass is easier to control when planting trees. Itsbunchgrass habit permits easy elimination in a 3 - 6 foot diametercircle around each planted tree.
PREDICTIONS IN MIXED CONIFER/PINEGRASS
One immediate prediction, based on continued fire control,is that livestock-carrying capacity in the Blue Mountains shoulddecline as fir cover increases. This has happened. In 1940,the Blue Mountains produced enough beef to feed 64,000 people allyear. This means 114 pounds of beef, cut and wrapped on thebutcher's counter, for each person. By 1970, the Blue Mountainsproduced enough beef for only 54,000 people.
We can also predict because of increasing population in theUnited States that there will be an increasing need for wood.We must be able to predict what will happen to the range resourcewith various kinds of t±mber management. Three kinds of predic-tions in the mixed conifer/pinegrass plant community are:treatment of stagnated ponderosa pine, high risk cutting in oldgrowth ponderosa pine, and regeneration cutting.
Treating Stagnated Pine
Stagnated ponderosa pine must be thinned to produce woodand to produce forage. We can predict grass response to treethinning (Table 2). A stand in the central Blue Mountains whichinitially was 60 years old, had 2,030 ponderosa pine per acre,140 square feet basal area, 98 percent crown cover under whichpinegrass and elksedge produced 180 pounds of forage per acre.Thinning left 110 ponderosa trees per acre at an initial basalarea of 35 square feet and crown cover of 21 percent. Forageproduction did not instantly respond. Instead, 10 years wererequired for vegetation to fully occupy the ground. Pine crowncover increased from 21 to 47 percent and basal area increased from35 square feet to 60 square feet.
We can also predict tremendous slash accumulation in conjunc-tion with thinning stagnated pine. Stand density was reduced from2,030 trees per acre to 110 meaning that 1920 trees were cut andlaid on the ground. This left a residue nearly impenetrable tolivestock. Even though forage increased, it was not availablefor use.
41
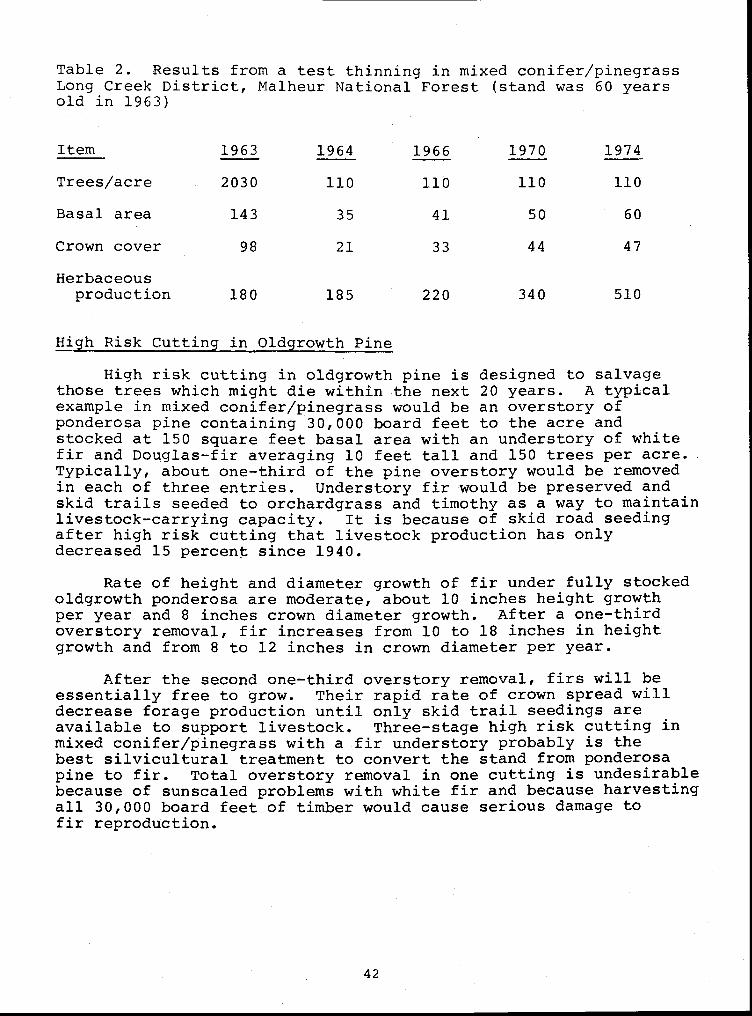
Table 2. Results from a test thinning in mixed conifer/pinegrassLong Creek District, Malheur National Forest (stand was 60 yearsold in 1963)
Item 1963 1964 1966 1970 1974
Trees/acre 2030 110 110 110 110
Basal area 143 35 41 50 60
Crown cover 98 21 33 44 47
Herbaceousproduction 180 185 220 340 510
High Risk Cutting in Oldgrowth Pine
High risk cutting in oldgrowth pine is designed to salvagethose trees which might die within the next 20 years. A typicalexample in mixed conifer/pinegrass would be an overstory ofponderosa pine containing 30,000 board feet to the acre andstocked at 150 square feet basal area with an understory of whitefir and Douglas-fir averaging 10 feet tall and 150 trees per acre.Typically, about one-third of the pine overstory would be removedin each of three entries. Understory fir would be preserved andskid trails seeded to orchardgrass and timothy as a way to maintainlivestock-carrying capacity. It is because of skid road seedingafter high risk cutting that livestock production has onlydecreased 15 percent since 1940.
Rate of height and diameter growth of fir under fully stockedoldgrowth ponderosa are moderate, about 10 inches height growthper year and 8 inches crown diameter growth. After a one-thirdoverstory removal, fir increases from 10 to 18 inches in heightgrowth and from 8 to 12 inches in crown diameter per year.
After the second one-third overstory removal, firs will beessentially free to grow. Their rapid rate of crown spread willdecrease forage production until only skid trail seedings areavailable to support livestock. Three-stage high risk cutting inmixed conifer/pinegrass with a fir understory probably is thebest silvicultural treatment to convert the stand from ponderosapine to fir. Total overstory removal in one cutting is undesirablebecause of sunscaled problems with white fir and because harvestingall 30,000 board feet of timber would cause serious damage tofir reproduction.
42
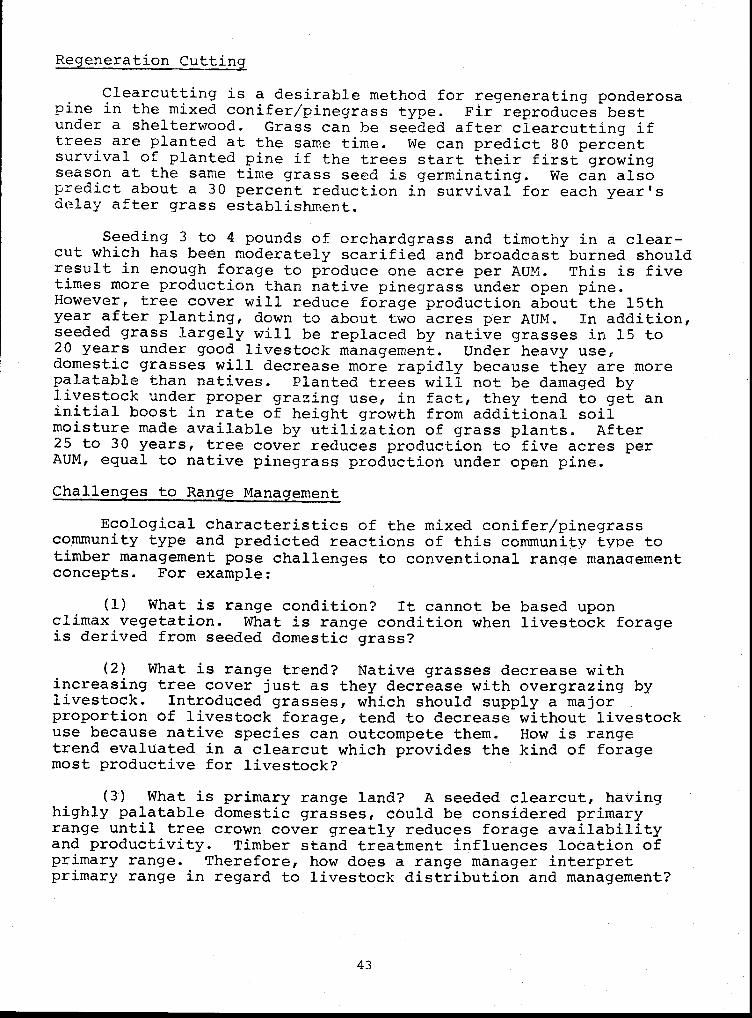
Regeneration Cutting
Clearcutting is a desirable method for regenerating ponderosapine in the mixed conifer/pinegrass type. Fir reproduces bestunder a shelterwood. Grass can be seeded after clearcutting iftrees are planted at the same time. We can predict 80 percentsurvival of planted pine if the trees start their first growingseason at the same time grass seed is germinating. We can alsopredict about a 30 percent reduction in survival for each year'sdelay after grass establishment.
Seeding 3 to 4 pounds of orchardgrass and timothy in a clear-cut which has been moderately scarified and broadcast burned shouldresult in enough forage to produce one acre per AUM. This is fivetimes more production than native pinegrass under open pine.However, tree cover will reduce forage production about the 15thyear after planting, down to about two acres per AUM. In addition,seeded grass largely will be replaced by native grasses in 15 to20 years under good livestock management. Under heavy use,domestic grasses will decrease more rapidly because they are morepalatable than natives. Planted trees will not be damaged bylivestock under proper grazing use, in fact, they tend to get aninitial boost in rate of height growth from additional soilmoisture made available by utilization of grass plants. After25 to 30 years, tree cover reduces production to five acres perAUM, equal to native pinegrass production under open pine.
Challenges to Range Management
Ecological characteristics of the mixed conifer/pinegrasscommunity type and predicted reactions of this community t ype totimber management pose challenges to conventional range managementconcepts. For example:
(1) What is range condition? It cannot be based uponclimax vegetation. What is range condition when livestock forageis derived from seeded domestic grass?
(2) What is range trend? Native grasses decrease withincreasing tree cover just as they decrease with overgrazing bylivestock. Introduced grasses, which should supply a majorproportion of livestock forage, tend to decrease without livestockuse because native species can outcompete them. How is rangetrend evaluated in a clearcut which provides the kind of foragemost productive for livestock?
(3) What is primary range land? A seeded clearcut, havinghighly palatable domestic grasses, could be considered primaryrange until tree crown cover greatly reduces forage availabilityand productivity. Timber stand treatment influences location ofprimary range. Therefore, how does a range manager interpretprimary range in regard to livestock distribution and management?
43
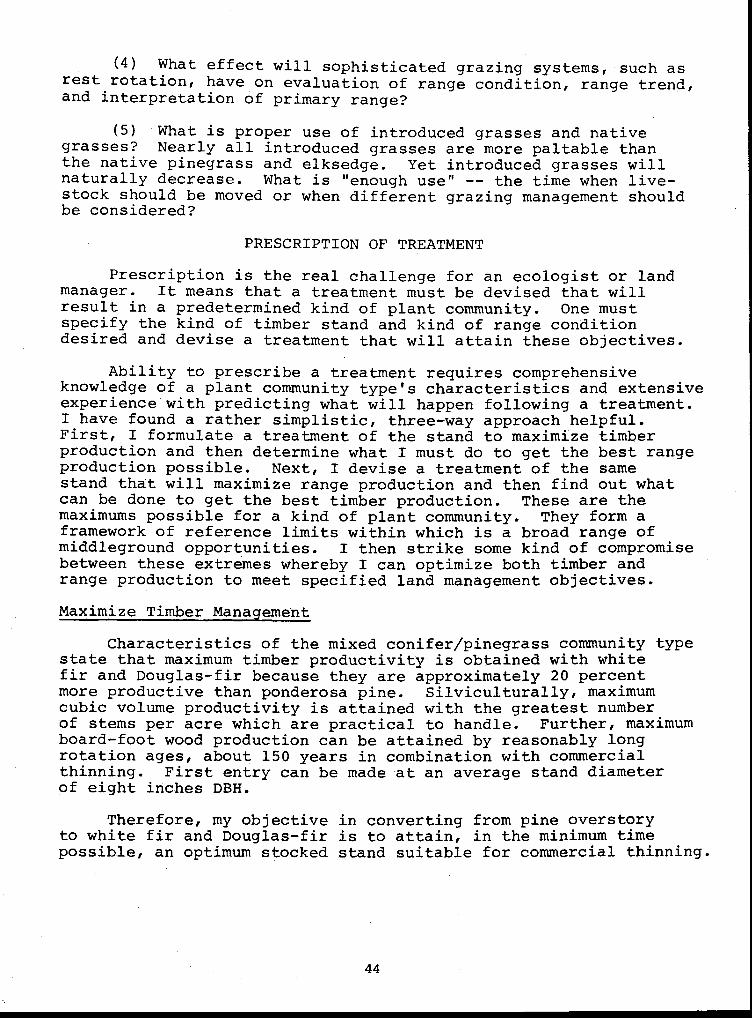
(4) What effect will sophisticated grazing systems, such asrest rotation, have on evaluation of range condition, range trend,and interpretation of primary range?
(5) What is proper use of introduced grasses and nativegrasses? Nearly all introduced grasses are more paltable thanthe native pinegrass and elksedge. Yet introduced grasses willnaturally decrease. What is "enough use" -- the time when live-stock should be moved or when different grazing management shouldbe considered?
PRESCRIPTION OF TREATMENT
Prescription is the real challenge for an ecologist or landmanager. It means that a treatment must be devised that willresult in a predetermined kind of plant community. One mustspecify the kind of timber stand and kind of range conditiondesired and devise a treatment that will attain these objectives.
Ability to prescribe a treatment requires comprehensiveknowledge of a plant community type's characteristics and extensiveexperience with predicting what will happen following a treatment.I have found a rather simplistic, three-way approach helpful.First, I formulate a treatment of the stand to maximize timberproduction and then determine what I must do to get the best rangeproduction possible. Next, I devise a treatment of the samestand that will maximize range production and then find out whatcan be done to get the best timber production. These are themaximums possible for a kind of plant community. They form aframework of reference limits within which is a broad range ofmiddleground opportunities. I then strike some kind of compromisebetween these extremes whereby I can optimize both timber andrange production to meet specified land management objectives.
Maximize Timber Management
Characteristics of the mixed conifer/pinegrass community typestate that maximum timber productivity is obtained with whitefir and Douglas-fir because they are approximately 20 percentmore productive than ponderosa pine. Silviculturally, maximumcubic volume productivity is attained with the greatest numberof stems per acre which are practical to handle. Further, maximumboard-foot wood production can be attained by reasonably longrotation ages, about 150 years in combination with commercialthinning. First entry can be made at an average stand diameterof eight inches DBH.
Therefore, my objective in converting from pine overstoryto white fir and Douglas-fir is to attain, in the minimum timepossible, an optimum stocked stand suitable for commercial thinning.
44
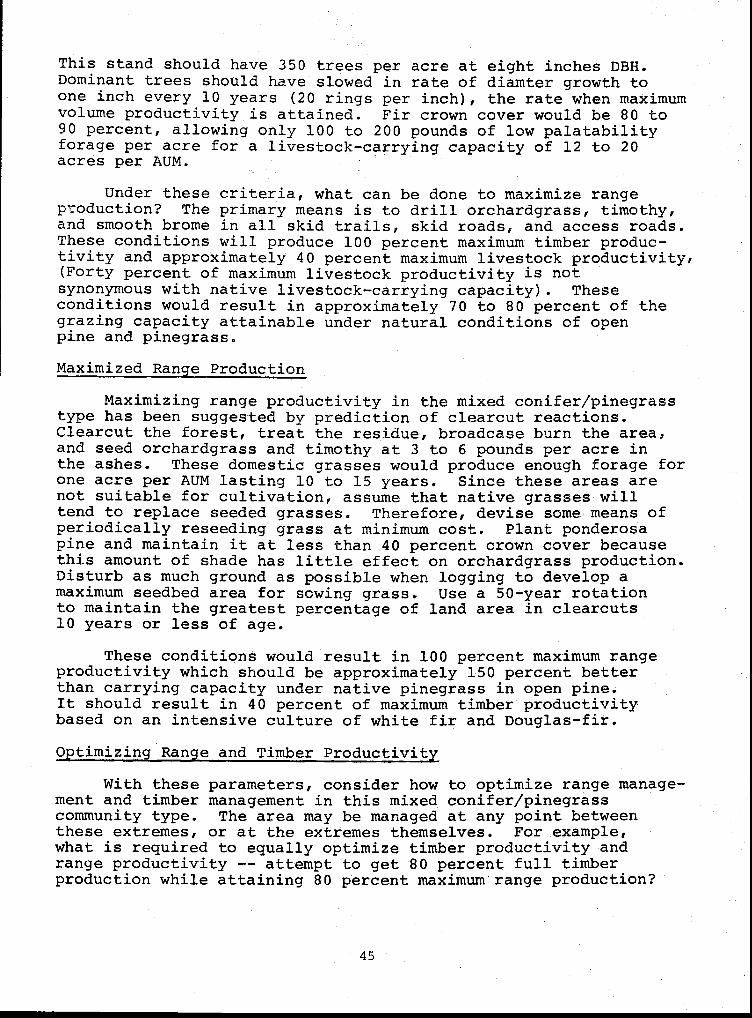
This stand should have 350 trees per acre at eight inches DBH.Dominant trees should have slowed in rate of diamter growth toone inch every 10 years (20 rings per inch), the rate when maximumvolume productivity is attained. Fir crown cover would be 80 to90 percent, allowing only 100 to 200 pounds of low palatabilityforage per acre for a livestock-carrying capacity of 12 to 20acres per AUM.
Under these criteria, what can be done to maximize rangeproduction? The primary means is to drill orchardgrass, timothy,and smooth brome in all skid trails, skid roads, and access roads.These conditions will produce 100 percent maximum timber produc-tivity and approximately 40 percent maximum livestock productivity,(Forty percent of maximum livestock productivity is notsynonymous with native livestock-carrying capacity). Theseconditions would result in approximately 70 to 80 percent of thegrazing capacity attainable under natural conditions of openpine and pinegrass.
Maximized Range Production
Maximizing range productivity in the mixed conifer/pinegrasstype has been suggested by prediction of clearcut reactions.Clearcut the forest, treat the residue, broadcase burn the area,and seed orchardgrass and timothy at 3 to 6 pounds per acre inthe ashes. These domestic grasses would produce enough forage forone acre per AUM lasting 10 to 15 years. Since these areas arenot suitable for cultivation, assume that native grasses willtend to replace seeded grasses. Therefore, devise some means ofperiodically reseeding grass at minimum cost. Plant ponderosapine and maintain it at less than 40 percent crown cover becausethis amount of shade has little effect on orchardgrass production.Disturb as much ground as possible when logging to develop amaximum seedbed area for sowing grass. Use a 50-year rotationto maintain the greatest percentage of land area in clearcuts10 years or less of age.
These conditions would result in 100 percent maximum rangeproductivity which should be approximately 150 percent betterthan carrying capacity under native pinegrass in open pine.It should result in 40 percent of maximum timber productivitybased on an intensive culture of white fir and Douglas-fir.
Optimizing Range and Timber Productivity
With these parameters, consider how to optimize range manage-ment and timber management in this mixed conifer/pinegrasscommunity type. The area may be managed at any point betweenthese extremes, or at the extremes themselves. For example,what is required to equally optimize timber productivity andrange productivity -- attempt to get 80 percent full timberproduction while attaining 80 percent maximum range production?
45
Cultivate both fir and ponderosa pine for good, but notmaximum, wood production. Use a moderate rotation age of 100years and enter the timber stand as often as possible for commercialthinning (Table 3). These conditions should produce 80 percentmaximum timber productivity and enhance range production. Amoderate rotation age affords a reasonable percentage of theland area in highly productive clearcuts. Frequent entering ofthe stand and extensive ground disturbance affords the opportunityof continuously rejuvenating seeded domestic grass. In addition,develop water, route skid trails in locations which improve access,and use a grazing system and sale layout program to avoid non-useafter grass seeding. These prescriptions should result in 80percent maximum range productivity. But, understand, this isnot 80 percent native pinegrass under open pine. Instead it isapproximately 120 percent of native productivity under pristineconditions.
Clearly, prescription of treatment to attain a predeterminedobjective is the primary tool a land manager has for optimizinguse of his resources. However, prescription must be based uponpredetermined objectives. Predetermined objectives are derivedpartly from ecological constraints and partly from social andpolitical demands.
SUMMARY
Livestock and timber, when managed together, are challenging.This paper has covered the ecological characteristics, predictionsof reaction to management and prescription of stand treatmentfor the mixed conifer/pinegrass community type. Other kinds ofplant communities differ in their characteristics, in thepredicted ways they respond to treatment, and, thus, in prescrip-tions required to attain a specified objective. Ponderosa pine/fescue is a climax pine site. Fir cannot be grown, orchardgrasscannot be grown, its prediction characteristics and prescriptionrequirements are different. Another community type in the BlueMountains is white fir/big huckleberry. It is not natural forestrange because of dense tree cover, dominance of big huckleberry,and general lack of grass vegetation. However, it does havesome qualities which make prescription for range managementpossible. Livestock grazing can be obtained after commercialthinning by seeding grass on skid trails, skid roads, and accessroads. It is possible to obtain livestock grazing from theseareas which have not, in the past, contributed to livestockproduction. Carrying capacity can be obtained from other kindsof forested areas in the Blue Mountains. We could double live-stock production in the Blues in 10 years with suitable landmanagement. But, understand that timber management is the greatestfactor influencing forest range land plant communities. Standtreatments must be prescribed in conjunction with planning of bothtimber and range activities to arrive at an optimum land manage-ment program.
46

Table 3. Basic planning data for timber management
Planning Unit = 100,000 acres
Rotation age = 100 years
Management for Ponderosa pine.
Site Potential (SI-GBA) = 75-105 (See Tablel)
318 b.f. per acre per year
53 cu.ft. per acre per year
Allowable Cut = 31.8 MM bf per year(100,000 acres X 318 bf = 31.8 MM bf)
Regenerate 1000 acre per year (100,000 div. by 100 yrs = 1000 acres)
Cut 75 trees per acre at 70 feet tall, 16 inches DBH
At 150 bf per tree = 11.2M bf per acre,
Harvest 11.2MM bf in regeneration cuts(1000 acres X 11.2Mbf = 11.2 MMbf)
Thinning harvest = 20.6MM bf per year (31.8MM - 11.2MM = 20.6MM bf)
Cut 4.4M bf per acre in thinning (40% of the volume,50% of B.A.)
Acres thinned per year = 4700(4700 acres X 4.4M bf = 20.8MMbf)
NOTE: of 100,000 acre area, 25% is in regeneration
stage not available for thinning, 75,000 acres
available for thinning.
Average stand entry = 16 years (75,000 acres / 4700 acres = 16 years)
47
THE LOCAL COSTS OF PUBLIC LAND USE RESTRICTIONS
Frederick W. Obermiller
Citizens are increasingly concerned about public land managementand use decisions. Much of their concern stems from the belief that localindividuals and groups are at a disadvantage in influencing public land usedecisions. More effective local participation is possible if citizensunderstand the process of public land use decision-making, organize at thelocal level to present consensus views to public decision-makers, and bringrelevant information to bear on local impacts of public land managementand use decisions. These are the three keys to effective local partici-pation. One of the three is addressed below.
The purpose of this paper is to provide citizens with useful guide-lines on the local impacts of public land use restrictions. Two examplesare used. The first involves proposed wilderness areas in the Umatilla andMalheur National Forests in Oregon's Blue Mountain region. The secondexample is a proposed reduction in the availability of public range forlivestock grazing in the Baker grazing district, Baker County, Oregon,administered by the Bureau of Land Management. Measures of local benefitsderived from these pending public land use restrictions are provided. Themeasures can be interpreted as (1) the local monetary costs of proposeduse restrictions or (2) the minimum value that offsetting local benefitsmust achieve if local citizens are to be as well off as they would havebeen without the restrictions.
No attempt is made to argue that restrictions which cause localcommunities or user groups to suffer are not in the best interest of thenation. Nor is it argued that economic values alone should determinepublic land use decisions. Rather, it is argued that local communitiescan participate more effectively in the decision-making process if armedwith facts on the local economic costs of public land use restrictions.
THE INSTITUTIONAL SETTING FOR LOCAL INVOLVEMENT
Over the last 20 years, Congress had directed federal agencies(particularly the Forest Service, Bureau of Land Management, Bureau ofReclamation, and National Park Service) to assess the economic, physicaland environmental consequences of proposed public land management and usedecisions. These directives have been in the form of legislative acts.Some of these acts emphasize the effects of decisions on the direct orimmediate users of the land. Others are concerned with preservation ofthe resource base for use by future generations. In some cases, thesecongressional acts have created confusion and uncertainty as agencypersonnel, private resource managers, concerned citizens, and specialinterest groups attempt to respond to the federal mandates.
For example, four major Acts of Congress direct public landmanagement agencies to manage public lands to best meet the needs of theAmerican people, through, in general, multiple use and sustained yieldmanagement.
48
EVALUATING THE LEVEL AND DISTRIBUTION OF LOCAL COSTS
To evaluate the local costs of public land use restrictions, anunderstanding is needed (1) the multiple use concept, (2) market versusnon-market resource outputs, and (3) foregone benefits, or opportunitycosts, of use decisions. Moreover, evaluation must reflect the localframe of reference, used here to refer to the county or multi-county areawhere the restricted use decision is implemented. Although local usersand dependent communities are only one participant in the decision-makingprocess, their concerns about local impacts are both legitimate andinstitutionalized in law and agency regulations.
Multiple-use management of the public land, at least in part, is theconsequence of the historical pattern of settlement in the western UnitedStates. In early years, settlers chose to homestead lands with greatestnatural productivity along major transportation arteries. Great expansesof rangeland, forestland, and other lands with lesser natural productivityin the interior of the west remained in the public domain. Over time, aneconomic system developed in the interior West which depended largely onthe use of public resources by citizens. This land-extensive and publicland dependent economic system, characterized by rangeland cow-calfoperations, small sawmills, and widely scattered rural communities,largely remains in effect today. Management and use decisions on thepublic domain had, and have, a major influence on the stability of basicresource-using industries and rural communities throughout the region.
Multiple use resource management has been a rational response toeconomic dependency in areas characterized by substantial public landholdings. Distances separating interior producers from major markets,associated transportation costs, and natural productivity differentialsplace such producers at a competitive disadvantage. The land may notsupport a local economy if used only to produce trees, and in many casescannot support an entire economy if used only to grow grass.
From the local perspective, an economy centered only on a recreationindustry may be infeasible, suggesting the land cannot be devoted solelyto wildlife habitat and watershed. But when and where the public landscan produce timber, range, outdoor recreation, watershed, and/or fishand wildlife outputs, the land can support viable timber, ranching, andoutdoor recreation industries concurrently if used to serve all threepurposes. It is this rationale, the embodiment of the greatest good forthe greatest number as a public land management goal, that underlies themultiple use approach to public land management.
The multiple use concept provides a useful point of departure inevaluating the values of public land and water resources. None of theseresource outputs (trees, grass, water, wildlife) have a direct monetaryvalue since, in their natural state, none are exchanged in the marketplace.All are basic inputs which, when combined with labor, management, capital,and technology, are used to produce goods and services. Goods, such aslogs or calves, and services like outdoor recreation do have economicvalue even though all are not priced in the marketplace. It is from the
49
These include the "Multiple-Use, Sustained Yield Act of 1960," "Forest andRangeland Renewable Resources Planning Act of 1974," "National ForestManagement Act of 1976," and "Federal Land Policy and Management Act of1976." The four production-oriented acts are similar in that coordinatedmanagement of all resources is required. Achieving the greatest good forthe greatest number, without impairing the land's productivity, is acommon goal. Immediate uses to be considered in the decision-makingprocess include those economic activities which depend on range andtimer resources, watershed, fish and wildlife, and outdoor recreation.Values of public land resources in those multiple uses are to be estab-lished when possible on the basis of true market value, and on the basisof equivalent measures for resources not priced in the marketplace.
A second set of Acts of Congress is concerned with the tradeoffsbetween economic and environmental factors. These acts generally constrainthe production-oriented, decision-making framework to protect or preservepublic land areas of critical environmental or social concern, or tominimize the environmental costs of public land use decisions. Theyinclude the "Wild and Scenic Rivers Act of 1968," "National EnvironmentalPolicy Act of 1969," "Wild Horses and Burros Protection Act of 1971,""Endangered Species Act of 1973," and "Archeological and HistoricalPreservation Act of 1974." In one instance (the "Wilderness Act of 1974"),this second set of congressional initiatives establishes preservation ofthe resource base as an overriding public concern, "to secure for theAmerican people of present and future generations the benefits of anenduring resource of wilderness."
Mostly because of provisions of the National Environmental PolicyAct, public land management agencies are required to evaluate the impactsof either production or preservation oriented plans before final decisionsare made, and to secure citizen participation in the evaluation process.The agencies have responded with regulations and procedures to be used inacquiring local and special interest group participation, preparing reports(environmental analysis, environmental impact statements), and developingmanagement action plans (resource management, coordinated resourcemanagement, etc.). Court decisions repeatedly have confirmed the needs toassess private and public effects of proposed programs and considerspecial interests and local community preferences in formulating publicland management and use plans. However, the regulations and procedureswhich have been developed often are viewed by local users and public landdependent communities, and often by environmental groups as well, asinadequate, leading to a less than equitable consideration of the effectsof proposed public land use decisions.
Local users and dependent communities must share responsibility in thepublic land use decision-making process. Understanding how the processworks is absoluteley necessary. Organizing to present a common front, alocal concensus of constructive concern, is invaluable. Presenting objec-tive information on the local costs of proposed public land use decisionsis indispensible.
50
market or non-market values of resources in their alternative uses thatthe values of public land resources are derived. Because other factorsof production (labor, capital input like machinery, etc.) also are usedin producing outputs, by resource-using industries, the derived valuesof public land resources used to produce one unit of output (e.g., onecalf) are equal to only a portion of the value of that unit of output.As management alternatives available to the producer increases (forexample, purchasing hay to replace public allotment AUM's or reducingherd size and shifting from cow-calf to cow yearling operations), thederived value of public land resources tends to decline.
The non-market values of public land resource outputs such as fishand wildlife are derived from the expenditures recreationists are willingto make to enjoy those resources. Willingness to pay is used as anequivalent for true market value for such resources. Alternatives avail-able to the recreator, as a consumer, influence the value of non-marketresources in the same sense as management alternatives affect the valueof forage or trees. As opportunities for outdoor recreation increase,the derived values of fish, wildlife, and related public land resourcesdecline.
Since it is easier to derive the values of resources used in producingmarketable goods such as logs or calves, use decisions allocating more landto, say, outdoor recreation and less to grazing or commercial timber har-vest often are evaluated by contrasting timber and forage benefits foregonewith recreational opportunities gained. The value of foregone benefitsrepresents the opportunity costs of recreation enhancement. If theopportunity costs is less than the recreation benefit, the decision issaid to be economically efficient; and if not, the decision is inefficient.In the case of wilderness area decisions, the benefits associated withpreservation of wilderness resources for present and future generationsmust be greater than the foregone timber, forage, and developed recreationbenefits if the wilderness decision is to be judged economically plausible.While economic considerations are only one of several decision variablesin the public land planning process, the opportunity costs of proposeddecisions do provide a basis for evaluating prospective tradeoffs.
Efficient decisions may not be equitable. The distributions ofbenefits foregone by some user groups relative to the benefits gained byothers also are relevant. If a resource management plan benefits rancherswhile penalizing timber interests and recreators, or vice versa, aneconomically efficient decision may not be economically equitable. Fromthe point of view of local resource users and dependent communities, adecision which is efficient in the national context may be viewed as quiteinequitable by local people if they must forego benefits in the interestsof greater net benefit at the national level.
For these reasons, citizens need to evaluate the local opportunity costsof public land use restrictions, and provide such information in an appropri-ate form and timely way to public decision-makers. Information on both thedirect and indirect values of local costs (or foregone benefits) is relevant.
51
Direct costs (benefits) are, in essence, the reduction (increase) inmonetary returns associated with the rights to public land resources --just as the final value of privately owned resources is determined by therate of return to owner. Indirect costs (benefits) are the reductions(increases) in final returns to other segments of the local economyinduced by changes in economic activity in the basic resource-usingindustries. In either case, losses in household income attributable toreduced availabilities of public land resources are the appropriatemeasure of the local opportunity cost of public land use restrictions.
ESTIMATING LOCAL OPPORTUNITY COSTS OF PROPOSED LAND USE RESTRICTIONS
The local opportunity costs of two public land use restrictions, (1)the Strawberry Mountain and North Fork proposed wilderness areas in Grantand Umatilla Counties, Oregon; and (2) reduced availability of public graz-ing in the Baker grazing district (Baker County, Oregon) administered bythe Bureau of Land Management, are evaluated below. Use is made of primarydata input-output models developed by Oregon State University for GrantCounty, Oregon (1, 4). Additional information is derived from a M.S. thesison the structure of the Grant County timber industry (2). Data on projectedlosses in grazing AUM's and timber harvest were provided by Forest Serviceand Bureau of Land Management personnel, timber and cattle industrysources, and two citizens group, the Grant County Resource Council andthe Blue Mountain Resources Council. In both applications, local oppor-tunity costs are measured as the present value of foregone household incomefrom declines in public grazing and timber harvest. To be appropriatelyused in public decision-making, these values should be compared withbenefits from increased recreation. From the local perspective, however,it must be remembered that only those increased recreation expendituresmade in the local economy should be used to derive offsetting increasesin household income.
North Fork and Strawberry Mountain Wilderness Areas
Although some public grazing could be lost, the primary effect of theproposed North Fork and Strawberry Mountain wilderness areas would bereduced commercial timber harvest. Based on an assumed harvestable timbergrowth rate of 153 board feet/acre/year, the proposed wilderness areas wouldresult in an annual loss in programed harvest of 17,302 MBF. Of this total,4,002 MBF would be lost in the Strawberry Mountain area, and 13,300 MBF inthe North Fork area. Under present sustained, non-declining yield policy,the annual loss in programmed harvest could not be offset by increasedharvest levels elsewhere in the Malheur and Umatilla National Forests.
The species mix in annual programmed harvest loss is known for theproposed Strawberry wilderness area, and is assumed to be the same for theNorth Fork area. The species composition is 38.88 percent ponderosa pine,55.56 percent associated species, and 5.66 percent lodgepole pine. Forexample, the 4,002 MBF loss in annual programmed harvest in the Strawberryarea would consist of losses in harvestable ponderosa pine (1,556 MBF),associated species (2,220 MBF), and lodgepole pine (226 MBF).
52

"Normal" stumpage prices paid for ponderosa pine, associated species,and lodgepole pine in the vicinity of each of the wilderness areas were pro-vided by Forest Service planning officers assigned to the two affectedNational Forests. 1 In the Strawberry Mountain area on the Malheur NationalForest, these values were $209, $40.50, and $8.50 per thousand board feet,respectively. The corresponding stumpage prices in the Umatilla NationalForest's North Fork area were $210/MBF for ponderosa pine, $80/MBF for asso-ciated species, and $l0/MBF for lodgepole pine. Lodgepole pine values werefor stands of predominantly dead trees caused by insect infestation.
Using those data, summarized in Table 1 below, the annual quantity andvalue of commercial timber harvest loss in the proposed wilderness areas canbe estimated. These projected losses in timber sales, amounting to $417,000in the Strawberry area and $1,684,000 in the North Fork area, may be inter-preted as an equivalent reduction in National Forest System receipts. Intotal, $2,101,000 in annual timber receipts (to the federal government) wouldbe foregone in perpetuity as a consequence of the wilderness designations.
Table 1. Projected annual losses in National Forest system receipts attributableto proposed wilderness areas in the Strawberry Mountain and NorthFork areas of Oregon
Species Group
Annual Harvest Loss Value of Annual Harvest Loss
StrawberryArea
(MBF)
North ForkArea(MBF)
TotalArea(MBF)
StrawberryArea
($000)
North Fork TotalArea Area *
($000) ($000)
Ponderosa Pine 1,556 5,171 6,727 325 1,086 1,411
AssociatedSpecies 2,220 7,376 9,596 90 590 680
Lodepole Pine 226 753 979 2 8 10
ALL SPECIES 4,002 13,300 17,302 417 1,684 2,101
Some of these National Forest System receipts (25 percent) are returneddirectly to county governments in the form of "payments in lieu of taxes."These payments are made to compensate local governments for property tax andother revenues which would have been received if the local public lands hadbeen in private ownership. The Strawberry Mountain wilderness area wouldresult in foregone timber sale payments to Grant County of about $104,000 peryear, representing roughly two percent of total annual in lieu of tax paymentsto Grant County (Table 2).
1 Personal communications with Chet Bennett, Malheur National Forest planningstaff officer, and Richard Schimel, Umatilla National Forest timber salesofficer, February 5, 1980.
53
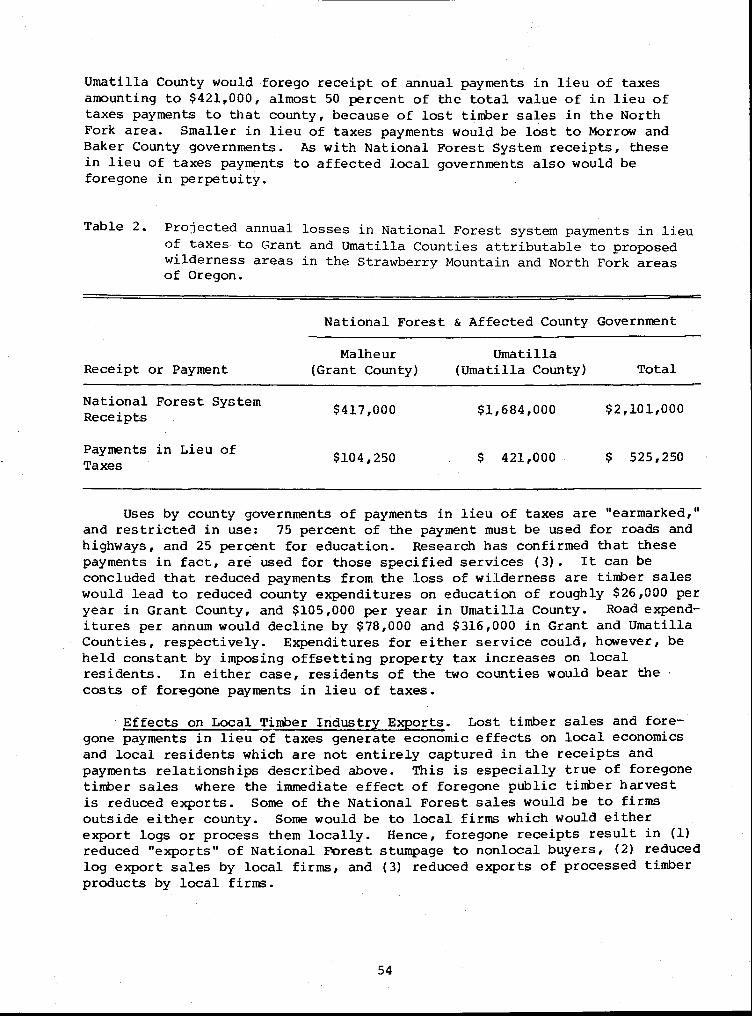
Umatilla County would forego receipt of annual payments in lieu of taxesamounting to $421,000, almost 50 percent of the total value of in lieu oftaxes payments to that county, because of lost timber sales in the NorthFork area. Smaller in lieu of taxes payments would be lost to Morrow andBaker County governments. As with National Forest System receipts, thesein lieu of taxes payments to affected local governments also would beforegone in perpetuity.
Table 2. Projected annual losses in National Forest system payments in lieuof taxes to Grant and Umatilla Counties attributable to proposedwilderness areas in the Strawberry Mountain and North Fork areasof Oregon.
Receipt or Payment
National Forest & Affected County Government
Malheur(Grant County)
Umatilla(Umatilla County) Total
National Forest SystemReceipts $417,000 $1,684,000 $2,101,000
Payments in Lieu ofTaxes $104,250 $ 421,000 $ 525,250
Uses by county governments of payments in lieu of taxes are "earmarked,"and restricted in use: 75 percent of the payment must be used for roads andhighways, and 25 percent for education. Research has confirmed that thesepayments in fact, are used for those specified services (3). It can beconcluded that reduced payments from the loss of wilderness are timber saleswould lead to reduced county expenditures on education of roughly $26,000 peryear in Grant County, and $105,000 per year in Umatilla County. Road expend-itures per annum would decline by $78,000 and $316,000 in Grant and UmatillaCounties, respectively. Expenditures for either service could, however, beheld constant by imposing offsetting property tax increases on localresidents. In either case, residents of the two counties would bear thecosts of foregone payments in lieu of taxes.
Effects on Local Timber Industry Exports. Lost timber sales and fore-gone payments in lieu of taxes generate economic effects on local economicsand local residents which are not entirely captured in the receipts andpayments relationships described above. This is especially true of foregonetimber sales where the immediate effect of foregone public timber harvestis reduced exports. Some of the National Forest sales would be to firmsoutside either county. Some would be to local firms which would eitherexport logs or process them locally. Hence, foregone receipts result in (1)reduced "exports" of National Forest stumpage to nonlocal buyers, (2) reducedlog export sales by local firms, and (3) reduced exports of processed timberproducts by local firms.
54
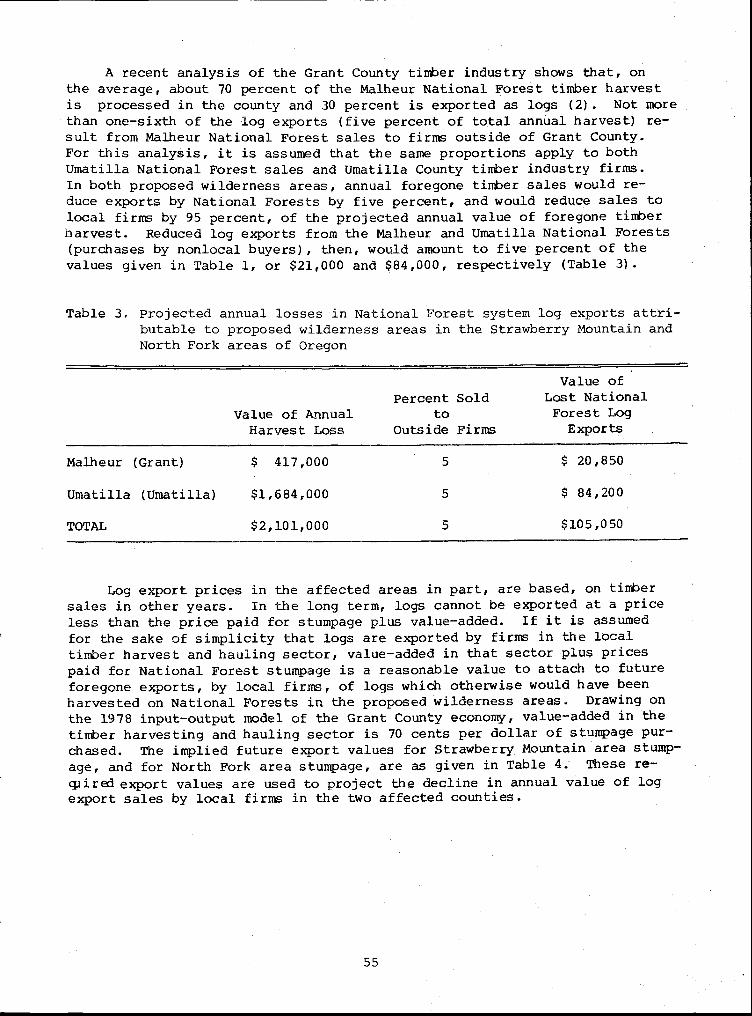
A recent analysis of the Grant County timber industry shows that, onthe average, about 70 percent of the Malheur National Forest timber harvestis processed in the county and 30 percent is exported as logs (2). Not morethan one-sixth of the log exports (five percent of total annual harvest) re-sult from Malheur National Forest sales to firms outside of Grant County.For this analysis, it is assumed that the same proportions apply to bothUmatilla National Forest sales and Umatilla County timber industry firms.In both proposed wilderness areas, annual foregone timber sales would re-duce exports by National Forests by five percent, and would reduce sales tolocal firms by 95 percent, of the projected annual value of foregone timberharvest. Reduced log exports from the Malheur and Umatilla National Forests(purchases by nonlocal buyers), then, would amount to five percent of thevalues given in Table 1, or $21,000 and $84,000, respectively (Table 3).
Table 3. Projected annual losses in National Forest system log exports attri-butable to proposed wilderness areas in the Strawberry Mountain andNorth Fork areas of Oregon
Value ofPercent Sold Lost National
Value of Annual
to Forest LogHarvest Loss Outside Firms Exports
Malheur (Grant) $ 417,000 5 $ 20,850
Umatilla (Umatilla) $1,684,000 5 $ 84,200
TOTAL $2,101,000 5 $105,050
Log export prices in the affected areas in part, are based, on timbersales in other years. In the long term, logs cannot be exported at a priceless than the price paid for stumpage plus value-added. If it is assumedfor the sake of simplicity that logs are exported by firms in the localtimber harvest and hauling sector, value-added in that sector plus pricespaid for National Forest stumpage is a reasonable value to attach to futureforegone exports, by local firms, of logs which otherwise would have beenharvested on National Forests in the proposed wilderness areas. Drawing onthe 1978 input-output model of the Grant County economy, value-added in thetimber harvesting and hauling sector is 70 cents per dollar of stumpage pur-chased. The implied future export values for Strawberry Mountain area stump-age, and for North Fork area stumpage, are as given in Table 4. These re-spired export values are used to project the decline in annual value of logexport sales by local firms in the two affected counties.
55

Table 4. Projected log export values and annual losses in private sector logexport sales attributable to proposed wilderness areas in the Straw-berry Mountain and North Fork areas of Oregon
Actual & Expected Values Values of Purchases & Sales
National Private Value of Lost Stump- Value of LostNational Forest, Forest Sector Logs age Purchased to be Exports by theCounty, and
Stumpage Exports Resold as Log Ex- Local PrivateSpecies Group ($/MBF) ($/MBF) ports Sector
Malheur(Grant)
Ponderosa Pine 209.00 355.50 $ 81,300 $138,300
AssociatedSpecies 40.50 68.90 $ 22,500 $ 38,200
Lodegpole Pine 8.50 14.50 $ 500 $ 800
All Species 104.20 177.20 $104,300 $177,300
Umatilla(Umatilla)
Ponderosa Pine 210.00 357.20 $271,500 $461,800
Associated 80.00 136.10 $147,500 $251,000Species
Lodgepole Pine 10.00 17.00 $ 1,900 $ 3,200
All Species 126.60 2k5,39 $429,900 $716,000
The date in Table 4 show that, in addition to the regional decline inNational Forest System stumpage exports of $105,050 as reported in Table 3,an annual loss in future log exports by local firms of $893,600 ($177,300 inGrant County plus $716,000 in Umatilla County) can be expected to the pro-posed wilderness areas are implemented. However, these foregone exportsaccount for only 30 percent of the annual harvest loss in the two areas. Theremaining 70 percent would have been processed into lumber and wood productsby local industries.
Local wood processing firms in the two counties could purchase stumpagedirectly from the National Forest by bidding successfully for timber sales,or they could purchase logs from timber harvesting and hauling firms. If theprocessing firms were to buy directly from the National Forest System they,just as independent loggers, would add value through the harvesting andhauling activities. Additional value would be added as logs are processedinto lumber and wood products. Again using the Grant County input-outputmodel, value added in the lumber and wood products processing industry is
56
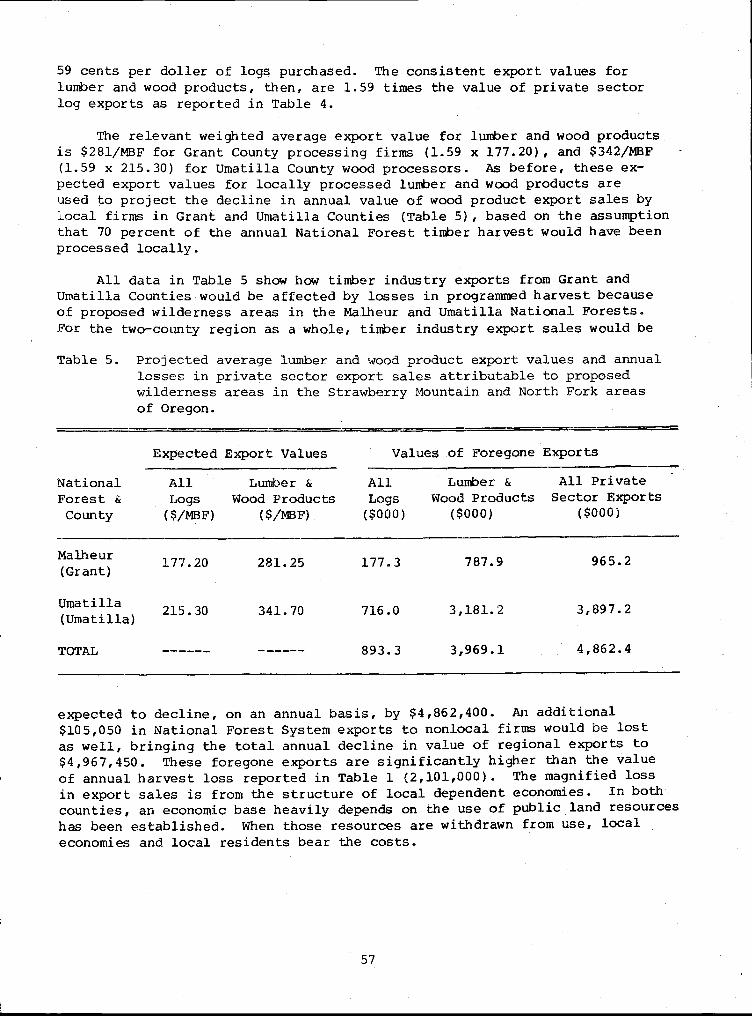
59 cents per doller of logs purchased. The consistent export values forlumber and wood products, then, are 1.59 times the value of private sectorlog exports as reported in Table 4.
The relevant weighted average export value for lumber and wood productsis $281/MBF for Grant County processing firms (1.59 x 177.20), and $342/MBF(1.59 x 215.30) for Umatilla County wood processors. As before, these ex-pected export values for locally processed lumber and wood products areused to project the decline in annual value of wood product export sales bylocal firms in Grant and Umatilla Counties (Table 5), based on the assumptionthat 70 percent of the annual National Forest timber harvest would have beenprocessed locally.
All data in Table 5 show how timber industry exports from Grant andUmatilla Counties would be affected by losses in programmed harvest becauseof proposed wilderness areas in the Malheur and Umatilla National Forests.For the two-county region as a whole, timber industry export sales would be
Table 5. Projected average lumber and wood product export values and annuallosses in private sector export sales attributable to proposedwilderness areas in the Strawberry Mountain and North Fork areasof Oregon.
Expected Export Values Values of Foregone Exports
National All Lumber & All Lumber & All PrivateForest & Logs Wood Products Logs Wood Products Sector ExportsCounty ($/MBF) ($/MBF) ($000) ($000) ($000)
Malheur 177.20 281.25 177.3 787.9 965.2(Grant)
Umatilla 215.30 341.70 716.0 3,181.2 3,897.2(Umatilla)
TOTAL 893.3 3,969.1 4,862.4
expected to decline, on an annual basis, by $4,862,400. An additional$105,050 in National Forest System exports to nonlocal firms would be lostas well, bringing the total annual decline in value of regional exports to$4,967,450. These foregone exports are significantly higher than the valueof annual harvest loss reported in Table 1 (2,101,000). The magnified lossin export sales is from the structure of local dependent economies. In bothcounties, an economic base heavily depends on the use of public land resourceshas been established. When those resources are withdrawn from use, localeconomies and local residents bear the costs.
57
Effects on Local Timber Industry Exports. Just as economic activityin local timber industries depends on National Forest System management andland use policies, so are all other sectors of local economies related tothe timber industry. The nature and degree of these structural relationshipscan be measured. One form of measurement is an input-output model of thelocal economy. The 1978 Grant County input-output model (4) is used here toevaluate the effect, on the county economies, of reduced National Forest andtimber industry exports. Effects on county-level economic activity of re-duced payments in lieu of taxes are evaluated as well. It is assumed thatGrant and Umatilla Counties are structurally similar, differing essentiallyon the basis of greater overall size of the Umatilla County economy.
An input-output model can be used to estimate benefits foregone becauseof decreased exports (sales to final demand) or benefits gained from in-creased exports. The initial change in exports, or sales to final demand,is the direct effect of interest. Induced or indirect changes are measuredby the increased (or decreased) transactions inside the county which resultfrom an initial change in economic activity. For example, decreased timberharvest, translated into decreased timber industry exports, would causea decrease in purchase of products required to harvest, haul, and processthat resource. Mill owners might lay off local employees, but less elec-tricity or fuel, and forego purchases they otherwise would have made.Residents who sold their labor, electricity, or fuel would have to decreasetheir purchases inside and outside the county. Likewise, businesses in thecounty that sell to residents, energy suppliers, and fuel firms would haveto decrease their inside and outside purchases. Hence, the effects of theinitial changes in timber harvest and export sales "ripple" throughout thelocal economy, leading to a multiplied impact in the economy as a whole.
The Grant County input-output model, as do other such models, providesan estimate of the multiplied impact of change in exports. Multipliers areestimated for each sector of the economy, and the values of these multipliersdiffer among sectors. Those sectors most closely tied to other sectors ofthe economy generally have higher multipliers. For the National Forest,timber harvest and hauling, and lumber and wood products processing sectorsthe Grant County multipliers are 1.94, 2.59, and 2.55, respectively.Assuming that these sectoral multipliers also apply to Umatilla County, thegross economic impact of reduced export sales attributable to timber harvestlosses in the two proposed wilderness areas can be projected. These impactsare summarized in Table 6.
The interpretation of these estimates is straightforward. Under theassumption stated earlier, foregone timber harvest in the proposed StrawberryMountain wilderness area would lead to reduced business activity in GrantCounty. The annual reduction is more than 2 h million dollars in currentprices. The • North Fork wilderness area would impose a similar loss onUmatilla County business activity, valued at more thant $10 million dollarsper year. Total regional loss in gross activity is valued at $12,638,600per year.
58
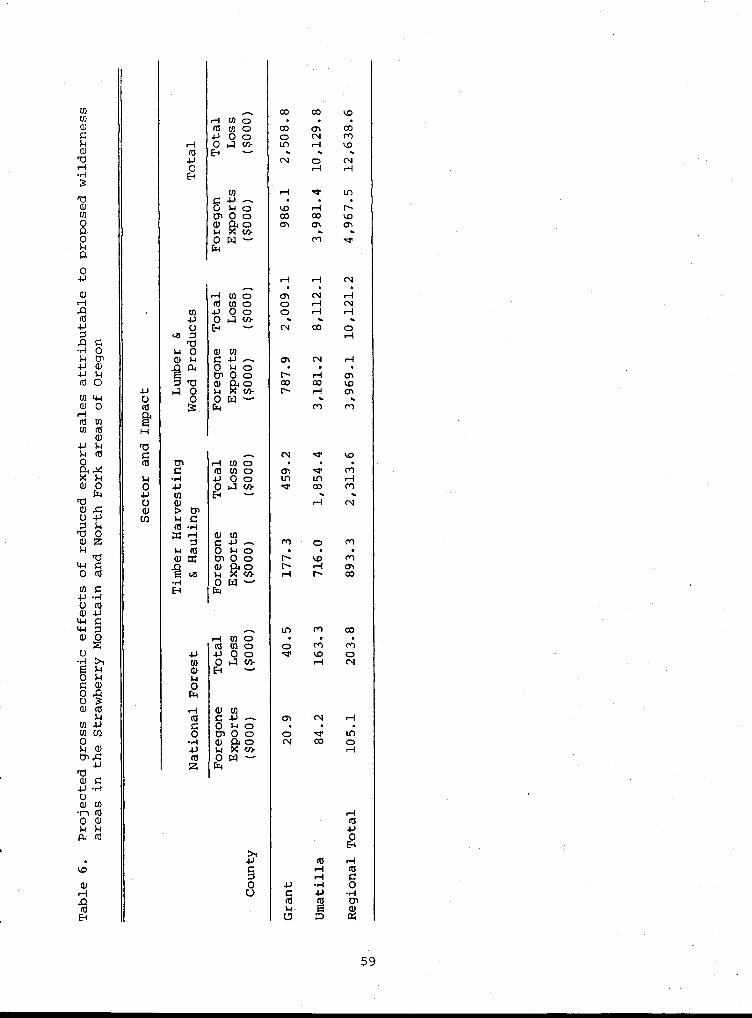
U)a)
-H
a)U)00C).0
Cll
(04J
00")(1)
-Pcti 0U) 4-4CU 0ro u)u)
a) 0
N 44-)
TS 0Z
'C4-4O (tl
4-) -HC.) (0(1) 4.)
14-1tHa)
-H0O 4c.) 3a) (aU)• U)Oto 4
a) c4-)0• u)
• -1 (0O a)
a (a
.0
ra4.)O
U)
4)OD
si 0a) S4
"2 "4
a• 00
CO CO n.0H U) 0 •
(121 CO 01 CO-s-) 0 a 0 N M0 a in- tf) H tO. . .
N CD N
U)
H
cr
H
tf)0 ( 1/4.0 H
•N
01 0 c,a) P4 0
CO01
CO01
1.001
sa V> . .0 M .4.
H H N• •H U) 01
(z)4-I 0 o
oo
H N0 1-1
E-( N COH
CU WU, 4-)0 $4 o •tr 0 o H 0)a)
-EA-o
CO COH
1.0
M
N eP• V,•(0 CI) a 01 't3.44 0 (D L11 H0 1-1 CO M
E-I ri N
.0 .-.. (-n0to 0 ovPo
NN
1/40 Mx n-1 N co
0 r4
•••••n In m
(IZS U) 0 O• •
rn4-) 0 0 er 1/4.0 CL10 a in-
-
v vi---. ON
H
N0 w • •tn 0 o CD toa) p4
pCN CO 0
0 PI -fr.,
10
O .H(0
E
4.1
59
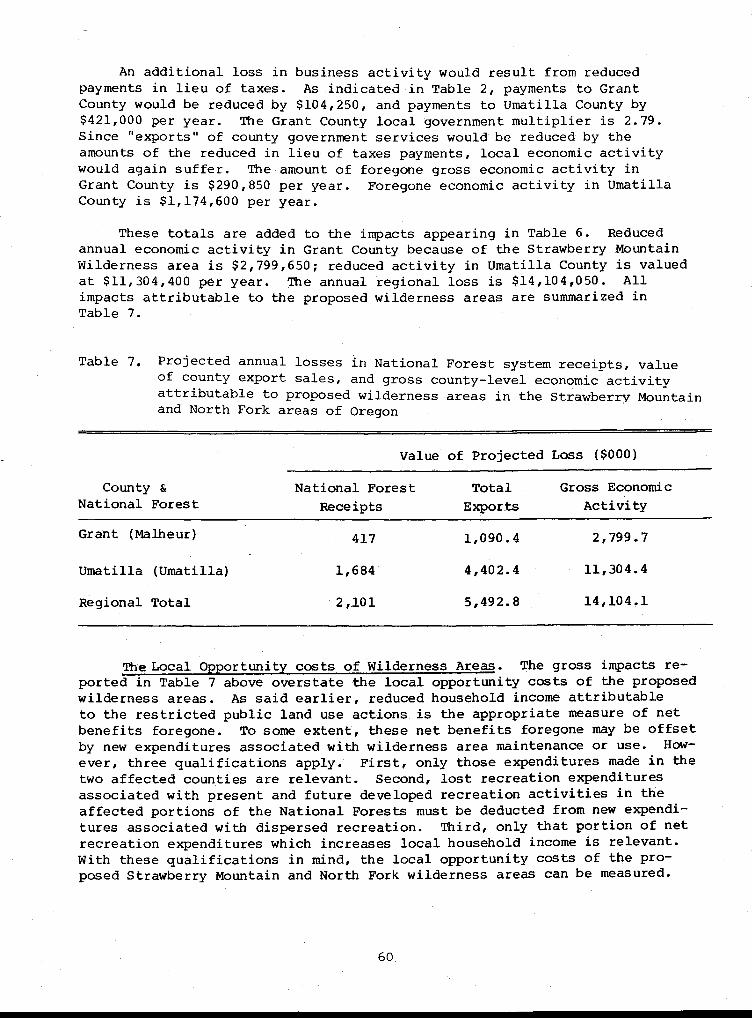
An additional loss in business activity would result from reducedpayments in lieu of taxes. As indicated in Table 2, payments to GrantCounty would be reduced by $104,250, and payments to Umatilla County by$421,000 per year. The Grant County local government multiplier is 2.79.Since "exports" of county government services would be reduced by theamounts of the reduced in lieu of taxes payments, local economic activitywould again suffer. The amount of foregone gross economic activity inGrant County is $290,850 per year. Foregone economic activity in UmatillaCounty is $1,174,600 per year.
These totals are added to the impacts appearing in Table 6. Reducedannual economic activity in Grant County because of the Strawberry MountainWilderness area is $2,799,650; reduced activity in Umatilla County is valuedat $11,304,400 per year. The annual regional loss is $14,104,050. Allimpacts attributable to the proposed wilderness areas are summarized inTable 7.
Table 7. Projected annual losses in National Forest system recei pts, valueof county export sales, and gross county-level economic activityattributable to proposed wilderness areas in the Strawberry Mountainand North Fork areas of Oregon
County &National Forest
Value of Projected Loss ($000)
National ForestReceipts
TotalExports
Gross EconomicActivity
Grant (Malheur)
Umatilla (Umatilla)
Regional Total
417
1,684
2,101
1,090.4
4,402.4
5,492.8
2,799.7
11,304.4
14,104.1
The Local Opportunity costs of Wilderness Areas. The gross impacts re-ported in Table 7 above overstate the local opportunity costs of the proposedwilderness areas. As said earlier, reduced household income attributableto the restricted public land use actions is the appropriate measure of netbenefits foregone. To some extent, these net benefits foregone may be offsetby new expenditures associated with wilderness area maintenance or use. How-ever, three qualifications apply. First, only those expenditures made in thetwo affected counties are relevant. Second, lost recreation expendituresassociated with present and future developed recreation activities in theaffected portions of the National Forests must be deducted from new expendi-tures associated with dispersed recreation. Third, only that portion of netrecreation expenditures which increases local household income is relevant.With these qualifications in mind, the local opportunity costs of the pro-posed Strawberry Mountain and North Fork wilderness areas can be measured.
60
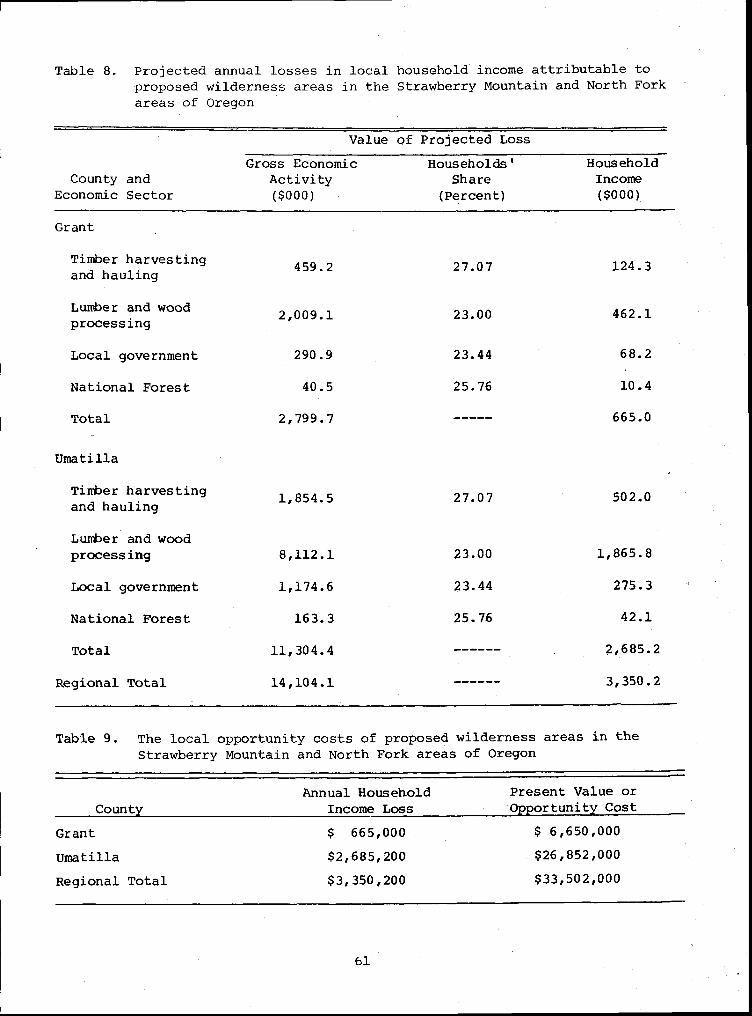
Table 8. Projected annual losses in local household income attributable toproposed wilderness areas in the Strawberry Mountain and North Forkareas of Oregon
County andEconomic Sector
Value of Projected Loss
Gross EconomicActivity($000)
Households'Share
(Percent)
HouseholdIncome($000)
Grant
Timber harvestingand hauling 459.2 27.07 124.3
Lumber and woodprocessing
2,009A. 23.00 462.1
Local government 290.9 23.44 68.2
National Forest 40.5 25.76 10.4
Total 2,799.7 665.0
Umatilla
Timber harvestingand hauling
1,854.5 27.07 502.0
Lumber and woodprocessing 8,112.1 23.00 1,865.8
Local government 1,174.6 23.44 275.3
National Forest 163.3 25.76 42.1
Total 11,304.4 2,685.2
Regional Total 14,104.1 3,350.2
Table 9. The local opportunity costs of proposed wilderness areas in theStrawberry Mountain and North Fork areas of Oregon
CountyAnnual Household
Income LossPresent Value orOpportunity Cost
Grant $ 665,000 $ 6,650,000
Umatilla $2,685,200 $26,852,000
Regional Total $3,350,200 $33,502,000
61

As before, the Grant County input-output model is assumed to apply toUmatilla County as well. The model can be used to calculate the portion ofgross economic activity in any sector which is from sales of labor, bylocal households, to local employers. The contribution of labor to totaleconomic activity varies amoung sectors of the local economy. Hence, theeffect on household income of change in local economic activity because ofthe wilderness areas is a combined effect of reduced export sales by theNational Forest, local timber harvesting and hauling firms, local lumber andwood processing firms, and local government.
In Grant County, households capture 27.07 percent of the gross incomeinduced by exports of logs by local timber harvesting and hauling firms.Households receive a slightly smaller share of total income attributable toNational Forest stumpage, local government, and local lumber and wood pro-ducts exports -- 25.76, 23.44, and 23.00 percent, respectively. Using thesepercentages, the annual losses in local household income attributable to theproposed wilderness areas can be calculated, (Table 8).
These figures show that Grant County households would bear a substantialcost for the Strawberry Mountain wilderness area. In current dollars, theannual value of that household income loss is $665.000. Umatilla Countyresidents would lose $2,685,200 in annual household income. For the regionas a whole, $3,350,200 in household income would be lost each year.
Since this household income would be lost in perpetuity, it is possibleto estimate the present value of the local income stream foregone as a con-sequence of the wilderness area decisions. The present value of foregoneincome varies with the long-term interest (social discount) rate. A con-servative rate is 10 percent, meaning that the present value of foregonehousehold income is 10 times its annual value (annual income lost divided by0.10). The present values of local household income foregone as a conr-sequence of the proposed wilderness area designations appear in Table 9.They are the most appropriate measure of the local opportunity costs of thewilderness area decisions.
Baker Grazing District AUM Reduction
Evaluating the local impacts of public grazing reductions is difficult.Ranchers dependent on public lands for grazing also use private pasture and/or rangeland to support their cattle or sheep operations. Hence, substitu-tion of private forage (AUM's) is a possibility, although studies have shownthat in Eastern Oregon, hay and pasture are more likely to be a complimentarypart of a ranching operation than a separate enterprise engaged in hayproduction and selling (5). Further, public AUM's legally cannot be boughtor sold, and therefore, have no observable market price. The value of apublic AUM is derived from its contribution to returns to the ranch operation;and the rancher, in turn, owns cattle, private land, and other assets. Thus,he may have management alternatives which permit him to shift from, say,cow-calf to cow-yearling operations so as to partially offset the effects ofof public AUM withdrawals. However, the feasible alternatives for a ranch
62
operation are dependent on the rancher's financial position (especiallylong-term debt), and the unique land ownership and public land accessrights of his operation. Consequently, the adaptation ranchers can andwill make to losses in grazing privileges will vary from case to case.
For these reasons, and others, assessing the local economic effects ofpublic grazing restrictions is more complicated than evaluating the impactsof lost programmed timber harvest. Assumptions must be made about theexpected management response of ranchers to public grazing reductions, theavailability of private pasture and hay on the ranch and in the local area,and the typical financial ownership characteristics of affected operations.
It is also necessary to distinguish between short-term response andlonger-term adaptation to the reduced availability of public grazing. Inthe short-term, operations may attempt to hold cow herd or sheep band sizeat present levels by buying hay or renting pasture. However, because thesepractices add to annual operating costs, in the longer-term, herd size mayhave to be reduced. If cows are sold, the rancher will have fewer calves tosell; and his annual income and ability to repay long-term debt, if any, , willbe reduced. Depending on the operator's financial position, either main-taining herd size by buying hay or reducing herd size to accommodatedecreased public AUM availability may be economically infeasible. Theoperations then may be sold.
To prevent sale of the operation or restore its economic viability, therancher has two options: If capital is available, he may invest in his ownprivate land to increase its carrying capacity through range fertilizationand reseeding, irrigation, etc. If capital is unavailable, or the operatorfeels that costs and prices are attractive, a different form of managementsuch as chow-short yearling or backgrounding may be adopted. In the absenceof such a change in management, however, the long-term outcome of public landwithdrawal likely will be fewer, but larger, ranching operations and higheraverage costs per calf sold.
In Eastern Oregon, as in most of the interior West, range livestocknumbers over the long-term are at levels which fully utilize pasture andforage. In a "normal" or "average" year, there will be little or no exportof grass or native hay from the region, and all pasture available for use willbe taken. Even if operators try to maintain herd size by buying hay orrenting pasture, they will be able to do so in the long-term only at very highhay purchase prices or pasture rental rates, if at all. Alfalfa hay, whichis expected from many areas, perhaps could be purchased and mixed with strawas a substitute for native or grass hay. However, alfalfa hay mixed withstraw would have the same effect on annual operating costs as would purchaseof native hay. In either case, annual operating costs for the affectedoperation would increase.
Barring a change in management, the more likely and least costly long-term alternative to hay purchase is reduced herd size and calve sales. Itis this alternative which is assumed for purposes of projecting the localeconomic impacts of public AUM losses in the Baker grazing district admin-istered by the Bureau of Land Management.
63

Effects on the Dependent Ranching Sector. In the Baker grazing district,about 56,000 surveyed AUM's exist; more than 50,000 (89 percent) areallocated through licensing to permitees (Table 10). The remaining 11 per-cent of the existing AUM's are allocated to other users, especially elk anddeer. Under a proposed range management plan, the allocation of AUM's tolivestock will be reduced by 9,827 AUM's to 40,413 AUM's per year. Theproposal would reduce the proportion of total available forage in the graz-ing district allocated to livestock from 89 to 72 percent, while the pro-portion dedicated to other uses would increase from 11 to 28 percent. Atissue are the tradeoffs associated with the proposed reallocation of forageAUM's; specifically, the benefits foregone by local ranchers and the localcommunity to enhance range condition and support uses and users other thanthe public land dependent ranching industry.
Table 10. Proposed reduction in animal unit months of grazing on the BakerDistrict administered by the Bureau of Land Management, BakerCounty, Oregon
Licensed AUM's
Number Surveyed Existing Proposed Loss inor Percent AUM's Situation Situation Livestock AUM's
Number 56,261 50,240 40,413 9,827
Percent of SurveyedAUM's 100 89 72 17
Percent of PresentlyLicensed AUM's 112 100 80 20
On an animal unit basis, the 9,827 AUM's lost to livestock grazing isequivalent to 1,228 cow-calf pairs, assuming that, on average, cattle in thelocal dependent ranching industry are using forage other than private pastureand hay for eight months of the year. However, the forced sale of 1,228 cowswould result in surplus hay and/or pasture, otherwise used to feed cattleduring the winter. If, on average, cattle are wintered for four months onprivate land in the Baker County area, 409 of the 1,228 cows could be main-tained using pasture and forage grown on privately owned land. The neteffect of the public grazing reduction (Table 11) then would be the sale of819 cows.
64
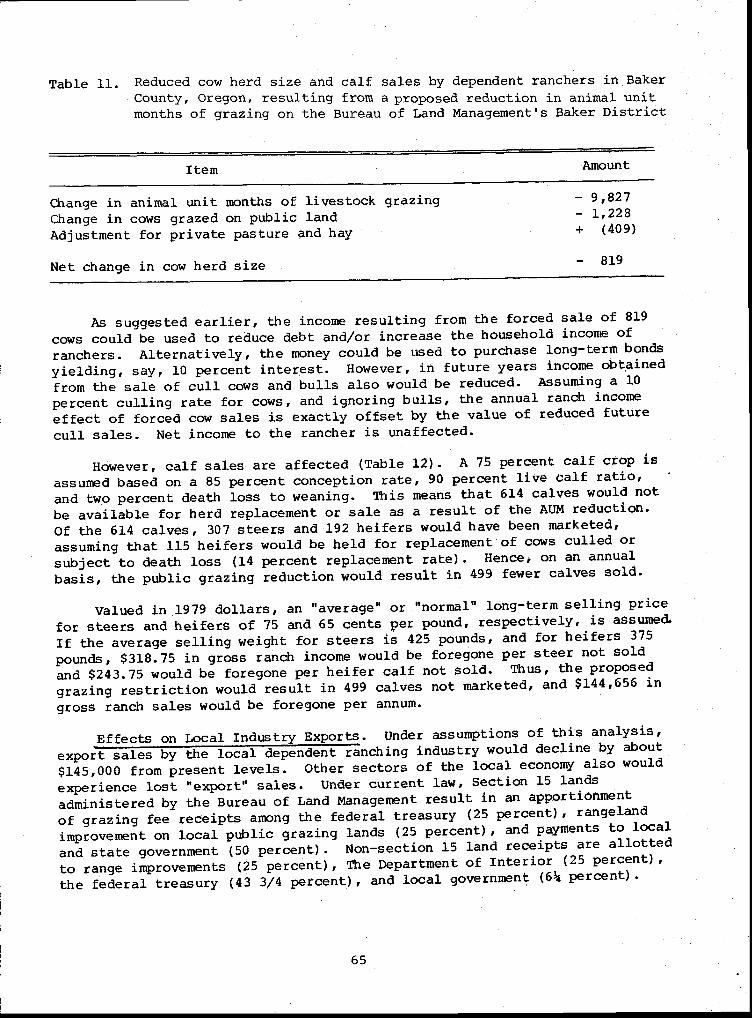
Table 11. Reduced cow herd size and calf sales by dependent ranchers in BakerCounty, Oregon, resulting from a proposed reduction in animal unitmonths of grazing on the Bureau of Land Management's Baker District
Item Amount
- 9,827- 1,228+ (409)
- 819
Change in animal unit months of livestock grazingChange in cows grazed on public landAdjustment for private pasture and hay
Net change in cow herd size
As suggested earlier, the income resulting from the forced sale of 819cows could be used to reduce debt and/or increase the household income ofranchers. Alternatively, the money could be used to purchase long-term bondsyielding, say, 10 percent interest. However, in future years income obtainedfrom the sale of cull cows and bulls also would be reduced. Assuming a 10percent culling rate for cows, and ignoring bulls, the annual ranch incomeeffect of forced cow sales is exactly offset by the value of reduced futurecull sales. Net income to the rancher is unaffected.
However, calf sales are affected (Table 12). A 75 percent calf crop isassumed based on a 85 percent conception rate, 90 percent live calf ratio,and two percent death loss to weaning. This means that 614 calves would notbe available for herd replacement or sale as a result of the AUM reduction.Of the 614 calves, 307 steers and 192 heifers would have been marketed,assuming that 115 heifers would be held for replacement of cows culled orsubject to death loss (14 percent replacement rate). Hence, on an annualbasis, the public grazing reduction would result in 499 fewer calves sold.
Valued in 1979 dollars, an "average" or "normal" long-term selling pricefor steers and heifers of 75 and 65 cents per pound, respectively, is assumed.If the average selling weight for steers is 425 pounds, and for heifers 375pounds, $318.75 in gross ranch income would be foregone per steer not soldand $243.75 would be foregone per heifer calf not sold. Thus, the proposedgrazing restriction would result in 499 calves not marketed, and $144,656 ingross ranch sales would be foregone per annum.
Effects on Local Industry Exports. Under assumptions of this analysis,export sales by the local dependent ranching industry would decline by about$145,000 from present levels. Other sectors of the local economy also wouldexperience lost "export" sales. Under current law, Section 15 landsadministered by the Bureau of Land Management result in an apportionmentof grazing fee receipts among the federal treasury (25 percent), rangelandimprovement on local public grazing lands (25 percent), and payments to localand state government (50 percent). Non-section 15 land receipts are allottedto range improvements (25 percent), The Department of Interior (25 percent),the federal treasury (43 3/4 percent), and local government (61/4 percent).
65
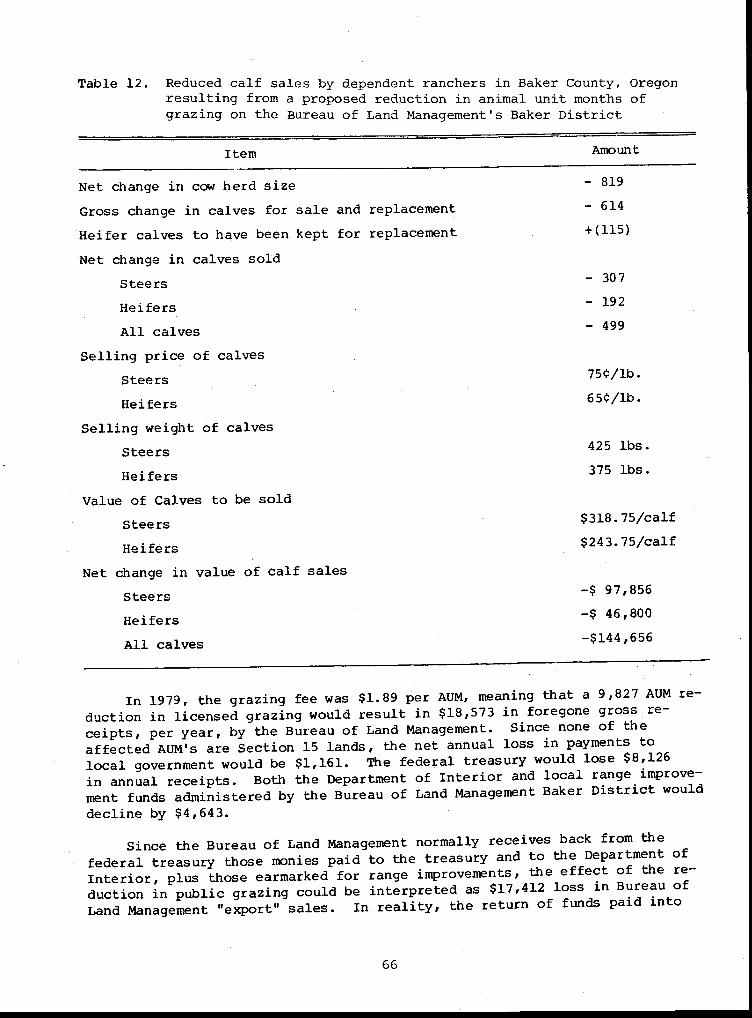
- 307
- 192
- 499
75c/lb.
65C/1b.
Table 12. Reduced calf sales by dependent ranchers in Baker County, Oregonresulting from a proposed reduction in animal unit months ofgrazing on the Bureau of Land Management's Baker District
Item Amount
Net change in cow herd size
Gross change in calves for sale and replacement
Heifer calves to have been kept for replacement
Net change in calves sold
Steers
Heifers
All calves
Selling price of calves
Steers
Heifers
Selling weight of calves
Steers 425 lbs.
Heifers 375 lbs.
Value of Calves to be sold
Steers $318.75/calf
Heifers $243.75/calf
Net change in value of calf sales
Steers -$ 97,856
Heifers -$ 46,800
All calves -$144,656
In 1979, the grazing fee was $1.89 per AUM, meaning that a 9,827 AUM re-duction in licensed grazing would result in $18,573 in foregone gross re-ceipts, per year, by the Bureau of Land Management. Since none of theaffected AUM's are Section 15 lands, the net annual loss in payments tolocal government would be $1,161. The federal treasury would lose $8,126in annual receipts. Both the Department of Interior and local range improve-ment funds administered by the Bureau of Land Management Baker District woulddecline by $4,643.
Since the Bureau of Land Management normally receives back from thefederal treasury those monies paid to the treasury and to the Department ofInterior, plus those earmarked for range improvements, the effect of the re-duction in public grazing could be interpreted as $17,412 loss in Bureau ofLand Management "export" sales. In reality, the return of funds paid into
66

the treasury or to the Department of Interior are not assured. Further, theeffects of foregone range improvement funds are taken into account by theinput-output model. Hence, Bureau of Land Management "export" sales are un-affected by the reduction in grazing fee receipts.
However, payments to local government would be reduced by more than$1,161 per year. Consequently, the proposed reduction in federal grazingprivileges, given the assumption stated above, could be expected to resultin a total loss of exports from Baker County valued at $145,817 per year.Ranching sector exports would decline by $144,656, and local governmentexports by $1,161. In summary, export sales from Baker County would declinefrom current levels by just under $150,000 annually as a result of the lossof public grazing (Table 13).
The Gross Economic Costs of Reduced Exports. Using the Grant Countyinput-output model, the gross economic impacts associated with these losses
Table 13. Projected annual losses in Baker County export sales attributableto a proposed reduction in animal unit months of grazing on theBureau of Land Management's Baker District
Economic Sector Value of Foregone Exports
Dependent Ranching $144,656
Local Government $ 1,161
TOTAL $145,817
in export sales can be calculated. The sectoral multipliers relevant to thelocal dependent ranching industry and to the local government sector are 2.39and 2.79, respectively. Assuming that these multipliers also apply to BakerCounty, the annual lost business transaction in Baker County attributableto the public land use restriction would be (1) $346,306 resulting from fore-gone calf sales; and (2) $3,238 because of lost payments to local government.The total gross impact on the local economy (Table 14) would be almost$350,000 per year.
Table 14. Projected gross economic effects of reduced export sales attributableto a proposed reduction in animal unit months of grazing on theBureau of Land Management's Baker District
Economic Sector Value of Gross
Generating Impact Economic Impact
Dependent Ranching $346,306
Local Government $ 3,238
TOTAL $349,544
67
The Local 0•••rtunit Costs of Reduced Federal Grazin•. As in the wild-erness area example, the gross economic impact of the reduced federal grazingprivilege overstates the local opportunity cost of the proposed action.Reduced household income in the county again is the appropriate measure ofnet benefits foregone. As before, the Grant County input-output model maybe used to calculate the portion of gross economic activity in any sector ofthe economy that is from sales of labor or other household services to localemployers. In Grant County, households capture 21.48 percent of the grossincome induced by export sales of calves and 23.44 percent of the incomeresulting from local government exports.
Applying these percentages to the gross business activity effects de-rived above yields the household income impacts of the federal land usedecision (Table 15). In 1979 dollars, more than $75,000 in household incomewould be foregone each year. The bulk of the foregone annual household in-come, $74,387, is from decreased economic activity resulting from lostcalf sales. Of the $74,387, roughly $60 percent ($45,038) in net incomewould be foregone by those ranchers using the grazing lands which will bewithdrawn.
Table 15. Projected annual losses in Baker County export sales, gross economicactivity, and household income attributable to a proposed reductionin animal unit months of grazing on the Bureau of Land Management'sBaker District
Value of projected loss
Economic sector Export
Gross economic Householdgenerating impact sales activity
income
Dependent Ranching $144,656 $346,306 $74,387
Local Government $ 1,161 $ 3,238 $ 759
TOTAL $145,817 $349,544 $75,146
As in the wilderness example, the household income would be lost in per-petuity. The present value of the foregone income stream, using the rela-tively conservative rate of 10 percent, is $751,460. Of this amount, morethan half (60 percent or $450,000) is the present value of the public grazingaccess rights (or license) given up by public land dependent ranchers.
SUMMARY AND IMPLICATIONS
Analysis of the proposed Strawberry Mountain and North Fork wildernessareas and the Baker grazing district management proposal show the costs tolocal residents of those decisions are indeed substantial. These values, oropportunity costs, may be interpreted in different ways.
68

Abstracting from the net local benefits, if any, attributable to thewilderness areas, local residents in Grant and Umatilla Counties would giveup household income valued in current prices at well over three milliondollars per year. The present value, or local opportunity costs, of foregoneincome exceeds 33 million dollars.
If, in fact, the purpose of wilderness areas is "to secure for theAmerican people of present and future generations the benefits of an enduringresource of wilderness," it follows that America could accept responsibilityfor the burden those limited use designations impose on local people livingin public land dependent communities. There are about 7,700 people who liveand work in Grant County. Another 54,000 live in Umatilla County. If theselocal people were to be equally well off with or without the wilderness areas,they could be reimbursed by America on behalf of present and future genera-tions who derive benefits from the wilderness. in this instance, a paymentof $864 to each man, woman, and child in Grant County, and a payment of $497to each Umatilla County resident, would be warranted.
Looking at the local costs somewhat differently, local timber firms andtheir employees depend on National Forest timber harvest for their Iiveiihood.The "right to access" to that timber, while not legally recognized, is viewedby local people as more than a mere privilege. Local wood products firmswould be willing to sell their "access rights" for an amount equal to thecontribution National Forest stumpage makes to their household income.
If the foregone household income reported in Table 8 holds, approxi- .mately 50 percent ($1,654,600) is lost to local dependent timber industryhouseholds. Since 17,302 MBF would be withdrawn from programmed harvest, theimplication is that the timber industry households would sell their NationalForest stumpage "access rights" for an average price of $956/MBF, assumingthat the 17,302 MBF are foregone in perpetuity. The additional lost house-hold income ($1,695,600 per year) could be reimbursed on a per capita basisto all remaining county residents. The average payment to non-timberindsutry households would be $30.83 per person. These alternative compen-sation payments are depicted in Table 16.
Table 16. Compensation alternatives for county residents bearing the costs ofproposed wilderness areas in the Strawberry Mountain and NorthFork areas of Oregon
County
Access.Right Purchase and
Uniform Per Capita Residual Per Capita Payment
Payment Access Right Per Capita
($/Person) ($/MBF) ($/Person)
Grant $863.63 $820.59 $67.32
Umatilla $497.26 $997.14 $27.18
Weighted Average $542.98 $956.31 $30.83
69

The impacts of the Baker grazing district AUM reduction can be inter-preted in an analogous fashion. Since the present value of the lost AUM'sis $751,460, and there are 17,000 people living in Baker County, it followsthat the nation could reimburse each resident for the opportunity foregoneby removing the public grazing from livestock use. In this case, presentresidents would be equally well off with or without the 9,827 AUM's if eachwere to receive a check for $44.20. However, such a compensation methodignores the fact that the distribution of costs borne by local residentsis uneven.
Another approach would be to reimburse ranchers using the AUM's inquestion in proportion to their loss in final household income. In thepresent instance, each rancher would be paid $45.79 ($450,000 divided by9,827 AUM's) for each AUM he or she formerly used -- a measure of the pre-sent value of his access right or license. Other people living and workingin the county would be reimbursed for final income foregone because ofreduced calve and local government exports. Their compensation payment wouldbe about $17.73 per person. Compensation alternatives in the grazing districtAUM reduction example are given in Table 17.
Table 17. Compensation alternatives for county residents bearing the costsof proposed grazing reductions on the Bureau of Land Management'sBaker District, Baker County, Oregon
County
Access Right Purchase andResidential Per Capita Payment
Uniform Per Capita Payment Access Right Per Capita
($/Person) ($/AUM) ($/Person)
Baker $44.20 $45.79 $17.73
Compensating local people for income foregone, or access rights lost,because of public land use restrictions is, perhaps, unrealistic. However,as this analysis has shown, it is not unrealistic for persons living andworking in public land dependent communities to be concerned with those deci-sions. The magnitude of the costs imposed on local economies, firms, andhouseholds lends credence to their efforts to influence the public landdecision-making process.
70
References
(1) Johnson, Thomas G., "A Dynamic Input-Output Model for Regional EconomicAnalysis," Ph.D. Dissertation, Department of Agricultural and ResourceEconomics, Oregon State University, July 1979.
(2) Miller, Lester F., "An Analysis of Changes in Log Flow Patterns on aTimber Dependent Community," M.S. Thesis (forthcoming), Department ofAgricultural and Resource Economics, Oregon State University, June 1980.
(3) Murtaugh, John J., "The Effects of Federal Agency Payments in Lieu ofTaxes on Oregon County Expenditure Patterns," M.S. Thesis, Departmentof Agricultural and Resource Economics, Oregon State University,September 1979.
(4) Obermiller, Frederick W. and Lester F. Miller, "Structure of a Resource-Based Economy: Grant County, Oregon," Oregon State University ExtensionService (forthcoming).
(5) Winter, John R. and James K. Whittaker, "An Economic Analysis of LandPrices of Mountainous Grazing Land in Eastern Oregon," Special Report560, Agricultural Experiment Station, Oregon State University,September 1979.
71
THE NEED FOR COOPERATIVE LAND USE PLANNING
Lewis M. Work
It is indeed a foolish person in today's world who does not plan ahead.It is just as important for individuals to plan as for corporations or govern-ment agencies.
Planning is a process that attempts to outline a future course ofaction that will result in smooth-running operations, conform with desiredphilosophies, and avoid unpleasant surprises. The president of Boise Cascademade a statemenet several years ago that bears repeating, "A well-run companydoes not tolerate surprises." The sad plight of Americans in the embassy inIran has all the earmarks of poor planning.
Planning that involves land use is probably one of the most importantand complex planning processes that exists today. It is complicated byintermingled ownerships of land, differing objectives of landowners, humanpopulation expansion and shifting of population patterns, differing needsof people using the land or products from the land, and wide variations ofgeographic, climatic, and vegatative composition.
Land use planning efforts are further confused because of the widevariety of human needs both real and perceived. Individual preferenceslead to highly charged and emotional responses to any developing plans.
Are land use planners obliged to consider neighbors when formulatingplans or is a mere ethical consideration all that is necessary?
You are all familiar with driving down a freeway and passing a sub-division that is very nicely laid out, landscaped, and contains tastefullybuilt houses with the exception of one house that is painted robin egg bluewith a red chimney, and purple door. The neighbors are probably madder thanhops and esthetic senses are offended but, it is a free country and no lawshave been passed yet to regulate individual taste. This incidence is a commonoccurring phenomenon in our society and one that we reluctantly countenanceto preserve individual freedom. If the owners of this house decide toestablish a kennel or to build a small concession stand to peddle producefrom their garden, it will soon become apparent to them that some subtleinvisible line has been transgressed and their neighbors may take legal stepsto preserve the integrity of the neighborhood.
Now let's apply this situation to the forest where the Forest Service, BLM,State of Oregon, Boise Cascade, and numerous smaller private landowners areneighbors. I don't think any of the neighbors will be too concerned oversilvicultural practices that take place on each other's land if resourcedamage is not occurring.
On the other hand, let's look at an example where the U.S. Forest Serviceor BLM or whoever decides that they want to enhance big game habitat to increasethe number of elk and deer on their property to provide a rewarding "quality"hunting experience for a large number of hunters.
72
Meanwhile, down the ridge below the snowline on the winter range onBoise Cascade and other private property, whose objectives are to grow treesand produce livestock forage, great hordes of elk and deer descent to competewith livestock grazing, and reforestation efforts. It should be obvious thata lack of communications of planning objectives between landowners presentsa very real economic problem to one party while striving to achieve anotherparty's intended goals.
Let me give you a real problem that occurred to Boise Cascade illustratingth-.? point. By lack of consideration for our needs as landowners, the ForestService will fail to achieve its goals.
The Forest Service Wallowa Valley planning unit included about 100,000acres of Boise Cascade land along with many acres of other private owners.
One of the published goals was to leave old growth timber intact toprovide hiding cover for elk and to provide "quality" hunting. By doing this,there would be a necessary reduction of timber harvest volume.
Boise Cascade harvests nearly 70 percent of its annual volume from ForestService lands and the remainder from its own land and other private land.To make up for the loss of volume from the government, it will be necessaryfor Boise to harvest more from its own land. Since much of the Boise landbeing harvested in lieu of preserved Forest Service timber is on elk winterrange, the reduction of thermal cover probably will have a more profoundeffect on elk than removal of hiding cover would have on Forest Service land.The end result is that by failing to recognize adjacent landowner needs andpotential, The Forest Service probably has doomed their objective to failure.
It behooves all of us as land managers to consider the entire communityof landowners before developing land use plans based on an arbitrary andisolated ownership pattern. To neglect neighbors is to foredoom your planningefforts to partial or complete failure.
73
COORDINATED RESOURCE PLANNING
Arleigh Islet'
In recent years, diverse groups of resource users have increased theirnatural resource demands. As a result, issues facing both public and privateresource managers have become much more complex. During the same period,the need to efficiently and equitably solve these common issues has becomeincreasingly urgent. There have been withdrawals of areas rich in naturalresources and increased demands because of a growing social concern for theenvironment, single use concepts, and a general lack of knowledge.
Western rural societies find themselves in a difficult position. Theyare expected to be guardians of our remaining natural resources while theirsurvival, individually and as a community, depends on the economic strengthof local industries that use the same resources they are expected to preserve.There is an urgent need for a process to develop plans for the best manage-ment of our resources, plans which will most nearly approximate the needs ofsociety.
For the last 15 years, a dedicated group of eastern Oregonians has con-ducted, sponsored, and cooperated with studies and experiments analyzing thearea's resource base. Local residents rely on income generated from the saleof basic resource industry products for their livelihood. If the people ofeastern Oregon maintain their economic base, the conservation and develop-ment of renewable resources and improved management in basic resource indus-tries--forestry, agriculture, and recreation--will be necessary because thereis limited opportunity for diversification and industrialization. In fact, theresidents of eastern Oregon recognize that most of the economic alternativesopen to more heavily populated regions are unattainable for their area.
One of the major problems facing eastern Oregon is the allocation ofscarce resources in a manner that will provide the greatest long- and short-term benefits to its people. If eastern Oregonians are to control theirdestiny, they must allocate the resource base in a manner that will develop,conserve, maintain, and improve the economic and natural resource base forfuture years. There is opportunity and potential for improvement throughdevelopment of our resources, but careful planning based on sound informationwill be required.
COORDINATED RESOURCE MANAGEMENT
One of the best tools for resource allocation is comprehensive resourcemanagement, a systematical method of managing all our natural resources thatrecognizes the interrelationships of resources. The Coordinated ResourceManagement approach uses the best efforts and knowledge of everyone involved--private landowners, state and federal agencies, resource specialists, andresource departments of major universities.
Several objectives are involved in reaching the primary goal: 1. A com-plete inventory of all renewable and non-renewable resources within a
74
specific geographic area. 2. A recognition of the interrelationship betweenresources. 3. An identification of all feasible resource developmentalternatives and selection of the most optimum alternative of those availableconsidering social, economic and environmental values. 4. Education of societyto recognize and appreciate fundamentals of resource management and theirimportance to the public.
CRM is the result of implementing a good coordinated resource plan andsuch management cannot be implemented without the proper plan. Therefore, CRMhas two major components: development of the coordinated resource plan andimplementation of the plan.
To accomplish this goal, coordinated resource plans must be based onscientific facts, ecological and management principles, and concepts. Soundplanning requires the evaluation of facts and the application of scientificprinciples to develop potential alternatives that can reach the desired manage-ment objectives. From feasible alternatives, one plan of action must beselected and implemented.
Coordinated resource planning and management is a result of severalactivities that provide the basis for the plan and its implementation. Theseactivities are: a stated goal, a complete inventory, precise mapping to showresource location, recognition of the interrelationshi ps between resources,recognition of the opportunity to develop resources, selection of an inter-disciplinary team of specialists to develop the plan, and a forum for publicreview and input.
The biological and environmental aspect of resource management is onlypart of the entire process of CRM. The economic relationship among resources
.and the interrelated relationships among economic sectors of the county'seconomy structure are equally important. For resource managers and othersto adequately plan, a complete study of the county's economic structure isnecessary. This includes an input-output study for the area in question andrelated information about trade areas, leading industries, and revenues ortaxes to support local government and community services. All industriesand sectors of the economy must be included to provide an adequate picture forrational planning.
Who or what part of society pays for resource developments and who reapsthe rewards also are important. Unfair relationships seldom have lasting valuebecause as soon as one party finds out they are being treated unfairly, theybegin to negotiate for a different position and the conflict is renewed. There-fore, good planning requires those who benefit pay the associated costs of theproduct.
In addition, resource planning and management must be done with people(resource users and the general public), not for them. Facts about resourcesand the principles of nature and management are the key to sound planning.Therefore, the role of specialists should include that of a helper, educator,and leader. The public will support and assist in implementing plans theyhelped develop.
75
Good plans begin with appropriate goals and objectives that are feasible,considering the resources available. A broad-based goal that is appropriatefor most renewable resources management is "to manage renewable resources ina manner that will optimize both short-term and long-term social, economic,and environmental benefits to society without permanently altering the optionsfor future use or changing the resource base."
INVENTORY
Coordinated resource plans by necessity are based on a complete inventoryof all resources, natural and human, within a geography area or region. Thecompleteness of the inventory determines the overall value of the coordinatedresource plan because of interrelationships of the resources. The impactsof management decisions on the designated resource and the secondary impactsthat result from the interrelationships with associated resources are ofgreat concern to resource managers and users.
To be adequate, the inventory must identify and locate all vegetativeeco-types, wildlife habitat, soils, available water, minerals, scenic andspecial recreation areas, and recognize potentials for development along withcritical and fragile resources that must be managed with great care. Allthese data must then be assembled into a usable form.
PLANNING
From this type of inventory base, resource managers can begin to evaluatedevelopment and management potentials according to the interrelationships be-tween resources and the social, economic, and environmental consequences thatmay occur in various management alternatives. Out of this complex and complicatedmass of information, resource managers must assemble and package the facts andmanagement principles in a way that all resource users and the public canfully understand. In addition, all feasible alternatives should be availablefor consideration by resource managers, resource users, and the general public.
The general planning process must start with an orientation session forresource managers so the entire interdisciplinary team is-aware of all theresources, interrelationships of resources, and the management potentials avail-able. Next, the teams must identify alternatives to be presented to the resourceusers and the public.
At this point, a general orientation session for all resources users,interested groups, and the general public should be conducted. It is importantthat no special interest or user group is left out of the planning process.After a complete and thorough orientation process, the resource managers, users,and public are ready to begin developing the Coordinated Resource Plan for aspecific set of resources in a specific geographic area.
The planning process requires certain fundamental attitudes from thosepeople involved. First of all, they must have a commitment to develop a rational,coordinated resource plan and implement it. Next, they must come prepared tocommunicate with other users and interest groups. This means to listen and try
76
to understand others' needs and desires. There also must be a recognitionthat compromise likely will be necessary and that special interest groups maygain more than they lose through compromises that can result in better plans.Each member of the team also must be prepared to facilitate the planningprocess as much as possible and still meet the goals and objectives of thegroup.
Most of all, members of the planning group need to recognize their great-es, benefits will accrue if they approach the planning process with the attitudethat they should make the greatest contribution they can with their experienceand resource management capabilities. They should not have the attitude thattheir only reason for participating is to get the largest slice of the resourcepie.
COORDINATED RESOURCE MANAGEMENT IMPLEMENTATION
A Coordinated Resource Plan is of little use unless it is implemented. Theobjective of the entire planning process and all the related activities is toget the plan implemented and the resources under management. The time andmanner of implementing management often have much to do with success of theprogram.
Adequate economic resources, technology, and management must be availableto meet implementation needs. This may require additional public funds toaccomplish management activities on both public and private lands. Capitalinvestments in the resource base are often necessary if increased values aredesired and development is necessary. Increased costs also may be associatedwith the protection of aesthetics or environmental values.
No plan is ever complete or will always remain current. This means plansand management repeatedly must be reviewed and updated. The complete planningprocess need not be repeated but all concerned need to be kept aware of changesand to have an opportunity to contribute thoughts and desires.
77