beauty report 2015 - cosmetica italia · with the buying behaviours exhibited by consumers. ......
TRANSCRIPT

Beauty Report 2015


3
The year which sees Expo arrive in Milan also brings important news for Cosmetica Italia.
At the Universal Exhibition itself, on the occasion of the general assembly on 23 June 2015, the new editorial project developed by the association, which sees the unification of the two publications which chart the evolution of the industry - the Beauty Report and the Annual Report - was presented. The publication of the first of these, now in its sixth edition, represents a key cultural event; it was created to support the reputation of Italian cosmetics across institutions, the media and the public, through in-depth analyses of businesses and consumer behaviours and the study of the phenomena affecting the supply chain underpinning the sector, which has come to represent an example of excellence in Italian industry. The second publication, the forty-seventh in the series, is based on an extensive collection of data and annual statistics and presents a detailed analysis of these, explaining the dynamics that characterise the sector and offering insights not only with regard to international trade and investment, but also in relation to the composition of the territory and of the industry's distribution channels.In this way, an integrated project takes shape, pursuing the historical objective of explaining the progress of key issues relating to the cosmetics industry and how these are successfully incorporated into the economy of the country, especially in recent years marred by the structural decline of the entire economy.And it is over the course of these years that the Italian cosmetics industry has demonstrated its ability to position itself better than other sectors concerned with the sale of non-durable goods, with an emphasis on completion of a cycle, as described by Nadio Delai, the President of Ermeneia, who refers to the sector's resilience in times of crisis and its ability to increase its competitive strength across both domestic and international markets. This can be attributed in part to the behaviour of consumers, who consider cosmetics to be something that cannot be relinquished, but above all to domestic companies, who continue to dedicate constant investment to research and innovation, and have been able to consolidate their behaviour, absorbing the difficulties and sudden changes of the last five years.In the presence of these changes, which are particularly evident downstream of the cosmetics supply chain - just think of the countless new distribution companies - the Italian industry has been able to strengthen its "numbers", drawing on the inelastic nature of the industry, a characteristic which has come to define it: turnover has remained consistent for over ten years and is growing compared to other Made in Italy organisations; for 2015, total turnover for the sector is estimated at more than 9,400 million euro, taking into account the increase in exports by five percentage points to a value 3,500 million euro. These figures, as documented in the annual report prepared by the Statistics Dept. of Cosmetica Italia, explain the competitiveness of the Italian cosmetics industry, as well as highlighting the close link with new dynamics and purchase options for consumers, breathing life into a virtuous alliance that is simply not present in other sectors.
On the occasion of Expo 2015, Cosmetica Italia - thanks, in part, to this new editorial project - wanted to convey the universal and unifying role played by cosmetics in a diverse and multi-ethnic contemporary society, inspiring visitors to discover a healthy and highly innovative industry which is now focusing on social responsibility and environmental sustainability.
Fabio Rossello- President, Cosmetica Italia -The personal care association
“
“
Introduction
4
Sixth survey on the value of the cosmetics industry

5
Summary of observations
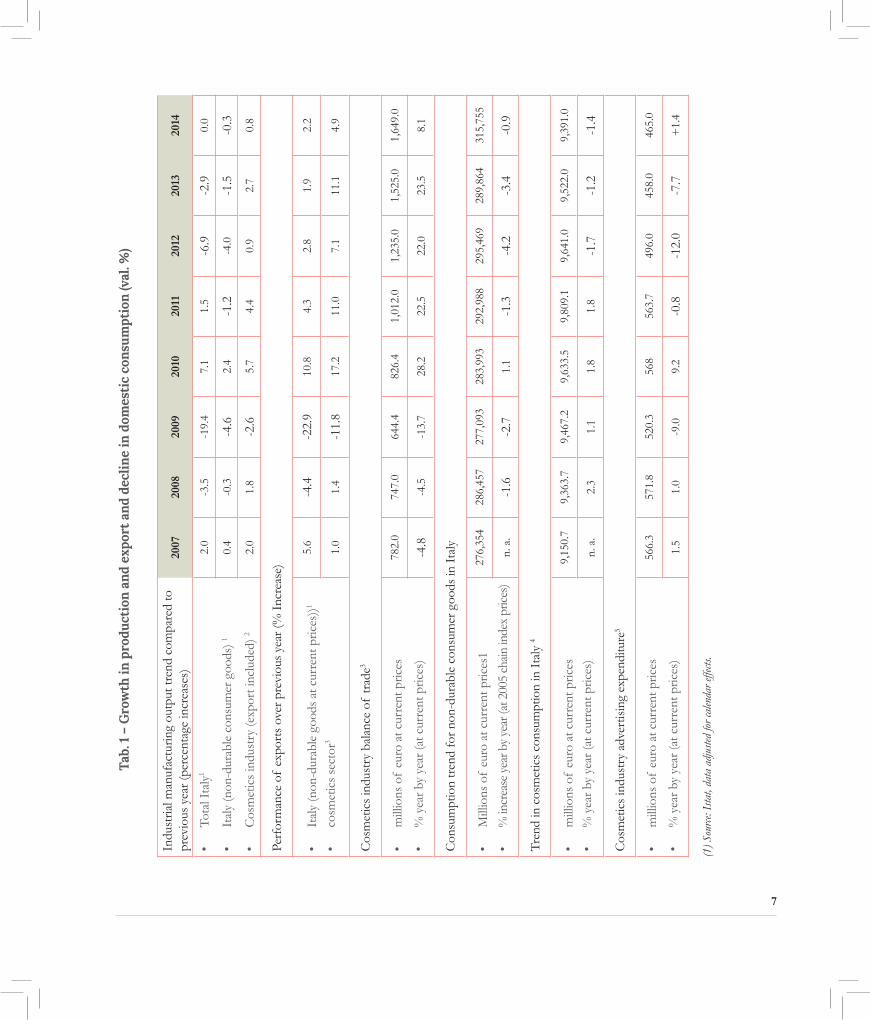
This overview of the Italian cosmetics industry, as analysed by the Beauty Report which has been published for the last six years, allows us to herald the completion of a cycle for the year 2015. Moreover, the sector has always tended to position itself better than others concerned with the sale of non-durable goods. The results in terms of sales none-theless vary widely according to the channels taken into consideration, owing to reactions to the economic crisis along with the buying behaviours exhibited by consumers.The overall performance for the year 2014 can be summed up as follows.First theory: The cosmetic industry has weathered the crisis better than others, thanks to a greater ability to maintain consumption levels and growth in the flow of exports.The primary dynamics, which relate to industrial production, exports and the trade balance, are fairly explicit in this regard (see Table 1).Industrial production in the cosmetics industry has succeeded in maintaining positive gains over the course of each of the years indicated, with the exception of 2009, during which the economic cycle was particularly damaging for all sectors. Moreover, the cycle alternated during this period for the entire economy, and was subject to constant stop and go fluctuations: indeed, industrial production of cosmetics fell in 2009 (-2.6%), only to pick up again in 2010 and 2011 (+ 5.7% and + 4.4% respectively), before slowing in 2012 (+ 0.9% ), rising again in 2013 (+ 2.7%) and then finally slowing down again in 2014 (+ 0.8%).Yet positive signs almost always prevailed, and furthermore, a comparison with overall industrial output trends in Italy for non-durable goods demonstrates a stable counter-trend profile for the cosmetics sector between 2011 and 2014, and a stronger positive dynamic in 2007, 2008 and 2010. And even during the worst of the years in question, 2009, the decrease in production was less notable in the cosmetics sector: -2.6%, compared to -4.6% for non-durable consumer goods in general, not to mention the overall total industrial manufacturing output, which dropped to -19.4% that year).And if we consider the developments seen with regard to exports, the cosmetic industry has demonstrated two key phenomena:• first and foremost, a gradual but significant growth in propensity for export seen in businesses: going from a
+1.0% increase in 2007 over 2006 (when it was still lower than the rate for non-durable goods: + 5.6%), to numbers that became increasingly pronounced: + 17.2% in 2010, + 11.0% in 2011, + 7.1% in 2012, + 11.1% in 2013 and +4.9% in 2014, highlighting expansive dynamics that are increasingly better than those seen for total non-durable goods;
• secondly, we have also seen a counter-trend, again in comparison to non-durable goods figures, which began in 2008 (with a 1.4% increase in cosmetics against a 4.4% decrease for other non-durable goods), which continued to maintain an increasingly favourable position in the years to follow: - 11.8% of exports in 2009 compared to - 22.9% for non-durable goods, +17.2% against 10.8% in 2010, + 11.0% against 4.3% in 2011, +7.1% against 2.8% in 2012, + 11.1% against 1.9% in 2013 and finally, + 4.9% against 2.2% in 2014.
The most immediate consequence of this increased propensity for export in the sector has been the formation of a trade balance which is in turn expanding, beginning after 2009 and continuing until 2014, with double-digit increases, year on year, until 2013 when it reached 23.5%, which was followed by a further rise of 8.1% in 2014.
6
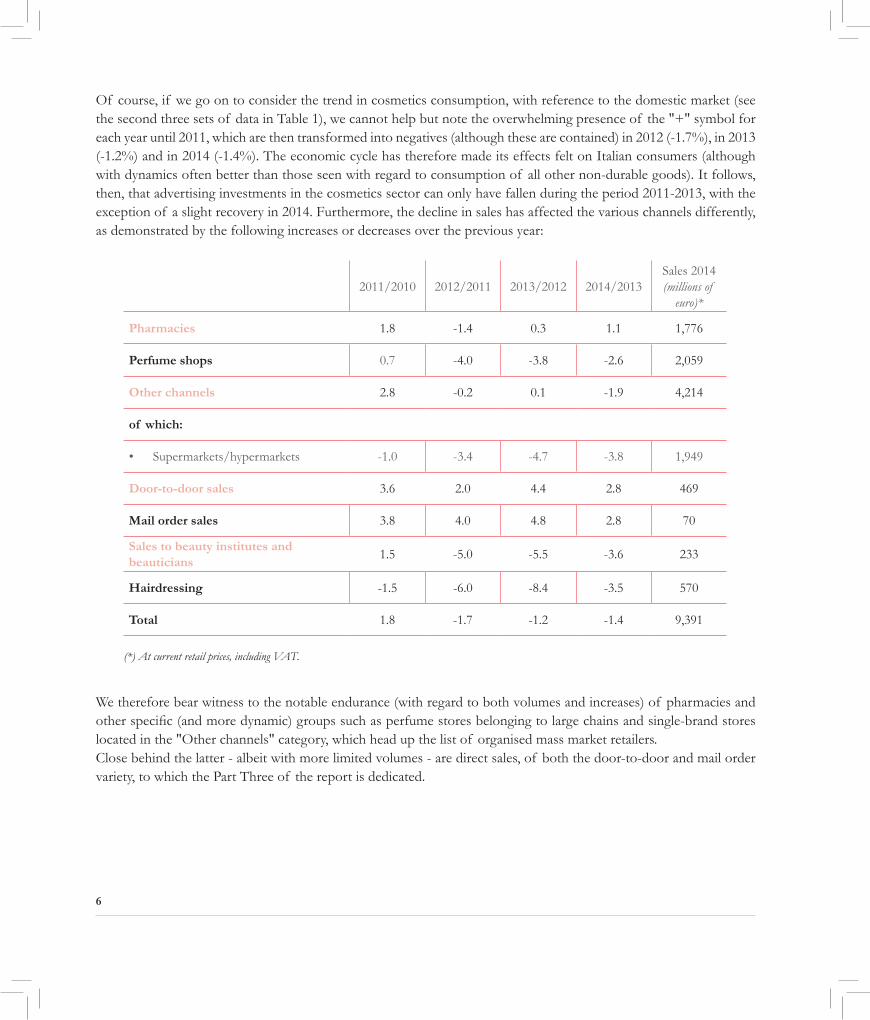
Of course, if we go on to consider the trend in cosmetics consumption, with reference to the domestic market (see the second three sets of data in Table 1), we cannot help but note the overwhelming presence of the "+" symbol for each year until 2011, which are then transformed into negatives (although these are contained) in 2012 (-1.7%), in 2013 (-1.2%) and in 2014 (-1.4%). The economic cycle has therefore made its effects felt on Italian consumers (although with dynamics often better than those seen with regard to consumption of all other non-durable goods). It follows, then, that advertising investments in the cosmetics sector can only have fallen during the period 2011-2013, with the exception of a slight recovery in 2014. Furthermore, the decline in sales has affected the various channels differently, as demonstrated by the following increases or decreases over the previous year:
We therefore bear witness to the notable endurance (with regard to both volumes and increases) of pharmacies and other specific (and more dynamic) groups such as perfume stores belonging to large chains and single-brand stores located in the "Other channels" category, which head up the list of organised mass market retailers.Close behind the latter - albeit with more limited volumes - are direct sales, of both the door-to-door and mail order variety, to which the Part Three of the report is dedicated.
2011/2010 2012/2011 2013/2012 2014/2013Sales 2014 (millions of
euro)*
Pharmacies 1.8 -1.4 0.3 1.1 1,776
Perfume shops 0.7 -4.0 -3.8 -2.6 2,059
Other channels 2.8 -0.2 0.1 -1.9 4,214
of which:
• Supermarkets/hypermarkets -1.0 -3.4 -4.7 -3.8 1,949
Door-to-door sales 3.6 2.0 4.4 2.8 469
Mail order sales 3.8 4.0 4.8 2.8 70
Sales to beauty institutes and beauticians
1.5 -5.0 -5.5 -3.6 233
Hairdressing -1.5 -6.0 -8.4 -3.5 570
Total 1.8 -1.7 -1.2 -1.4 9,391
(*) At current retail prices, including VAT.
7
Indu
stria
l man
ufac
turin
g ou
tput
tren
d co
mpa
red
to
prev
ious
yea
r (pe
rcen
tage
incr
ease
s)20
0720
0820
0920
1020
1120
1220
1320
14
• To
tal I
taly
1
• It
aly
(non
-dur
able
con
sum
er g
oods
) 1
• C
osm
etic
s in
dust
ry (e
xpor
t inc
lude
d) 2
2.0
-3.5
-19.
47.
11.
5-6
.9-2
.90.
0
0.4
-0.3
-4.6
2.4
-1.2
-4.0
-1.5
-0.3
2.0
1.8
-2.6
5.7
4.4
0.9
2.7
0.8
Perf
orm
ance
of
expo
rts
over
pre
viou
s ye
ar (%
Inc
reas
e)
• It
aly
(non
-dur
able
goo
ds a
t cur
rent
pric
es))1
• co
smet
ics
sect
or3
5.6
-4.4
-22.
910
.84.
32.
81.
92.
2
1.0
1.4
-11.
817
.211
.07.
111
.14.
9
Cos
met
ics
indu
stry
bal
ance
of
trad
e3
• m
illio
ns o
f eu
ro a
t cur
rent
pric
es
• %
yea
r by
year
(at c
urre
nt p
rices
)
782.
074
7.0
644.
482
6.4
1,01
2.0
1,23
5.0
1,52
5.0
1,64
9.0
-4.8
-4.5
-13.
728
.222
.522
.023
.58.
1
Con
sum
ptio
n tr
end
for n
on-d
urab
le c
onsu
mer
goo
ds in
Ita
ly
• M
illio
ns o
f eu
ro a
t cur
rent
pric
es1
• %
incr
ease
yea
r by
year
(at 2
005
chain
inde
x pr
ices)
276,
354
286,
457
277,
093
283,
993
292,
988
295,
469
289,
864
315,
755
n. a
.-1
.6-2
.71.
1-1
.3-4
.2-3
.4-0
.9
Tren
d in
cos
met
ics
cons
umpt
ion
in I
taly
4
• m
illio
ns o
f eu
ro a
t cur
rent
pric
es•
% y
ear b
y ye
ar (a
t cur
rent
pric
es)
9,15
0.7
9,36
3.7
9,46
7.2
9,63
3.5
9,80
9.1
9,64
1.0
9,52
2.0
9,39
1.0
n. a
.2.
31.
11.
81.
8-1
.7-1
.2-1
.4
Cos
met
ics
indu
stry
adv
ertis
ing
expe
nditu
re5
• m
illio
ns o
f eu
ro a
t cur
rent
pric
es
• %
yea
r by
year
(at c
urre
nt p
rices
)
566.
357
1.8
520.
356
856
3.7
496.
045
8.0
465.
0
1.5
1.0
-9.0
9.2
-0.8
-12.
0-7
.7+
1.4
(1) S
ourc
e: Is
tat,
data
adj
usted
for c
alen
dar e
ffects
.
Tab.
1 –
Gro
wth
in p
rodu
ctio
n an
d ex
port
and
dec
line
in d
omes
tic
cons
umpt
ion
(val
. %)
8
Second theory: The role of consumers highlights signs that the crisis has already been absorbed, beyond the structural data concerning this. The long-term economic cycle we are currently experiencing has led consumers to change their behaviours and attitudes over time, including with regard to the purchase of cosmetic products so that:• at first prudent attention with regard to spending and prices of cosmetic products prevailed, although a-cyclical
attitudes were substantially maintained, in light of the importance of these products to individuals (2010-2013); • subsequently, (faintly) positive reactions to spending began to emerge, strengthening the aforementioned a-cycli-
cal - if not anti-cyclical - nature of cosmetic purchasing, and confirming the desire to shake off the somewhat "Lenten" mood (2014);
• finally, it appears (2015) that we are witnessing the initial stages of a recovery in purchasing figures and a con-solidation of behaviours and attitudes, symptomatic of the completion of the previous cycle as a result of the maturation of attitudes and choices with regard to spending in the field of cosmetic products (with a truly active absorption of the crisis).
If we look at the above-mentioned signs, referring to the data in Table 2, we can see a slight push towards growth in spending in 2014 compared to 2013: 12.4% of consumers say that they have spent "a lot and/or a little more" than in the previous year, but if we also take into account the statements of those who claim to have spent similarly significant amounts, the percentage increases from 25.6% in 2013 to 27.5% in 2014. And added to this is the fact that spending forecasts for the current year (i.e. considerations made in the spring of each year, when normally an analysis is carried out on an appropriate national sample) suggest that, as in the last two years, the call to resume buying has been heard: indeed, the percentage of those who think they are spending "a lot and/or a little more" in the current year compared to the previous has increased from 9.3% in 2013 to 11.2% in 2015.But above all, three specific, complementary behaviours are being incorporated and are beginning to be exhibited, contributing to the re-imagining of the consumer purchasing space, which is becoming three-dimensional, given that we are headed for the simultaneous consolidation of:• multiple channels - just under 50% - in both 2014 and 2015 - of consumers state that "he crisis has driven me to
purchase cosmetic products from very different channels, according to the best price/quality ratio";• multiple products - around 40% of consumers, again in both 2014 and 2015, state that they have "bought more
commercial brand cosmetics, because they cost less and are good quality";• multiple services - again in 2014 and 2015 alike, almost 50% state that "When I buy cosmetic products, I particu-
larly appreciate the welcome I receive from staff and the guidance they give me, inviting me to test the products and thus helping me to make the best choices for me".
All this chimes with attitudes that can in turn be defined by a certain sense of "completion", the result of many years spent by consumers balancing needs and resources during the crisis, in order to identify the most satisfactory solution for them with regard to price, quality, channel and service. Indeed:a) a fundamental a-cyclical attitude seems to have established itself: 46% of consumers in the past two years maintain that "the crisis has not substantially changed their spending habits, due to the fact that taking care of themselves, looking after their well-being and their looks, is something that cannot and should not be sacrificed." Meanwhile, the anti-cyclical thrust which has emerged at times over the course of the crisis precisely as a reaction to the latter appears to be on the wane: 17.9% of consumers in 2015 compared to 28.8% in 2014 state that "Despite the crisis, I have per-haps bought even more, because I know that it's crucial not to let myself go, even during the most difficult periods";b) in parallel, an attitude that could perhaps best be defined as "quality sobriety", and that is identified by more than 60% of consumers, has also emerged ("These days, I take a more moderate approach to cosmetic products, trying to focus on my true needs and meet these at a price that I consider fair"). Furthermore, a similar proportion said that "af-

9
ter these years of prolonged financial crisis, I am better at reacting to situations and at taking care of myself through the purchase of the cosmetic products that I need; I know how to balance costs and quality";c) this also perhaps represents the end result of the constant process of weighing up options which went on during the crisis, and which is now well-established - so far so, that 66.2% of respondents state that "today, I feel I have found the right balance between the type of cosmetics that I need and the type of channels that I use to shop".The consumer has therefore "learned" a lot from the financial crisis with regard to both tendencies and spending behaviour in the field of cosmetic products. And companies have in turn been forced to interact with more evolved customers, customers who are used to weighing their decisions, and who now move in a three dimensional space - multi-channel, multi-product and multi-service - in search, where possible, of a sacrosanct shopping experience, and not one which is light (i.e. in perfume shops or single-brand stores, where far less attention is paid to creating a holistic shopping environment for the customer).Third theory: Cosmetics companies are demonstrating a consolidation of behaviour as well as of business "thinking", confirming that the difficulties have been substantially absorbed and that a series of changes have taken place. There are many indicators of this phe-nomenon, and these are primarily concerned with the performance of the "fundamentals" (Table 3): these indicators reflect the alternating phenomenon of a "stop and go" cycle, but which, for cosmetic companies, generally present a derivative which is by and large positive with regard to orders and turnover. And indeed, these are growing every year, according to more than 50% of respondents in 2009, which in 2010 increased to around 70% before descending again in 2011-2012, only to rise once more in 2013 and 2014. The situation with regard to exports is somewhat different: this area has been subject to accelerated growth every year from 2009 to 2012, with continued but less pronounced rises in the years 2013 and 2014: thus confirming the consolidation phase of the position referred to in theory 1. Secondly, there are several particularly important processes that we must mention if we wish to understand the phenomenon of (positive) absorption of the crisis, such as (see second group of data in Table 3):• the decisive choice of a strategy of progressive internationalisation, followed by signs of stabilisation (however, in
2015, 76.2% of companies on the panel still maintain that they plan to increase efforts in this regard);• the results in terms of total exports from the sector, given that the proportion of turnover from the former has
risen steadily from 25% in 2009 (the first year the crisis made its first serious impact) to 35.6% in 2014;• the continuous drive towards investment, as confirmed by business owners: 67.1% in 2011, 79.0% in 2014 and 86% in 2015
reported a "strong + moderate growth" trend in investments, or continuity in these, at substantial rates;• the stability and/or growth of employment, a key resource for the sector, which is structurally oriented towards
innovation and research.Thirdly, we must not ignore the qualitative assessments provided by business owners, which give an idea of the ways in which the strategic and management culture are evolving. Indeed, they point out that (see last group of data in Table 3):• companies who stay on top are those who know how to rethink their business model (84.6% in agreement);• there is a need to develop services for customers, and not just products (a massive 95.4% of those interviewed agreed
with this);• ultimately, a multi-channel perspective must be adopted to respond to multi-channel, multi-product and mul-
ti-service consumer behaviours (80.0% in agreement). In short, we are faced with a path of "active" reactions with regard to the economic cycle, which seems to be reaching completion and consolidation - we must create a network of strong, select companies which are ready to grow further

10
Phenomena Data
A (slight) upward trend in spending 2012/2011 2013/2012 2014/2013
• They spent a lot and/or a little more than in the previous year1
• They spent a lot and/or a little more than in the previous year + spending was similar to the previous year, a significant amount1
• They think they will spend a lot and/or a little more in the current year
17.7 -3.5 -19.4
35.4 -0.3 -4.6
2012 2013 2015
2.0 1.8 -2.6
A consolidation of behaviours 2012 2013 2015
• A consolidation of multi-channel sales: "The crisis has driven me to purchase cosmet-ic products from very different channels, according to the best price/quality ratio"
• A consolidation of multi-product sales: “I have bought more commercial brand cosmetics - products that are made and sold by large retailers - because they cost less and are good quality”
• A consolidation of the multi-service approach: "When I buy cosmetic products, I particularly appreciate the welcome I receive from staff and the guidance they give me, inviting me to test the products and thus helping me to make the best choices for me"
30.5 47.2 47.6
41.5 38.5
49.7 47.3
A consolidation of attitudes with a focus on a-cyclicality and the completion of the cycle 2010 2013 2014 2015
• “The recession has not substantially changed my spending habits - I cannot and should not sacrifice taking care of myself, my well-being and my looks"
• “Despite the crisis, I have perhaps bought even more, because I know that it's crucial not to let myself go, even during the most difficult periods”
51.0 40.0 46.8 45.9
22.9 19.2 28.8 17.9
A consolidation of attitudes in terms of completion of the cycle 2010 2013 2014 2015
• "These days, I take a more sober approach to cosmetic products, trying to focus on my true needs and meet these at a price that I consider fair”
• “After these years of prolonged financial crisis, I am better at reacting to situa-tions and at taking care of myself through the purchase of the cosmetic products that I need; I know how to balance costs and quality”
• "Today, I feel I have found the right balance between the type of cosmetics that I need and the type of channels that I use to shop"
62.3
61.0
66.2
(1) Source: Istat, data adjusted for calendar effects.
Tab. 2 - Signs of "completed" absorption of the crisis

11
Phenomena Data
The growing dynamic (alternating) of the "fundamentals”1 Orders Turnover Exports
• 2009/2008
• 2010/2009
• 2011/2010
• 2012/2011
• 2013/2011
• 2014/2013
55.9 56.9 51.9
70.1 68.4 60.5
61.4 59.2 63.0
44.5 52.2 83.3
51.8 56.8 75.5
72.8 74.2 50.0
The responsiveness of companies through their processesThe growing commitment to internationalisation:
2011 2012 2013 2014 2015
• Will grow very decisively
• Will grow slowly but significantly
• Will remain at the current level
14.8 26.1 27.3 23.5 25.4
62.9 56.6 54.5 51.8 50.8
13.0 7.2 9.1 7.4 13.6
• The commitment to the continued growth of investments: 2011 2012 2013 2014 2015Forecasts
• Strong trend + Moderate growth + Steady but consistent 67.1 67.1 67.1 79.0 86.5
• A solid commitment to employment
• Employment increasing significantly + slight
• Employment essentially stable
38.0 38.1 34.5 38.8 54.6
47.9 38.1 49.5 47.8 40.9
2009 2011 2013 2014
• The objective increase of exports within the overall industry turnover 25.3 29.8 34.2 35.6
Tab. 3 - A (positive) phase of accomplishment for businesses too
(1) Fundamentals: order, sales and export trends

12
(below) Tab. 3 - A (positive) phase of accomplishment for businesses too
(1) Fundamentals: order, sales and export trends
The active absorption of the crisis into business "thinking" (Judged "Strongly + Partly agree"): 2013 2015
• "Different sectors of the production chain have experienced the recession differently"
• "The companies that succeed are those who know how to adapt their business model"
• "Companies must drive product innovation to grow, as well as providing more services to their customers"
• "Overall the market is becoming more complex; we must take into account that the consumer has become more skilled in mixing their purchases of different products and using different channels, in addition to which, we must remember than consumers from different regions have different buying habits"
• "Providing a multi-channel offering must become the natural response to the multi-channel shopping behav-iours exhibited by consumers"
87.6 83.3
81.5 84.6
93.8 95.4
80.0
81.6

13
47th analysis of sector and of cosmetics consumption in Italy

Scenarios in the cosmetics industry14
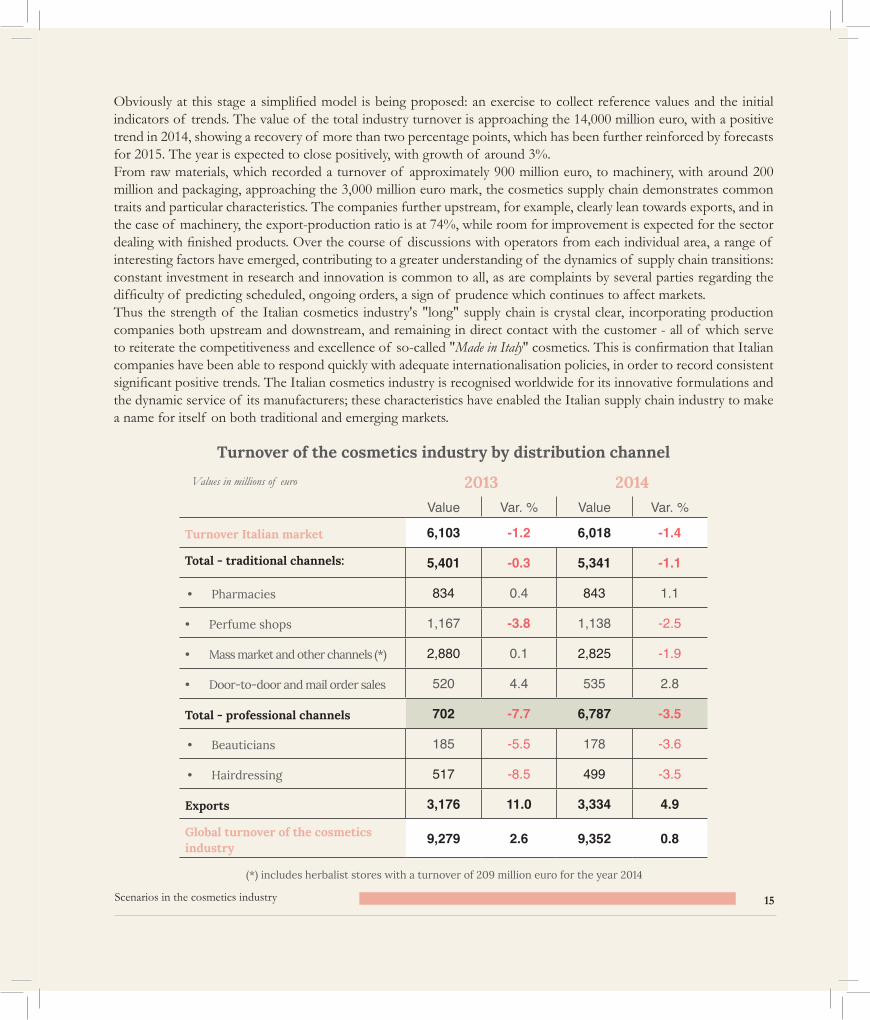
Scenarios in the cosmetics industryWith a value of 9,352 million euro, the turnover, i.e. the production value of the Italian cosmetic industry, recorded a 0.8% increase in 2014 over the previous year, an exceptional case within the wider picture of the national manufacturing sector, despite the uncertainties of the domestic market. The end of the long period of crisis can only bring benefits to the competitiveness which has come to characterise the growing cosmetics supply chain in the country. 2015 will be an important year, revealing not only whether the downturn is over, but above all confirming the major changes currently taking place within the various channels.Domestic demand has generated a negative impact on production volumes, with a reduction of 1.4% and a value of 6,018 million euro. Conditioning of consumer purchasing behaviours has hit the domestic market, which in the cosmetics sector, is expressed as a negative value, although not significantly so. However, while consumers are paying more attention to purchases than they once did, they have not renounced cosmetics and personal care altogether.A breakdown of sales on the domestic market shows positive trends in direct door-to-door and mail order sales, which together grew by 2.8%, as well as in herbalist store sales, which although incorporated within the category of large retailers, saw a rise of more than two percentage points. Also on the increase were pharmacy sell-ins (+ 1.1%), while the perfume shop channel underwent a structural decline (-2.5%). An analysis of the domestic market as a lever on turnover confirms that among the sales channels, professional chan-nels have taken a negative turn and are down 3.5%, with a sell-in value of 678 million euro. Indeed, in 2014, although at a slower pace, this slowdown in visits to beauty and hairdressing salons has continued, and indeed this is the cate-gory that has suffered most from the economic crisis which erupted in autumn 2008. Conditioned by a general economic situation which is still largely negative, the domestic consumption of cosmetics has therefore supported the turnovers of national companies, while in 2014, the strong performance of exports led to a significant improvement in profitability. Indeed, sales abroad increased by 4.9%, accounting for 3,334 million euro. Whilst rates were somewhat slower, the trend regarding imports was also positive, growing by 2%, confirming the reshaping of domestic demand towards products offering the best price/quality ratio. As a result of these trends, the trade balance remains largely positive, recording a record value of nearly 1,650 million euro. The analysis of turnover percentages offers interesting new perspectives: mass market retailers still recorded a slight decrease, from 31% to 30.3% of the market, but this blow was softened by the incorporation of herbalist stores, which saw increase of two percent. However, export figures continue to rise, accounting for 35.6% of turnover, while and door-to-door and mail order sales (5.7%) were also on the up, with pharmacy sales stable (9%). Perfume shops, with a share of more than 12.2%, remain an industry mainstay, although this hold is wavering. Although the economic situation in general remains tense, sales trends reflect the health and competitiveness of the industrial cosmetic system and the effectiveness of the strategy which sees ongoing efforts in the field of research and innovation, as well as confirming that industrial investment in this sector remains above average. With regard to this, it is perhaps useful to recall that on the occasion of Cosmoprof Bologna 2015, the Statistics Dept. launched an analysis which has been extended to cover the cosmetics industry, with a view to proposing, with the neces-sary adjustments, a supply chain system which offers a dynamic and rational overview of the phenomena which affect the chain at various levels, upstream to downstream. From cosmetic ingredients, to machines for production and packaging, to the finished product, there is a focus on gaining an overview of the “long” supply chain of Italian cosmetics.
Scenarios in the cosmetics industry 15
Obviously at this stage a simplified model is being proposed: an exercise to collect reference values and the initial indicators of trends. The value of the total industry turnover is approaching the 14,000 million euro, with a positive trend in 2014, showing a recovery of more than two percentage points, which has been further reinforced by forecasts for 2015. The year is expected to close positively, with growth of around 3%. From raw materials, which recorded a turnover of approximately 900 million euro, to machinery, with around 200 million and packaging, approaching the 3,000 million euro mark, the cosmetics supply chain demonstrates common traits and particular characteristics. The companies further upstream, for example, clearly lean towards exports, and in the case of machinery, the export-production ratio is at 74%, while room for improvement is expected for the sector dealing with finished products. Over the course of discussions with operators from each individual area, a range of interesting factors have emerged, contributing to a greater understanding of the dynamics of supply chain transitions: constant investment in research and innovation is common to all, as are complaints by several parties regarding the difficulty of predicting scheduled, ongoing orders, a sign of prudence which continues to affect markets.Thus the strength of the Italian cosmetics industry's "long" supply chain is crystal clear, incorporating production companies both upstream and downstream, and remaining in direct contact with the customer - all of which serve to reiterate the competitiveness and excellence of so-called "Made in Italy" cosmetics. This is confirmation that Italian companies have been able to respond quickly with adequate internationalisation policies, in order to record consistent significant positive trends. The Italian cosmetics industry is recognised worldwide for its innovative formulations and the dynamic service of its manufacturers; these characteristics have enabled the Italian supply chain industry to make a name for itself on both traditional and emerging markets.
Turnover of the cosmetics industry by distribution channel
2013 2014Value Var. % Value Var. %
Turnover Italian market 6,103 -1.2 6,018 -1.4
Total - traditional channels: 5,401 -0.3 5,341 -1.1
• Pharmacies 834 0.4 843 1.1
• Perfume shops 1,167 -3.8 1,138 -2.5
• Mass market and other channels (*) 2,880 0.1 2,825 -1.9
• Door-to-door and mail order sales 520 4.4 535 2.8
Total - professional channels 702 -7.7 6,787 -3.5
• Beauticians 185 -5.5 178 -3.6
• Hairdressing 517 -8.5 499 -3.5
Exports 3,176 11.0 3,334 4.9
Global turnover of the cosmetics industry
9,279 2.6 9,352 0.8
(*) includes herbalist stores with a turnover of 209 million euro for the year 2014
Values in millions of euro

Scenarios in the cosmetics industry16
Breakdown of sales for each destination channel
Pharmacies 9.0%Perfume shops 12.2%Mass market and other channels 30.3%Beauticians 1.9%Hairdressing 5.3%Door-to-door and mail order sales 5.7%Export 35.6%
7.2%
Professional
channels
5.7%
Direct
sales
Structure of the cosmetic supply chain
Industry Rawmaterials Machinery Packaging
Turnover 2013 9,281 850 185 2,930
(Var. % '13/'12) +2,7 -1.4 -10.0 +2.1
Turnover 2014 9,355 870 190 2,990
(Var. % '14/'13) +0.8 +2.5 +2.0 +2.1
Forecast % '15/'14 +2.3 +2.0 +5.0 +5.0
Export 2014 3,335 305 140 1,500
(var. % '14/'13) +4.9 +3.0 +1.0 +3.0
2014 exports/turnover 36% 35% 74% 49%
Values in millions of euro
51.5%
Traditional channels
35.6%
Exports
Geographical distribution of companies in 2014
9+12+30+2+5+6+36

Scenarios in the cosmetics industry 17
The Italian territoryThe north of Italy sees the largest concentration of cosmetic companies, with a weight of more than 82% on the geographical framework; only a year ago, this figure was 80%. Lombardy is the region with the highest density of cosmetic companies, with more than 51%, followed by Emilia Romagna, which comes in at close to 10%, Piedmont with 7.6% and the Veneto region with 8.3%.In Basilicata, Sardinia, Molise and the Aosta Valley, no industrial sites are registered, while Liguria has recorded a slight decrease in the number of cosmetic companies in the region in comparison with previous ISTAT findings, with 2.3%.In line with the findings outlined in previous reports, perfume shops are the retail channel which is gaining most ground, with 5,500 sales points in Italy, playing an important role within the cosmetics sector with regard to distribu-tion. In addition, it is this traditional channel that has been worst hit by the economic crisis: it is therefore important to understand how the structure across Italy can be changed. According to data provided by Fenapro - The National Federation of Perfumers - the top three areas with regard to concentration of Italian perfume shops are Lombardy (17.0%), Lazio (11.5%) and Campania (9.5%). In terms of Nielsen areas, the data also confirms the close proximity of area 1 (29.0% of the total) and area 4 (27.0% of the total).With regard to distribution of Italian perfume chains, there has been a change in the regions occupying first and sec-ond place, with Lombardy in first place with 18.6% of the total sales points, while Lazio loses out to Emilia Romagna, with 11.7%. Lazio takes third place, with 11.5% of the total. A study of the Nielsen areas confirms that 31.7% of Italian sales outlets are found in area 1, the North-West, followed by area 3, the centre, with just over 30%, area 2, the North-East, with 25% and finally, area 4, the South, with around 17%. The trend for southern Italy is continues, with this region still rooted in a less evolved distributive layout, confirming the discrepancy between the market penetration of "traditional" perfume shops and those belonging to organised chains.
Abruzzo 0.6%
Calabria 0.2%
Campania 1.7%
Emilia Romagna 9.8%
Friuli Venezia Giulia 1.5%
Lazio 6.2%
Liguria 2.3%
Lombardy 51.2%
Lombardy 1
Emilia Romagna 2
Veneto 3
Marche 1.3%
Piedmont 7.6%
Puglia 0.8%
Sicily 0.4%
Tuscany 5.3%
Trentino Alto Adige 1.5%
Umbria 1.3%
Veneto 8.3%
Geographical distribution of companies in 2014 Top 3Percentage breakdown
9+12+30+2+5+6+36

Scenarios in the cosmetics industry18
Emilia Romagna 9.0%
Friuli Venezia Giulia
3.0%
Trentino Alto Adige
1.5%
Veneto 8.0% 3+17+9+1+12+3+1+10+10+2+4+9+2+2+1+1+5+1+4+3+A3+17+9+1+12+3+1+10+10+2+4+9+2+2+1+1+5+1+4+3+A
Liguria 5.0%
Lombardy 17.0%
Piedmont 6.9%
Aosta Valley 0.1%
Liguria 3.0%
Lombardy 18.6%
Piedmont 9.0%
Aosta Valley 0.2%
Lazio 11.5%
Marche 2.3%
Sardinia 1.8%
Tuscany 5.6%
Umbria 1.3%
Lazio 11.5%
Marche 1.7%
Sardinia 3.6%
Tuscany 8.7%
Umbria 2.1%
Abruzzo 1.7%
Basilicata 1.0%
Calabria 2.0%
Campania 9.5%
Molise 0.3%
Puglia 5.0%
Sicily 7.5%
Abruzzo 1.9%
Basilicata 0.6%
Calabria 0.8%
Campania 4.9%
Molise 0.3%
Puglia 4.1%
Sicily 3.2%
Emilia Romagna 11.7%
Friuli Venezia Giulia
2.8%
Trentino Alto Adige
1.2%
Veneto 10.1%
Distribution of Italian perfume chain storesSource: Beauty and Business data (2014) processed by Cosmetica Italia, divided down into Nielsen areas
Distribution of Italian perfume shopsSource: FENAPRO data processed by Cosmetica Italia, divided down into Nielsen areas
29.
0% A
rea 1
27.0% Area 4 22.5%
Area 3 21.5% Area 2
3
9.9%
A
rea 1 15.8% Area 4 27.7% Area 3 25.7% Area 2

Scenarios in the cosmetics industry 19
Distribution channelsTo date, sales of cosmetics in Italy since 2008 - the year in which the international crisis began - have registered contrac-tions which could be considered to be marginal. The consumption of cosmetics in Italy has long been considered an 'essential', and as such, while the negative economic situation of recent years has certainly had an effect on purchases in terms of volume, it has not affected quantities: in 2014, consumption was valued at nearly 9,400 million euro, with a decline of just over one percentage point, which serves to confirm the stable nature of the cosmetics market which has been evident for some time. The tendency to rationalise consumer choices also continues; for some time, shoppers have been moving towards more economical channels and price ranges, without giving up premium products, leading to a weakening in the mid-price range and creating the so-called "hourglass effect", which provides an effective picture of the consumption polarisation process. If we look at the volumes in terms of quantity, this consumption remains unchanged, while the decline linked to the reduced use of the professional channel is confirmed. In 2014, marginal and differentiated contraction across all traditional channels continues, with the exception of phar-macies and direct sales channels. We must also remember that, although calculated as part of the mass market and single-brand aggregate, consumption in the herbalist channel has grown by nearly 2.4 percentage points, followed by door-to-door and mail order sales which are up 2.8%, the best performance ever seen in this category. For perfume shops, the decline continues (-2.6%), as rates of consumption drop, and the involution and the down-sizing of the channel continue, along with the transformation selective distribution methods. The widening gap is a phenomenon in constant evolution: on the one hand this bears witness to the reduction in numbers and weight of consumption in traditional perfume shops, while on the other, we can observe the rationalisation of specialised chains, which are becoming more attentive to customer service and new requirements. In 2014, the absolute value of professional channels saw a reduction: consumption in hairdressing and beauty salons also dropped by 3.5% and 3.6% respectively. The price trend in 2014 appears to broaden, with perfume shops signalling the most pronounced change of all the traditional channels, up 2%, while others demonstrate are holding firm, with the exception of super and hypermarkets, which have been subject to an (albeit marginal) decline of one percentage point. In professional channels, the increase in margins did not appear to have produced any real effect, given the slight drop in quantities.

Scenarios in the cosmetics industry20
Breakdown of consumption by distribution channel in 2014
Total cosmetic products market in 2014
Sector total 9,391
Pharmacies 1,776
Perfume shops 2,059
Mass market and other channels 4,214
• of which herbalist stores 419
Door-to-door sales 469
Mail order sales 70
Sales to beauty institutes and beauticians 233
Hairdressing 570
Pharmacies 18.9%Perfume shops 21.9%Mass market and other channels 44.9%Door-to-door sales 5.0%Mail order sales 0.7%Sales to beauty institutes and beauticians 2.5%Hairdressing 6.01%
Mass market retail and other channels
-1.4
1.1-2.6
-1.9
2.4
2.8
2.8
-3.6
-3.5
Retail prices VAT included, consumption in millions of euro - Var% 2014/2013
46.0%
Supermarkets/
hypermarkets
9.9%
Herbalist
stores 7.6%
36.5%
7.6%
Single-
brand
stores7.6%
36.5%
36.5%
other 7.6%
36.5%
Direct and professional channels Retail Total
18+23+45+5+1+2+6

Scenarios in the cosmetics industry 21
Trends in distribution channels
Developments in consumption of cosmetics 2007-2014
9,151 9,364 9,467 9,633 9,809 9,631 9,522 9,391
7,701
1,450
7,926
1,438
8,071
1,396
8,197
1,436
8,362
1,447
8,228
1,403
8,165
1,357
8,165
1,357
Channel Consumption Quantity Prices
Pharmacies 1.1 1.3 -0.2
Perfume shops -2.6 -6.1 2.0
Mass market and other channels -1.9 -1.2 -0.2
of which supermarkets and hypermarkets -4.3 -2.1 -1.0
Total - traditional channels -1.4 -1.0 0.1
Door-to-door sales 2.8 2.5 1.0
Mail order sales 2.8 2.5 1.0
Sales to beauty institutes and beauticians -3.6 -2.0 1.5
Hairdressing -3.5 -2.0 1.0
General total -1.4 -1.1 0.8
2007 2014
Retail prices VAT included, consumption in millions of euro
Direct and professional channels Retail Total
18+23+45+5+1+2+6

Scenarios in the cosmetics industry22
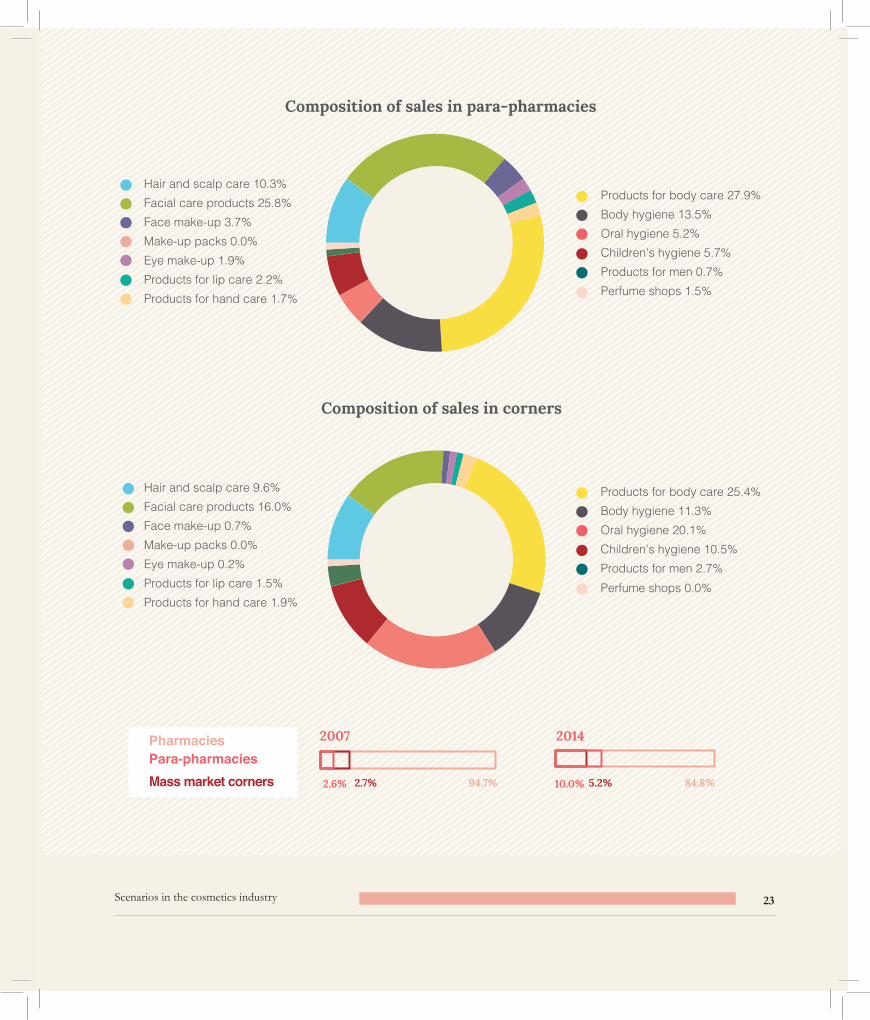
PharmaciesAt the end of 2014, the cosmetics sold with the pharmacy channel reached a value of 1,776 million euro, with an in-crease of one percentage point, reaffirming the confidence that consumers have in this category, with regard to level of expertise and focus on additional services and, in recent times, a wave of modernisation of stores. The pharmacy channel has been affected by the phenomenon of polarisation of consumption: indeed, consumers have only partly moved towards other channels, but are increasingly focused on products which offer the best price-quality ratio with-out necessitating excessive sacrifices, thanks to the fact that cosmetics in pharmacies have acquired an increasingly important role, often as the commercial element used to offset the drop in demand. In addition to this, more than in other channels, pharmacies operate policies which promote customer service and reward consumer loyalty. In comparison to other retail channels, pharmacies have continued to invest more in cosmetic products and specialist training of sales personnel, but there are still notable opportunities for extending the clientèle, especially in the over-50 age band. Recent surveys confirm some distinctive characteristics with regard to the consumption of cosmetics in pharmacies: direct, pragmatic motives push the consumer towards the pharmacy rather than, for example the perfume shop, even though in drawing attention to the future sales environment we see a crossover between the purely pharmaceutical area and more attractive areas dedicated to beauty products.Data also includes figures for cosmetics sold in para-pharmacies: this is a phenomenon that in recent years has been most characteristic of the distribution of cosmetics in this channel, jumping from 2.6% in 2007 to 10% in 2014 with reference to total consumption within this category, despite the recent measures concerning economic policy. Pharma-ceutical "corners" represent a sub-group of the mass market which are also beginning establish some ground, rising from 2.7% in 2007 to 5.2%.
As always, the composition of sales, detailed for corners and para-pharmacies in IMS data, helps to provide further information on some key features: in para-pharmacies, sales of products for face and body care represent nearly 55% of sales, while in corners, the sales composition is more evenly distributed.
Scenarios in the cosmetics industry 23
PharmaciesPara-pharmaciesMass market corners
10+26+4+0+2+2+2+28+13+5+6+1+1
10+16+1+0+1+1+2+24+11+20+10+3+1
Hair and scalp care 10.3% Facial care products 25.8% Face make-up 3.7% Make-up packs 0.0% Eye make-up 1.9% Products for lip care 2.2% Products for hand care 1.7%
Hair and scalp care 9.6% Facial care products 16.0% Face make-up 0.7% Make-up packs 0.0% Eye make-up 0.2% Products for lip care 1.5% Products for hand care 1.9%
Products for body care 27.9% Body hygiene 13.5% Oral hygiene 5.2% Children's hygiene 5.7% Products for men 0.7% Perfume shops 1.5%
Products for body care 25.4% Body hygiene 11.3% Oral hygiene 20.1% Children's hygiene 10.5% Products for men 2.7% Perfume shops 0.0%
Composition of sales in para-pharmacies
Composition of sales in corners
2007
94.7% 84.8%2.6% 10.0%2.7% 5.2%
2014

Scenarios in the cosmetics industry24
Perfume shops
Mass market and other channels
In perfume shops, for a number of years consumption has been affected by economic involution and the downsizing of the channel, as well as the transformation of selective distribution methods: indeed, in 2014 too, the deep-rooted tensions in some types of retail outlet have conditioned consumption, which has fallen by 2.6%, with a sales value of 2,059 million euro. Perfume shops, with a share of 21.9% of the total market (it was 22.2% in 2013), represent the second biggest sales channel after supermarkets. In terms of decline, this category has been hit hardest, along with the professional channels and large retailers, a sign of ongoing transformation that cannot be relegated to a micro-eco-nomic explanations, but which is instead part of a more profound and dynamic evolution of buying habits, given that the view that cosmetics are an essential product rather than a luxury has now been confirmed. As in previous years, price increases have essentially supported volumes, with repercussions with regard to the average purchase value and inevitably, on consumer numbers. Increasingly, the contrast is broadening between the static nature of many tradition-al perfume/neighbourhood shops and the dynamics of success seen not only in organised chains (and regional chains in general) but also in small distribution companies that have successfully invested in the concept of exclusivity which has traditionally characterised the perfume shops. Inevitably, consumers, who have been tested by an economic situ-ation that does not encourage or facilitate consumption, and who are alert to new distribution offering (single-brand stores in the first instance) are spread across various distribution levels.
The concept of selectivity, which for many companies is a mission, in many cases is not being embraced by consum-ers, who are more tuned into the desire, albeit moderate, for their purchase to be accompanied by a broader general experience, defined as "shopping experience". As such, it is becoming increasingly necessary to develop innovative strategies to enhance the selectivity of the channel and perhaps to encourage partnerships within the industry in order to accommodate new consumer tastes. New launches, the reduction of stocks and dynamic approaches to price list are not enough to sustain consumption levels in the channels that are in decline, especially in light of the crisis affecting many independent retailers, who have been weakened by new forms of distribution which are much more aggressive and current, such as the afore-mentioned single-brand stores. We need to understand how long the major promotional initiatives and discounts that characterise the commercial actions in this channel - often at the expense of its selective nature - can continue.
In 2014, the value of cosmetics sold on the mass market was a little more than 4,200 million euro, including herbalist and single-brand stores, confirming its status as the most important sales channel for cosmetics, with a percentage of 44.3% of the total. For some time, the statistics have evidenced the significant gap that exists between sales of cos-metics in traditional supermarkets and hypermarkets, which have fallen by nearly five percentage points, and those in specialised spaces, the so-called "house and toilet" sales outlets (or the "modern channel "), which recorded increases of over 4%. Significantly weight is also held by the phenomenon of single-brand distribution in these considerations - with just over 320 million euro, the channel recorded a growth of nearly 8% at the end of 2014. The mass market in general, even with dynamic entities which remain unbalanced and at a time which remains difficult with regard to the current economic situation and to price levels, can still satisfy broad groups of consumers who recognise the channel’s ability to offer products with a high quality/price ratio.
Scenarios in the cosmetics industry 25
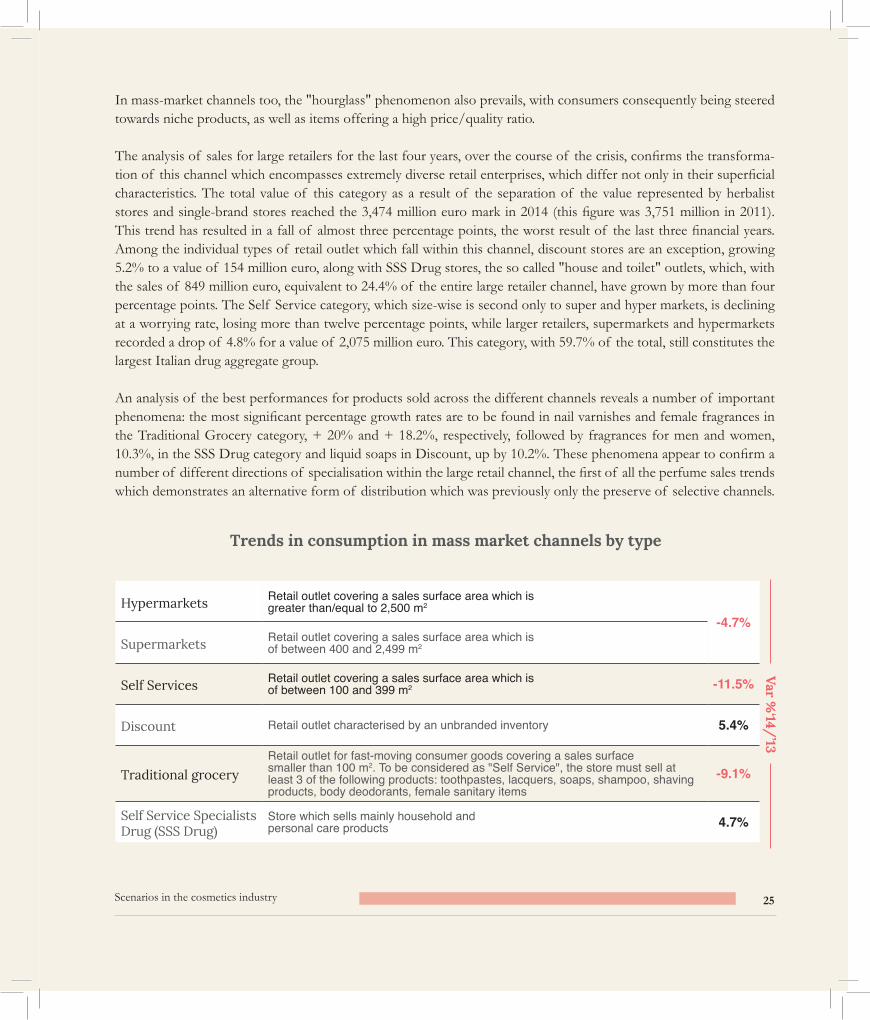
Trends in consumption in mass market channels by type
Hypermarkets Retail outlet covering a sales surface area which is greater than/equal to 2,500 m2
-4.7%Supermarkets Retail outlet covering a sales surface area which is
of between 400 and 2,499 m2
Self Services Retail outlet covering a sales surface area which is of between 100 and 399 m2 -11.5%
Discount Retail outlet characterised by an unbranded inventory 5.4%
Traditional groceryRetail outlet for fast-moving consumer goods covering a sales surface smaller than 100 m2. To be considered as "Self Service", the store must sell at least 3 of the following products: toothpastes, lacquers, soaps, shampoo, shaving products, body deodorants, female sanitary items
-9.1%
Self Service Specialists Drug (SSS Drug)
Store which sells mainly household and personal care products 4.7%
Var %‘14/
’13In mass-market channels too, the "hourglass" phenomenon also prevails, with consumers consequently being steered towards niche products, as well as items offering a high price/quality ratio.
The analysis of sales for large retailers for the last four years, over the course of the crisis, confirms the transforma-tion of this channel which encompasses extremely diverse retail enterprises, which differ not only in their superficial characteristics. The total value of this category as a result of the separation of the value represented by herbalist stores and single-brand stores reached the 3,474 million euro mark in 2014 (this figure was 3,751 million in 2011). This trend has resulted in a fall of almost three percentage points, the worst result of the last three financial years. Among the individual types of retail outlet which fall within this channel, discount stores are an exception, growing 5.2% to a value of 154 million euro, along with SSS Drug stores, the so called "house and toilet" outlets, which, with the sales of 849 million euro, equivalent to 24.4% of the entire large retailer channel, have grown by more than four percentage points. The Self Service category, which size-wise is second only to super and hyper markets, is declining at a worrying rate, losing more than twelve percentage points, while larger retailers, supermarkets and hypermarkets recorded a drop of 4.8% for a value of 2,075 million euro. This category, with 59.7% of the total, still constitutes the largest Italian drug aggregate group.
An analysis of the best performances for products sold across the different channels reveals a number of important phenomena: the most significant percentage growth rates are to be found in nail varnishes and female fragrances in the Traditional Grocery category, + 20% and + 18.2%, respectively, followed by fragrances for men and women, 10.3%, in the SSS Drug category and liquid soaps in Discount, up by 10.2%. These phenomena appear to confirm a number of different directions of specialisation within the large retail channel, the first of all the perfume sales trends which demonstrates an alternative form of distribution which was previously only the preserve of selective channels.

Scenarios in the cosmetics industry26
Large retail profiles and associated turnover of cosmetic products
Variations
'11/'10 '12/'11 '13/'12 '14/'13
-1.0% -2.6% -4.1% -4.8%
-3.6% -7.6% -10,6% -12.4%
-29.5% 3.0% 6.1% 5.2%
-6.3% -1.7% -8.4% -8.3%
21.4% 1.6% 5.4% 4.2%
0.8% -1.9% -2.5% -3.1%
75.3% 25.9% 40.2% 7.0%
3.8% 5.0% 2.8% 2.4%
2.8% -0.2% 0.1% -1.9%
Analysis of best performance
Values in millions of euro and variations %
Modern distribution(hypermarkets, supermarkets and self service outlets)
Mouthwashes, breath fresheners and teeth whitening 0.9%
Discount
Liquid soaps 10.2%
Toothpastes 7.3%
Bath and shower foam 2.8%
Traditional grocery
Nail varnishes 20.0%
Toilet waters and perfumes for women 18.2%
Toilet waters and perfumes for men 6.6%
SSS Drug
Toilet waters and perfumes (average M+F) 10.9%
Toothpastes 8.9%
Deodorants and antiperspirants 7.5%
2011 2012 2013 2014
Value share %
Value share %
Value share %
Value share %
Hypermarkets+ Supermarkets
2,334 62.2% 2,273 61.8% 2,181 60.8% 2,075 59.7%
Free Services 344 9.2% 318 8.6% 284 7.9% 249 7.2%
Discount 134 3.6% 138 3.8% 146 4.1% 154 4.4%
Traditional grocery
178 4.7% 175 4.8% 160 4.5% 147 4.2%
SSS Drug 761 20.3% 773 21.0% 815 22.7% 849 24.4%
Total - Italian drug stores
3,751 100.0% 3,678 100.0% 3,586 100.0% 3,474 100.0%
C.I. single-brand stores
170 4.0% 214 5.0% 300 7.0% 321 7.6%
C.I. herbalist stores
379 8.8% 398 9.3% 409 9.5% 419 9.9%
Total - other channels
4,300 4,290 4,295 4,214
Var %‘14/
’13
Scenarios in the cosmetics industry 27
Herbalist shops
Hairdressing salons
Cosmetics sold in herbalist stores in 2014 also confirm the positive trend of recent years, although a slowdown in growth rates can be detected. The value of the sales (close on 420 million euro, with a growth of more than two per-centage points - 2.4% to be precise) nonetheless confirms the strength of this channel, which covers 4.5% of total Italian consumption. As such, the evolution of the channel continues, albeit at a less dramatic pace; it appears unaf-fected by the negative economic situation, thanks to the spending choices of consumers, who are increasingly drawn towards healthy, natural concepts. Sales figures for cosmetics in the pharmacy channel and those in herbalist stories confirm the purchase choices made by the user groups that favour assisted, "recommended" sales, as borne out by recent surveys by Alias, GFK and Mintel, which clearly emphasises a focus on products that are centred on "green" concepts. This is testament to an in-crease in environmental awareness and interest in natural products, to which herbalist stores provide a clear response; moreover, the growing prevalence of specialised corners and the opening of new stores, which often border on being categorised as single-brand, serve to demonstrate evolution of the channel, further reinforced at the highest levels of the price lists.
From the surveys carried out, it emerges that consumers who graduate towards herbalist stores do not take price or promotion into account - proof of loyalty to this well-rooted channel. Customers of herbalist stores confirmed that their key reasons for spending were the sales staff and their own focus on the ingredients in the products: a further insight into the type of customer that frequents this channel and the incentives that drive them to buy.
In the professional hairdressing channel, consumption of cosmetics recorded a decline for 2014 that was somewhat slower than in recent years, at 3.5%, for a value of 570 million euro, representing 6.1% of all cosmetics consumption in Italy. With regard to beauty salons, the reduced use of hairdressing salons, conditioned more directly by the eco-nomic downturn and therefore limiting inclination to use beauty services as a whole, has also led to a distinct change both with regard to use and purchase of cosmetics in the professional channel.
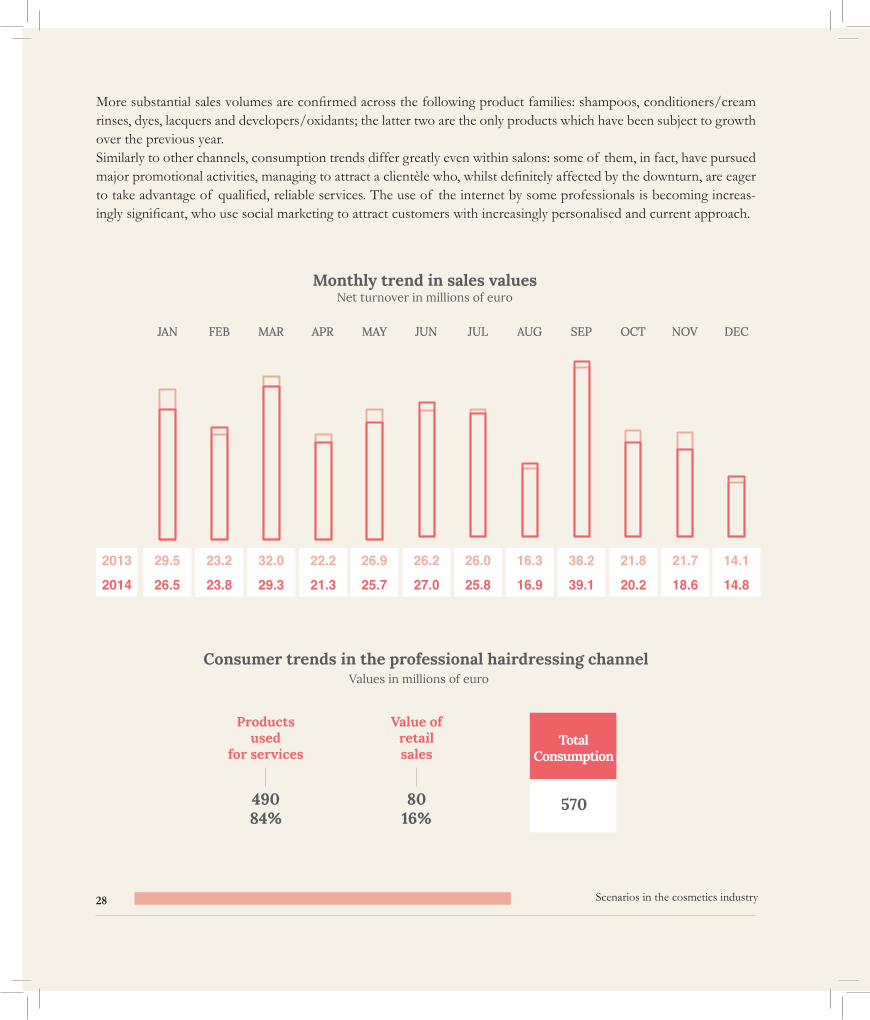
As has already been mentioned, the market value includes both the products used for services and those sold in salons, as well as products sold and used outside: the latter constitutes a weight of about 16% of the aggregate value; as is the case every year, Marketing & Telematica findings add to evaluations of the professional channel. In 2014 the value of sales was down compared with the previous year, with negative shifts almost every month, with the exception of a few peaks in which this trend was reversed, in February, June, September and December. Monthly trends confirm the seasonality of consumption in the channel, remaining consistent with the peak positive (March and September) and negative (August and December) values.
Scenarios in the cosmetics industry28
Monthly trend in sales valuesNet turnover in millions of euro
Values in millions of euroConsumer trends in the professional hairdressing channel
49084%
8016%
570
Products used
for services
Value of retail sales
Total Consumption
More substantial sales volumes are confirmed across the following product families: shampoos, conditioners/cream rinses, dyes, lacquers and developers/oxidants; the latter two are the only products which have been subject to growth over the previous year. Similarly to other channels, consumption trends differ greatly even within salons: some of them, in fact, have pursued major promotional activities, managing to attract a clientèle who, whilst definitely affected by the downturn, are eager to take advantage of qualified, reliable services. The use of the internet by some professionals is becoming increas-ingly significant, who use social marketing to attract customers with increasingly personalised and current approach.
23.2
23.8
29.5
26.5
2013
2014
22.2
21.3
32.0
29.3
26.9
25.7
26.0
25.8
26.2
27.0
38.2
39.1
16.3
16.9
21.8
20.2
21.7
18.6
14.1
14.8
JAN FEB MAR APR MAY JUN JUL AUG SEP OCT NOV DEC
Scenarios in the cosmetics industry 29
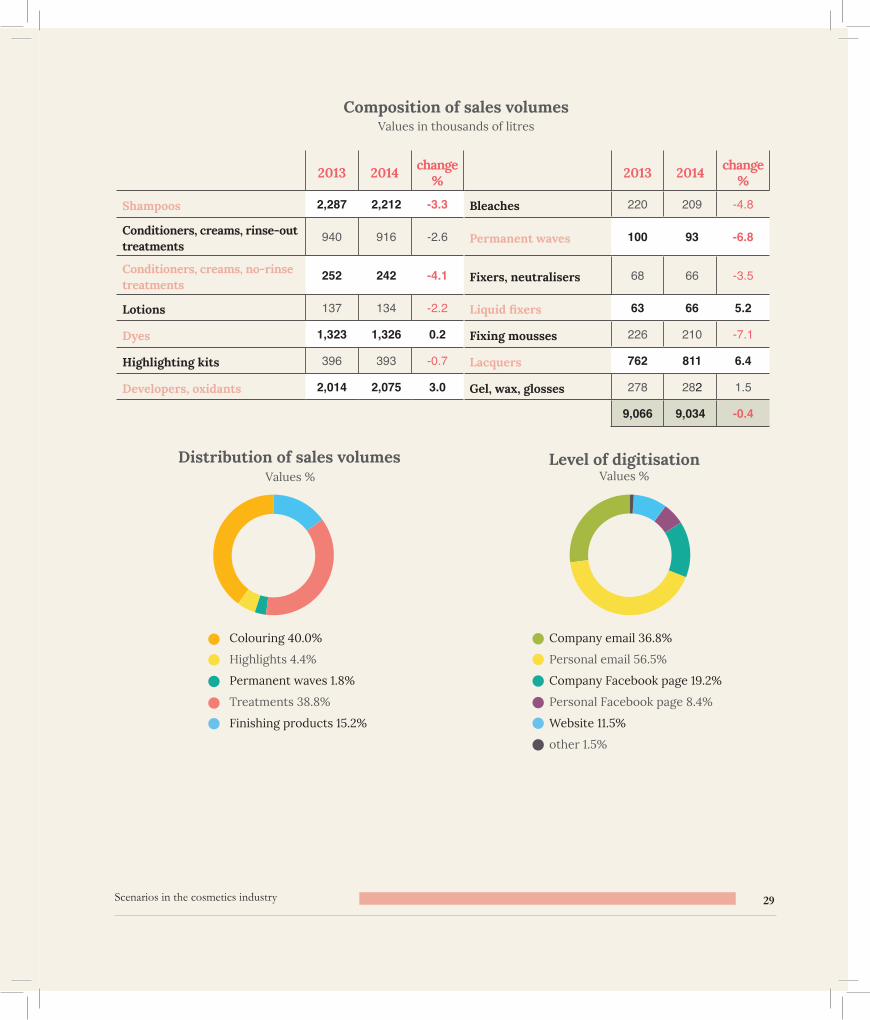
Composition of sales volumes
Distribution of sales volumes Level of digitisation
2013 2014 change %
Shampoos 2,287 2,212 -3.3
Conditioners, creams, rinse-out treatments
940 916 -2.6
Conditioners, creams, no-rinse treatments
252 242 -4.1
Lotions 137 134 -2.2
Dyes 1,323 1,326 0.2
Highlighting kits 396 393 -0.7
Developers, oxidants 2,014 2,075 3.0
2013 2014 change %
Bleaches 220 209 -4.8
Permanent waves 100 93 -6.8
Fixers, neutralisers 68 66 -3.5
Liquid fixers 63 66 5.2
Fixing mousses 226 210 -7.1
Lacquers 762 811 6.4
Gel, wax, glosses 278 282 1.5
9,066 9,034 -0.4
Values in thousands of litres
Values % Values %
40+5+3+37+15 27+42+15+6+9+1Colouring 40.0%
Highlights 4.4%
Permanent waves 1.8%
Treatments 38.8%
Finishing products 15.2%
Company email 36.8%
Personal email 56.5%
Company Facebook page 19.2%
Personal Facebook page 8.4%
Website 11.5%
other 1.5%

Scenarios in the cosmetics industry30
Web access
Distribution of Italian hairdressing salons
Values % as many responses as possible
Source: Marketing and Telematica data (2014) processed by Cosmetica Italia, broken down into Nielsen areas
70+12+7+11 Pc or Mac 81%
Only smartphone 15.1%
Tablet 7.9%
no device 13.7%
Emilia Romagna 9.3%
Friuli Venezia Giulia
2.5%
Trentino Alto Adige
2.1%
Veneto 10.0% 3+16+9+1+8+3+2+10+10+4+2+9+2+3+1+2+5+1+4+5+ALiguria 3.0%
Lombardy 18.6%
Piedmont 9.4%
Aosta Valley 0.3%
Lazio 8.3%
Marche 3.6%
Sardinia 2.2%
Tuscany 8.0%
Umbria 1.9%
Abruzzo 2.6%
Basilicata 0.6%
Calabria 2.0%
Campania 5.5%
Molise 0.5%
Puglia 4.4%
Sicily 5.3%
31.
3% A
rea 1 20.9% Area 4 23.9%
Area 3 23.8% Area 2

Scenarios in the cosmetics industry 31
3+20+9+1+9+2+3+11+3+1+2+5+1+4+3+8+4+2+7+2+AArea 1 Area 3
Area 4Area 2
Distribution of Italian beauty salonsSource: Marketing and Telematica data (2014) processed by Cosmetica Italia, broken down into Nielsen areas
Liguria 2.9%Lombardy 21.5%Piedmont 8.5%Valle 0.3%
Emilia 9.7%Friuli 2.3%Trentino 2.5%Veneto 11.8%
Lazio 8.4%Marche 4.0%Sardinia 1.9%Tuscany 8.4%Umbria 1.6%
Abruzzo 2.7%Basilicata 0.7%Calabria 1.4%Campania 4.4%Molise 0.4%Puglia 4.2%Sicily 2.7%
Beauty salonsLike hairdressing salons, beauty salons have also seen a decline in consumption over a number of years - this is down 3.6%, to a value of just over 230 million euro, representing 2.5% of all cosmetics consumed in Italy. It is clear that this channel too has been hit by reduced customer response, with decreased attendance generating a decline in values both with regard to services and to treatments, with an obvious impact on the use of cosmetics. For some time, this channel has been affected by uncertainties with regard to visits to beauty salons, penalised by the economic situation and price tensions, the policies of major market players and above all, by new competition linked to products of dubious origin. As confirmed by recent surveys carried out by Alias and GFK, the lack of a clear retail identity coupled with incon-sistent volume and price trends are affecting the development of the channel. In addition, a number of important phenomena are also emerging - spas and wellness centres, which dynamically tend to represent an increasingly large share of consumption of aesthetic/professional products.
Area 1 33.1% Area 2 26.3% Area 3 24.3% Area 4
16.3
%

Scenarios in the cosmetics industry32
Cosmetics in EuropeIn 2014 too, the data provided by Cosmetics Europe (formerly known as Colipa), the European Cosmetic Industry representative, show Germany in the lead with regard to consumption with a total of 13,012 million euro, followed by France with 10,583 million euro. Third place went to the UK, with a vigorous 5.3% increase over last year, totalling 10,397 million euro. Italy is fourth in terms of European consumption, followed by Spain in fifth place with 6,350 million euro and a negative trend which is less marked than last year. The concentration index confirms that the top five countries account for 68% of the European market, which in 2014 reached a total of 72,531 million euro, which represents a slight positive trend (+0.5%).
The top-selling European products are toiletries and products dedicated to skin-care, which make up 25.4% of the total. With over 72 billion euro in sales, Europe confirmed its position as number one in the world for consumption, followed by the US (49), China (32), Japan (18) and Brazil with 16 billion euro.
A comparison of the biggest marketsSource: Cosmetics Europe on the basis of Euromonitor data,
2014 consumption in millions of euro
Europe 72,500
EU 28 69,000
USA 49,000
China 32,000
Japan 18,000
Brazil 16,000
India 7,000
South Korea 7,000
Composition of European consumption by macro-category
Source: Cosmetics Europe, 2014
Category 2014 % Var. '14/'13
Make-up 9,719 1.2
Skin care 18,412 0.1
Toiletries 18,448 1.3
Products for hair care 15,083 -0.2
Alcohol-based perfume products
10,869 0.1
72,531 0.5

Scenarios in the cosmetics industry 33
A comparison of the biggest marketsSource: Cosmetics Europe on the basis of Euromonitor data,
2014 consumption in millions of euro
European consumptionSource: Cosmetics Europe - Values in millions of euro, retail prices
2012 2013 % Var. '13/'12 2014 % Var.
'14/'13
Germany 12,819 12,811 -0.1% 13,012 1.6%
France 10,915 10,571 -3.2% 10,583 0.1%
United Kingdom 10,191 9,877 -3.1% 10,397 5.3%
Italy 9,641 9,522 -1.2% 9,392 -1.4%
Spain 6,669 6,433 -3.5% 6,350 -1.3%
Poland 2,907 2,911 0.1% 2,954 1.5%
Netherlands 2,837 2,823 -0.5% 2,823 0.0%
Belgium/Luxembourg 1,960 2,023 3.2% 2,043 1.0%
Switzerland 2,165 2,078 -4.0% 2,008 -3.4%
Sweden 1,818 1,863 2.5% 1,797 -3.5%
Austria 1,323 1,334 0.8% 1,345 0.8%
Portugal 1,324 1,291 -2.5% 1,277 -1.1%
Norway 1,261 1,287 2.1% 1,261 -2.0%
Romania 1,060 1,070 0.9% 1,089 1.8%
Denmark 1,047 1,055 0.8% 1,014 -3.9%
Finland 917 895 -2.4% 894 -0.1%
Greece 846 816 -3.5% 807 -1.1%
Czech Republic 786 758 -3.6% 715 -5.7%
Ireland 660 671 1.7% 687 2.4%
Hungary 663 647 -2.4% 635 -1.9%
Slovakia 503 512 1.8% 518 1.2%
Bulgaria 313 319 1.9% 324 1.6%
Lithuania 171 179 4.7% 187 4.5%
Slovenia 172 166 -3.5% 162 -2.4%
Latvia 135 142 5.2% 144 1.4%
Estonia 107 111 3.7% 114 2.7%
Total - EU 73,210 72,165 -1.4% 72,531 0.5%
17.9%
14.6%
14.3%
12.9%
8.8%
4.1%
3.9%
2.8%
2.8%
2.5%
1.9%
1.8%
1.7%
1.5%
1.4%
1.2%
1.1%
1.0%
0.9%
0.9%
0.7%
0.4%
0.3%
0.2%
0.2%
0.2%
100.0%
comp. %2014

Scenarios in the cosmetics industry34
European consumption - First ten countries, values and trends Source: Cosmetics Europe, 2014 - Values in millions of euro
Consumption Top 10 Trend ‘14/’13
2013
72,165
72,531
60,912
61,359
-1.4%
0.5%
2014

Trends in cosmetics consumption 35
Trends in cosmetics consumptionThe closing values for 2014 confirm the slightly downward trend seen in recent years, after several year of holding fast against the economic crisis: cosmetics consumption in Italy has declined by 1.4%, reaching 9,392 million euro, a similar value to that recorded in 2008. Of the total cosmetics sales, 8,049 million euro are sold in retail channels, which have also seen a decrease of 1.4%, in part supported by the strong performance of single-brand stores and specialised areas within mass market channels, as well as direct door-to-door sales, which are up 2.8%. Pharmacies also saw an upward swing in 2014, after a 2012 marked by negative trends on a range of different product lines, while the perfume shops have registered a decline, although this was relatively modest compared to recent years (-2.5%). As is customary, the domestic market has seen good performance with regard to exports, which are up 4.9%, confirming the increasing capacity of Italian cosmetics companies to adapt to the new characteristics of expanding markets and to the wide range of purchasing options now available for consumers. 2014 figures also serve to confirm the transverse nature of consumption and the "non-channel" choices being made by consumers as being two of the foremost characteristics of the Italian market at present.
Breakdown of consumption by macro-categories - traditional channels in 2014Percentage share
Products for body care
Products for face care
Hair and scalp care
Products for body hygiene
Alcohol-based perfume products
Products for oral hygiene
Products for face make-up
Products for eye make-up
Products for lip care
Products for hand care
Products for men
Skin cleansing products for children
Gift packs
Make-up packs
16.0%
15.5%
13.7%
13.0%
11.7%
8.7%
4.9%
4.4%
3.4%
2.9%
2.1%
1.8%
1.4%
0.6%

Trends in cosmetics consumption36
Total Pharma-cies
Perfume shops
Mass mar-ket andother
channels
Total % var
Pharma-cies % var
Perfume shops % var
Mass/other channels
% var
8,049.0 1,776.0 2,059.2 4,213.8 -1.4 1.1 -2.5 -1.9
Hair and scalp care 1,103.9 175.0 65.0 863.8 -3.1 -0.2 -9.8 -3.2
Products for face care 1,247.0 479.4 413.7 353.9 -0.3 1.3 -0.9 -2.4
Products for face make-up
394.2 56.6 181.1 156.6 1.1 8.1 -3.0 3.6
Make-up packs 48.9 0.0 34.6 14.3 1.3 76.4 1.8 0.0
Products for eye make-up 352.4 29.3 141.5 181.6 0.9 57.1 -6.7 0.8
Products for lip care 272.0 46.2 85.2 140.5 -2.5 0.4 -2.2 -3.6
Products for hand care 232.0 34.1 42.1 155.7 -4.4 -7.8 -13.6 -0.8
Products for body care 1,289.2 440.9 135.3 713.1 -3.4 -0.7 -10.8 -4.1
Products for body hygiene
1,050.3 262.4 37.6 750.3 -1.5 2.0 -13.0 -2.1
Products for oral hygiene
699.2 136.5 4.4 558.3 0.9 1.1 0.0 0.9
Skin cleansing products for children
142.6 93.9 4.7 43.9 -3.4 -2.9 0.0 -4.8
Products for men 167.6 12.1 39.2 116.3 -6.6 -5.7 -4.5 -7.3
Alcohol-based perfume products
939.9 9.4 776.3 154.2 1.5 15.8 0.4 6.3
Gift packs 109.9 0.0 98.4 11.4 -6.0 - -6.7 0.0
Total retail consumption of products - traditional channels in 2014Retail prices, VAT included - values in millions of euro

Trends in cosmetics consumption 37
Estimation of the composition of consumption of cosmetic products for women
Estimation of the composition of consumption of cosmetic products for men (30% total)
14+19+9+7+2+6+5+4+17+6+10+117+7+7+14+19+16+17+3
Hair and scalp care 12.7%
Products for face care 18.9%
Products for face make-up 6.9%
Make-up packs 0.9%
Products for eye make-up 6.2%
Products for lip care 4.8%
Products for hand care 4.1%
Products for body care 17.3%
Products for body hygiene 11.1%
Products for oral hygiene 6.1%
Alcohol-based perfume products 9.9%
Gift packs 1.1%
Hair and scalp care 17.1%
Products for face care 7.6%
Products for men 7.6%
Products for body care 13.7%
Products for body hygiene 19.0%
Products for oral hygiene 15.8%
Alcohol-based perfume products 17.0%
Gift packs 2.1%

Imports and exportsTrends in cosmetics consumption38
In depth
Emerging themes
Relationship with the consumer (which areas have most impact)
Consumer expectations regarding the purchase of cosmetic products in the pharmacy channelIn 2015, as in the past, Alias has carried out surveys on the consumer expectations and experiences of buyers of cosmetics, this time in the pharmacy channel. The sample showed that alternative channels of purchase for consumers who tend to be loyal to pharmacies (a channel from which they purchase, on average, once a month) are supermarkets, perfume shops and single-brand stores. Oral hygiene, sun creams, facial moisturisers and hair products are the categories most purchased, due to the increased emphasis placed on quality, efficacy and safety/hypo-allergenic formulas by pharmacies in comparison with other channels. Pharmacies are considered to be "more serious" stores, characterised by a less commercial approach and the ability of employees to give advice, a skill which constitutes a must in choosing a trusted pharmacy; it is also interesting to note that the policy of giving out little sample-gifts to customers (still not widely used in Italian pharmacies) constituted the a key factor in encouraging loyalty among customers. Among the elements preventing increased frequency of purchase in this channel, beyond the consideration that items are "too expensive" , were a lack of freedom of movement and a range of products not well suited to customer requirements; men also tend to associate buying cosmetics in a pharmacy/para-pharmacy with having a problem that needs treating. Features of an ideal pharmacy as voted by consumers included the provision of testers, more regular promotions and offer, and the presence of niche products that are difficult to find in other channels, often more competitive in terms of pricing.
Beauty Trend WatchThe new Beauty Trend Watch project, which is designed to propose future trends on a cyclical basis, identifying the directions that the world of cosmetics will take, has already highlighted some important trends, via the very first interviews carried out with qualified operators in our industry. The sample group interviewed indicated the areas most in need of development, from product claims to new formulations, from distinctions between the new channels to raw materials. An example: over 60% of the group highlighted natural cosmetics as one of the future areas on which to focus, not only with regard to communications but also as a strategy guide for businesses. Finally, with regard to the internet, interestingly the findings suggested that social media, e-commerce and ROPO (research online, purchase offline) will play a central role over the next two years in terms of relationship with the consumer and to complement traditional in-store purchases.
40+25+20+10+5 21+13+12+12+11+9+6+6+5+3+2social media and web 40%green, organic and natural 25%relaxation, sensuality 20%greater company-con-sumer involvement
10%
other 5%
E-commerce 21%Social media 13%Multi-channel 12%Multi-functional products
12%
Green 11%
ROPO 9%Confidence 6%Custom 6%Nutraceutics 5%Door-to-door sales 3%Single-Brand stores
2%

Imports and exports Imports and exports 39
Imports and exports
Trends in the trade balanceISTAT data, processed by the Statistics Dept., values in millions of euro
Imports Exportscommercial balance
millions of euro in 2014
Imports Exports
Var % Var %
1,685 1,649 3,334
693570
780741
800951
725856
9141,146
1,1771,771
1,0101,214
1,1391,502
1,2561,822
1,2491,836
1,2842,004
1,3692,144
1,4532,274
1,5152,297
1,5812,328
1,4102,054
1,5812,407
1,6602,672
1,6262,861
1,6853,334
1,6533,178
1994 2014
16.3 12.5 -7.0 10.4 14.2 10.4 12.8 3.3 6.0 0.6 2.2 6.7 6.1 4.3 4.4 -10.9 12.1 5.0 -2.0 1.7 2.0
33.8 30.1 15.5 11.1 20.5 5.9 23.8 17.9 3.7 -0.8 10.0 7.0 6.1 1.0 1.4 -11.8 17.2 11.0 7.1 11.1 4.9
T T
T T
The analysis of foreign trade data is based on the statistics that are processed every year by the Cosmetica Italia Sta-tistics Dept., based on data provided by Istat. Periodically, when applying the corrections which present themselves during the survey period, the Italian Institute of Statistics carries out a review of data from previous years: clearly, then, the statistics processed by Cosmetica Italia adapt the values relating to the financial years in question. With the exception of very rare occasions, however, deviations in figures are always marginal. For the fifth consecutive year, exports recorded a further increase, easily surpassing the threshold value of three billion euro. Indeed, exports of Italian cosmetics totalled 3,334 million euro, an increase of 4.9%. The overall value relating to this data is significant: we are seeing a growth of 6.5%, confirming that the drive towards internationalisation is increasingly powerful, and is not only manifested marginally. In line with the values recorded last year, imports reached 1,685 million euro, an increase of 2.0% compared to 2013, which was supported by a greater increase in quantity, totalling almost four per-centage points. Thanks to the reduction of tensions in foreign markets, the trade balance of the cosmetic industry has confirmed the upward which began in 1996, when the value of cosmetic exports exceeded that of imports. In 2014 the credit balance is close to 1,650 million euro, well above many similar market categories: Italian cosmetics bring positivity to the economy of the country. The full recovery of some historical foreign markets, even in a moment of overall uncertainty, has certainly contributed to the performance of Italian sales abroad, which are still increasing sharply after the expected decline of 2008-2009. But it is the exports to "new" destinations - highly sought-after across the Italian business world - which have impressed most.

Imports and exports40
The safety of formulations, along with constant product innovation, have contributed to the maintenance of trade figures on individual markets and have prompted growth in new areas of excellence, confirming the quality of the Ital-ian cosmetics industry. Export constituted 35.6% of total turnover in 2014, the highest value seen in the last decade, which has certainly been helped by the improved performance of the major European markets and the rapid devel-opment of those in the Middle East and Asia. While this value is still too low to be able to hail the successful launch of the internationalisation process of the Italian cosmetics industry, It remains positive in terms of new development opportunities in foreign markets.Powders and compact powders have recorded excellent positive performances, all in double figures (+ 10.4% and more than 120 million) along with toilet soaps (+ 9.7% and 314 million). Make-up products have also done extremely well : eye make-up closed the 2014 at 314 million (compared to 183 in 2010), and increase of + 9.7%, lip products did similarly well, totalling 115 million and an impressive + 30.7%. The first category of Italian cosmetics exports, including creams and other products, also did well, increasing by 0.9%, with a value of over 570 million euro;toilet waters and eau de colognes were slightly down, by -0.7%, which represents 554 million euro; on the contrary, perfumes and eau de parfums closed 2014 at + 0.5%, approaching 264 million.Body deodorants continued to fall by 4.4% with a value of 72 million euro, along with bath preparations, which were down 2.6 percentage points.Exports of hair products were still looking positive however: shampoos did well, + 10% to almost 170 million euro, along with lacquers (close to 30 million in value) and the combined category covering lotions and other hair care products, which exceeded 460 million, with almost 6% of growth. Conversely, hair preparations are still on the decline (-5.5%), with a current value of just over 7 million euro.
In 2014 too, flows in foreign trade confirmed the sudden drop in tensions in the economies of certain individual countries, which are united by their ability to weather the financial crisis of recent years.As for imports, creams remain the product of greatest value, increasing by 1.7% and over 552 million euro, along with toilet waters and eau de cologne, up 6.7% to a value of 222 million euro. Significant declines in imports hit oral hygiene products, specifically toothpaste (-11.6%) and other oral preparations (-18.3%).The primary destination for cosmetics exports is Europe, to the tune of 2,266 million euro, thanks to a strong recov-ery in demand from historically important countries, such as Germany, France and the United Kingdom. The growth of exports to the UAE also seems unstoppable, and is up 20.1% to over 117 million euro, as well as those to Spain (+ 7.5%): the volumes of these countries are increasingly attractive, especially from a strategic perspective, in view of policies regarding the internationalisation of companies in the sector. On average, the growth for new players in the international cosmetics business has been more than 40% in the last three years.
In general, we are witnessing an evenly-distributed expansion in export values of Italian cosmetic products: Asia, with a value of 593 million euro, has recorded an increase of 6.1% (it was at 9.5% in 2013); America, with a value of more than 360 million euro, saw an increase of 7.4%, while Africa recorded a setback in its preference for Italian exports, with a drop of 9.6% compared to last year . Further intercontinental decline was recorded for Oceania, with a drop of 20.9%, for a total value of 34 million euro, bring the region close to 2006 levels.The 10-year comparison of the major destinations within the Asia as part of the Association's internationalisation plan is impressive: the total value of exports to China, Singapore and Hong Kong has jumped from 53 million euro in 2003 to 194 million last year; an increase of 108% in ten years if we analyse the entire ASIAN region, and which is unlikely to stop as long as the economies of these countries continue their impressive economic growth.

Imports and exports Imports and exports 41
Export of finished and semi-processed productsData compiled from January to December
ISTAT data, processed by the Cosmetica Italia Statistics Dept.
QUANTITIES (tons) VALUE (thousands of euro)
2013 2014 % Var. 2013 2014 % var.
Shampoos 79,475 83,457 5.0% 153,552 168,943 10.0%
Hair preparations 1,550 1,546 -0.2% 7,808 7,382 -5.5%
Lacquers 10,123 10,485 3.6% 29,208 29,901 2.4%
Hair lotions and other products for hair care
82,550 88,325 7.0% 436,108 461,296 5.8%
Powders and compact powders 4,875 5,319 9.1% 109,154 120,508 10.4%
Creams and other products 47,654 43,987 -7.7% 565,016 570,380 0.9%
Lip make-up products 2,284 2,458 7.6% 88,024 115,039 30.7%
Products for eye make-up 7,874 8,236 4.6% 286,346 314,011 9.7%
Nailcare products 3,450 3,584 3.9% 47,099 48,218 2.4%
Toilet soaps 112,558 134,775 19.7% 184,772 208,118 12.6%
Bath preparations 36,608 35,415 -3.3% 77,310 75,264 -2.6%
Body deodorants 14,452 13,818 -4.4% 75,224 71,942 -4.4%
Toothpastes 3,664 4,269 16.5% 22,407 27,252 21.6%
Other preparations for oral hygiene 65,456 70,354 7.5% 126,816 134,857 6.3%
Shaving, pre-shave and after shave products
13,277 14,644 10.3% 40,071 45,268 13.0%
Perfumes and eau de parfums 8,990 10,438 16.1% 262,418 263,692 0.5%
Toilet waters and eau de colognes 21,335 19,494 -8.6% 558,107 554,019 -0.7%
Other perfume and toiletry products 20,833 21,530 3.3% 108,304 117,613 8.6%
Total - exports 537,007 572,136 6.5% 3,177,742 3,333,702 4.9%

Imports and exports42
Import of finished and semi-finished productsData compiled from January to December
QUANTITIES (tons) VALUE (thousands of euro)
2013 2014 % var 2013 2014 % var
Shampoos 40,733 44,581 9.4% 82,605 87,613 6.1%
Hair preparations 353 1,180 233.6% 2,008 2,387 18.9%
Lacquers 1,499 1,443 -3.7% 6,837 6,286 -8.1%
Hair lotions and other products for hair care
31,975 32,874 2.8% 127,866 128,880 0.8%
Powders and compact powders 1,444 1,652 14.4% 22,883 23,915 4.5%
Creams and other products 43,196 44,557 3.2% 543,309 552,299 1.7%
Lip make-up products 788 1,154 46.4% 39,579 40,523 2.4%
Products for eye make-up 1,756 2,438 38.9% 91,496 99,745 9.0%
Nailcare products 3,470 3,789 9.2% 63,786 59,590 -6.6%
Toilet soaps 22,460 22,320 -0.6% 43,015 44,827 4.2%
Bath preparations 15,154 9,129 -39.8% 30,398 24,466 -19.5%
Body deodorants 8,484 9,165 8.0% 56,974 56,724 -0.4%
Toothpastes 29,354 28,915 -1.5% 99,229 87,694 -11.6%
Other preparations for oral hygiene 11,054 10,558 -4.5% 46,721 38,172 -18.3%
Shaving, pre-shave and after shave products
3,959 4,919 24.2% 18,866 20,517 8.8%
Perfumes and eau de parfums 12,067 14,341 18.8% 127,897 150,354 17.6%
Toilet waters and eau de colognes 7,862 11,503 46.3% 208,127 222,035 6.7%
Other perfume and toiletry products
6,940 6,865 -1.1% 41,055 39,311 -4.2%
Total imports 242,555 251,392 3.6% 1,652,659 1,685,347 2.0%
ISTAT data, processed by the Cosmetica Italia Statistics Dept.

Imports and exports Imports and exports 43
Italian cosmetics industry exports - top 10
International cosmetics trade flows
PopulationExports
World3,334 4.9%
Oceania 34
-20.9%
Export 2013 Export 2014 % var '14/'13% Weight on export total
for 2014
Germany 355 393 10.6% 11.8%
France 370 390 5.5% 11.7%
United Kingdom 261 268 2.6% 8.0%
United States 215 249 16.0% 7.5%
Spain 199 214 7.5% 6.4%
Russia 141 139 -1.2% 4.2%
United Arab Emirates 98 117 20.1% 3.5%
Netherlands 119 117 -1.6% 3.5%
Hong Kong 110 112 1.9% 3.4%
Poland 106 107 1.2% 3.2%
Africa 75
-9.6%
America 364 7.4%
Europe2,2665.2%
Asia 593 6.1%
9.9%68.0%
61.5%17.8%
12.7%10.9%
15.4%2.2%
0.5%1.0%
Value of exports in millions of euro
Exports- values in millions of euro and percentage variations 2014/2013

Imports and exports44
9.0 34.5 31.1
43.8 110.0 112.1
33.8 66.4 70.4
26.5 42.5 44.1
72.2 69.8 62.8
6.7 37.5 37.7
95.3 34.7 38.4
4.3 12.5 15.0
3.9 11.5 11.8
5.9 30.2 26.9
2.8 6.4 7.6
1.9 4.9 4.9
1.0 1.3 2.3
United States
Hong Kong
South Korea
China
South Africa
Chile
Malaysia
Thailand
Indonesia
NAFTA
ASIAN
EFTA
CEFTA
MERCOSUR
COMESA
16.0% 30.1%
1.9% 156.1%
3.8% 66.5%
0.7% 460.8%
19.6% 245.9%
2.3% 201.3%
18.8% 169.6%
1.2% 161.4%
80.8% 135.2%
12.0% 31.7%
6.0% 108.1%
-10.0% -13.0%
10.9% -59.7%
-9.9% 246.1%
-11.0% 356.1%
%Var ‘14/’13
%Var ‘14/’13
%Var ‘04/’14
%Var ‘04/’14
2004
2013
2014
191.6 215.0 249.4
221.3 260.2 291.4
Value of exports in millions of euro
Value of exports in millions of euro
1. NAFTA comprises: Canada, Mexico, US 2. ASIAN comprises: Burma, Brunei, Cambodia, Philippines, Indonesia, Laos, Malaysia, Singapore, Thailand, Vietnam 3. EFTA comprises: Iceland, Liechteinstein, Norway, Switzerland 4. CEFTA comprises: Croatia, Macedonia, Moldova, Serbia, Bosnia and Herzegovina, Montenegro, Albania, Kosovo 5. MERCOSUR comprises: Argentina, Brazil, Paraguay, Uruguay 6. COMESA comprises: Burundi, Comoros, Congo, Egypt, Eritrea, Ethiopia, Djibouti, Kenya, Libya, Madagascar, Malawi, Mauritius, Rwanda, Seychelles, Sudan, Swaziland, Uganda, Zambia, Zimbabwe
Countries in the internationalisation plan 2004-2014
Geo-economic areas

Imports and exports Imports and exports 45
Italian exports in 2014 - values in millions of euro
Italian exports in 2004 -2014, values in millions of euro
Leading importers by macro-category
Breakdown of exports by macro category
Products for hair care Products for make-up Products for body care Personal cleansing
United States 66.9 France 141.3 Germany 58.7 France 72.3
Spain 57.7 Germany 88.4 Hong Kong 50.4 United Kingdom 44.4
France 57.2 United Kingdom 58.4 France 46.5 Germany 34.7
Germany 53.7 United States 54.1 United States 42.2 Spain 29.1
United Kingdom 39.6 Spain 38.1 Spain 34.8 Greece 14.6
Oral hygiene Products for men Alcohol-based perfume products Other products
United Kingdom 44.4 Germany 16.3 Germany 103.4 Netherlands 23.3
Germany 32.1 Netherlands 6.9 United States 72.7 France 15.6
France 13.9 Russia 2.9 United Arab Emirates 65.3 Spain 9.9
Slovakia 10.1 France 2.8 Hong Kong 53.6 Russia 6.7
Spain 9.2 United States 1.5 United Kingdom 44.9 Germany 5.9
2004
% weight '04 on total
export
2014
% weight ‘14 on total
export
Products for hair care 294 14.7% 668 20.0%
Products for make-up 285 14.2% 598 17.9%
Products for body care 445 22.2% 570 17.1%
Personal cleansing 220 11.0% 355 10.7%
Oral hygiene 68 3.4% 162 4.9%
Products for men 36 1.8% 45 1.4%
Alcohol-based perfume products
559 27.9% 818 24.5%
Other products 97 4.8% 118 3.5%2,004 100.0% 3,334 100.0%
% Var. '14/'13
6.5%
12.7%
0.9%
5.3%8.6%
13.0%
-0.3%
8.6%4.9%
15+14+22+11+3+2+28+520+18+17+10+5+1+25+42014
2004
Advertising investment, packaging46
Advertising investmentsFor some time, the Cosmetica Italia Statistics Department has been processing data concerning investment in adver-tising the in cosmetics industry, on the basis of the summaries provided by Nielsen. Every year, it provides adjust-ments to the previous series of data, and as such, cannot guarantee the exact continuity of comparison with previous years. In particular, as of 2014, surveys have incorporated the speed of technological change with regard to use of media: advertisements aired on television, for example, now pass through new channels, via new processes, with sub-sequent new methods of use. To update classifications, our traditional subdivisions must also be updated: the compo-sition of some product families may be affected, especially with regard to previous reports, by these new subdivisions; nonetheless, the quality of the trends identified and their absolute significance remains guaranteed. In a counter-trend with regard to the 7.7% decline recorded last year, the advertising market in the cosmetics sector in 2014 recorded an encouraging 1.4% growth, for a value of 465 million euro, more than 46% of the personal sector, which in turn, despite a slight decline of 0.8%, still constitutes 17.2% of the total investment in commercial advertising. At a time of established economic uncertainty, the cosmetics sector displays a number of dynamics which are significantly less negative than other segments of a similar size, and as in the past, the industry has continued to provide positive sup-port for investment. Growth has also been seen in other major sectors, such as food (which has increased advertising investment by nearly 7 percentage points) and durable goods, down 2.5% compared to 2013. The cosmetics industry investment in advertising is second only to the food, automobile and telephony sectors, with a level of advertising pressure (the relationship between consumption of cosmetics and investment in advertising) which has risen again to 5.0% in 2014, much higher than the value seen across other major "made in Italy" sectors such as fashion, eyewear and footwear. The effects of the international financial crisis, which has had a strong impact on domestic consumption, have also taken their toll on the tax burden, with inevitable constraints on investments which are now considered to be secondary, such as advertising. However, the effort of the companies that have attempted to maintain continuity in order to support the demand for cosmetics with targeted advertising has been in clear evidence, often rationalising the planning and seeking specific opportunities in individual media outlets. In 2014, the most com-monly medium for advertisement is television, up 3.8% with a final value of nearly 350 million euro, while the press continues the decline of recent years with a further drop of 6.4%, reaching just under 83 million euro. The value of investments in radio is currently at 5.8 million euro, with a sharp decline of 9.5%. Internet and direct mail channels are doing well: From 2010 to today, investment in online advertising has increased significantly, now representing 4% of the total, with a flat performance in 2014 worth over 18 million euro. Looking in more detail at the main means of distribution for the advertising sector - television - it is important to take note of the positive growth of this channel, which is in fact in counter-trend to the increasingly popular digital terrestrial channels (both free and paying), as well as the figures recorded by the satellite channels (+ 10.6%). In 2014, face and body care have taken centre stage with regard to advertising investments (33% of the total), with perfumes (23%) and haircare/styling products coming in behind (over 19 percentage points). Investment in specific products for personal hygiene remained stable, accounting for just over 12% of the total, and for oral hygiene, just under 7%.Thanks to the new collaboration between the Statistics Dept. and the major consortia and watchdogs monitoring the web, a more in-depth study of the resources used in advertising on major social networks will be carried out: an impor-tant method of promotion which is increasingly widely used by brands, and available at "time"cost for our operators.

Advertising investment, packaging 47
Values in thousands of euro, data: Nielsen
Annual percentage variation
Trends in macro-sectors - national advertising
2013 2014 Var. % '14/'13
Net investment
Weight in %
Net investment
Weight in %
Activity/services 1,666,884 28.7 1,623,097 27.9 -2.6
Durable goods 962,585 16.6 938,093 16.1 -2.5
Fast-moving consumer goods 1,460,885 25.2 1,542,209 26.5 5.6
• of which Food 1,003,258 17.3 1,070,879 18.4 6.7
• of which non-Food 457,627 7.9 471,330 8.1 3.0
Personal 1,011,789 17.4 1,003,766 17.2 -0.8
• of which cosmetics 458,925 7.9 465,143 8.0 1.4
Free time 704,138 12.1 715,675 12.3 1.6
Total national advertising 5,806,281 100.0 5,822,840 100.0 0.3
Sector details: Activities/Sectors: Distribution - Bodies/Institutions - Finance/Insurance - Industry/Construction/Activities - Professional Services - Telecommunications - Various durable goods: Home - Cars - domestic appliances - Computer/Photography - Motorbikes/VehiclesFast-moving consumer goods: Food - Drinks/Spirits - Housekeeping - Toiletries Free time: Games/School items - Media/Publishing - Free time - Tourism/trips Personal: Clothing - Personal care - Pharmaceuticals/Health - Personal objects
Investment in advertising for cosmetics on traditional media
6.5% -5.8% 5.3% 1.5% 1.0% -9.0% 9.2% -0.8% -11.8% -7.7% 1.4%
2004
0 0
2014
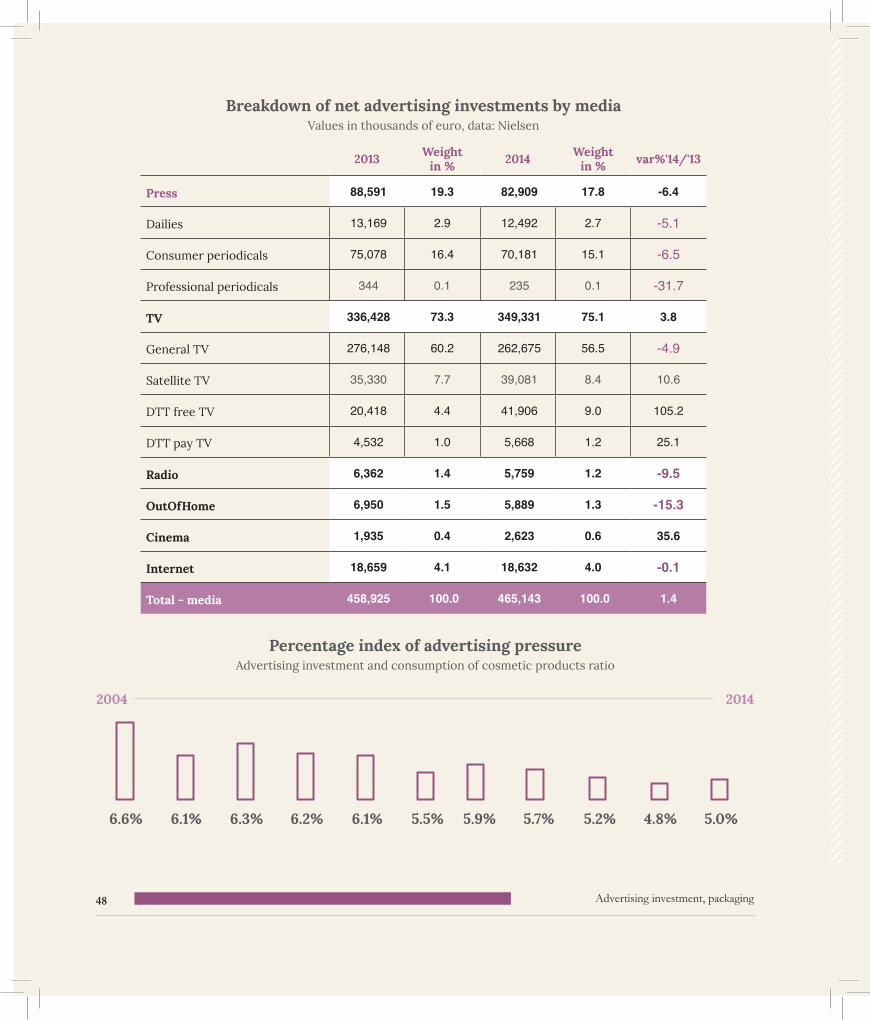
Advertising investment, packaging48
Values in thousands of euro, data: Nielsen
Advertising investment and consumption of cosmetic products ratio
Breakdown of net advertising investments by media
Percentage index of advertising pressure
2013 Weight in % 2014 Weight
in % var%'14/'13
Press 88,591 19.3 82,909 17.8 -6.4
Dailies 13,169 2.9 12,492 2.7 -5.1
Consumer periodicals 75,078 16.4 70,181 15.1 -6.5
Professional periodicals 344 0.1 235 0.1 -31.7
TV 336,428 73.3 349,331 75.1 3.8
General TV 276,148 60.2 262,675 56.5 -4.9
Satellite TV 35,330 7.7 39,081 8.4 10.6
DTT free TV 20,418 4.4 41,906 9.0 105.2
DTT pay TV 4,532 1.0 5,668 1.2 25.1
Radio 6,362 1.4 5,759 1.2 -9.5
OutOfHome 6,950 1.5 5,889 1.3 -15.3
Cinema 1,935 0.4 2,623 0.6 35.6
Internet 18,659 4.1 18,632 4.0 -0.1
Total - media 458,925 100.0 465,143 100.0 1.4
6.6% 6.1% 6.3% 6.2% 6.1% 5.5% 5.9% 5.7% 5.2% 4.8% 5.0%
2004 2014

Advertising investment, packaging 49
Distribution of advertising investment by product category
Distribution of advertising investment by media
Products for hair care 18.2%Products for face and body 32.6%Products for personal hygiene 13.0%Products for oral hygiene 6.9%Products for men 1.7%Perfume shops 23.0%Intimate hygiene 2.1%Company Campaigns Personal Care 2.5%
Press 17.8%Television 75.1%Radio 1.2%OutOfHome 1.3%Cinema 0.6%Internet 4.0%
18+33+13+7+2+23+2+2
18+75+1+1+1+4

Advertising investment, packaging50
2014
2010
Release of cosmetics in Italy: types, claims and packaging
Through the use of Mintel's database, it is now possible to outline the reference scenario with regard to cosmetic pro-ducts launched in Italy in 2014 (excluding prestige products) and the main claims featured on their packaging. Of nearly 3,400 total product launches (including colour variations), more than 14% related to nail varnishes, followed by the two other major make-up categories - lipsticks (13%) and eyeshadows (8%), all of which have failed in recent years to gain a significant market share in terms of consumption figures. The data relating to the type of launch for these products is key: as many as 70% of the total regards new products, while 21% are line extensions. New formulations represent just under 2%. In terms of claims, in Italy the most widely-used terms on cosmetics packaging relate to "green", envi-ronmentally-friendly connotations, the long-lasting nature of the product and its ability to moisturise/illuminate. On the wider international scene, it is interesting to note that reference to quick action and ethical/animal rights elements are both becoming more common, as well as the exponential spread of multifunctional cosmetics - BB, CC and DD creams and compacts above all.
Launch of cosmetic products in Italy (top 5)Source: Data by Mintel, processed by Cosmetica Italia Statistics Dept.
Nail varnishes11% 14%
Lipsticks12% 13%
Shadows8% 8%
Shower6% 7%
Body care6% 7%
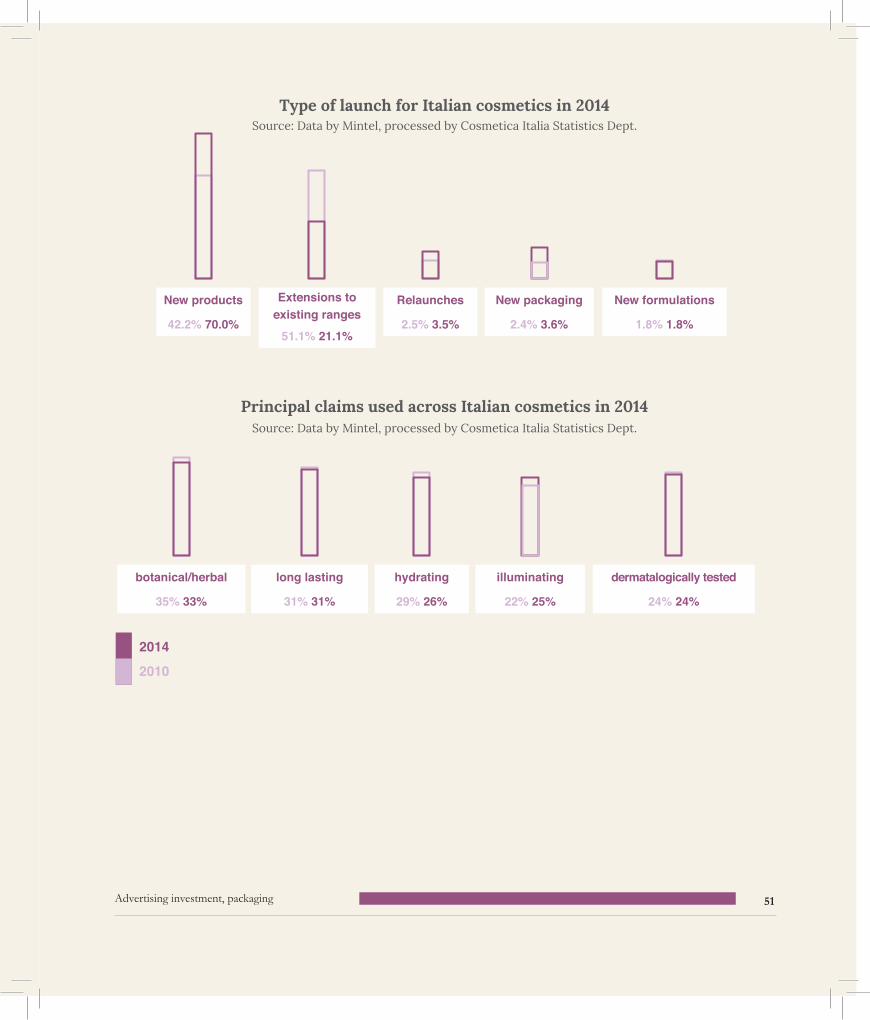
Advertising investment, packaging 51
Type of launch for Italian cosmetics in 2014
Principal claims used across Italian cosmetics in 2014
Source: Data by Mintel, processed by Cosmetica Italia Statistics Dept.
Source: Data by Mintel, processed by Cosmetica Italia Statistics Dept.
New products
42.2% 70.0%
botanical/herbal
35% 33%
Extensions to existing ranges
51.1% 21.1%
long lasting
31% 31%
Relaunches
2.5% 3.5%
hydrating
29% 26%
New packaging
2.4% 3.6%
illuminating
22% 25%
New formulations
1.8% 1.8%
dermatalogically tested
24% 24%
2014
2010

Advertising investment, packaging52
Launches of cosmetic products in 2014Data by Mintel (GNPD database), processed by Cosmetica Italia Statistics Dept.
United Kingdom 15,670
France 11,709
Germany 9,618
United States 8,183
Japan 4,919
Canada 4,724
Brazil 4,554
India 4,152
South Korea 3,864
Italy 3,388
rest of world 41,159
Total 111,940
Alphabet cream Launches 2014
BB 1,282
CC 1,206
DD 42
EE 5
Cushion Compact 49
Launches of BB creams throughout the world
n°
2010 292
2011 518
2012 1,052
2013 1,693
2014 1,282

Attached statistics 53
2004 2005 2006 2007 2008 2009 2010 2011 2012 2013 2014
Cosmetic products - total7,330.1 7,248.9 7,408.2 7,701.0 7,926.0 8,070.8 8,197.3 8,362.1 8,227.7 8,164.2 8,049.0
2.9% -1.1% 2.2% 4.0% 2.9% 1.8% 1.6% 2.0% -1.6% -0.8% -1.4%
Hair and scalp care1,186.9 1,183.0 1,168.4 1,174.0 1,196.0 1,206.6 1,185.3 1,177.1 1,157.0 1,139.8 1,103.9
1.5% -0.3% -1.2% 0.5% 1.9% 0.9% -1.8% -0.7% -1.7% -1.5% -3.1%
Products for face care1,078.4 1,109.2 1,152.9 1,198.6 1,213.1 1,223.5 1,242.7 1,263.4 1,251.3 1,251.3 1,247.0
4.8% 2.9% 3.9% 4.0% 1.2% 0.9% 1.6% 1.7% -1.0% 0.0% -0.3%
Products for make-up289.4 289.3 298.9 308.2 336.5 343.7 368.1 381.0 392.0 390.0 394.2
6.3% 0.0% 3.3% 3.1% 9.2% 2.1% 7.1% 3.5% 2.9% -0.5% 1.1%
Make-up packs45.6 51.2 52.6 35.4 37.4 33.2 39.3 47.7 46.4 48.3 48.9
5.3% 12.4% 2.7% -32.7% 5.5% -11.0% 18.1% 21.4% -2.6% 4.0% 1.3%
Products for eyes239.1 235.2 240.0 242.6 261.4 274.3 293.1 313.6 330.4 349.4 352.4
4.9% -1.7% 2.0% 1.1% 7.7% 4.9% 6.9% 7.0% 5.3% 5.7% 0.9%
Products for lip care302.1 288.3 279.2 273.6 271.0 280.0 281.0 286.7 285.2 279.0 272.0
3.0% -4.6% -3.1% -2.0% -1.0% 3.3% 0.3% 2.0% -0.5% -2.2% -2.5%
Products for hand care161.7 153.8 155.4 169.0 185.1 202.2 225.1 247.4 246.1 242.8 232.0
3.5% -4.9% 1.0% 8.7% 9.6% 9.2% 11.3% 9.9% -0.5% -1.4% -4.4%
Products for body care1,161.5 1,129.6 1,173.8 1,250.4 1,305.5 1,344.3 1,354.1 1.385,7 1,356.4 1,334.9 1,289.2
2.3% -2.8% 3.9% 6.5% 4.4% 3.0% 0.7% 2.3% -2.1% -1.6% -3.4%
Products for body hygiene1,018.6 1,008.5 1,019.8 1,051.4 1,065.4 1,090.6 1,092.9 1,113.1 1,087.8 1,065.9 1,050.3
-1.7% -1.0% 1.1% 3.1% 1.3% 2.4% 0.2% 1.8% -2.3% -2.0% -1.5%
Products for oral hygiene567.2 567.1 591.7 630.1 655.7 675.1 674.8 691.0 684.8 692.8 699.2
6.7% 0.0% 4.3% 6.5% 4.1% 3.0% 0.0% 2.4% -0.9% 1.2% 0.9%
Skin cleansing products for children74.5 113.2 117.9 132.4 148.6 155.4 157.3 157.5 153.6 147.6 142.6
-0.1% 51.9% 4.2% 12.3% 12.2% 4.6% 1.2% 0.1% -2.5% -3.9% -3.4%
Products for men279.0 210.6 212.1 219.0 220.4 217.5 212.8 207.0 192.2 179.4 167.6
6.2% -24.5% 0.8% 3.3% 0.6% -1.3% -2.1% -2.8% -7.1% -6.6% -6.6%
Alcohol-based perfume products851.4 833.5 860.7 918,0 929.7 919.5 957.6 973.9 940.8 926.2 939.9
4.3% -2.1% 3.3% 6.7% 1.3% -1.1% 4.1% 1.7% -3.4% -1.6% 1.5%
Gift packs 74.6 76.5 85.0 98.2 100.2 104.9 113.2 117,2 112.5 116.9 109.9
2.8% 2.5% 11.1% 15.5% 2.0% 4.7% 7.9% 3.5% -4.1% 4.0% -6.0%
Total cosmetic products on traditional channels - Historical values and annual percentage changesRetail prices VAT included - figures in millions of euro

Attached statistics54
2004 2005 2006 2007 2008 2009 2010 2011 2012 2013 2014
Total - direct sales386.5 399.5 407.3 410.3 432.7 441.0 473.8 491.0 502.0 524.3 539.0
4.7% 3.4% 1.9% 0.7% 5.5% 1.9% 7.4% 3.6% 2.3% 4.4% 2.8%
Door-to-door sales303.8 316.0 333.4 355.4 376.7 390.6 413.3 428.2 436.8 456.4 469.2
5.5% 4.0% 5.5% 6.6% 6.0% 3.7% 5.8% 3.6% 2.0% 4.5% 2.8%
Mail order sales82.7 83.5 73.9 54.9 56.0 50.4 60.5 62.8 65.3 67.9 69.8
1.7% 1.1% -11.5% -25.7% 2.0% -10.0% 20.0% 3.8% 4.0% 4.0% 2.8%
2004 2005 2006 2007 2008 2009 2010 2011 2012 2013 2014
Total - professional channels1,014.9 1,004.8 1,025.3 1,038.4 1,003.8 954.2 962.4 955.9 901.3 833.0 803.6
-1.7% -1.0% 2.0% 1.3% -3.3% -4.9% 0.9% -0.7% -5.7% -7.6% -3.5%
Sales to beauty institutes and beauticians
266.0 263.4 272.6 278.3 273.3 261.0 265.7 269.7 256.2 242.1 233.4
-2.5% -1.0% 3.5% 2.1% -1.8% -4.5% 1.8% 1.5% -5.0% -5.5% -3.6%
Hairdressing748.8 741.4 752.7 760.1 730.5 693.2 696.7 686.3 645.1 590.9 570.2
-1.4% -1.0% 1.5% 1.0% -3.9% -5.1% 0.5% -1.5% -6.0% -8.4% -3.5%
DIRECT AND PROFESSIONAL CHANNELS - Historical values and annual percentage changesRetail prices VAT included - figures in millions of euro
2004 2005 2006 2007 2008 2009 2010 2011 2012 2013 2014
Total - direct sales461.9 469.4 469.2 464.4 474.7 480.3 507.9 512.6 508.6 525.3 539.0
2.7% 1.6% -0.1% -1.0% 2.2% 1.2% 5.8% 0.9% -0.8% 3.3% 2.6%
Door-to-door sales363.1 371.3 384.1 402.3 413.2 425.4 443.1 447.0 442.4 457.3 469.2
3.5% 2.3% 3.4% 4.7% 2.7% 2.9% 4.1% 0.9% -1.0% 3.4% 2.6%
Mail order sales98.8 98.1 85.1 62.2 61.4 54.9 64.9 65.5 66.1 68.0 69.8
-0.2% -0.6% -13.3% -27.0% -1.2% -10.7% 18.2% 1.1% 0.9% 2.9% 2.6%
2004 2005 2006 2007 2008 2009 2010 2011 2012 2013 2014
Total - professional channels1,212.7 1,180.6 1,181.1 1,175.5 1,101.1 1,039.2 1,031.7 998.0 913.0 834.7 803.6
-3.5% -2.6% 0.0% -0.5% -6.3% -5.6% -0.7% -3.3% -8.5% -8.6% -3.7%
Sales to beauty institutes and beauticians
317.9 309.5 314.0 315.0 299.8 284.2 284,8 281.5 259.5 242.6 233.4
-4.3% -2.7% 1.5% 0.3% -4.8% -5.2% 0.2% -1.2% -7.8% -6.5% -3.8%
Hairdressing894.8 871.2 867.1 860.4 801.3 754.9 746.9 716.5 653.5 592.1 570.2
-3.2% -2.6% -0.5% -0.8% -6.9% -5.8% -1.1% -4.1% -8.8% -9.4% -3.7%
DIRECT AND PROFESSIONAL CHANNELS - Actual values and annual percentage changesRetail prices VAT included - figures in millions of euro

Attached statistics 55
2004 2005 2006 2007 2008 2009 2010 2011 2012 2013 2014
Total - exports2,003.8 2,143.7 2,274.2 2,296.7 2,328.3 2,053.9 2,403.2 2,671.0 2,860,7 3,177.7 3,333.7
10.0% 7.0% 6.1% 1.0% 1.4% -11.8% 17.0% 11,1% 7.1% 11.1% 4.9%
Products for hair care293.6 294.8 332.5 365.1 401.0 395.5 467.1 531.8 587.2 626.7 667.5
7.3% 0.4% 12.8% 9.8% 9.8% -1.4% 18.1% 13.9% 10.4% 6.7% 6.5%
Products for make-up285.1 309.0 323,6 350.5 396.8 318.9 364.9 407.7 480.7 530.6 597.8
8.5% 8.4% 4.7% 8.3% 13.2% -19.6% 14.4% 11.7% 17.9% 10.4% 12.7%
Products for body care444.6 505.0 541.9 516.2 468.7 422.8 492.7 523.0 539.6 565.0 570.4
16.3% 13.6% 7.3% -4.7% -9.2% -9.8% 16.5% 6.1% 3.2% 4.7% 1.0%
Personal cleansing220.4 208.4 252.7 261.5 271.2 247.3 243.5 261.9 262.9 337.3 355.3
-1.5% -5.5% 21.3% 3.5% 3.7% -8.8% -1.5% 7.6% 0.4% 28.3% 5.3%
Oral hygiene67.6 63.7 64.3 54.3 46.8 91.4 98.6 113.3 116.7 149.2 162.1
-0.9% -5.8% 1.0% -15.5% -13.8% 95.2% 7.9% 14.9% 3.0% 27.9% 8.7%
Products for men36.4 36.1 38.2 40.7 42.2 41.2 44.7 49.3 47.5 40.1 45.3
11.3% -0.8% 5.9% 6.5% 3.7% -2.4% 8.6% 10.3% -3.7% -15.6% 12.9%
Alcohol-based perfume products559.1 636.8 627.5 611.7 603.7 456.1 604.6 692.8 733.7 820.5 817.7
15.8% 13.9% -1.5% -2.5% -1.3% -24.4% 32.5% 14.6% 5.9% 11.8% -0.3%
Other products97.0 90.0 93.5 96.5 97.9 80.6 87.0 91.2 92.3 108.3 117.6
0.7% -7.2% 3.9% 3.2% 1.4% -17.6% 7.9% 4.8% 1.2% 17.3% 8.6%
DEVELOPMENTS IN EXPORTS OF ITALIAN COSMETICS THROUGHOUT THE WORLDHistorical values and annual percentage changes - Values in millions of euro, data from ISTAT
DEVELOPMENTS IN IMPORTS OF ITALIAN COSMETICS THROUGHOUT THE WORLDHistorical values and annual percentage changes - Values in millions of euro, data from ISTAT
2004 2005 2006 2007 2008 2009 2010 2011 2012 2013 2014
Total - exports1,283.7 1,369.1 1,452.6 1,514.7 1,581.3 1,409.5 1,576.9 1,659.7 1,626.1 1,652.7 1,685.3
2.2% 6.7% 6.1% 4.3% 4.4% -10.9% 11.9% 5.3% -2.0% 1.6% 2.0%
Products for hair care201.7 217.2 240.8 230.5 234.7 220.3 216.1 236.9 220.2 219.3 225.2
-4.9% 7.7% 10.9% -4.3% 1.8% -6.1% -1.9% 9.6% -7.1% -0.4% 2.7%
Products for make-up130.2 144.6 147.6 155.2 144.1 144.3 173.2 195.9 219.0 217.7 223.8
-10.9% 11.1% 2.0% 5.2% -7.2% 0.1% 20.1% 13.1% 11.8% -0.6% 2.8%
Products for body care404.8 430.2 464.9 504.1 537.3 469.7 517.8 529.4 522.8 543.3 552.3
11.9% 6.3% 8.0% 8.4% 6.6% -12.6% 10.2% 2.3% -1.2% 3.9% 1.7%
Personal hygiene111.8 110.9 127.9 132.5 143.7 119.6 121.6 129.7 124.3 130.4 126.0
-14.2% -0.8% 15.3% 3.6% 8.5% -16.8% 1.6% 6.7% -4.1% 4.9% -3.4%
Oral hygiene84.5 88.4 93.9 96.8 119.9 108.7 115.4 130.2 126.6 146.0 125.9
4.6% 4.6% 6.2% 3.1% 23.9% -9.3% 6.1% 12.9% -2.8% 15.3% -13.8%
Products for men27.4 31.3 28.1 30.9 25.8 23.5 23.4 22.8 22.0 18.9 20.5
-10.0% 14.5% -10.5% 10.1% -16.6% -9.0% -0.2% -2.6% -3.6% -14.1% 8.8%
Alcohol-based perfume products261.9 291.2 299.9 310.8 328.6 278.5 359.2 374.1 349.7 336.0 372.4
10.2% 11.2% 3.0% 3.6% 5.7% -15.2% 29.0% 4.2% -6.5% -3.9% 10.8%
Other products61.3 55.3 49.7 53.9 47.3 44.9 50.3 40.7 41.4 41.1 39.3
8.7% -9.9% -10.1% 8.5% -12.3% -5.1% 11.9% -19.0% 1.8% -0.9% -4.2%

Designed by