bcg matrix and product life cycle (1)final
TRANSCRIPT
Which aspects do you think these companies ignored?????
Product Portfolio
It shows the range of products a company has in development or available for consumers at any one time.
Product Portfolio
It shows the stages that products go through from development to withdrawal from the market
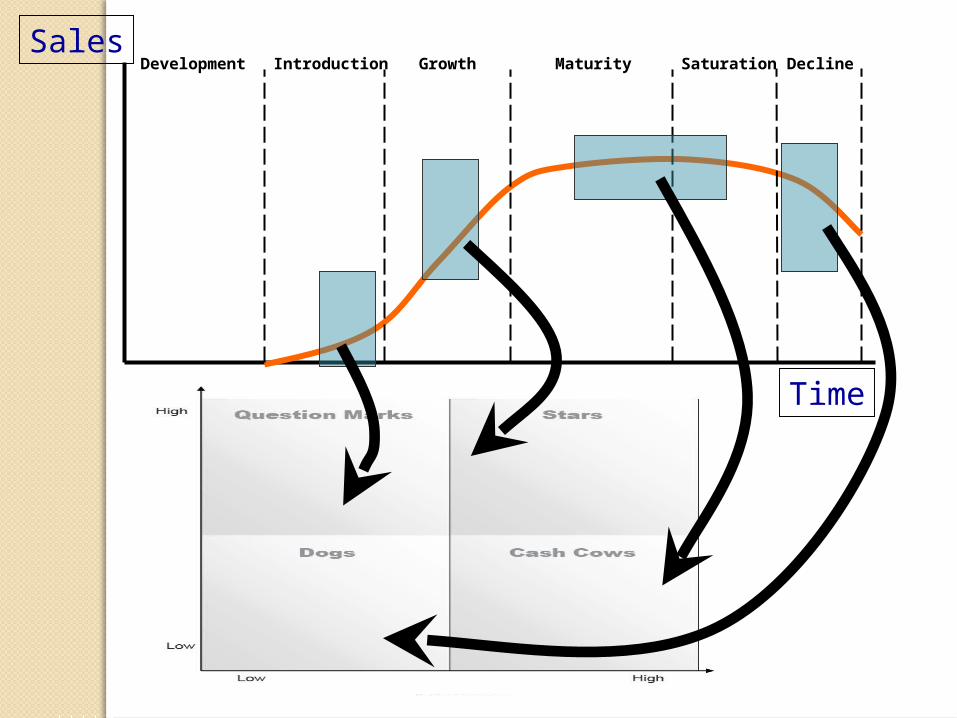
Product Life Cycle (PLC)
Product sales pass through distinct stages, each posing different challenges, opportunities, and problems to the seller
Contributes to strategic marketing planning
Products require different marketing, financial, manufacturing, purchasing, and human resource strategies in each life cycle stage.
May help in forecasting and managing cash flow
Profits rise and fall at different stages of product life cycle
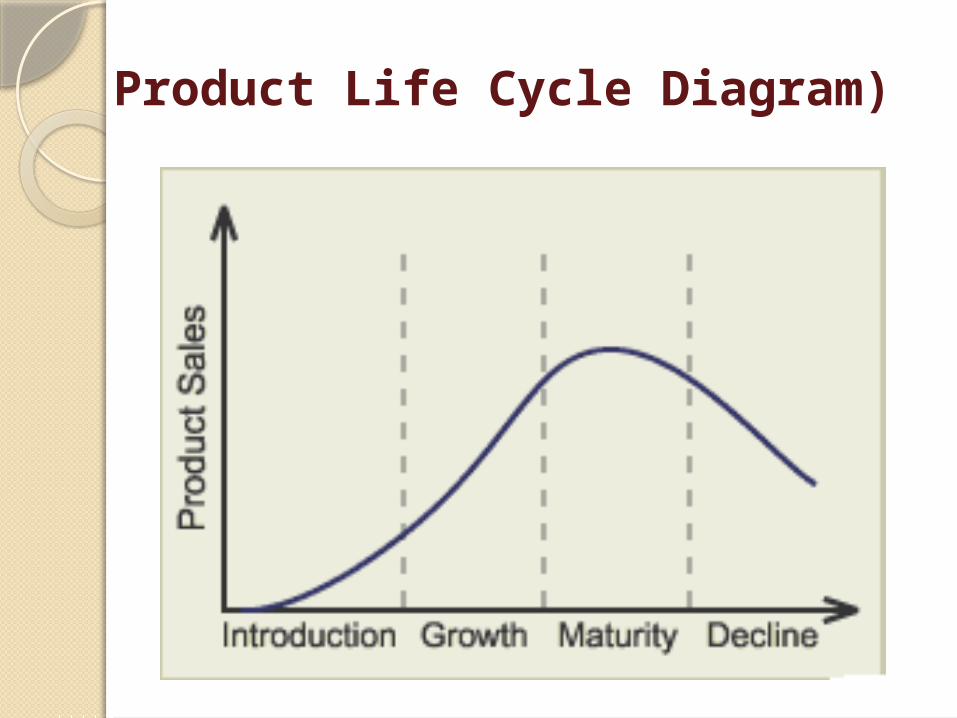
Product Life Cycle Diagram)

Introduction Stage
Slow sales volumes to startDemand has to be createdCustomers have to be prompted to try the
productMakes no money at this stage
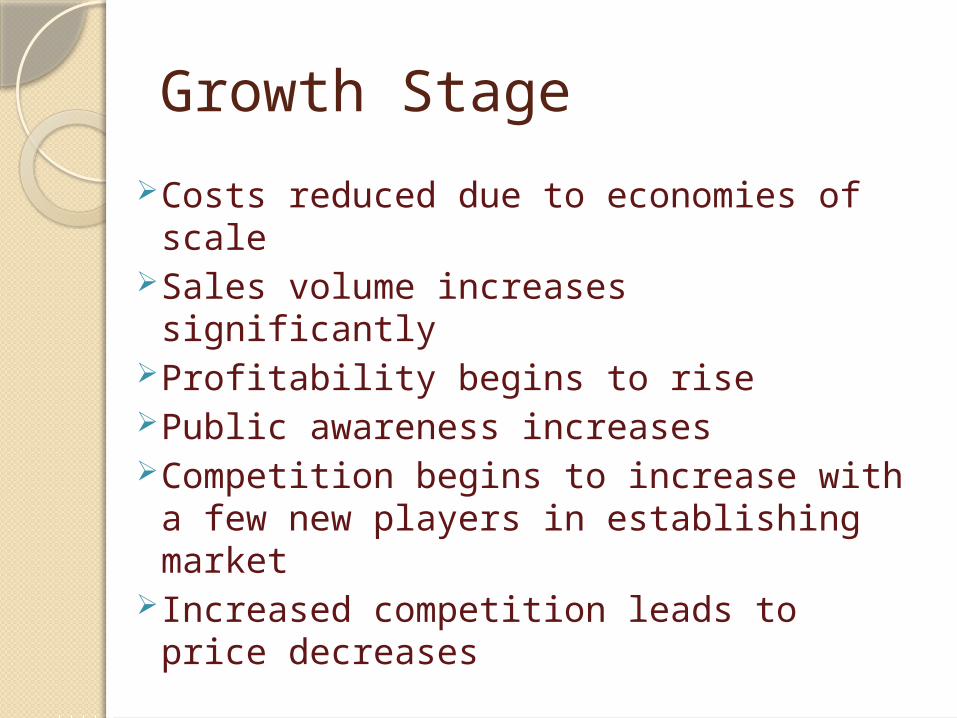
Growth Stage
Costs reduced due to economies of scaleSales volume increases significantlyProfitability begins to risePublic awareness increasesCompetition begins to increase with a few
new players in establishing marketIncreased competition leads to price
decreases
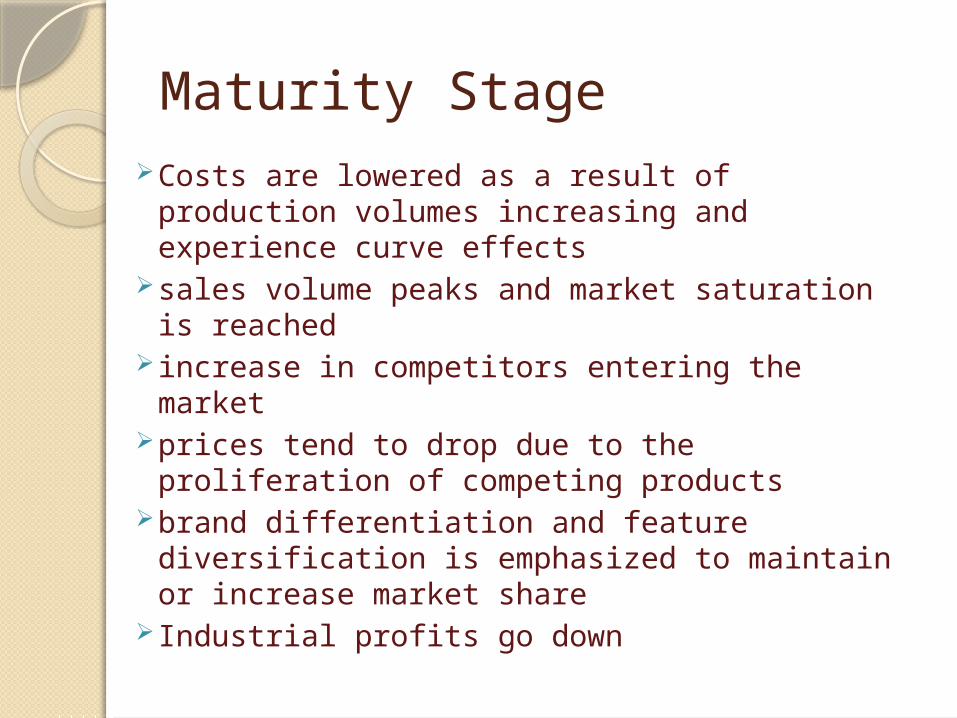
Maturity Stage Costs are lowered as a result of production
volumes increasing and experience curve effects sales volume peaks and market saturation is
reached increase in competitors entering the market prices tend to drop due to the proliferation of
competing products brand differentiation and feature diversification is
emphasized to maintain or increase market share Industrial profits go down
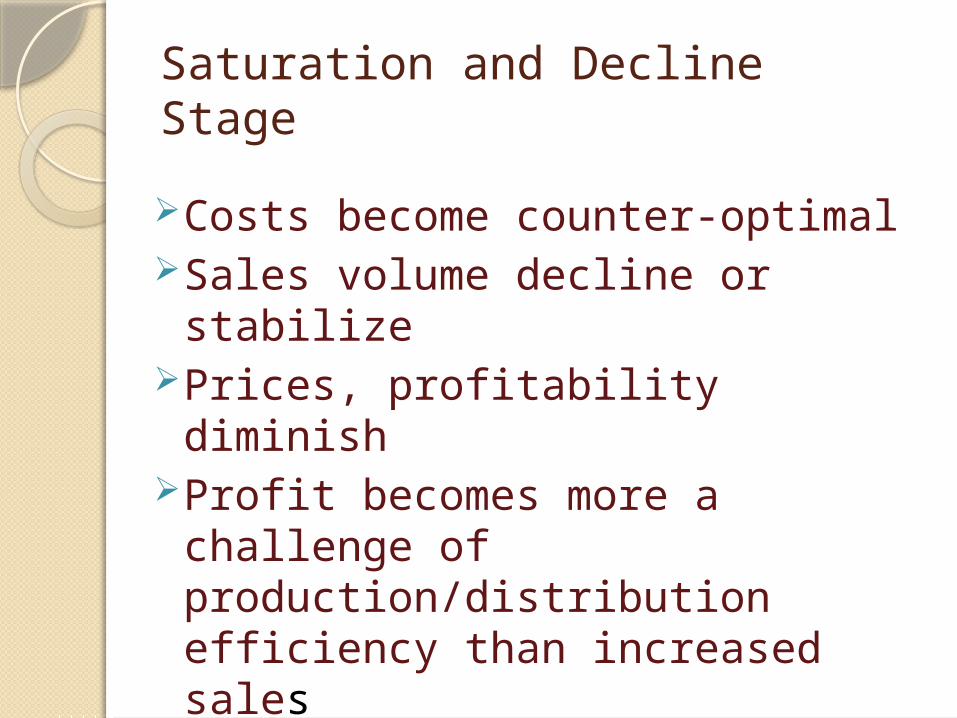
Saturation and Decline Stage
Costs become counter-optimalSales volume decline or stabilizePrices, profitability diminishProfit becomes more a challenge of
production/distribution efficiency than increased sales
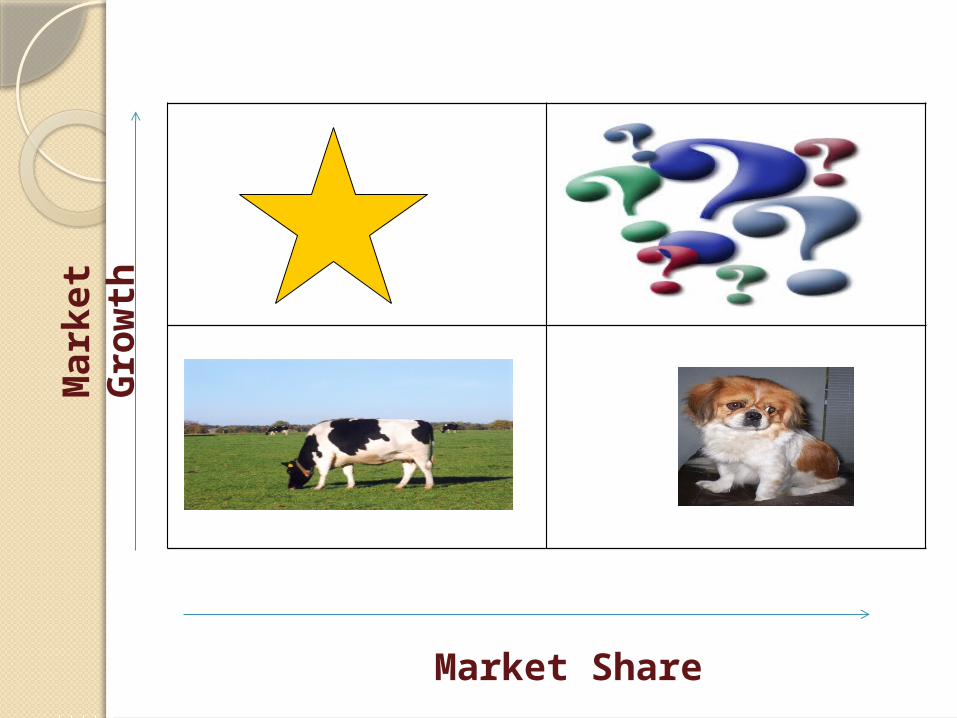
Market Share
Mar
ket
Gro
wth
BCG Matrix:- Boston Consulting Group analysis
Created by Bruce Henderson in 1968
Introduction
BCG Matrix is also known as :o Portfolio Evaluation Matrixo Growth Share Matrixo Strategic Business Unit Analysis
Usage of BCG Matrix:o Provides a frame work for allocation of resources among different business unit.o Allows one to compare many business units at a glance
STARSHigh growth, High market share
Stars are leaders in business.
They also require heavy investment, to maintain its large market share.
It leads to large amount of cash consumption and cash generation.
They are foundation of the company
and often the stars of yesterday.
They generate more cash than required.
They extract the profits by investing as little cash as possible
CASH COWSLOW GROWTH, HIGH MARKET SHARE
Most businesses start of as question marks.
They will absorb great amounts of cash if the market share remains unchanged, (low).
Why question marks? Question marks have potential to become star and eventually cash cow but can also become a dog.
Investments should be high for question marks.
QUESTION MARKSHIGH GROWTH, LOW MARKET SHARE
Dogs do not have potential to bring in much cash.
Number of dogs in the company should be minimized.
Business is situated at a declining
stage.
DOGSLOW GROWTH, LOW MARKET SHARE
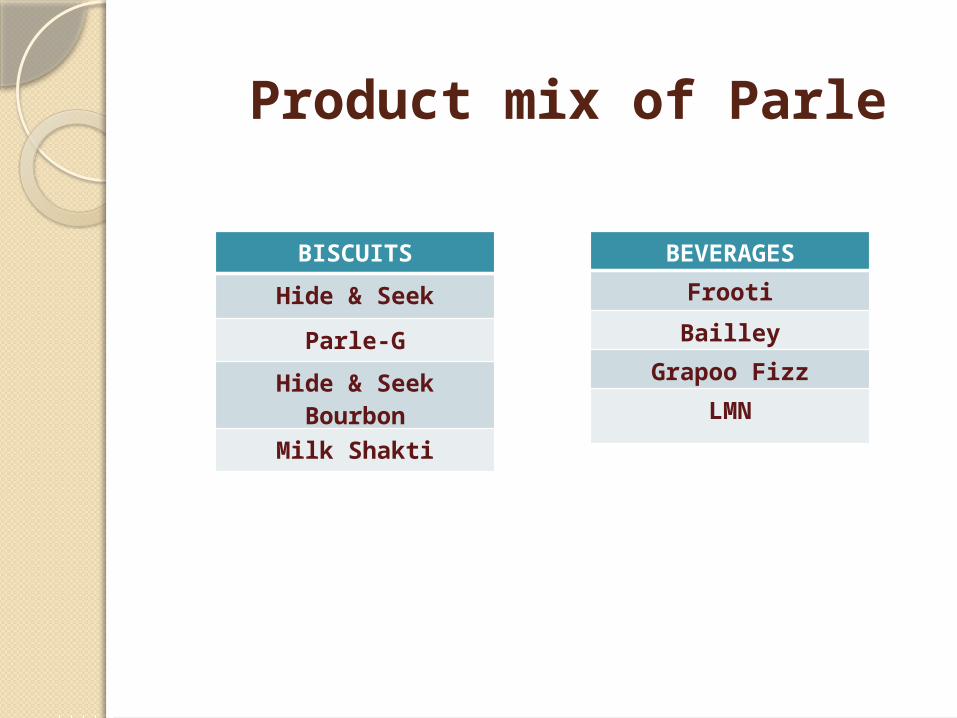
Product mix of Parle
BISCUITS
Hide & Seek
Parle-G
Hide & Seek Bourbon
Milk Shakti
BEVERAGES
Frooti
Bailley
Grapoo Fizz
LMN
Market Share
Mar
ket
Gro
wth
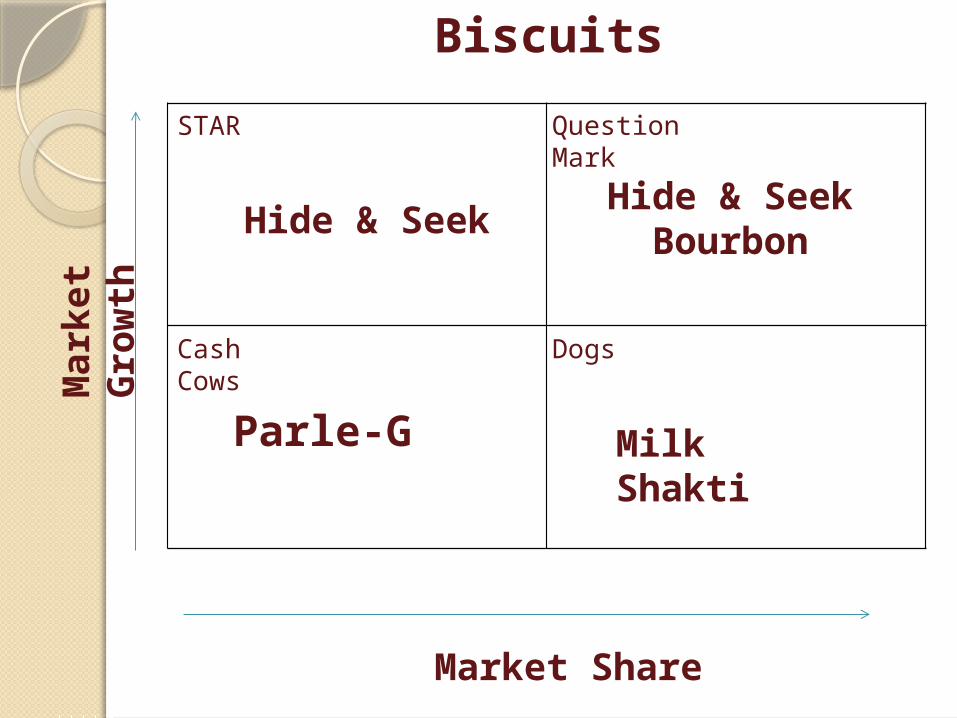
STAR Question Mark
DogsCash Cows
Hide & SeekHide & Seek
Bourbon
Milk ShaktiParle-G
Biscuits
Market Share
Mar
ket
Gro
wth
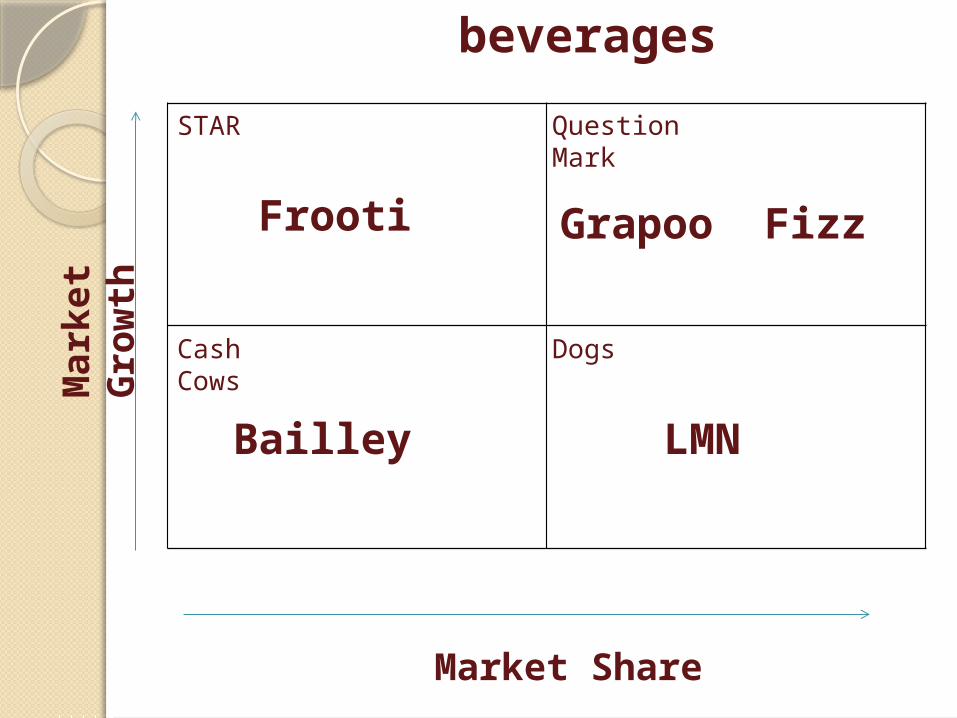
STAR Question Mark
DogsCash Cows
Frooti Grapoo Fizz
LMNBailley
beverages
Sales
Time
Development Introduction Growth Maturity Saturation Decline
benefits
BCG MATRIX is simple and easy to understand. It helps you to quickly and simply screen the opportunities
open to you, and helps you think about how you can make the most of them.
It is used to identify how corporate cash resources can best be used to maximize a company’s future growth and profitability.
limitations
BCG MATRIX uses only two dimensions, Relative market share and market growth rate.
Problems of getting data on market share and market growth.
High market share does not mean profits all the time. Business with low market share can be profitable too.

Thank You