bbp.dau.milbbp.dau.mil/docs/life-cycle sustainment plan--sample ou… · web viewlife-cycle...
TRANSCRIPT

LIFE-CYCLE SUSTAINMENT PLAN
Sample Outline
August 10, 2011Version 1.0
1
MANDATED FORMAT FOR ALLLIFE-CYCLE SUSTAINMENT PLANS
PROGRAM NAME – ACAT LEVEL
LIFE-CYCLE SUSTAINMENT PLAN
VERSION ___
SUPPORTING MILESTONE _AND
[APPROPRIATE PHASE NAME]
[DATE]
***********************************************************************************
OFFICE OF THE SECRETARY OF DEFENSE (OSD) APPROVAL
_______________________________________________ _________________________
Date
Assistant Secretary of Defense(Logistics & Materiel Readiness)
2

SUBMITTED BY
__________________________
Name
Product Support Manager
__________
Date
REVIEW
__________________________
Name
Program Contracting Officer
__________
Date
__________________________
Name
Program Manager
_________
Date
__________________________
Name
Program Lead Engineer
__________
Date
__________________________
Name
Program Financial Manager
_________
Date
CONCURRENCE
__________________________
Name
Program Executive Officer or Equivalent
__________
Date
__________________________
Name
Sustainment Command Representative
_________
Date
COMPONENT APPROVAL (ACAT IC)
_____________________________ _______
Name Date
DoD Component Acquisition Executive (CAE) or designated representative
3

Table of Contents1 Introduction 8
2 Product Support Performance 9
2.1 Sustainment Performance Requirements.....................................................................................................9
2.2 Demonstrated (tested) Sustainment Performance.....................................................................................10
3 Product Support Strategy 12
3.1 Sustainment Strategy Considerations........................................................................................................15
3.2 Sustainment Relationships.........................................................................................................................16
4 Product Support Arrangements 17
4.1 Contracts....................................................................................................................................................17
4.2 Performance Based Agreements (PBA).....................................................................................................18
5 Product Support Package Status 19
5.1 Program Review Results............................................................................................................................19
5.2 Product Support Package Assessment......................................................................................................19
6 Regulatory/Statutory Requirements That Influence Sustainment Performance 21
7 Integrated Schedule 22
8 Funding 24
9 Management 26
9.1 Organization...............................................................................................................................................26
9.1.1 Government Program Office Organization.........................................................................................26
9.1.2 Program Office Product Support Staffing Levels...............................................................................26
9.1.3 Contractor(s) Program Office Organization.......................................................................................27
9.1.4 Product Support Team Organization.................................................................................................27
9.2 Management Approach..............................................................................................................................29
9.2.1 Product Support Manager Roles and Responsibilities.......................................................................29
9.2.2 Sustainment Risk Management.........................................................................................................29
10 Supportability Analysis 31
10.1 Design Interface.....................................................................................................................................31
10.1.1 Design Analysis.................................................................................................................................31
10.1.2 Technical Reviews.............................................................................................................................34
10.2 Product Support Element Determination................................................................................................35
10.3 Sustaining Engineering..........................................................................................................................37
11 Additional Sustainment Planning Factors 38
LCSP Annexes 38
4

List of Tables
Table 2-1: Sustainment Performance Requirements (Mandated) (NOTIONAL).......................................................9Table 2-2: Sustainment Performance Metric Breakdown (Mandated) (NOTIONAL)..............................................10Table 2-3: Sustainment Performance Assessment/Test Results (Mandated) (NOTIONAL)..................................11Table 3-1: Product Support Strategy for Reference Design Concept (Mandated) (NOTIONAL)............................13Table 3-2: Sustainment Cost Drivers (Mandated) (NOTIONAL).............................................................................15Table 4-1: Performance Based Arrangements Implemented in Contracts (Mandated) (NOTIONAL)....................18Table 4-2: Performance Based Agreements (Organic Support Providers) (Mandated).........................................18Table 5-1: Program Review Results (Mandated) (NOTIONAL)..............................................................................19Table 5-2: Product Support Package Assessment (Mandated) (NOTIONAL)........................................................20Table 6-1: Sustainment Alignment of Regulatory/Statutory Requirements (Mandated) (NOTIONAL)...................21Table 8-1: Product Support Funding Summary......................................................................................................25Table 9-1: IPT Team Details (Mandated) (NOTIONAL)..........................................................................................28Table 9-2: Risk Summary (Mandated)....................................................................................................................30Table 10-1: FMECA Summary (Mandated) (NOTIONAL).......................................................................................32Table 10-2: Reliability Growth Plan Issues (Mandated) (NOTIONAL)....................................................................32Table 10-3: Completed Supportability Trades (Mandated) (NOTIONAL)...............................................................33Table 10-4: Planned Supportability Trades (Mandated) (NOTIONAL)...................................................................34Table 10-5: Technical Reviews (Mandated) (NOTIONAL)......................................................................................35Table 10-6: Product Support Analytical Methods and Tools (Mandated) (NOTIONAL)..........................................36Table 10-7: Sustainment Performance Monitoring (Mandated) (NOTIONAL)........................................................37
List of Figures
Figure 3-1: Sample Drawing of the Reference Design Concept (Optional) (NOTIONAL)......................................12Figure 3-2: Sustainment Concept (Mandated) (NOTIONAL)..................................................................................14Figure 3-3: Product Support Providers (Mandated) (NOTIONAL)..........................................................................16Figure 7-1: Product Support Schedule (Mandated) (NOTIONAL)..........................................................................23Figure 9-1: Program Office Organization (Mandatory) (NOTIONAL)......................................................................26Figure 9-2: Program Product Support Staffing (Mandated) (NOTIONAL)..............................................................27
(Additional, optional tables and figures may be included at the Program’s or the Component’s discretion)
5

General Expectations:
The Life-Cycle Sustainment Plan (LCSP) is the program’s primary management tool to satisfy the Warfighter’s sustainment requirements through the delivery of a product support package. Development of a life-cycle product support strategy and plan are critical steps in the delivery of the product support package. The LCSP remains an active management tool throughout the operations and sustainment of the system, and the program must continually update the LCSP to ensure sustainment performance satisfies the Warfighter’s needs.
Requirements
Product Support Strategy
Product Support Plan
Product Support Package*
MaterielAvailability
Life-Cycle Sustainment Plan
*The logistics elements and any sustainment process contracts/agreements to attain and sustain the maintenance and support needed for materiel availability
The contents of this annotated outline are applicable DoD-wide and are intended to stimulate critical thinking about the necessary product support elements required for an effective plan. The program may include, in the annex section, any additional Service-specific requirements and implementation details it deems critical to the delivery of the product support package. NOTE: If, as a Program Manager or Product Support Manager and author of an LCSP, you are inclined to cut-and-paste portions of this outline into your plan in a boiler-plate effort to satisfy your next milestone review, you will NOT satisfy the spirit or intent of this outline.
The LCSP is expected to evolve throughout the acquisition process with the maturity of the system and clarity for the program’s life-cycle product support strategy. Additionally, it may be tailored based on varying entry points in the acquisition process. For example, a new system entering the acquisition process at Milestone C (a COTS capability, for instance) may have minimal requirements to consider in accomplishing Table 3-5 and the statutory and regulatory compliance of Table 6-10.
6

The primary audience for the LCSP is the program office. This annotated outline is structured to enable the program office to communicate and collaborate with other stakeholders in both the acquisition and sustainment communities. The program’s logisticians, led by the Product Support Manager, must collaborate with other functional areas to ensure alignment among the LCSP and other critical program documents, including the Acquisition Strategy, Systems Engineering Plan, and Technical Data Rights Strategy. The Sustainment Quad Chart is the primary vehicle for summarizing the program’s product support planning to stakeholders outside the program. The LCSP must support and provide the detail behind the summary information presented on the Sustainment Quad Chart.
Among the key stakeholders are the Product Support Integrators and Providers. The LCSP is a useful tool in defining statements of work, performance objectives, and incentives in requests for proposal, contracts, and performance-based agreements with organic support providers.
NOTIONAL INFORMATION: Tables and figures are provided with notional information. This information is illustrative only and not intended to proscribe or constrain the program office in documenting information it deems essential to its plan. The column headings for tables depict the minimum information required, but programs may add information to suit its unique management needs. Text to amplify information in figures and tables is encouraged to provide clarity.
Additional guidance, including the lessons learned, can be found in Section 5.1.2.2 of the Defense Acquisition Guide. The latest formats (including examples) for the various tables and figures can be found on the LCSP web site (HOT LINK).
7

1 Introduction
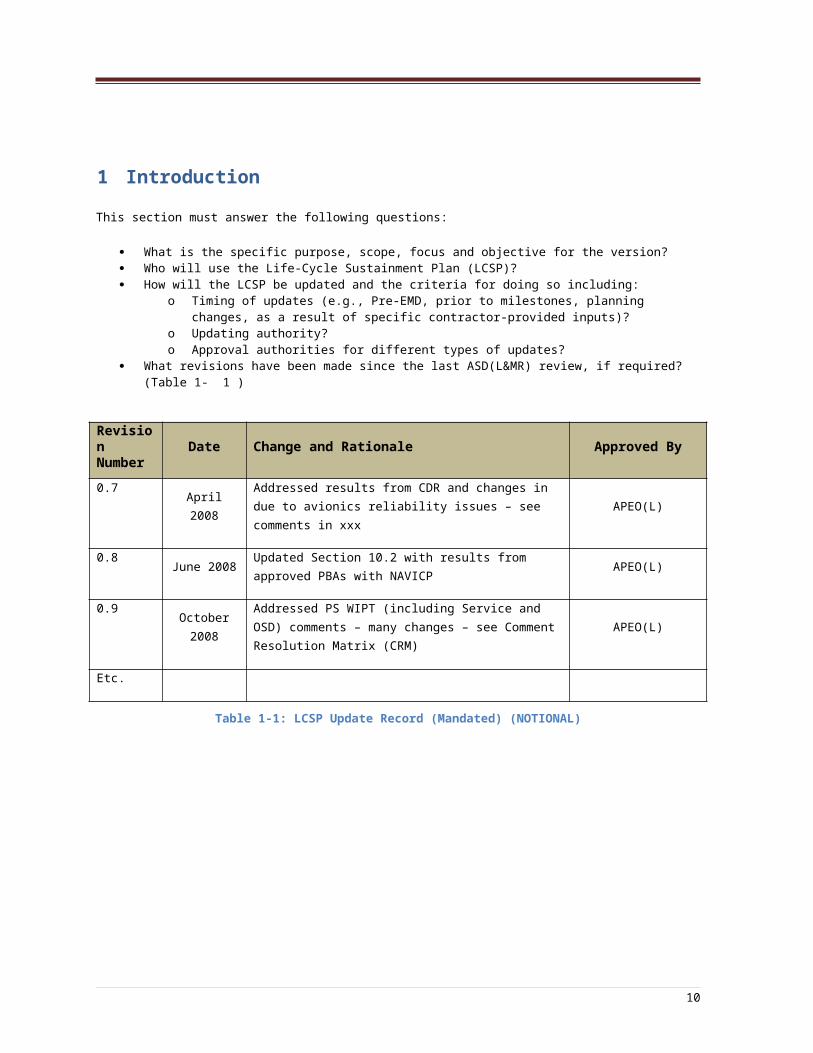
This section must answer the following questions:
What is the specific purpose, scope, focus and objective for the version? Who will use the Life-Cycle Sustainment Plan (LCSP)? How will the LCSP be updated and the criteria for doing so including:
o Timing of updates (e.g., Pre-EMD, prior to milestones, planning changes, as a result of specific contractor-provided inputs)?
o Updating authority? o Approval authorities for different types of updates?
What revisions have been made since the last ASD(L&MR) review, if required? (Table 1-1)
Revision Number Date Change and Rationale Approved By
0.7April 2008
Addressed results from CDR and changes in due to avionics reliability issues – see comments in xxx
APEO(L)
0.8June 2008
Updated Section 10.2 with results from approved PBAs with NAVICP
APEO(L)
0.9October
2008
Addressed PS WIPT (including Service and OSD) comments – many changes – see Comment Resolution Matrix (CRM)
APEO(L)
Etc.
Table 1-1: LCSP Update Record (Mandated) (NOTIONAL)
8

2 Product Support Performance
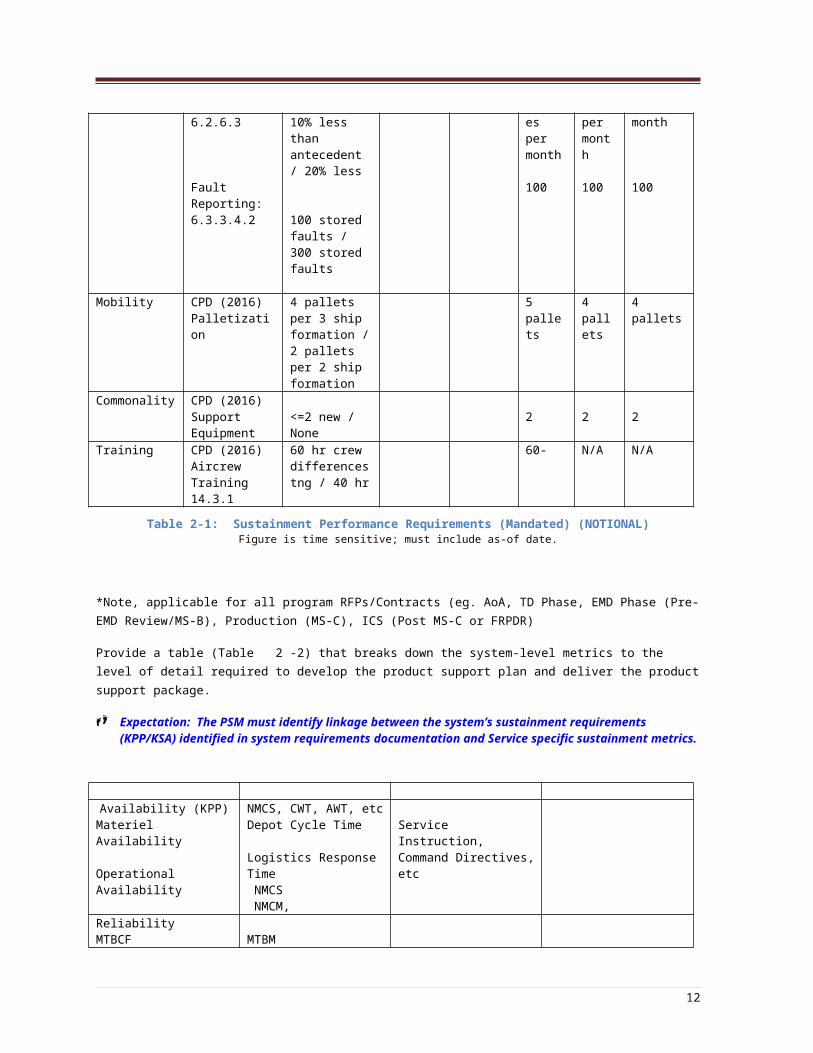
2.1 Sustainment Performance Requirements Provide a table (Table 2-1) that lists the sustainment requirements that are integrated into the design process. Identify where each requirement is satisfied in product support arrangements (contractor and/or organic processes) and the corresponding performance metrics.
Expectation: The PSM must identify all explicit, implicit or derived sustainment requirements, references to RFPs or contracts in which the metric is used to manage sustainment performance, the planned evaluation timeframe, and expected time frame for achieving the threshold/objective. (Note: This list should be more extensive than Table 3-5 which identifies only sustainment cost drivers).
Requirement(KPP, KSA,
Derived requirement)
Documentation
Threshold / Objective
RFP/Contract*
TES / TEMP IOC FOC Full
Fielding
Availability (KPP)
CDD (May 24, 2014): 6.2.6.1 66% / 82%
RFP (Jun 16, 2014)Para 7.2
TEMP (2 Jun 2015): 3.2
100% 100% 72%
Reliability (KSA)
CPD (Aug 16, 2016): 6.2.6MTBF-I: 6.3.2.1False Alarm: 6.3.22MTBM: 6.3.2.5
37.8% / 61.6%
2% / 1%
2 hrs / 4 hours
37%
2%
2 hrs
48.7%
2%
2 hrs
51%
2%
3 hrs
Maintainability CPD (Aug 16, 2016)BIT: 6.3.3.4
Scheduled Maintenance:6.2.6.3
Fault Reporting: 6.3.3.4.2
100% critical faults at system start (T = O)
10% less than antecedent / 20% less
100 stored faults / 300 stored faults
100%
300 minutes per month
100
100%
240 minper month
100
100%
240 min per month
100
Mobility CPD (2016)Palletization
4 pallets per 3 ship formation / 2 pallets per 2 ship formation
5 pallets
4 pallets
4 pallets
Commonality CPD (2016)Support Equipment
<=2 new / None
2 2 2
Training CPD (2016)Aircrew
60 hr crew differences
60- N/A N/A
9
Training 14.3.1 tng / 40 hr
Table 2-1: Sustainment Performance Requirements (Mandated) (NOTIONAL)Figure is time sensitive; must include as-of date.
*Note, applicable for all program RFPs/Contracts (eg. AoA, TD Phase, EMD Phase (Pre-EMD Review/MS-B), Production (MS-C), ICS (Post MS-C or FRPDR)
Provide a table (Table 2-2) that breaks down the system-level metrics to the level of detail required to develop the product support plan and deliver the product support package.
Expectation: The PSM must identify linkage between the system’s sustainment requirements (KPP/KSA) identified in system requirements documentation and Service specific sustainment metrics.
Requirement Lower Level Metric Documentation Standard or LevelAvailability (KPP)
Materiel Availability
Operational Availability
NMCS, CWT, AWT, etcDepot Cycle Time
Logistics Response Time NMCS NMCM,
Service Instruction, Command Directives, etc
ReliabilityMTBCF MTBMO&S CostsAffordability Operating Cost per Unit *Maintainability Maintenance Manhour
per Flight HourMean Down TimeAll Others
Table 2-2: Sustainment Performance Metric Breakdown (Mandated) (NOTIONAL)
Include as-of date* Consistent with the Affordability Requirement
2.2 Demonstrated (tested) Sustainment PerformanceFor each sustainment metric in Table 2-1 provide a table (Table 2-3) of sustainment assessments and tests including: Operational Assessments, Development Tests, Operational Evaluations, Reliability Growth Tests, and Logistics Demonstrations. Data in this table must map to the Test and Evaluation Strategy (TES), Test and Evaluation Master Plan (TEMP) and SEP. For each performance metric provide the following information, with an as-of date:
Design Feature Location in design specification/contract When and how demonstrated Impacted product support (PS) element Planned metric value upon which the product support strategy/package is based Demonstrated performance measure and gap to requirement Current estimate at IOC
Note: Ensure the demonstrated performance measures are consistent with the required metrics identified in Table 2-1; include key sustainment assumptions as appropriate.
10

Demonstrated (tested) Sustainment Performance Jan 10, 2009
Metric /Feature
Contractual Requirements
DemonstrationSchedule
Requirement /PS Elements
Impacted
Performance Objective /
PS Package Baseline Value
Estimated Value / IOC Estimate
Low observable coating on external surfaces XXX
Maintainability Demo 1st Qtr 2011
Maintenance,Training, Facilities,
Publications
Repair 1 sq ft area in 4 hours
IOT&E tested value: 7 hr / 5 hours projected at IOC
ISR system Reliability of .01 failures/operating hour
XXX Reliability Growth Curve from the SEP
Maintenance, Spares
.15 failures/operating hour
0.5 failures/operating hour 0.25 failures/operating hour @ IOC
All maintenance at operational sites performed within a 15 ft ceiling
XXX Maintainability Demo 1st Qtr 2011
Facilities 15 Feet 14 Ft/ 14 Ft
Table 2-3: Sustainment Performance Assessment/Test Results (Mandated) (NOTIONAL)Figure is time sensitive; must include as-of date.
11
3 Product Support Strategy
Expectation: Planning for product support begins at system initiation and builds on system information documented in other requirements and acquisition deliverables available, such as the AoA, RAM-C Rationale Report, CONOPS, and CDD. The program should include opportunities to improve its product support over the antecedent system.
Provide the product’s standard reference design concept (see TDS/AS) showing major subsystems and features (Figure 3-1). The figure must be consistent with the program’s work breakdown structure. More than one drawing may be needed to illustrate the major features affecting product support.
Figure 3-1: Sample Drawing of the Reference Design Concept (Optional) (NOTIONAL)
Provide a table (Table 3-4) listing the following sustainment strategy elements:
Sustainment concept, (maintenance (including software support) and other major supply chain elements) Roles and responsibilities Plans for acquisition of technical data rights
Expectation: This table develops incrementally throughout the acquisition process. Prior to Milestone A, the table might only be completed to the second level of the program WBS, with additional levels included to convey the strategy at its current level of development. While specific facilities or providers may not be known this early in the life cycle, the program must develop sufficient detail to identify technical data rights provisions in its contracting actions and Technical Data Rights Strategy.
12

13
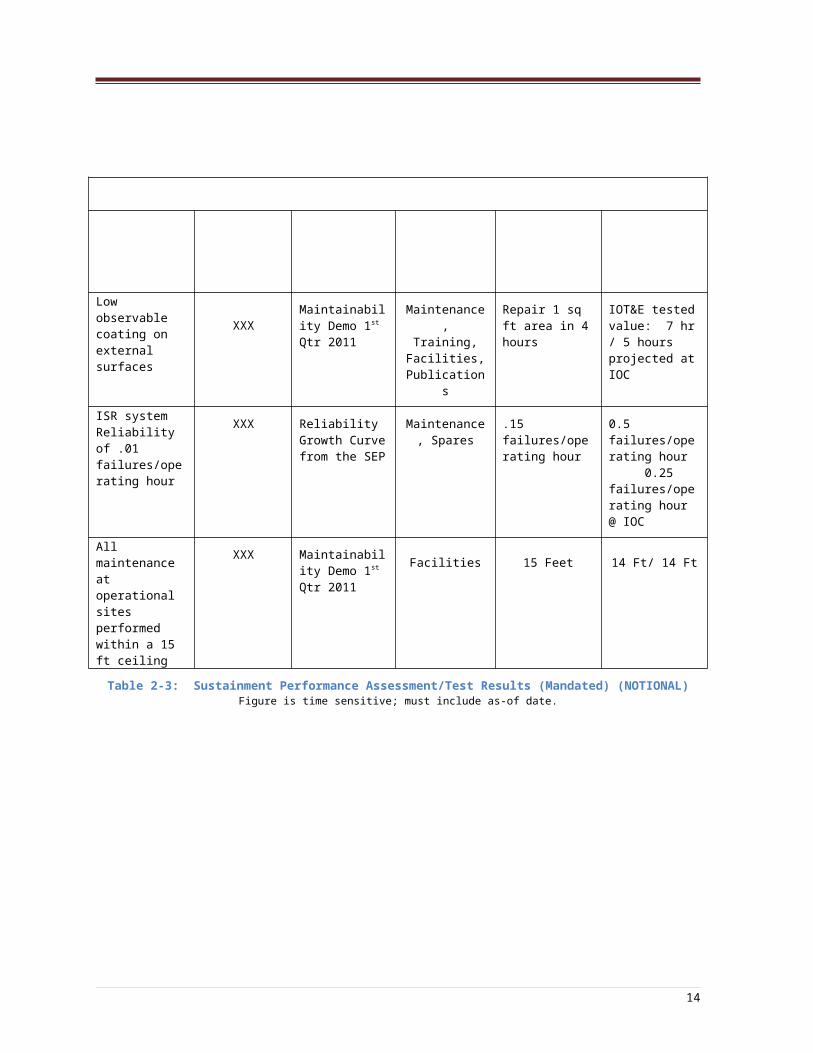
Table 3-4: Product Support Strategy for Reference Design Concept (Mandated) (NOTIONAL)Figure is time sensitive; must include as-of date.
14

Provide a depiction of the sustainment concept (Figure 3-2). The figure must identify roles and responsibilities for product support providers that support the system’s operational concept as depicted in the Acquisition Strategy (Operational View (OV)-1). The figure must list the program’s planned supply chain performance metrics. Additionally, the figure must include joint support, if planned, and the roles and responsibilities of the major agencies, organization and contractors planned as part of the system’s product support.
Program Product Support Enterprise
Alaska Guam Hawaii Okinawa Germany
CONUS OCONUSIraq Afghanistan
RC-W
LEATHERNECK
KANDAHAR
SHARANA
JALALABAD
BAGRAM
CAMP SPANN
MOSUL(close d)
SPEICHER(closing Se pt 10 )
TQ(close d)
KALSU(close d)
KIRKUK
BALAD
TAJI(close d)
LIBERTY
TALLIL
BASTION
MSF
Product Support FunctionalArea
Location Planned Sustainment Performance Metrics(1)
Planned ContractedSupport(2)
Program Head Quarters (Product Support Management)
Quantico/Stafford, VA; Warren, MI n/a Mix contract and gov’t
Test Facilities Aberdeen, MD; Yuma, AZ; Huntsville, AL Tests execution within 5 days of schedule All gov’t
Logistics Support Albany, GA; Barstow, CA; Red River, TX, Multiple throughout CONUS and AOR
Configuration support turn around time, backlog, fill rate
Mix contract and gov’t
Maintenance Depots Albany, GA; Barstow, CA; Red River, TX Avg Repair cycle time, Reset Time All gov’t
DLA Support Columbus, OH, Philadelphia, PA, DDRT, DDKS, DDKA
Avg Fill Rate: Days supply: , All gov’t
Contingency Support Activity
Multiple throughout AOR % ASL/PLL stocked, Zero bal w/ due out critical readiness drivers, days supply on hand,
All contract
Contingency Maintenance Depot Kuwait Throughput (vehicles/wk), Avg Repair cycle time (mission capability, battle damage), cost (per repair type, operation level)
All contract
IraqAfg
Avg Trans Time (Conus): 5 days
Avg Trans Time (Afg): 16 days
Avg Trans Time (Iraq): 12 days
Figure 3-2: Sustainment Concept (Mandated) (NOTIONAL)Figure is time sensitive; must include as-of date
(1) Must be consistent with metrics in Table 2-1(2) List explicitly in Section 4, Product Support Arrangement
Expectation: The program must develop a graphic that Illustrates the major elements of the system’s Product Support Strategy, both government furnished and commercially provided, that will be used across the breadth of system operations, peacetime and contingency. More than one graphic may be used, if needed. The PSM must coordinate the Program’s plans with the Services for organic logistics enterprise support for the availability and affordability requirement. The PSM must also use data on capabilities and limitations of the logistics enterprise to influence system reliability design trade decisions. Additionally, this figure in conjunction with Table 3-4 provides the product support functional breakdown necessary to develop effective contracted product support arrangements.
15

3.1 Sustainment Strategy ConsiderationsProvide a matrix of considerations and cost drivers (Table 3-5) that impact affordability of the Sustainment Strategy. These elements must map to the appropriate program documents (e.g. Cost Analysis Requirements Description, Manpower Evaluation Report, Concept of Operations (CONOPS)).
Consideration Core Documents Cost Driver Product Support Element Impact/ Control
CONOPSDesert Operations System CARD:
1.2.1x.s Environmental Conditions: 3.2; Basing & Deployment Description
CONOPS: OPLAN 5500, para 3.1
CDD (May 24, 2014): Para 3
Increased scheduled maintenance cycle; filter demand and filter cost
Design Interface; Supply; Technical Data; Higher Incidence of FailureInclude filter system to filter to 0.1µ
DESIGN FEATUREHydrazine System CARD:
1.2.1.x.2 Environmental
Conditions: 3.4.3 Training: 5.0
6 additional personnel per operating wing; specialized /dedicated equipment, facilities and IPE
Manpower & Personnel; Training; Support Equipment Facilities
Specialized manning, training, & facilities / alternative power sources addressed in ongoing trade study; ECD: Jun 2013
Nuclear Hardening System CARD CDD (May 24, 2014):
Para 10
Specialized test equipment at field and depot
Training
Design Interface; Maintenance; Training; Support Equipment
Flight controls and weapon control/delivery system shielded
FACILITIES/MILCONLow Observable System CARD: 10.2
Operational Support Facilities
CDD: Para 12, Assets required to achieve IOC
One shelter for each assigned or deployed asset
One repair hanger per 12 assigned aircraft
Design Interface; Maintenance; Training; Support Equipment; Facilities. Low observables coatings require individual shelters and specialized operational and depot facilities
Table 3-5: Sustainment Cost Drivers (Mandated) (NOTIONAL)
Expectation: The PSM must identify the considerations, sources, and the product support elements affected that are a sustainment cost driver. Product Support Strategy considerations are derived from multiple sources and can be explicit (e.g. hydrazine), implicit (e.g. low observable), or derived (e.g. desert operations). The table’s sub-headings (e.g., CONOPS, Design Feature, MILCON) are NOTIONAL.
16

3.2 Sustainment RelationshipsIdentify relationships (industry, other DoD Components, international partnerships) included in the product support strategy. List planned provisions to ensure completion of support providers remains a viable option throughout the life cycle.
Provide a figure showing the relationships between the Product Support Manager (PSM), Product Support Integrators (PSI), and Product Support Providers (eg. OEMs, DLA, TRANSCOM, Service Maintenance Depot) (Figure 3-3). The diagram must include field activities, support centers, integration activities, and other stakeholders, as appropriate. In cases where the relationships (eg. MOA, international agreements) are not yet in place, indicate the required actions, the individual with primary responsibility, and the associated time frame in which the relationships are expected to be established.
Expectation: This example depicts a mature product support structure. Early in the acquisition process, this figure may not be as detailed. By the Pre-EMD Review, the program must have defined the organizational structure in sufficient detail to support contracting actions.
Depot DLA ICP OEM Depot OEM Flight Control PSI ISR PSI Fire Control
PSI PSI Ground
Engine Airframe FMS SiteAvionics Operational Site Coordr
Training Site Coordr
Product Support
Manager
OEMs DLA
OEMs
TRANSCOM
Current Organization Planned OrganizationGovernment Team
Contractor
Field Team
Stand up 6 months prior to CDR
Stand up 1 year prior to respective
site activation
Site Coordinator
Depots
DLA
Figure 3-3: Product Support Providers (Mandated) (NOTIONAL)Notes: must be consistent with Program Office organization; figure is time sensitive, must include as-of date.
17

4 Product Support Arrangements
4.1 ContractsProvide a table (Table 4-6) of the sustainment related contract efforts, in place or planned, as part of the product support package. Data in the table must map to the Acquisition Strategy and provide sustainment specific provisions including the:
Name and CLINs Organization and points of contact Products and period of performance covered, including remaining actions to put the contract into place Responsibilities/authorities and functions Metrics and incentives
Note: Include the associated costs for each contract in the cost section (Table 8-1) broken out into appropriate logical segments (e.g., locations or types of site, functions, etc.). The costs must roll-up and be traceable to the procurement, O&M and O&S data provided in the program’s LCCE, affordability requirement, and PPBS documents.
Expectation: The table must identify the PSM’s engagement in the system’s contracts, specifically the product support contract line items, delivery orders, or sub-contracts if the services are imbedded in broader program and support service contracts. The table must indicate the extent of coverage of hardware and software, design and configuration, and each of the product support elements consistent with Table 2-1 (including the extent to which the statement of work emphasizes outcomes and performance, rather than activity and transactions). The table must include the incentives and remedies (competition, incentive and award fees, etc.) designed to motivate the contractor to improve performance and reduce cost.
Product Support Related ContractsMay 20, 2009
Name Organizations Products / TimeframeResponsibilities/Authority
and Functions Metrics & Incentives
ISR Sustainment
Contract
CLIN: WWW
Type: FFPAW
NAVICPBob Smith
215-xxx-xxxx
Contractor A
Products Covered: ISR Avionics ISR Ground
Stations
Time frame: Jan 2013 to Dec 2018 4 yr base with potential for 3 additional option years
Date of signed BCA and signatory
Responsibilities: Integrate all design and product support efforts ISR equipment including configuration management.
Functions: Sustainment Coverage includes
Maintenance beyond organizational level
Supply support Publications Training of
organizational personnel
Transportation between contractor and 1st designation
Metrics:
- AM target of 95% with min of 6% cost decrease each year Contract
extension if met
XXX
18

CLIN: WWW
Type: FFPAW
NAVAIR
TBD
Products Covered: ZZZ
Timeframe: Expect a 5 year contract RFP to be issued
Feb 2012 Contract award
expected Jan 2013
Responsibilities: XXX
Functions: Sustainment Coverage includes
YYY YYY
Metrics:
XXX
Table 4-6: Performance Based Arrangements Implemented in Contracts (Mandated) (NOTIONAL)
Note: Time sensitive figure; include an as-of date.
4.2 Performance Based Agreements (PBA)List the PBAs in place or planned, including the performance incentives, in a table (Table 4-7).
Note: Early in the acquisition process complete details will not be available. However, by Pre-EMD Review the program must have defined the PBAs to sufficient detail to identify contract actions required to support the organic providers, and the associated implementation schedule.
Performance Based Agreements with Organic Product Support ProvidersMay 20, 2009
Name Organizations Products / ScheduleResponsibilities/Authority
and Functions Performance Metrics
Table 4-7: Performance Based Agreements (Organic Support Providers) (Mandated)Note: Time sensitive figure; include an as-of date.
19

5 Product Support Package Status
5.1 Program Review Issues and Corrective ActionsProvide a table that identifies all reviews (e.g. SRR, PDR, CDR, PMR) in which the product support team participates, the open and in-work findings from the reviews, as well as corrective action and completion dates (Table 5-8).
Expectation: The table provides a single location to track and monitor sustainment-related findings and corrective actions among design, programmatic, test and logistics reviews.
Review Finding Corrective Action/Planned Completion Date
TRR (Feb 2014) TRR 2014-05LRU-3 reliability is less than half of planned; 3 circuit cards contribute to 90% of failures
Investigation into inherent design flaw or manufacturing flaw / 3QTR/2014
Logistics Assessment (Mar 2013)
LA 2013-22Detailed schedule with critical path needs to be developed
Develop a detailed schedule NLT 30 days prior to MS-B; PSM will review, in conjunction w/LRFS; develop POA&M to resolve or mitigate critical path issues
Table 5-8: Program Review Results (Mandated) (NOTIONAL)Figure is time sensitive; must include as-of date.
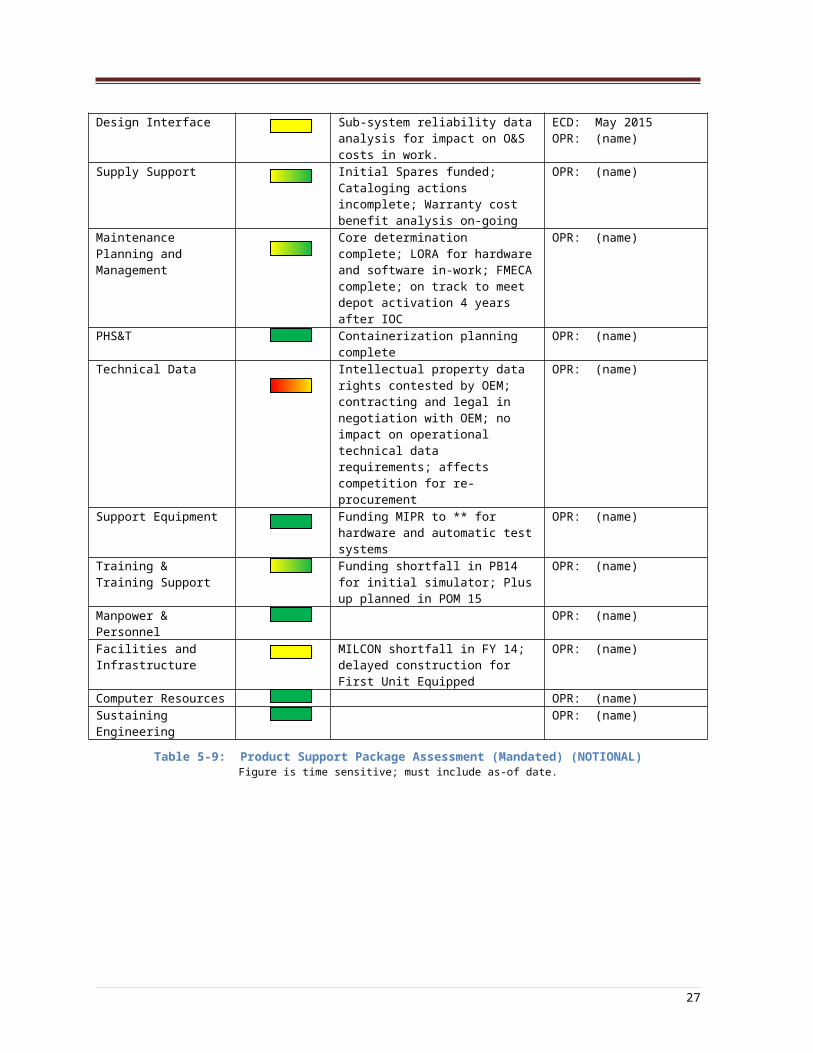
5.2 Product Support Package AssessmentProvide a table (Table 5-9) of assessment results for the product support package. Include the plan for resolving each of the issues identified in the Logistics Assessment, identify the individual responsible for resolving the issue, and specify the steps and schedule for closing each unresolved issue, Significant tasks required to resolve product support issues shall be captured in the Product Support Schedule (Figure 7-4).
Expectation: For each product support element, provide an assessment the actual level of development compared to the plan. The program must also assess any risk in the integration among the product support elements. Logistics Assessment must be integrated with the Product Support Schedule (Figure 7-4), and this section must summarize the results and plans for corrective action.
Product Support Element Assessment Discussion/Issues Corrective Action/ECD
Product Support Management
Sustainment BCA 6 months behind schedule
OPR: (name)
Design Interface Sub-system reliability data analysis for impact on O&S costs in work.
ECD: May 2015OPR: (name)
Supply Support Initial Spares funded; Cataloging actions incomplete; Warranty cost benefit analysis on-going
OPR: (name)
Maintenance Planning and Management
Core determination complete; LORA for hardware and software in-work; FMECA complete; on track to meet depot activation 4 years after IOC
OPR: (name)
PHS&T Containerization planning complete OPR: (name)
20

Technical Data Intellectual property data rights contested by OEM; contracting and legal in negotiation with OEM; no impact on operational technical data requirements; affects competition for re-procurement
OPR: (name)
Support Equipment Funding MIPR to ** for hardware and automatic test systems
OPR: (name)
Training & Training Support
Funding shortfall in PB14 for initial simulator; Plus up planned in POM 15
OPR: (name)
Manpower & Personnel OPR: (name)Facilities and Infrastructure
MILCON shortfall in FY 14; delayed construction for First Unit Equipped
OPR: (name)
Computer Resources OPR: (name)Sustaining Engineering OPR: (name)
Table 5-9: Product Support Package Assessment (Mandated) (NOTIONAL)Figure is time sensitive; must include as-of date.
21

6 Regulatory/Statutory Requirements That Influence Sustainment Performance
Include a table (Table 6-10) that lists all statutory and regulatory requirements that impact the sustainment of the program’s system, and potentially affect sustainment performance.
Requirement Documentation OPR Start Date /Implementation
Date
CLIN Review Cycle
Affected Performance
MetricCore Logistics Analysis
10 USC 2464 AMCOM Pre-EMD Rev, Sept 2013
Milestone C; FRPDR
Availability & O&S Cost
Source of Repair Analysis
Public Law 111-23
OPNAV/N4 MS-C, Nov 2014 As required
Public-Private Partnership
10 USC 2474 HQ AFMC/A4 MS-B, Sep 2013 MS-C; Every 5 years after IOC
Availability KPPReliability KSA
Corrosion DODI 5000.67 (Feb 2010)
PSM/Contractor RFP, Sep 2011, CLIN 008
MS-BMS-CEvery 5 years after IOC
Availability KPP
IUID DODI 5000.02 (Dec 08)DODI 8320.04 (Jun 08)
PSM/Contractor RFP, SEP 2011 CLIN 007
MS-BMS-CFRPDR
CBM + DODI 4151.22 (Dec 07)
RFP, SEP 2011 Availability KPP
Serialized Item Management
DOD 4140.1-RDODI 4151.19 (Dec 06)
RFP, SEP 2011
Supply Chain Risk Management
DEPSECDEF DTM 09-016, SCRM to Improve the Integrity of Components Used in DOD SystemsDODI 5200.39 (Jul 08)
RFP, SEP 2011
Affordability AT&L Better Buying Power Memo, Nov 3, 2010
DMSMS PSM/Contractor RFP, Sep 2011, CLIN 009
On-going through production
Availability KPP
CounterfeitOthers (Service Specific)
Table 6-10: Sustainment Alignment of Regulatory/Statutory Requirements (Mandated) (NOTIONAL)
22

Expectation: Illustrate the PSM’s recognition and compliance with statutory, regulatory, and policy requirements, their inclusion in RFP/contracts and how those requirements are tied to performance metrics.
23

7 Integrated ScheduleProvide a detailed, integrated, life-cycle system schedule (Figure 7-4), that is consistent with the integrated master schedule, and that emphasizes the next acquisition phase. Schedule items shall include, but are not limited to:
Planned significant program activities (i.e., activities which must be performed to produce the system):o Program and technical reviewso Request for Proposal (RFP) release dateso Software releaseso Key developmental, operational, integrated testing o Production lot/phaseso Contract award (including bridge contracts and sustainment contract awards)o Long-lead or advanced procurementso Performance agreements, particularly with and among organic providers
Major logistics and sustainment events for each of the product support elements with specific emphasis on the materiel and data development and deliveries. Include dependencies on key sustainment planning documents:
o Reliability Growth Plan from the SEPo Product Support Business Case Analyses (BCA)o Maintenance Plans (initial and final)o Core Logistics Assessmento Depot Source of Repairo Training Plano Diminishing Manufacturing Sources and Material Shortages (DMSMS) Plano Source of Repair Assignment Process (SORAP) o Corrosion Prevention and Control (CPC) Plan (mandatory for ACAT I programs only,
recommended for lower ACAT programs)o Planned post-implementation/post-IOC reviews
Major activation activities for sites in the supply chain required to support the system, to include maintenance sites (including depot maintenance core capabilities stand-up), software support, and training sites. Include events for interim contractor support, hardware (including support and test equipment, trainers, etc.).
Expectation: The figure must expand upon the program’s integrated master schedule (IMS and SEP), in the area of product support, especially activity that drives the program’s sustainment budget (e.g. support/test equipment, trainers, etc.). This figure should capture major activities the PSM has required to develop and implement the product support package. Detailed, task-level implementation plans for the individual product support elements may be included as an annex to the LCSP.
24

Fiscal Year M-Demo 1 2 3 4 1 2 3 4 1 2 3 4 1 2 3 4 1 2 3 4 1 2 3 4 1 2 3 4 1 2 3 4 1 2 3 4 1 2 3 4 1 2 3 4 1 2 3 4 1 2 3 4 1 2 3 4 1 2 3 4 1 2 3 4 1 2 3 4 1 2 3 4 1 2 3 4
Requirements
Acquisition Milestone
System Engineering
Supportability Analysis
20 09 10 11 12 13 14 15 16 17 18 19 27 21 22 23 24 25 26
FOC Engineering and Manufacturing Development
ICD
Integrated System Design System Capability and Manufacturing Process Demonstration Technology Development Production / Deployment
LRIP / IOTE FRP MS - B MS - C FRP
CPD
MS - A
CDD IOC
PCA SRR (Competing Vendors) SFR PDR CDR TRR/
FRR SVR/FCA/PRR
Major Contract Events = RDT&E contracts = APN - 1 contracts = PBL contracts
EMD AAC LRIP Lot 2 AAC LRIP Lot 3
AAC LRIP Lot 1 / IOT&E support
Test Events TEMP
IOT&E / OT - C2 / OPEVAL OTRR
Beyond LRIP Report
IT - B2
IT - C1
IT - C2
IT - C3 IT - B1
FOT&E (notional) (notional)
TECHEVAL IT - D
First Flight
Production
= APN - 1 aircraft
Total Production 624 = Aircraft Deliveries
= RDT&E assets Lot 2 x 9
Lot 3 x 14 LRIP L/Lead GTV L/Lead Lot 1 x 6 L/Lead
L/Lea d L/Lead
EMD EDMs
Logistics Events MSD Core Capability IOCSR ILA ILA ILA Training = training device deliveries #1 Flight Sim #2 Flight Sim
Maint. Trainers TDFA OT Training Initial Trng (T&E)
Technical Data
Support Equipment Production OT&E / Various IT&E /
Various Basing / Base #1 Basing / Base #2
Facilities Supply Support
Interim Contract Support Spares
ISR PBL Contract
Provisioning
Training Sites Depot
Long Lead Items Long Lead
Items
Org Int Depot Val/Ver
Maint Prelim NATOPS
Divers Systems Repairables Subsystems MTA-BCA D I O FMECA
Core
Figure 7-4: Product Support Schedule (Mandated) (NOTIONAL)Figure is time sensitive; must include as-of date.
25

8 Funding Identify the life-cycle sustainment logistics requirements for all appropriations. Funding must be traceable to the “Investment Program Funding and Quantities” Chart in Section 8 of the program’s Acquisition Strategy template. See Table 8-11. Identify the program’s major sustainment funding requirements, the documentation of those requirements (e.g. program office estimate, Service cost estimate, independent cost estimate), and the current budget documentation (e.g. program objective memorandum, President’s Budget). In addition to inclusion in the various estimates, it’s important that sustainment requirements are also included and updated in the affordability requirement, Will Cost/Should Cost estimates, and updated to reflect on going, fact-of-life changes, such as design changes, reliability growth, and budget and funding cycles. Additionally, after Milestone C as the system is tested (IOT&E), fielded, and operated, update to reflect data-driven changes or modifications to the system (i.e. design changes, ECPs) or the product support strategy.
Sustainment requirements can be provided as footnotes to the chart or as a list.
Expectation: Provide comprehensive sustainment requirements planning activities that are traceable to current cost estimates and funding documentation. Note, this chart is similar to the overall Program Funding chart in format, but the data should be specific to Sustainment Funding Requirements.
Program Life-Cycle Sustainment Specific Funding and Quantities Chart with footnotes
Template version PB12.6 Program Funding & Quantities
($ in Millions / Then Year) Prior FY10 FY11 FY12 FY13 FY14 FY15 FY16 FY12-16 To Comp Prog Total
RDT&E
Prior $ (PB 11) 106.4 6.7 8.3 17.2 7.1 0.0 0.0 0.0 24.3 0.0 145.7
Current $ (PB 12) 108.0 5.0 4.2 16.0 6.5 3.2 1.3 0.0 27.0 0.0 144.2
Delta $ (Current - Prior) 1.6 (1.7) (4.1) (1.2) (0.6) 3.2 1.3 0.0 2.7 0.0 (1.5)
Required $ 108.0 6.5 7.9 16.0 6.5 3.2 1.3 0.0 27.0 0.0 149.4
Delta $ (Current - Required) 0.0 (1.5) 1 (3.7) 0.0 0.0 0.0 0.0 0.0 0.0 0.0 (5.2)
PROCUREMENT
Prior $ (PB 11) 0.0 128.3 133.2 145.2 133.5 138.0 112.0 0.0 528.7 217.0 1,007.2
Current $ (PB 12) 0.0 89.62 135.2 141.1 152.33 155.4 121.0 93.0 662.8 145.0 1,032.6
Delta $ (Current - Prior) 0.0 (38.7) 2.0 (4.1) 18.8 17.4 9.0 93.0 134.1 (72.0) 25.4
Required $ 0.0 94.0 134.2 141.1 152.3 155.4 121.0 93.0 662.8 145.0 1036.0
Delta $ (Current - Required) 0.0 (4.4)4 1.0 0.0 0.0 0.0 0.0 0.0 0.0 0.0 (3.4)
MILCON
Prior $ (PB 11) 0.0 0.0 1.3 1.6 0.0 2.1 2.3 0.0 6.0 15.3 22.6
Current $ (PB 12) 0.0 0.0 1.4 1.7 0.0 2.0 2.1 3.0 8.8 12.6 22.8
Delta $ (Current - Prior) 0.0 0.0 0.1 0.1 0.0 (0.1) (0.2) 3.0 2.8 (2.7) 0.2
Required $ 0.0 0.0 1.4 1.7 0.0 2.0 2.1 3.0 8.8 12.6 22.8
Delta $ (Current - Required) 0.0 0.0 0.0 0.0 0.0 0.0 0.0 0.0 0.0 0.0 -
1 Product Support BCA Unfunded2 Initial Spares: ($16M)3 MIPR to PMA-260; $16.4M Capital Investment Support Equipment Funding4 Initial Spares: $4.4M of $16M requirement unfunded
26
WEAPON SYSTEM O&M1
Prior $ (PB 11) 0.0 0.0 0.0 0.0 0.0 0.0 12.0 0.0 12.0 88.0 100.0
Current $ (PB 12) 0.0 0.0 0.0 0.0 0.0 0.0 11.0 15.0 26.0 75.0 101.0
Delta $ (Current - Prior) 0.0 0.0 0.0 0.0 0.0 0.0 (1.0) 15.0 14.0 (13.0) 1.0
Required $ 0.0 3.8 3.5 4.0 4.3 4.6 5.2 5.0 23.1 40.0 70.4
Delta $ (Current - Required) 0.0 (3.8) (3.5) (4.0) (4.3)5 (4.6) 5.8 10.0 2.9 35.0 30.6
TOTAL
Prior $ (PB 11) 106.4 135.0 142.8 164.0 140.6 140.1 126.3 0.0 571.0 320.3 1275.5
Current $ (PB 12) 108.0 94.6 140.8 158.8 158.8 160.6 135.4 111.0 724.6 232.6 1300.6
Delta $ (Current - Prior) 1.6 (40.4) (2.0) (5.2) 18.2 20.5 9.1 111.0 153.6 (87.7) 25.1
Required $ 108.0 104.3 147.0 162.8 163.1 165.2 129.6 101.0 721.7 197.6 1278.6
Delta $ (Current - Required) 0.0 (9.7) (6.2) (4.0) (4.3) (4.6) 5.8 10.0 2.9 35.0 22.0
QUANTITIES2
Prior (PB 11) 0 552 575 681 587 602 634 656 3160 512 4,799
Current (PB 12) 0 385 582 607 655 669 521 400 3819 980 4,799
Delta $ (Current - Prior) 0 (167) 7 (74) 68 67 (113) (256) (308) (468) 0
Required Qty 0 385 582 607 655 680 550 500 3959 840 4,799
Delta Qty (Current - Required) 0 0 0 0 0 (11) (29) (100) (140) 140 0
Table 8-11: Product Support Funding SummaryFigure is time sensitive; must include as-of date.
Acquisition logistics and sustainment funding requirements by appropriation o RDT&E: Milestone B Sustainment BCA (FY15, $1.5M, Unfunded), Supportability Analysis MIPR to
AMCOM (FY13, $0.9M 3 man year effort); A&AS program office logistics A&AS (FYs13-20; 3 personnel)
o PROCUREMENT: Initial Spares Buy (FYs16/17; $16.3M, $4.4M Unfunded); ICS (FYs18-21; $6.4M/year); Depot Stand-Up (FY22: $18.4M); MIPR to PMA-260 Support Equipment Buy (FY16: $5.6M; FY17: $5.1M)
o MILCON: Training facilities (FY17: $13.3M; FY18: $4.3M; FY19: $20.6M); Operational Sites (FY16: $14.8M—3 location; FY17: $14.8M—3 locations; FY20: $15.1M—3 locations); Depot Facilities (FY21: $24M)
o O&M: ICS (FYs22-24: $6.4M/year; FYs25-26: $3.2M—transition to organic stand-up); Steady state average operational support cost per unit ($1.4M/unit/year)
5 ICS Funding Shortfall (FY13 and FY14)
27

9 Management
Expectation: The LCSP must provide the planned evolution in the organizational structure and IPTs through the acquisition process, including operations and sustainment.
9.1 Organization
9.1.1 Government Program Office OrganizationProvide the planned program office organization structure (Figure 9-5), with expanded detail on the Product Support function. Include an as-of date and the following information:
Organization to which the program office reports Program Manager (PM) Product Support Manager (PSM) Functional Leads (e.g., T&E, Engineering, Financial Management) Core, matrix, and contractor support personnel Field or additional Service representatives Legend, as applicable (e.g., color-coding)
Procure Analysts
(2)
Program Analysts
(2)
Cost Analysts
Cost Analysts
Cost Analysts
Procure Analysts SE Lead Design
LeadPSE
IntegrationSite
Coord
LogisticsMgmt
Analyst
LeadSupportability
AnalystTester Program
Integrator
Business Mgmt Lead
Financial Mgmt Lead
Tech Lead PSM
Test Mgmt Lead
Office of the
Director
Program Manager
Training Manager
Supply Support
Manager
Support Equip
Manger
Pubs Manager
Engine PSI
Airframe PSI
Avionics PSI
Site Coordrs
Scheduler
Program Analysts
(2)
Analysts (2)
Operat’lTester
DT&E Engineer
Scheduler
Program Analysts
(3)
Current Organization Planned OrganizationGovernment Team
Collocated Matrix
Contractor
Non-Collocated Matrix
Field Team
Stand up 6 months prior to CDR
Stand up 1 year prior to respective
site activation
Figure 9-5: Program Office Organization (Mandatory) (NOTIONAL)Note: Time sensitive figure; include an as-of date.
Provide the following information relative to the Product Support Manager:
Name, code/office symbol and contact information Career field and qualifications/certifications (e.g. DAWIA Level III Logistician, PM). If not currently
certified summarize the specific actions and timeframe for certification. The reporting relationship(s) relative to the PM and to any logistics, sustainment or materiel commands
28

9.1.2 Program Office Product Support Staffing LevelsSummarize the program’s product support staffing plan (Figure 9-6) showing the number of required full-time equivalent (FTE) positions (e.g., organic, matrix support, and contractor) by key program events (e.g., milestones and technical reviews). Provide supporting tables breaking out the positions by numbers (both authorized and assigned), position type, and major functions performed.
Product Support Yearly Headcount Profile(May 20. 2007 Estimate)
0
5
10
15
20
25
30
35
40
45
50
2006 2007 2008 2009 2010 2011 2012 2013 2014 2015 2016 2017 2018 2019 2020 2021
AoA PDR CDR LRIP IOT&E IOC FOC Depot
A B C
Software Support
Site Support
Training/Manpower Specialist
Supply Specialist
Technical Data Specialist
Support Eqmt Specialist
Supportability Analysis
Logistics Management
Test2010 - 2013
CDR2008
MS C2010
IOC2013 MSD
2015 Depot2017
PDR2006
Figure 9-6: Program Product Support Staffing (Mandated) (NOTIONAL)Note: Time sensitive figure; include an as-of date.
9.1.3 Contractor(s) Program Office OrganizationProvide diagrams of the contractor(s) program office organization and staffing plans in figures analogous to Figure9-5 and Figure 9-6.
9.1.4 Product Support Team Organization
Integrated Product Team (IPT) Organization – Provide a figure (analogous to Figure 9-5) showing all government personnel and contractors (when available) assigned to sustainment related IPTs, working IPTs, and working groups. The figure must show the vertical and horizontal interrelations among the groups listed. Identify the government and contractor(s) leadership for all teams.
IPT Details – For all government and contractor(s) (when available) IPTs and other key teams (e.g., Level 1 and 2 IPTs and Working Groups); include the following details in a table (Table 9-12):
IPT name and effective dates. IPT standup dates shall be included in the Product Support Package Schedule (Figure 7-4)
POC and contract information Functional team membership (to address the appropriate product support elements) IPT roles, responsibilities, and authorities IPT products (e.g., updated baselines, risks, etc.) IPT-specific metrics
Note: Ensure the IPTs in the figure and table match and are consistent with the overall program IPT structure
29

Expectation: Product Support IPT’s are expected to include appropriate Service, DoD Agency, and COCOM representation, to ensure that organic Maintenance, Supply Chain, and Transportation capabilities, constraints and risks inform LCSP development.
Team Name POC
Team Membership (by Function or Organization)
Team Role, Responsibility, and
AuthorityProducts & Metrics
PS IPT
PSMBob Smith703-xxx-xxxx
- Program Office Deputy PM Sys Eng Lead Financial Lead SW Lead Site Rep. R&M Lead
- PSIs (List)- Prod Spt IPT Leads (List)- Service Representative(s)- DoD Agency
Representative(s)- Key Subcontractor or
Suppliers Engine XXX
Size: YYY
Role: IPT PurposeResponsibilities: Integrate all product support efforts
Team Member Responsibilities
Cost, Performance, Schedule Goals
Scope, Boundaries of IPT Responsibilities
Schedule and frequency of meetings
Date of signed IPT charter and signatory
Products: LCSP/LCSP
Updates IMP/IMS Inputs Specifications AS input
Metrics: Cost
o Program Product Support Element costs
o OPTAR Schedule Sustainment
oAM
oLog Foot Print
XXX IPTXXX
- Program Office Sys Eng Lead Test Manager Logistics Manager R&M Deputy Site Rep.
- PSI X Lead - Key Subcontractor or
Suppliers
Size: YYY
Role: IPT Purpose
Responsibilities: Integrate all technical efforts
Team Member Responsibilities
Cost, Performance, Schedule Goals
Scope, Boundaries of IPT Responsibilities
Schedule and frequency of meetings
Date of signed IPT charter and signatory
Products: Specification
input LCSP input TES/TEMP input
Metrics: Performance
Measure (PM) 1 PM 2
Table 9-12: IPT Team Details (Mandated) (NOTIONAL)Note: Time sensitive figure; include an as-of date.
30

9.2 Management Approach
9.2.1 Product Support Manager (PSM) Roles and ResponsibilitiesList the interfaces, deliverables and dependencies that the PSM and logistics staff must coordinate with other functional areas to ensure sustainment is aligned with program design, program management (including risk management and configuration management) and test reviews. List the program processes through which the PSM must integrate design and program decisions with sustainment considerations, referencing the relationships identified in Figure 3-3. Provide the program’s unique delineation of the PSM’s specific roles, responsibilities, and authorities. This section must specify how the PSM will accomplish the following roles and responsibilities:
Develop a performance-based product support strategy that provides for competition and leverages common infrastructure and resources across programs and DoD Components
Develop and implement product support arrangements Assess and adjust resource allocations and performance requirements Conduct product support strategy reviews and validate the supporting business case analysis Contribute to the program’s financial efforts (e.g. budgeting, funds execution) Participate in and lead as appropriate program IPTs, with specific emphasis on sustainment related IPTs
Expectation: The PSM’s responsibilities listed here map explicitly to the Product Support Strategy and Planning sections listed in this annotate outline and align with the intent that the LCSP serve as the program’s primary Product Support Management tool. The activities and products associated with each responsibility shall be scheduled on the Product Support Schedule (Figure 7-4)
The management approach must also establish:
IPT Alignment – The processes and mechanisms through which the government will interact with the prime and subcontractors.
Performance Assessment – The process to manage performance (e.g. review cycle, triggers to alert management to cost, schedule, or performance deviation)
Expectation: Specific attention must be paid to how the Product Support IPT (PS-IPT) manages program communications, issues resolution, and its role in budget formulation and affordability analysis. This section must demonstrate that product support considerations are included within the program decision making framework.
9.2.2 Sustainment Risk ManagementSpecify the process through which the Program will manage sustainment-specific risks, within the context of the overall Program risk management process.
Indicate roles, responsibilities, and authorities within the risk management process for:
Reporting/identifying risks Determining the criteria under which risks are defined and categorized (typically based on probability of
occurrence and consequence) Adding/modifying risks Changing likelihood and consequence of a risk Closing/retiring a risk
If Risk Review Boards or Risk Management Boards are part of the process, identify the chair, participants, and meeting frequency. If program office and contractor(s) use different risk tools, identify the means by which
31

information will be transferred among them. NOTE: In general, the same tool should be used. If the contractor’s tool is acceptable, then this merely requires Government-direct, networked access to that tool.
Provide a table (Table 9-13) that lists key risks identified in the reviews listed in Section 5 to the Sustainment which includes:
As-of date Risk including the review(s) in which it was identified Risk rating Description Driver Mitigation status
Expectation: Sustainment risk management must be part of the program’s overall risk management program and not an isolate process. This section should include specific risks that could adversely impact the product support package, including but not limited to changing design based requirements creep or immature sustainment technologies required to implement the product support strategy. The Mitigation Plan shall include schedule for addressing risk and responsible individual in the Product Support organization.
Risk Rating Driver Mitigation Plan Status
Table 9-13: Risk Summary (Mandated)Note: Time sensitive figure; include an as-of date.
32

10 Supportability Analysis
Expectation: This section lists the analytic methods and tools that the Supportability Analysis Engineers use to define the product support package. The program must closely align the engineering design with the product support elements to ensure that materiel availability can be achieved affordably. Early in the acquisition process, the emphasis of this section is on the design trades in preparation for each of the design reviews necessary to achieve the sustainment requirements, and in preparation for the Pre-EMD Review. As the program progresses into production this section focuses more heavily on integrating the product support elements to provide the most affordable product support. During sustainment, the focus is on adjusting product support based on the operational needs.
10.1 Design Interface
Expectation: This section must match the SEP, so the logistics community can reference one document for the FMECA, and ensure a common understanding of failure modes. Once the initial FMECA is complete, the table provides a means to communicate changes as the design evolves. Ultimately the FMECA triggers the Program to make timely adjustments to the product support package.
10.1.1 Design AnalysisFailure Modes, Effects, and Criticality Analysis (FMECA) – For each of the major or critical subsystems provide the following details from the systems engineering FMECA in a table (Table 10-14) with an ‘as-of date’:
Systems (break into subsystems as needed to highlight subsystems with reliability drivers or with reliability issues) and identify the responsible IPT Lead
Schedule, including planned updates List subsystems and/or modes driving changes to baseline product support package Impact on product support strategy or product support package baseline change
System Schedule Issues/Likelihood Impact / commentsAirframeIPT Lead Complete
Update after IOT&E
New failure modes uncovered due to projected corrosion issues around engine inlets and on wing spar.
Fuel tanks moved
Ensure there are sufficient doors and panels to allow accessibility to critical areas. Ensure panels, doors, etc. are interchangeable between aircraft and designs meet support event frequencies in terms of access and its 3-dimensional access plane.
Verify fuel tanks not adding stress to bulk heads during operations resulting from high “G” operations
PropulsionIPT Lead 3rd Qtr 06 to
4th Qtr 07None
Avionics – GeneralIPT Lead
Complete New failure modes uncovered which current health monitoring system cannot predict.
Design out diagnostic ambiguity groups that cause false alarm rates taking into account the new failure modes.
33

ISR systemsIPT Lead
3rd Qtr 06 to
4th Qtr 07
ISR design behind schedule due to efforts to understand unexpected failure mode in optical sensor
Will delay development of publications and Test Equipment. The potential severity may require development of new prognostics capabilities
Fire ControlIPT LeadAvionics
Test EquipmentIPT Lead
Table 10-14: FMECA Summary (Mandated) (NOTIONAL)Note: Time sensitive figure; include an as-of date.
Reliability Growth Plan Issues – Provide a table (Table 10-15) that lists the results of the systems engineering analysis efforts. The information must link with the current Reliability Growth Plan and include:
Product Support Plan Driver Systems reflected with reliability 20% (number is illustrative; Program must tailor based on its specific needs) or more below target
Planned value in the Reliability Growth Plan and corresponding de-rated value upon which the product support strategy/package is based
Current reliability estimate (measured and de-graded) at IOC Confidence level target will be met Mitigation and, if the target is not reached, a trigger for action required to ensure the program remains on
schedule
SystemPlanned/ De-rated
Values (failures per operating
hour)
Estimate at IOC Confidence Level Mitigation efforts
ISR systems .01 / .15 .01 / .25 50% Buy additional spares and add additional I level repair capabilities at larger sites.
Decision required at MS C
Table 10-15: Reliability Growth Plan Issues (Mandated) (NOTIONAL) Note: Time sensitive figure; include an as-of date.
Completed Supportability Trades - List the following for major supportability trade studies that have been completed since the last LCSP update in a table (Table 10-16):
Trade name and date completed Lead IPT Options analyzed Criteria used to evaluate costs and benefits Results Impact - on the weapon system design and/or product support strategy and package
34

Note: Includes business case or other economic analysis that consider sustainment costs and outcome value. Limit the list to the 10 most critical trades.
35

Completed Supportability Trades Jan 10, 2009
Trade(Completed since
11/12/07)IPT Options Analyzed Results Impact
Engine level of repair5/20/08
Engine IPT Alternatives: 2
level or 3 levels of repair
Centralized 2nd level of repair or at every major site
Commercial or organic at 2nd or 3rd level
Criteria: AM
and AO
Program costs and O&S costs
3 levels of maintenance with 2nd level being performed commercially at 3 central sites for hot sections
3rd
level performed by industry
Competitive 2nd and 3rd level performance based contract in place by IOC to cover all sustainment functions, (e.g. design, maintenance, supply, transportation, etc.).
Complete drawing set needed for competition
Table 10-16: Completed Supportability Trades (Mandated) (NOTIONAL)Note: Time sensitive figure; include an as-of date.
Planned Supportability Trades – List the following for major upcoming trades to be conducted prior to the next milestone and major trades in subsequent phases in a table (Table 10-17):
Trade name Lead IPT Timeframe Objective Options to be analyzed Criteria used to evaluate costs and benefits
36

Planned Supportability TradesJan 10, 2009
Trade IPT Options Analyzed Results Impact
ISR sustainment capabilities
Mission Equipment IPT Jan 09 – Jan 10
Determine lowest LCC cost solution considering the risks associated with the rapid change in technology while meeting the overall AM
Alternatives: Co
mmercial or organic sustainment
Best blend between sustainment functions, (e.g. design, maintenance, supply, transportation, etc.).
Criteria: AM
and AO
Program costs and O&S costs
Post MS C Supportability TradesJan 10, 2009
Trade IPT Options Analyzed Results Impact
Engine repair locations
Engine IPTMay 12 – Sept 12
determine best locations for maintenance
Alternatives: C
ONUS/OCONUS mix
International partners
Criteria: AM
and AO
Program costs and O&S costs
Table 10-17: Planned Supportability Trades (Mandated) (NOTIONAL)Note: Time sensitive figure; include an as-of date.
Expectation: The trades identified in Table 10-16 and Table 10-17 ensure the PM has considered the coupling among the requirements, design and product support strategy. This section must ensure that the supportability analysis results in an affordable design and product support package. The trades are used in the Technology Development phase to provide an initial assessment of requirement affordability. Prior to and following the Pre-EMD Review, the trades are critical in determining the Product Support Arrangement, both commercial and organic. Later, including during sustainment, trades are used to examine alternatives to control sustainment costs or achieve materiel available at a lower cost.
37

10.1.2 Technical ReviewsIn a table (Table 10-18) identify the following information for each of the Technical Reviews identified in the SEP:
Technical Review/Schedule Sustainment /Product Support Community participants Sustainment related focus area Entry and Exit Criteria
Review Sustainment Participants Sustainment Focus Criteria
PDR2nd Quarter 2009 PSM
Supportability Analysis IPT Lead
Fire Control System prognostics capability
Airframe access panel locations for corrosion control
Entry
TEMP
Exit:
Test criteria for operational testing
Updated schedule YYY
CDR4th Quarter 2010
PSM Supportability
Analysis IPT Lead
xxx
XXX XXX XXX
Entry
XXX
Exit:
YYY YYY
Table 10-18: Technical Reviews (Mandated) (NOTIONAL)Note: Time sensitive figure; include an as-of date.
10.2 Product Support Element DeterminationIn a table (Table 10-19) identify the supportability analysis methods and tools (including the product support business case analysis) used to define the elements that comprise the product support package. Among the required information:
Supportability Analysis processes addressed Schedule (identify when the tool will be applied and on what portion of the weapon system*) Tools ** Output product Product review/update timeframes
Notes: * A separate schedule may be appropriate in cases when sub-systems are not in sync with the basic design.** Include a separate schedule if the tool has to be developed, integrated with other tools, refined, or updated. The table must include the responsible analyst performing the supportability analysis, tool, timeframe, and list of the required changes.
Product Support Analytical Support Methods and Tools Jan 10, 2009
Process/Analyst Schedule Tool Output Product Update TimeframeMaintainability Analysis and Prediction
XXX MIL-HDBK-472 Maintainability Prediction
Maintenance Concept xxx
38

Techniques supported by NALDA data for analogous systems
Maintenance Task Analysis XXX YYY proprietary
software
PowerLog
Draft Maintenance Procedures
MS C
Repair Level Analysis considering both cost and materiel availability impact
XXX COMPASS
(updated to include AM)
Repair vs Discard and level of repair decision
MS C
Reliability Centered Maintenance (RCM) – including its natural fall outs or related analyses
XXX SAE JA 1011, RCM Evaluation
SAE JA 1012, RCM Guide
S4000M, Scheduled Maint. Analysis
Corrosion Control Maintenance Procedures
Condition-Based Maintenance Plus (CBM+)
Prognostics & Health Management (PHM)
MS C
Training System Requirements Analysis (TSRA)
XXX SCORM Training Programs of Instruction
MS C
Sources for Sustainment (e.g., Warranty Cost Benefit Analysis (CBA), business case or other economic analysis that consider costs and outcome value)
XXX Clockworks
CASA
XXX BCA MS C
Depot Source of Repair (DSOR) Analysis
XXX xxx Xxx Xxx
SparingXXX
ArrowsCOMPASS
Spares Allowance listSparing to Availability
MS C
ManpowerXXX
LCOMManpower
Authorization Criteria
Manning recommendations MS C
Tools and Test Equipment Analysis
PowerLogCASA
COMPASS
Support Equipment Recommendation DataTMDE Requirements
MS C
Transportability Analysis xxx Transportability Plan
& Procedures for Transportability
MS C
Table 10-19: Product Support Analytical Methods and Tools (Mandated) (NOTIONAL)
39

Note: Time sensitive figure; include an as-of date.
Expectation: This section must demonstrate that the program is building its product support package on a foundation of sound data and analytical decision support capabilities.
10.3 Sustaining EngineeringIn a table (Table 10-20) list the tools that will be used to monitor the performance of the product support package:
Monitoring Tool Office of primary responsibility Metrics/Data monitored and frequency Feedback mechanism (including the method for highlighting to senior management the consequences
and impacts on the Sustainment KPP/KSAs of budget constraints) Performance review timeframes
Sustainment Performance Data Collection and Reporting
Tool OPR/IPT Metrics/Data Monitored
Feedback Mechanism
Review Timeframes
Sustainment Quad Chart
PSMAO, AM, R MDTO, MDTM, O&S costs
Automatic updates to PEO and DASD (MR) via DAMIR.
Metrics feed from NALDA
GCSS
Quarterly
Post IOC ReviewPSM Logistics
Assessment elements
Feedback from operators and PSI and PSPs
Summary reports forwarded to DASD (MR)
Even Years
Failure Reporting , Analysis, and Corrective Action System (FRACAS)
Sustaining Engineering IPT
Ao, Am, R MDTO, MDTM, O&S costs driver metrics including but not limited to: XXX XXX XXX
NALCOMIS/NALDA data analyzed and compared to baseline values and supportability analysis tools used to update product support elements as needed
Critical systems effecting costs or AM as needed
25% of WUCs assessed every year
Table 10-20: Sustainment Performance Monitoring (Mandated) (NOTIONAL)
Expectation: This table must demonstrate that the program has a monitoring plan and capability that can trigger corrective action in the event one or more product support element is at risk of degrading sustainment performance. This data is also useful for the PSM in linking resources to readiness.
40

11 Additional Sustainment Planning FactorsList additional sustainment issues or risks that cross functional lines that could adversely impact sustainment or sustainment support across the system’s life cycle that are not included elsewhere in the LCSP. If the topic is addressed in another document (e.g., the Systems Engineering Plan, etc.) provide a short summary and reference the source. For example:
Critical Program Information elements provided in the Program Protection Plan (maintaining anti-tamper on component or sub-components)
Materials with environmental impacts addressed in the PESHE (require special handling, demilitarization, facilities, training)
System integration with or onto another platform (vehicles onto transport ships/RoRos, air transports, etc.)
Integration of C4I with the system
Provide a list of precious metals requiring recovery, items that are classified, export controlled, pilferable, or require special handling.
Expectation: Information may be included in other acquisition documents but is important to the effective functioning of operators and maintainers. This section provides product support stakeholders additional information that impacts sustainment planning and operations and a reference to where additional information can be found.
LCSP AnnexesThe following annexes must be included:
Product Support Business Case Analysis (DODI 5000.02) Logistics Assessment and Corrective Action Plan (DODI 5000.02) System Disposal Plan (DODI 5000.02; DOD 4160.21-M) Preservation and Storage of Unique Tooling (DODI 5000.02). Core Logistics Analysis (DODI 5000.02) Source of Repair Analysis (DODI 5000.02) Service-Specific Requirements, including detailed system Product Support Plan/integrated product
support elements
Expectation: The DoD Components will use this section to provide more detailed implementation information to guide the development and fielding of the product support package.
41