estimating life cycle costs at the skunk works® · estimating life cycle costs at the ... level 1...
TRANSCRIPT
1COPYRIGHT 2016 LOCKHEED MARTIN CORPORATION – ALL RIGHTS RESERVED
Wayne WrightProposal Analyst Senior Staff
14 December 2016
Estimating Life Cycle Costs at the Skunk Works®
Presented at the 14 December 2016 ICEAA SoCal Workshop www.iceaaonline.com/socal

COPYRIGHT 2016 LOCKHEED MARTIN CORPORATION – ALL RIGHTS RESERVED2
Summary
We have established a Life Cycle Cost estimating suite of models that parametrically predicts Prototype, Engineering & Manufacturing Development, Production, Sustainment, and Disposal costs. The establishment of Sustainment cost estimating relationship equations, the adoption of a Government-funded Disposal white paper results, and standardizing model design enables our internal customers to better understand our estimating philosophy and significantly improve the turnaround time of our estimates.
Presented at the 14 December 2016 ICEAA SoCal Workshop www.iceaaonline.com/socal
COPYRIGHT 2016 LOCKHEED MARTIN CORPORATION – ALL RIGHTS RESERVED3
Time
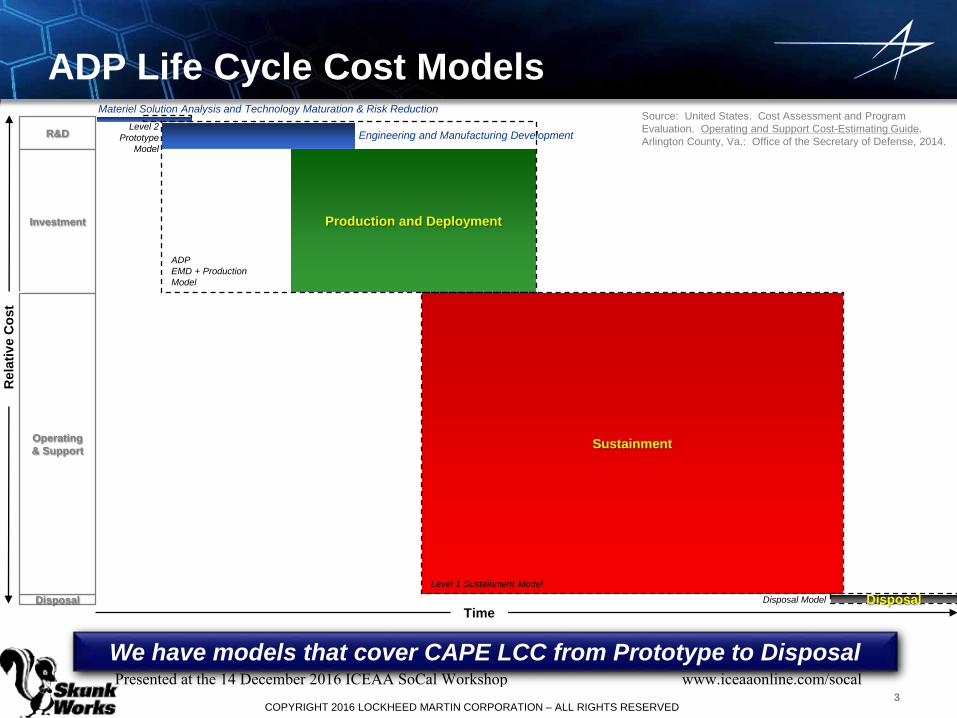
ADP Life Cycle Cost ModelsSource: United States. Cost Assessment and Program Evaluation. Operating and Support Cost-Estimating Guide. Arlington County, Va.: Office of the Secretary of Defense, 2014.
R&D
Investment
Disposal
Production and Deployment
Sustainment
Rel
ativ
e C
ost
Operating & Support
Materiel Solution Analysis and Technology Maturation & Risk ReductionLevel 2
PrototypeModel
Disposal Model
Level 1 Sustainment Model
ADPEMD + ProductionModel
Disposal
Engineering and Manufacturing Development
We have models that cover CAPE LCC from Prototype to DisposalPresented at the 14 December 2016 ICEAA SoCal Workshop www.iceaaonline.com/socal
COPYRIGHT 2016 LOCKHEED MARTIN CORPORATION – ALL RIGHTS RESERVED4
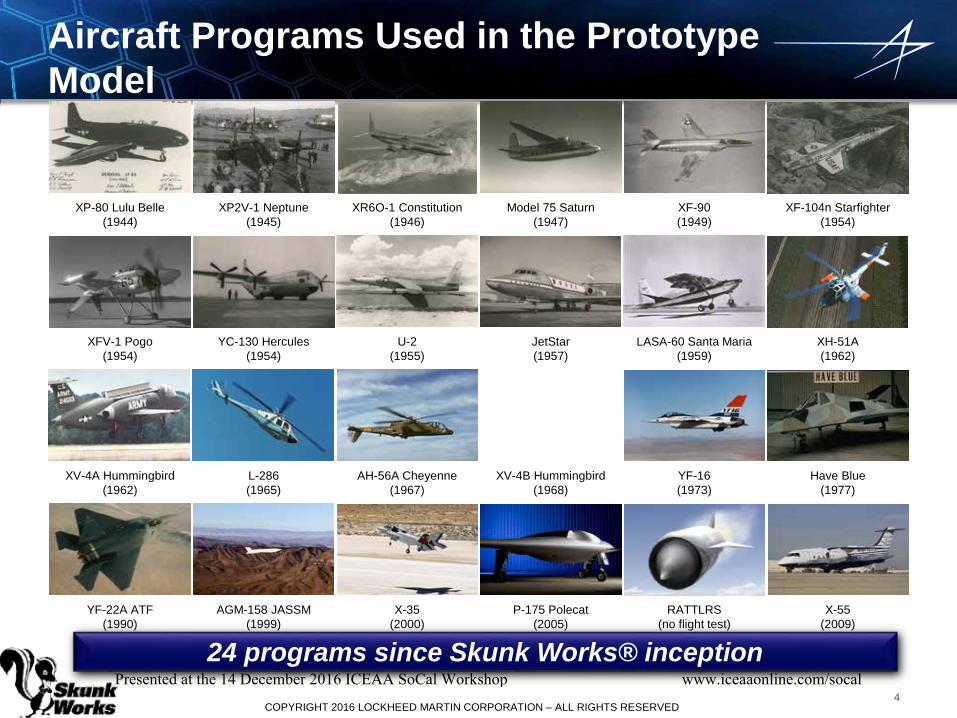
XP-80 Lulu Belle(1944)
XP2V-1 Neptune(1945)
XR6O-1 Constitution(1946)
Model 75 Saturn(1947)
XF-90(1949)
XF-104n Starfighter(1954)
XFV-1 Pogo(1954)
YC-130 Hercules(1954)
U-2(1955)
JetStar(1957)
LASA-60 Santa Maria(1959)
XH-51A(1962)
XV-4A Hummingbird(1962)
L-286(1965)
AH-56A Cheyenne(1967)
XV-4B Hummingbird(1968)
YF-16(1973)
Have Blue(1977)
YF-22A ATF(1990)
AGM-158 JASSM(1999)
X-35(2000)
P-175 Polecat(2005)
RATTLRS(no flight test)
X-55(2009)
Aircraft Programs Used in the Prototype Model
24 programs since Skunk Works® inceptionPresented at the 14 December 2016 ICEAA SoCal Workshop www.iceaaonline.com/socal

COPYRIGHT 2016 LOCKHEED MARTIN CORPORATION – ALL RIGHTS RESERVED5
Aircraft Programs Used in the EMD Model
The inclusions of subsequent versions of the same aircraft enabled us to determine the statistical significance of the equivalent new air vehicle design independent variable
C-130A Hercules1955
F-104A Starfighter1956
F-104B Starfighter1957
P-3A Orion1961
P-3C Orion1963
C-141 Starlifter1963
C-5A Galaxy1969
L-1011 TriStar1970
S-3A Viking1972
F-22 Raptor1997
F-117 Nighthawk1981
F-16E/F Blk 60 Fighting Falcon
2003
F-35 Lightning II2006
Presented at the 14 December 2016 ICEAA SoCal Workshop www.iceaaonline.com/socal
COPYRIGHT 2016 LOCKHEED MARTIN CORPORATION – ALL RIGHTS RESERVED6
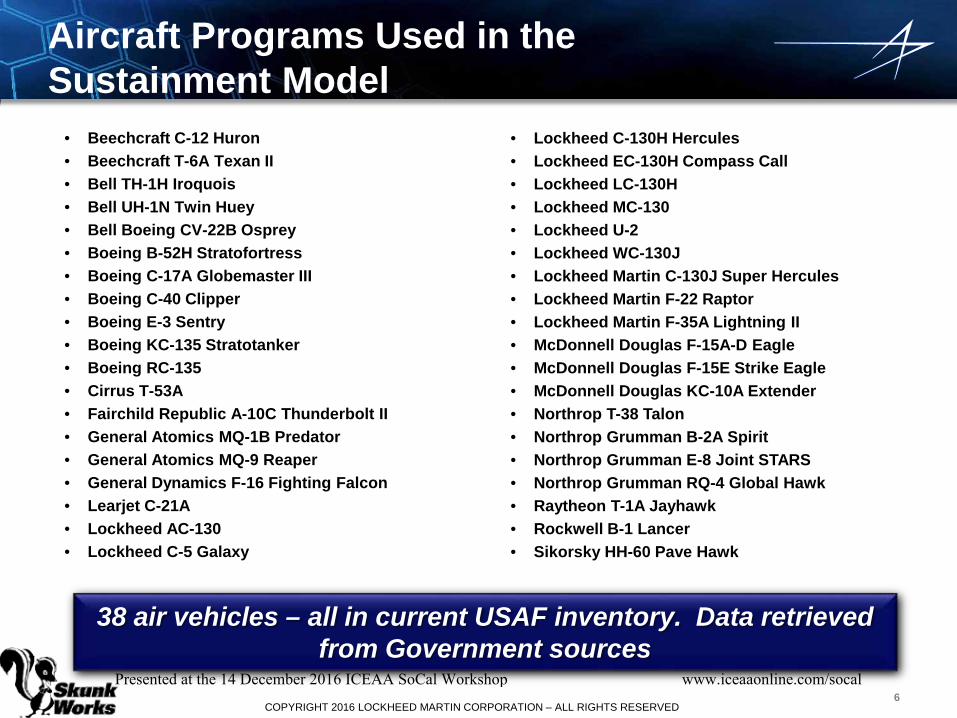
• Beechcraft C-12 Huron• Beechcraft T-6A Texan II• Bell TH-1H Iroquois• Bell UH-1N Twin Huey• Bell Boeing CV-22B Osprey• Boeing B-52H Stratofortress• Boeing C-17A Globemaster III• Boeing C-40 Clipper• Boeing E-3 Sentry• Boeing KC-135 Stratotanker• Boeing RC-135• Cirrus T-53A• Fairchild Republic A-10C Thunderbolt II• General Atomics MQ-1B Predator• General Atomics MQ-9 Reaper• General Dynamics F-16 Fighting Falcon• Learjet C-21A• Lockheed AC-130• Lockheed C-5 Galaxy
• Lockheed C-130H Hercules• Lockheed EC-130H Compass Call• Lockheed LC-130H• Lockheed MC-130• Lockheed U-2• Lockheed WC-130J• Lockheed Martin C-130J Super Hercules• Lockheed Martin F-22 Raptor• Lockheed Martin F-35A Lightning II• McDonnell Douglas F-15A-D Eagle• McDonnell Douglas F-15E Strike Eagle• McDonnell Douglas KC-10A Extender• Northrop T-38 Talon• Northrop Grumman B-2A Spirit• Northrop Grumman E-8 Joint STARS• Northrop Grumman RQ-4 Global Hawk• Raytheon T-1A Jayhawk• Rockwell B-1 Lancer• Sikorsky HH-60 Pave Hawk
Aircraft Programs Used in the Sustainment Model
38 air vehicles – all in current USAF inventory. Data retrieved from Government sources
Presented at the 14 December 2016 ICEAA SoCal Workshop www.iceaaonline.com/socal
COPYRIGHT 2016 LOCKHEED MARTIN CORPORATION – ALL RIGHTS RESERVED7
Disposal Model
Disposal model CER equations are retrieved from the following Air Force Cost Analysis Agency-directed document:
Kaye, Mark F., Bruce R. Harmon, Alexander O. Gallo, and John E. MacCarthy. Predicting Disposal Costs for United States Air Force Aircraft (Presentation). Alexandria, Va.: Institute for Defense Analyses, 2015
Presentation may be downloaded from the following Defense Technical Information Center URL:
http://www.dtic.mil/dtic/tr/fulltext/u2/a617955.pdf
Presented at the 14 December 2016 ICEAA SoCal Workshop www.iceaaonline.com/socal
COPYRIGHT 2016 LOCKHEED MARTIN CORPORATION – ALL RIGHTS RESERVED8
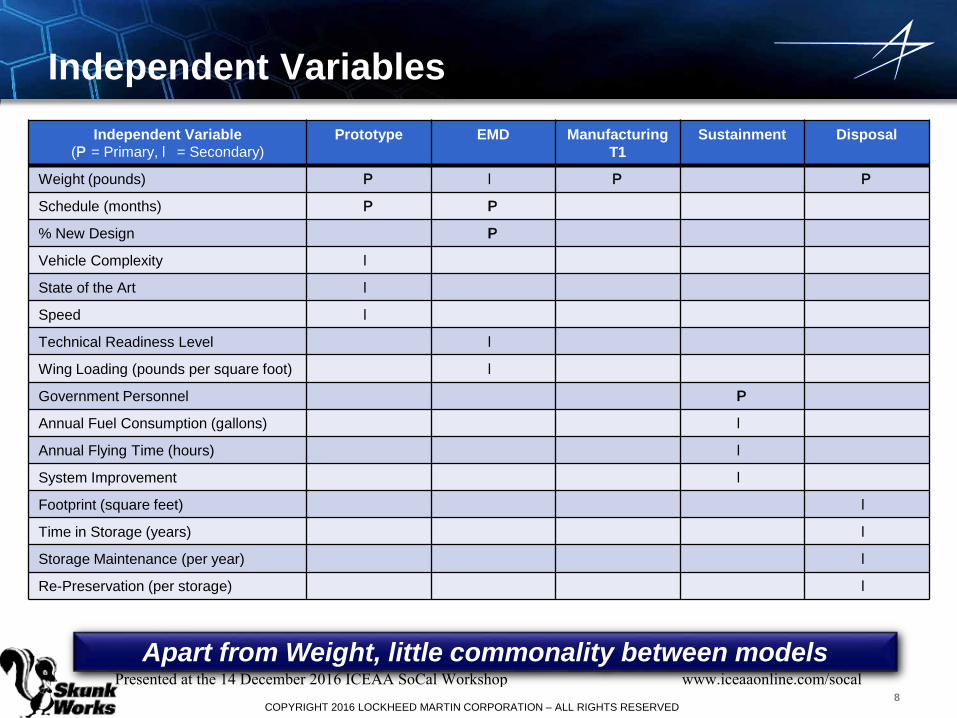
Independent VariablesIndependent Variable
(P = Primary, l = Secondary)Prototype EMD Manufacturing
T1Sustainment Disposal
Weight (pounds) P l P P
Schedule (months) P P
% New Design P
Vehicle Complexity l
State of the Art l
Speed l
Technical Readiness Level l
Wing Loading (pounds per square foot) l
Government Personnel P
Annual Fuel Consumption (gallons) l
Annual Flying Time (hours) l
System Improvement l
Footprint (square feet) l
Time in Storage (years) l
Storage Maintenance (per year) l
Re-Preservation (per storage) l
Apart from Weight, little commonality between modelsPresented at the 14 December 2016 ICEAA SoCal Workshop www.iceaaonline.com/socal
COPYRIGHT 2016 LOCKHEED MARTIN CORPORATION – ALL RIGHTS RESERVED9
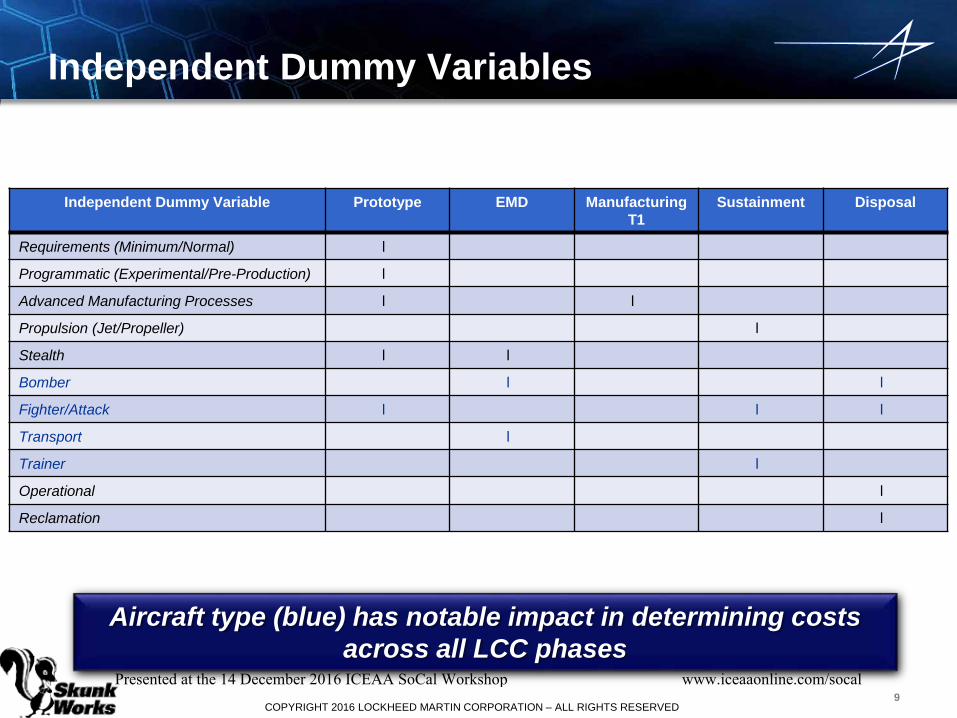
Independent Dummy Variables
Independent Dummy Variable Prototype EMD Manufacturing T1
Sustainment Disposal
Requirements (Minimum/Normal) l
Programmatic (Experimental/Pre-Production) l
Advanced Manufacturing Processes l l
Propulsion (Jet/Propeller) l
Stealth l l
Bomber l l
Fighter/Attack l l l
Transport l
Trainer l
Operational l
Reclamation l
Aircraft type (blue) has notable impact in determining costs across all LCC phases
Presented at the 14 December 2016 ICEAA SoCal Workshop www.iceaaonline.com/socal

COPYRIGHT 2016 LOCKHEED MARTIN CORPORATION – ALL RIGHTS RESERVED10
Models Statistics
Item Prototype EMD Manufacturing T1 Sustainment Disposal
Number of Observations 24 13 54 38 14
Years of First Flight Range 1944 – 2009 1955 – 2006 1939 – 2009 1952 – 2011
Aircraft Types 5 3 5 8 4
Empty Weight Range (pounds) 880 – 124,306 12,139 – 316,149 4,360 – 380,000 1,130 – 380,000 4k – 325k
Schedule Length (months) 14 – 60 51 – 173
Goodness of Fit Range (r2) 0.62 – 0.96 0.80 – 0.97 0.82 – 0.98 * 0.68 – 0.89
Goodness of Fit (median CER equation r2) 0.84 0.90 0.97 0.94 0.87
Accuracy-Bias (prediction under/over actual) 10 under / 14 over 6 under / 7 over 30 under / 24 over 21 under / 17 over
Accuracy-Error (median observation error from 0) +1.4% +0.4% -2.7% -3.5%
Precision (1/2 of predictions are within…of actual) 16.7% 8.5% 13.2% 18.3%
Precision (3/4 of predictions are within…of actual) 20.3% 25.2% 21.7% 29.7%
Good fit, accurate, usually rough order-of-magnitude precise
*applies to 4 of 6 cost element structure items (90% of total sustainment cost); non-statistically-derived equations are used for the remaining two elements
Presented at the 14 December 2016 ICEAA SoCal Workshop www.iceaaonline.com/socal
COPYRIGHT 2016 LOCKHEED MARTIN CORPORATION – ALL RIGHTS RESERVED11
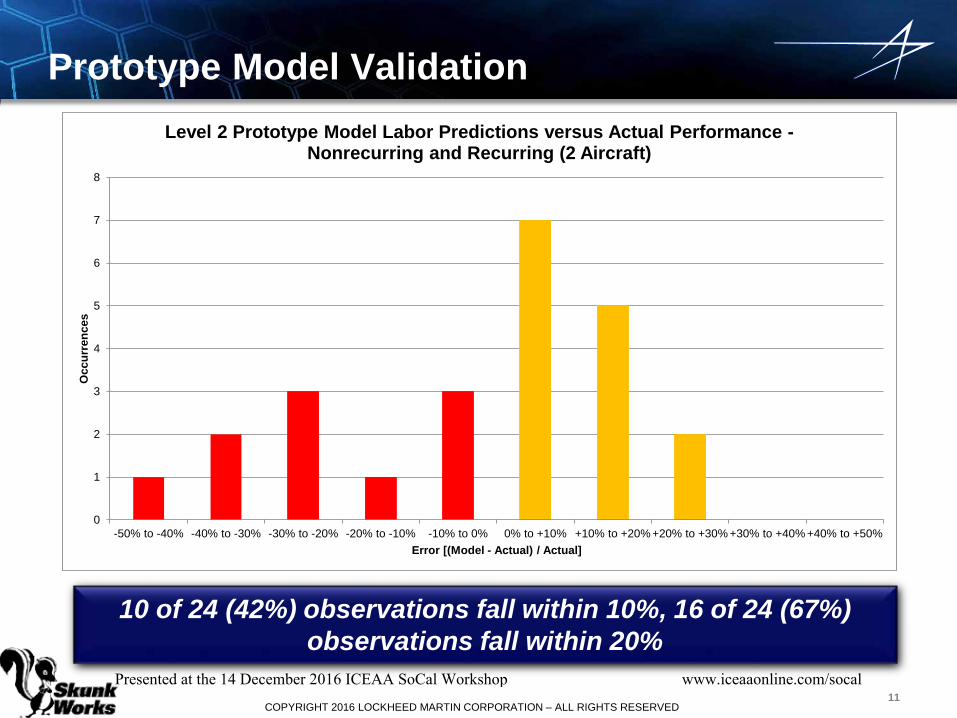
Prototype Model Validation
0
1
2
3
4
5
6
7
8
-50% to -40% -40% to -30% -30% to -20% -20% to -10% -10% to 0% 0% to +10% +10% to +20% +20% to +30% +30% to +40% +40% to +50%
Occ
urre
nces
Error [(Model - Actual) / Actual]
Level 2 Prototype Model Labor Predictions versus Actual Performance -Nonrecurring and Recurring (2 Aircraft)
10 of 24 (42%) observations fall within 10%, 16 of 24 (67%) observations fall within 20%
Presented at the 14 December 2016 ICEAA SoCal Workshop www.iceaaonline.com/socal
COPYRIGHT 2016 LOCKHEED MARTIN CORPORATION – ALL RIGHTS RESERVED12
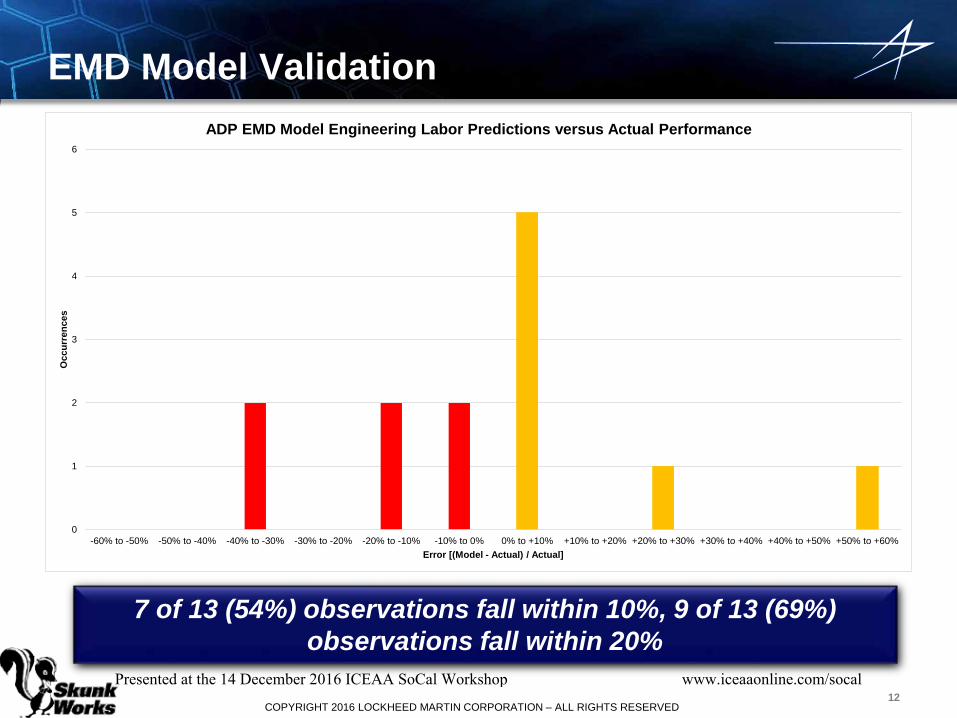
7 of 13 (54%) observations fall within 10%, 9 of 13 (69%) observations fall within 20%
EMD Model Validation
0
1
2
3
4
5
6
-60% to -50% -50% to -40% -40% to -30% -30% to -20% -20% to -10% -10% to 0% 0% to +10% +10% to +20% +20% to +30% +30% to +40% +40% to +50% +50% to +60%
Occ
urre
nces
Error [(Model - Actual) / Actual]
ADP EMD Model Engineering Labor Predictions versus Actual Performance
Presented at the 14 December 2016 ICEAA SoCal Workshop www.iceaaonline.com/socal
COPYRIGHT 2016 LOCKHEED MARTIN CORPORATION – ALL RIGHTS RESERVED13
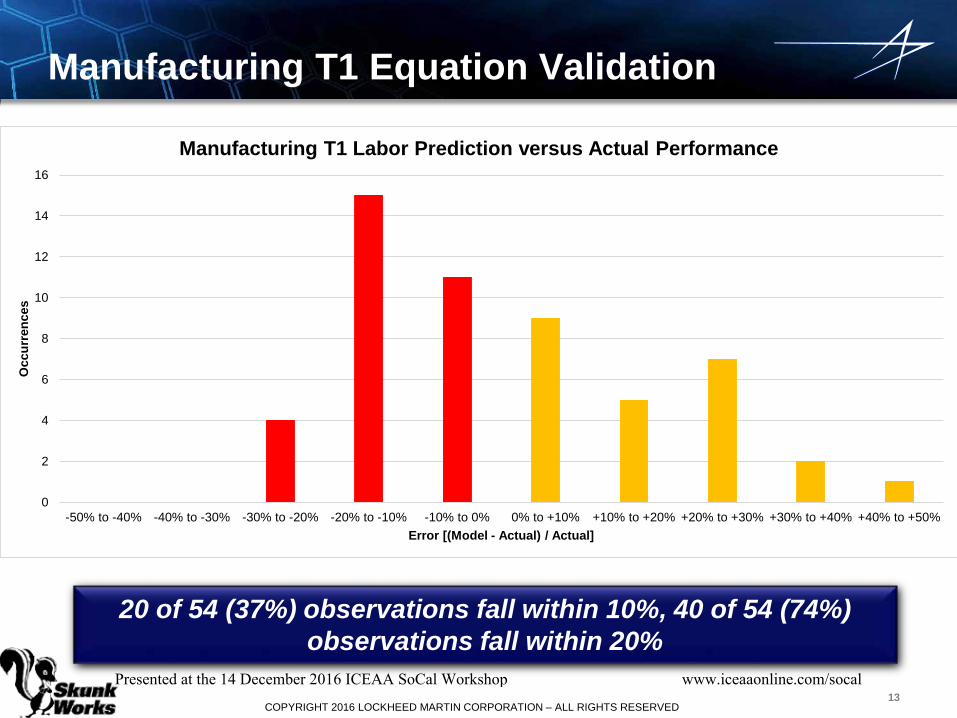
20 of 54 (37%) observations fall within 10%, 40 of 54 (74%) observations fall within 20%
Manufacturing T1 Equation Validation
0
2
4
6
8
10
12
14
16
-50% to -40% -40% to -30% -30% to -20% -20% to -10% -10% to 0% 0% to +10% +10% to +20% +20% to +30% +30% to +40% +40% to +50%
Occ
urre
nces
Error [(Model - Actual) / Actual]
Manufacturing T1 Labor Prediction versus Actual Performance
Presented at the 14 December 2016 ICEAA SoCal Workshop www.iceaaonline.com/socal
COPYRIGHT 2016 LOCKHEED MARTIN CORPORATION – ALL RIGHTS RESERVED14
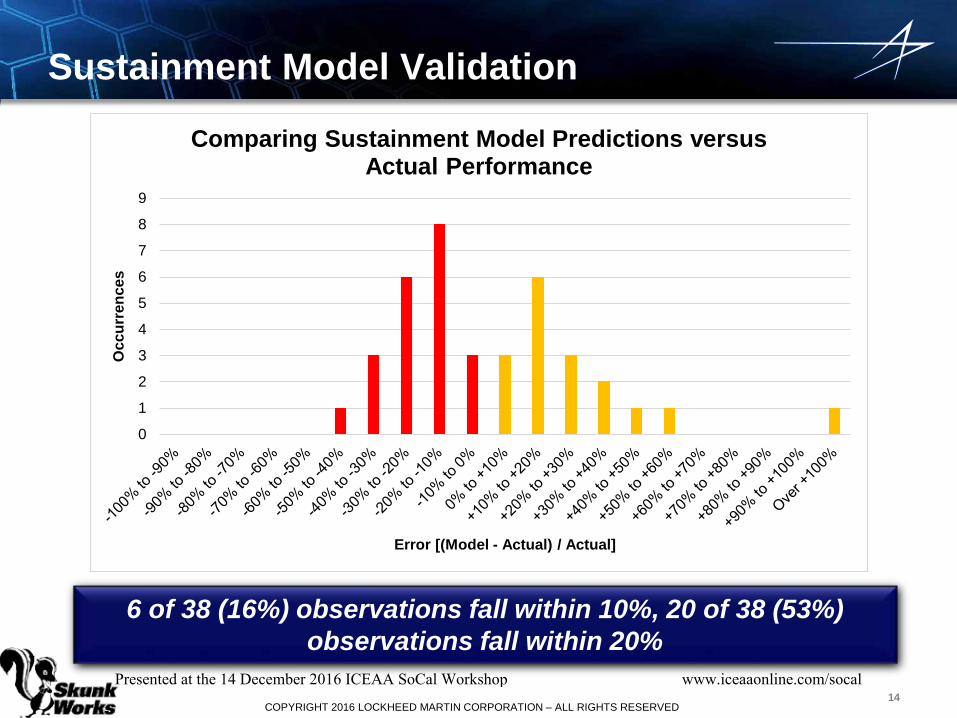
6 of 38 (16%) observations fall within 10%, 20 of 38 (53%) observations fall within 20%
Sustainment Model Validation
0
1
2
3
4
5
6
7
8
9
Occ
urre
nces
Error [(Model - Actual) / Actual]
Comparing Sustainment Model Predictions versus Actual Performance
Presented at the 14 December 2016 ICEAA SoCal Workshop www.iceaaonline.com/socal

COPYRIGHT 2016 LOCKHEED MARTIN CORPORATION – ALL RIGHTS RESERVED15
CalibrationThere are instances where the model significantly under/over-predicts actual performance of an air vehicle program. This becomes critical when we want to predict the cost of a program that is similar to the under/over-predicted program. To alleviate this problem, we introduce the concept of calibration into our prototype, EMD, and sustainment models
Regression line
Calibrated regression line
Proposal estimate
Calibrated proposal estimateComparisonprogram estimate
Weight
Cos
t
The scale of the analogous relationship is defined by the CER equationPresented at the 14 December 2016 ICEAA SoCal Workshop www.iceaaonline.com/socal

COPYRIGHT 2016 LOCKHEED MARTIN CORPORATION – ALL RIGHTS RESERVED16
The position map helps identify which, if any, of the programs the proposed item could be calibrated off of
Sample Position Map: “LM-21 BlueStar*”*…a fictionalized, 21st century, unitized composite fuselage version of the L-1011 TriStar
A/C
1
A/C
2
A/C
3 A/C
4A/
C 5
A/C
6
A/C
7
A/C
8A/
C 9
A/C
10
A/C
11
A/C
12
A/C
13
LM-2
1 Bl
ueSt
ar
0.00
0.50
1.00
1.50
2.00
2.50
3.00
0 20 40 60 80 100 120 140 160 180 200
EQU
IVAL
ENT
NEW
AIR
VEH
ICLE
DES
IGN
SPAN FROM MS-B/EMD TO IOC (MO)
Presented at the 14 December 2016 ICEAA SoCal Workshop www.iceaaonline.com/socal
COPYRIGHT 2016 LOCKHEED MARTIN CORPORATION – ALL RIGHTS RESERVED17
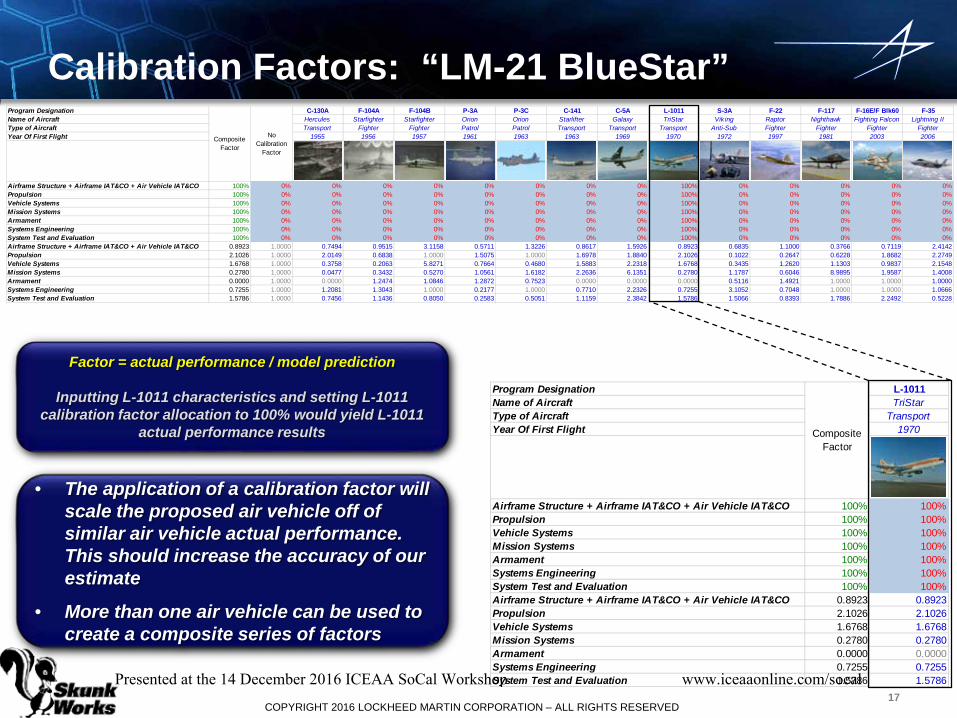
Calibration Factors: “LM-21 BlueStar”
Factor = actual performance / model prediction
Inputting L-1011 characteristics and setting L-1011 calibration factor allocation to 100% would yield L-1011
actual performance results
• The application of a calibration factor will scale the proposed air vehicle off of similar air vehicle actual performance. This should increase the accuracy of our estimate
• More than one air vehicle can be used to create a composite series of factors
Program Designation C-130A F-104A F-104B P-3A P-3C C-141 C-5A L-1011 S-3A F-22 F-117 F-16E/F Blk60 F-35Name of Aircraft Hercules Starfighter Starfighter Orion Orion Starlifter Galaxy TriStar Vik ing Raptor Nighthawk Fighting Falcon Lightning IIType of Aircraft Transport Fighter Fighter Patrol Patrol Transport Transport Transport Anti-Sub Fighter Fighter Fighter FighterYear Of First Flight 1955 1956 1957 1961 1963 1963 1969 1970 1972 1997 1981 2003 2006
Airframe Structure + Airframe IAT&CO + Air Vehicle IAT&CO 100% 0% 0% 0% 0% 0% 0% 0% 0% 100% 0% 0% 0% 0% 0%Propulsion 100% 0% 0% 0% 0% 0% 0% 0% 0% 100% 0% 0% 0% 0% 0%Vehicle Systems 100% 0% 0% 0% 0% 0% 0% 0% 0% 100% 0% 0% 0% 0% 0%Mission Systems 100% 0% 0% 0% 0% 0% 0% 0% 0% 100% 0% 0% 0% 0% 0%Armament 100% 0% 0% 0% 0% 0% 0% 0% 0% 100% 0% 0% 0% 0% 0%Systems Engineering 100% 0% 0% 0% 0% 0% 0% 0% 0% 100% 0% 0% 0% 0% 0%System Test and Evaluation 100% 0% 0% 0% 0% 0% 0% 0% 0% 100% 0% 0% 0% 0% 0%Airframe Structure + Airframe IAT&CO + Air Vehicle IAT&CO 0.8923 1.0000 0.7494 0.9515 3.1158 0.5711 1.3226 0.8617 1.5926 0.8923 0.6835 1.1000 0.3766 0.7119 2.4142Propulsion 2.1026 1.0000 2.0149 0.6838 1.0000 1.5075 1.0000 1.6978 1.8840 2.1026 0.1022 0.2647 0.6228 1.8682 2.2749Vehicle Systems 1.6768 1.0000 0.3758 0.2063 5.8271 0.7664 0.4680 1.5883 2.2318 1.6768 0.3435 1.2620 1.1303 0.9837 2.1548Mission Systems 0.2780 1.0000 0.0477 0.3432 0.5270 1.0561 1.6182 2.2636 6.1351 0.2780 1.1787 0.6046 8.9895 1.9587 1.4008Armament 0.0000 1.0000 0.0000 1.2474 1.0846 1.2872 0.7523 0.0000 0.0000 0.0000 0.5116 1.4921 1.0000 1.0000 1.0000Systems Engineering 0.7255 1.0000 1.2081 1.3043 1.0000 0.2177 1.0000 0.7710 2.2326 0.7255 3.1052 0.7048 1.0000 1.0000 1.0666System Test and Evaluation 1.5786 1.0000 0.7456 1.1436 0.8050 0.2583 0.5051 1.1159 2.3842 1.5786 1.5066 0.8393 1.7886 2.2492 0.5228
Composite Factor
No Calibration
Factor
Program Designation L-1011Name of Aircraft TriStarType of Aircraft TransportYear Of First Flight 1970
Airframe Structure + Airframe IAT&CO + Air Vehicle IAT&CO 100% 100%Propulsion 100% 100%Vehicle Systems 100% 100%Mission Systems 100% 100%Armament 100% 100%Systems Engineering 100% 100%System Test and Evaluation 100% 100%Airframe Structure + Airframe IAT&CO + Air Vehicle IAT&CO 0.8923 0.8923Propulsion 2.1026 2.1026Vehicle Systems 1.6768 1.6768Mission Systems 0.2780 0.2780Armament 0.0000 0.0000Systems Engineering 0.7255 0.7255System Test and Evaluation 1.5786 1.5786
Composite Factor
Presented at the 14 December 2016 ICEAA SoCal Workshop www.iceaaonline.com/socal

COPYRIGHT 2016 LOCKHEED MARTIN CORPORATION – ALL RIGHTS RESERVED18
Model Features
Item Prototype EMD Production Sustainment Disposal
MIL-STD-881C WBS Supplier Items P P *
CER Equation Coefficient as Model Input P P P P P
Parametrically Determined Schedule P
Calibration P P P
Schedule 2016 - 2025 2016 - 2024 2016 – 2044 50 years None
Total Cost Output (BY$) P P P P P
Cost Output by WBS Element Supplier Items P P P
Cost Output by Year (BY$) P P P
Cost Output by Year (TY$) P
Risk P P P P
Comparison Against Actual Performance P P P
*uses OSD cost element structure
Presented at the 14 December 2016 ICEAA SoCal Workshop www.iceaaonline.com/socal
COPYRIGHT 2016 LOCKHEED MARTIN CORPORATION – ALL RIGHTS RESERVED19
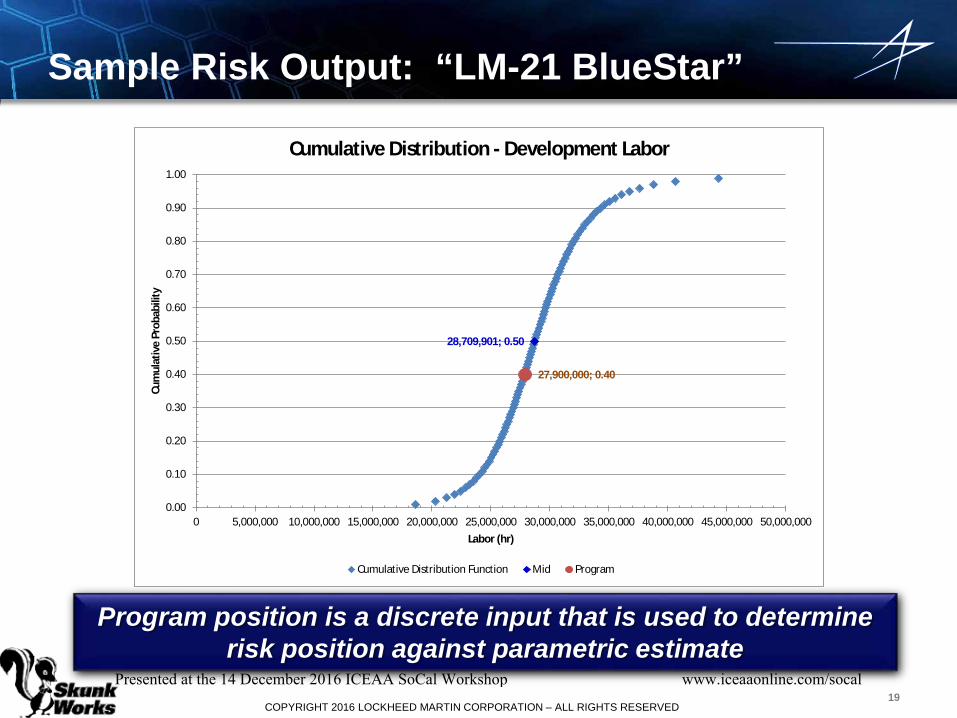
Sample Risk Output: “LM-21 BlueStar”
28,709,901; 0.50
27,900,000; 0.40
0.00
0.10
0.20
0.30
0.40
0.50
0.60
0.70
0.80
0.90
1.00
0 5,000,000 10,000,000 15,000,000 20,000,000 25,000,000 30,000,000 35,000,000 40,000,000 45,000,000 50,000,000
Cum
ulat
ive
Prob
abili
ty
Labor (hr)
Cumulative Distribution - Development Labor
Cumulative Distribution Function Mid Program
Program position is a discrete input that is used to determine risk position against parametric estimate
Presented at the 14 December 2016 ICEAA SoCal Workshop www.iceaaonline.com/socal

COPYRIGHT 2016 LOCKHEED MARTIN CORPORATION – ALL RIGHTS RESERVED20
Comparing “LM-21 BlueStar” Result Against Other Program Actual Performance
Separating Aircraft by Type and Program Phase Dramatically Improves Goodness of Fit Results (0.93 < r2 < 0.99)
Cos
t
Empty Weight
Prototype (except Supersonic Fighter Aircraft Prototype)Supersonic Fighter Aircraft Prototype/ACTDTransport Aircraft SDD/EMDSupersonic Fighter Aircraft SDD/EMDOther Aircraft ACTD/SDD/EMDLM-21 BlueStar
Presented at the 14 December 2016 ICEAA SoCal Workshop www.iceaaonline.com/socal

Presented at the 14 December 2016 ICEAA SoCal Workshop www.iceaaonline.com/socal